Article

Prediction of the Mine Water Inflow of Coal-Bearing Rock Series Based on Well Group Pumping

1
The Fourth Geological Exploration Institute of Henan Geology and Mineral Bureau, Zhengzhou 450001, China
2
School of Water and Environment, Chang’an University, Xi’an 710054, China
*
Authors to whom correspondence should be addressed.
Water 2023, 15(20), 3680; https://doi.org/10.3390/w15203680
Submission received: 11 September 2023 / Revised: 9 October 2023 / Accepted: 18 October 2023 / Published: 20 October 2023
(This article belongs to the Special Issue Hydrological Simulation for Erosion and Infiltration)

Abstract

:
Previous scholarly investigations have mainly concentrated on examining water intake, particularly within the specific domain of coal mines. Nevertheless, the scholarly discourse lacks significant research on predicting water inflow in environments with complex multi-layer mineral distributions. The Yanlong mining area is a complex mine containing coal and bauxite. Forecasting the water inflow of bauxite deposits is crucial for designing mining drainage and formulating a mining plan in a coal-bearing rock series mining area. The water inflow on the roof and floor of bauxite was studied with various numerical simulation and analytical methods (such as the big well method). The hydrogeological conceptual and numerical model of the mining area was established by the MODFLOW module in Groundwater Modeling System (GMS (7.1)) software, and the measured groundwater level was identified and verified in the model. The results show that the model average values of R 2 , E n s , and PBIAS are 0.86, 0.81 and 2.71, respectively, indicating that the established numerical simulation model can accurately forecast water inflow into the aquifer. Taking No. XII orebody in the eastern Songshan Mining area as an example, a virtual well group consisting of 12 wells was set up, and the numerical model forecast a water inflow of 71,500 m3/d from the Taiyuan Formation aquifer in the bauxite ore roof, which was lower than the value predicted by the large well method (72,786.66 m3/d). The numerical method predicted an average water inflow of 59,000 m3/d and a maximum water inflow of 82,600 m3/d from the Majiagou Formation in the bauxite ore floor. A dependence has been established that the numerical method estimates water inflow with accuracy. Additionally, the model predicts future mining water inflow, and also provides a standard framework for estimating inflow in similar mining conditions.

1. Introduction

The Henan Provincial Bureau of Geology and Mineral Resources has discovered a super-large sedimentary bauxite deposit in the deep part of the Yanlong Coalfield. It is a complex mining area that contains coal and bauxite, with bauxite as the main mineral and other minerals such as siderite, pyrite, and rhodochrosite. In light of the exploration data, it is predicted that there are still 160 million tons of potential bauxite resources within 700 m of depth. “Bauxite” is frequently employed to denote the ore mainly composed of tridiaspore and monodiaspore, major mineral elements. Bauxite is widely acknowledged as the principal resource of choice for the production of aluminum metal. The utilization of this substance is of utmost importance in numerous industrial domains, as it accounts for more than 90% of the worldwide production of bauxite. Bauxite is utilized as a metal commodity and a key resource for refractory, abrasive, and raw materials for high-aluminum cement. Moreover, it has the potential to be utilized across various sectors, including, but not limited to, paper production, water treatment, ceramic manufacturing, and petroleum processing.
Studying the water inflow of the bauxite deposit provides a theoretical basis for later bauxite mining, so it is of vital practical significance to predict the water inflow of the deposit using mathematical methods. China has scarce mineral resources, and water inrush accidents caused by mining activities frequently occur, posing a grave menace to people’s lives and property, and baffling the evolution of the mining industry [1,2]. Therefore, predicting the water inflow of mines is essential for ensuring safe mining production [3].
Two predominant approaches are commonly employed within global water inflow research: empirical and mechanistic. The water balance method, analytical method [4], and numerical simulation method [5] belong to the mechanistic methods. In contrast, methods such as mathematical statistical analysis [6,7], the hydrogeological analogy method [8], the grey system method [9,10], and the artificial neural network method belong to the empirical methods [11]. The hydrogeological analogy method estimates the water inflow of a newly designed mine on the basis of the data of mines with similar geological and hydrogeological conditions and the same mining methods [12]. The analytical method generalizes the regional hydrogeological conditions and selects corresponding formulas to predict the water inflow [13]. The grey system method requires long sequences of water inflow data to prognose future water inflow [14], while the artificial neural network method uses a black-box model to simulate and forecast the water inflow of mines based on parameters that correlate with the water inflow [15]. Empirical methodologies and fundamental mechanistic approaches are commonly employed in the early stages of research endeavors.
With the further study of mine water inflow, the numerical simulation method is usually used [16,17]. A numerical model was used to simulate groundwater flow using MODFLOW in Andhra Pradesh, India [18]. The BROOK90 hydrological model is utilized in Western Ukraine for the inverse determination of groundwater inflow through water balance simulations [19]. By building a three-dimensional unsteady flow numerical simulation model of groundwater inflow in the Bayanao mine field in Ordos, the water inflow was simulated and predicted when the groundwater level of the working plane was dropped to the bottom of the second coal seam [20]. Numerical simulation, analogy and large well (analytical) methods were employed to predict the Pingdingshan No. 10 coal mine water inflow. The analogy method is the most exact, but the conditions are strict, and the numerical method has higher accuracy than the large well method [21]. Similarly, numerical simulation and the large well method were employed to predict the water inflow of the Pangpangta coalfield in Shanxi Province, showing that the exactitude of the numerical method is higher than that of the large well method [22]. The possible factors causing water inrush are analyzed through numerical simulation of underground water flow [23]. Based on PHASE-2D software, the water inflow of the western coal aquifer is analyzed under different influencing factors and the main influencing factors of water inrush are identified [24]. These studies are on the water inflow and water inrush accidents of coal mines, but there are few reports on the water inflow of bauxite mines. The studies of the water inflow in tunnels are also reported [25,26]. Groundwater inflow into Karaj Water Conveyance (KWC) in Northern Iran was estimated using analytical and numerical methods [27]. According to the data above, researchers frequently use numerical and analytical methods to examine water influx in ore bodies or tunnels. The groundwater flow process in our study area’s target layer is intricate. When mining this layer, we must consider water accumulating in the tunnel within the upper coal-bearing strata and potential water influx from lower karst fissures. The upper part of the target layer involves technical exploration to assess the feasibility of bauxite mining beneath the coal seam during coal mining operations [28]. Water inflow does not solely come from conventional aquifers but is also influenced by coal mining activities, making it challenging to accurately calculate water volumes in abandoned tunnels using standard methods. Employing numerical simulation calculations significantly enhances the reliability of our results. Beneath the target layer in our study area lies a karst aquifer with well-developed fissures. These fissures can cause substantial fluctuations in water inflow, and traditional empirical formula calculations struggle to depict this complex process accurately. To improve the precision of our descriptions, utilizing numerical simulations to characterize this water influx process is crucial for enhancing the reliability of our calculations [29].
The coal mining activities in the studied region, including bauxite reserves, have created goaf areas and aged kiln water. Based on the contextual information provided and the complex nature of the research domain, this work aims to predict the inflow of water within the bauxite layer. In order to achieve this objective, it is necessary to address the following tasks: (1) The present work aims to develop a numerical simulation model that encompasses the entirety of the study region. (2) The estimation of water inflow occurs in both the upper and lower layers of bauxite. The water inflow of bauxite is studied using a numerical method, and the groundwater level is reduced to the bottom height of the aquifer or the critical safe water level through well group pumping. Compared to predicting the water inflow of tunnels by generalizing their parameters, the well group pumping method has higher calculation accuracy because it finely divides the aquifer into a mesh grid, which is closer to the actual geological conditions and has a more significant reference value. The exploration methods of drilling, geophysical exploration, geochemical exploration, pumping test, and isotope analysis are adopted to investigate and analyze mining hydrogeological conditions. Numerical simulation is carried out based on GMS software. By arranging virtual well groups, the water flow of the bauxite roof and floor in the Yanlong mining area is predicted. The predicted results are compared with those of the large well method. The Songshan mining area is an eastern mining area rich in exploitable bauxite reserves. The mining company and the geological prospecting institute exploit this area jointly. Thus, taking No. XII orebody in the Songshan mining area as an example, the water inflow prediction provides an essential theoretical basis for the production design department to formulate mine drainage capacity and a dredging design scheme.

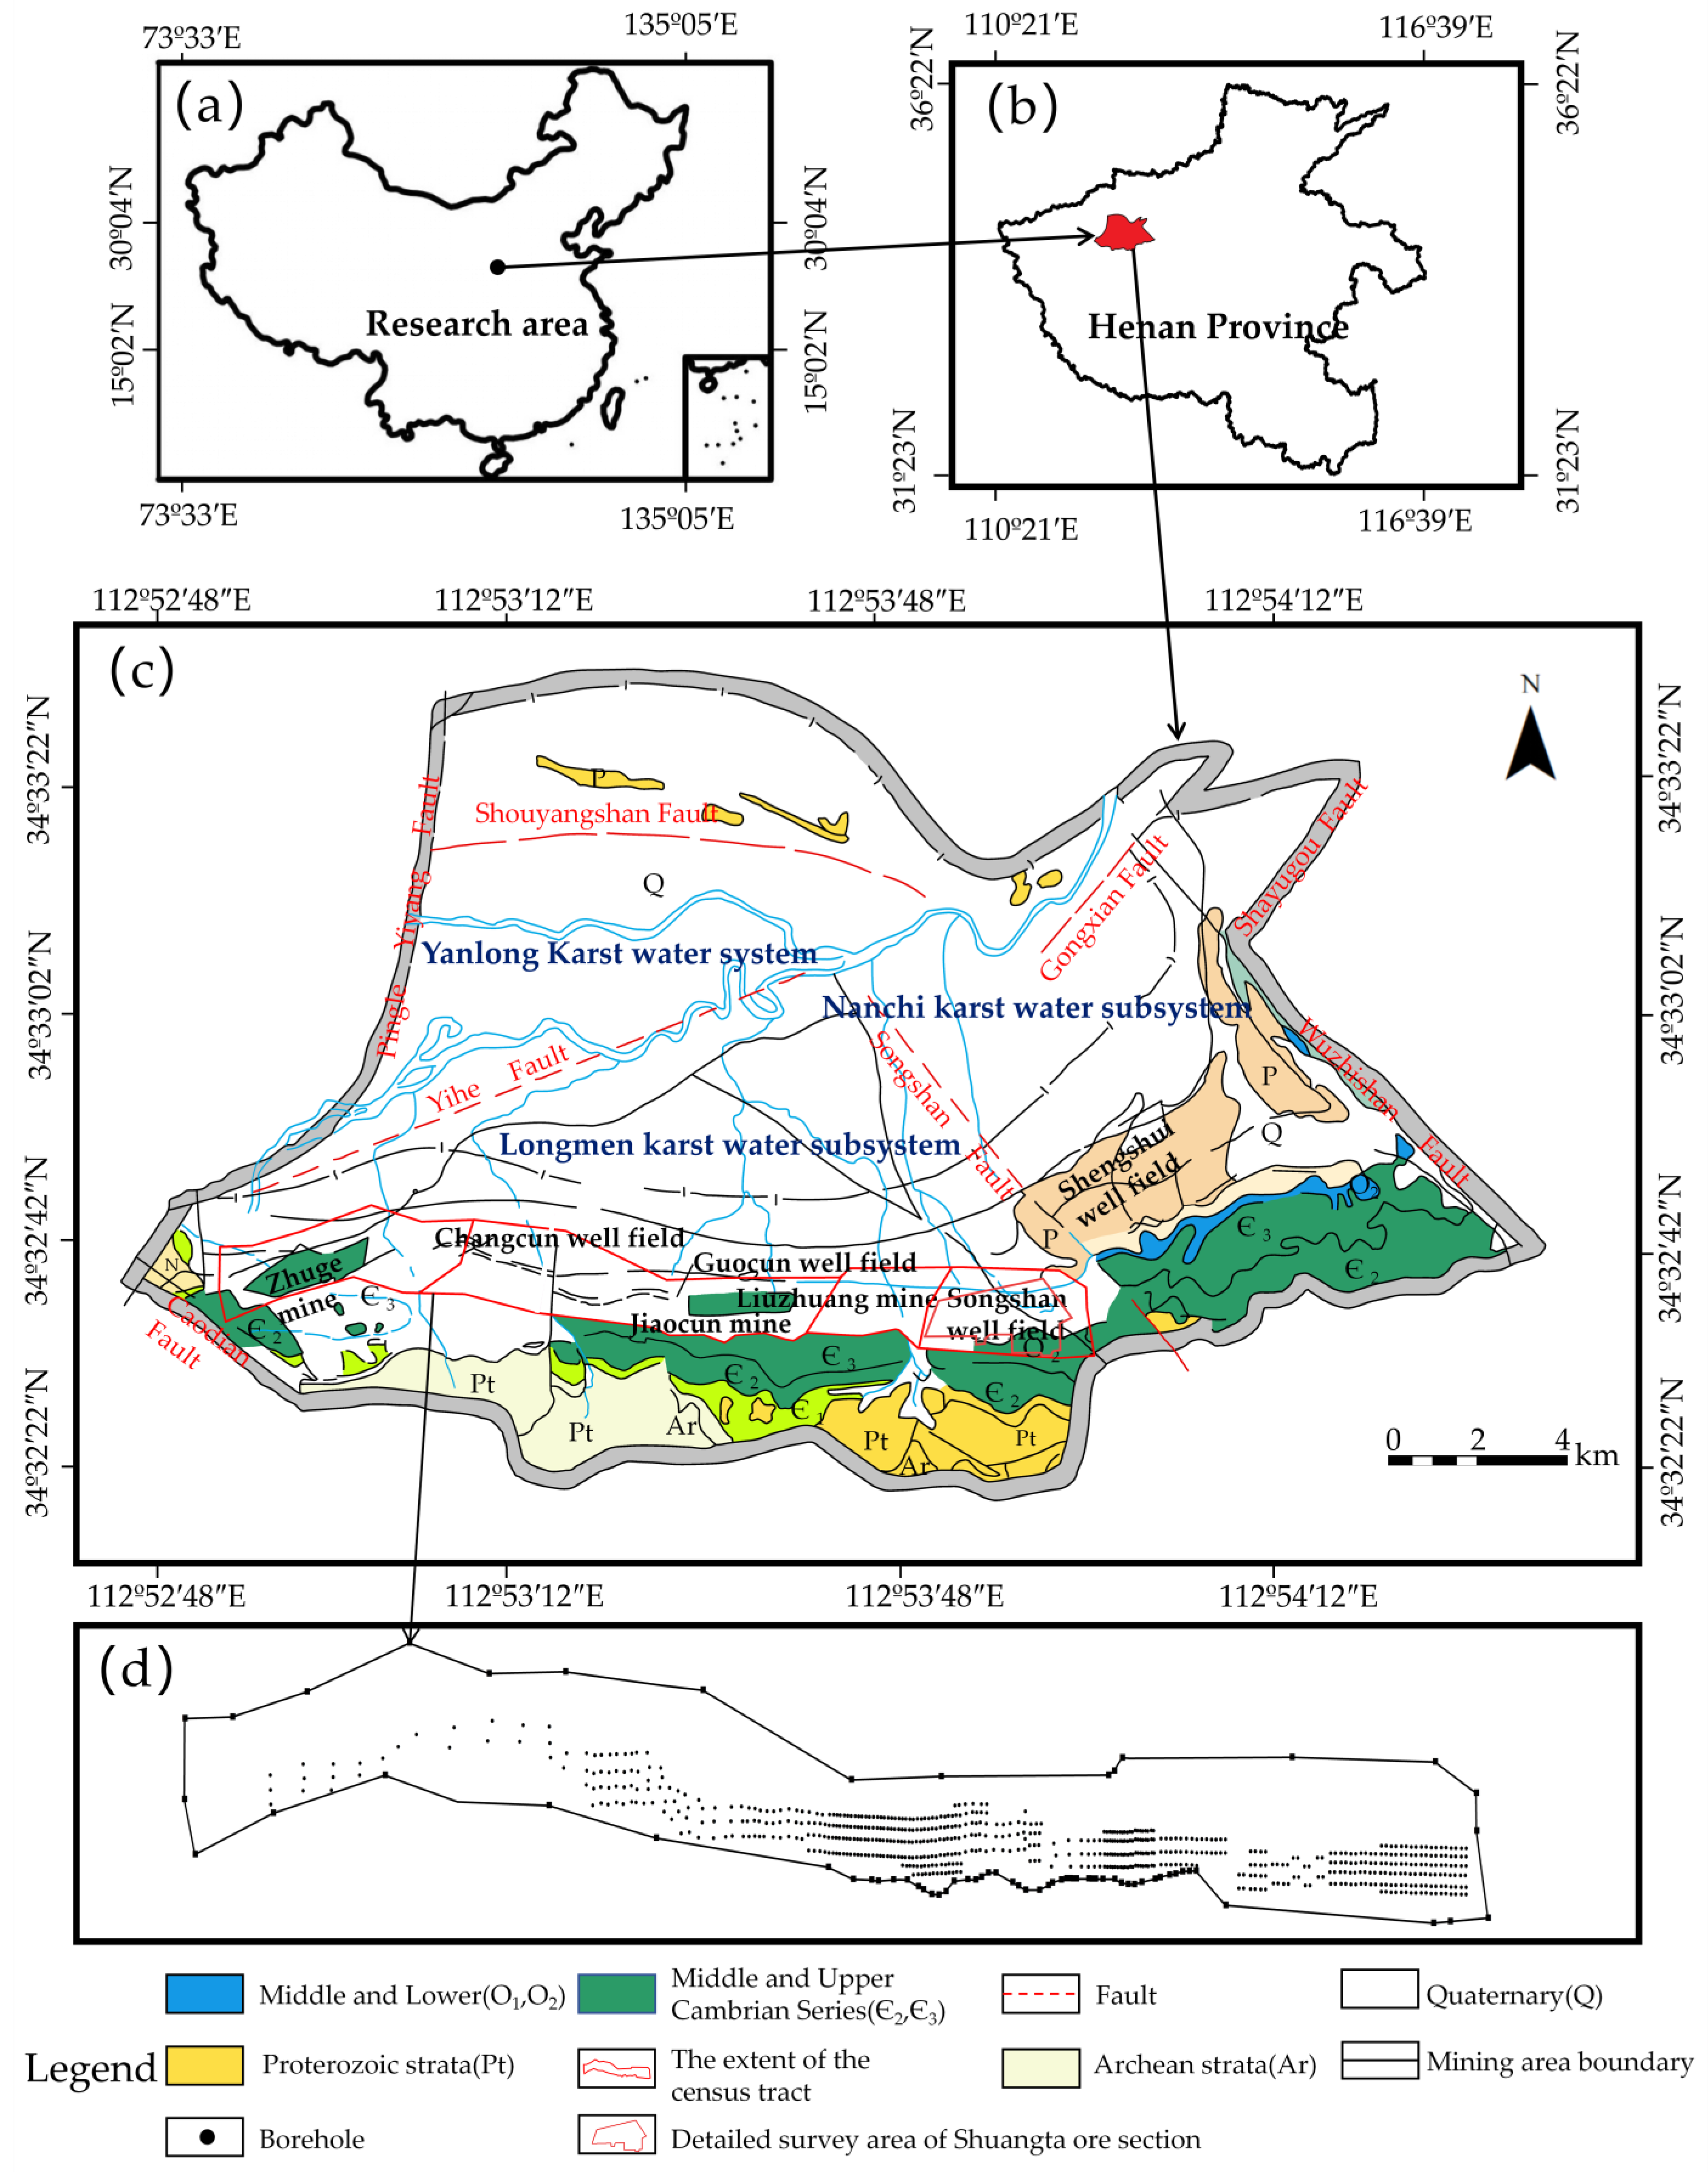
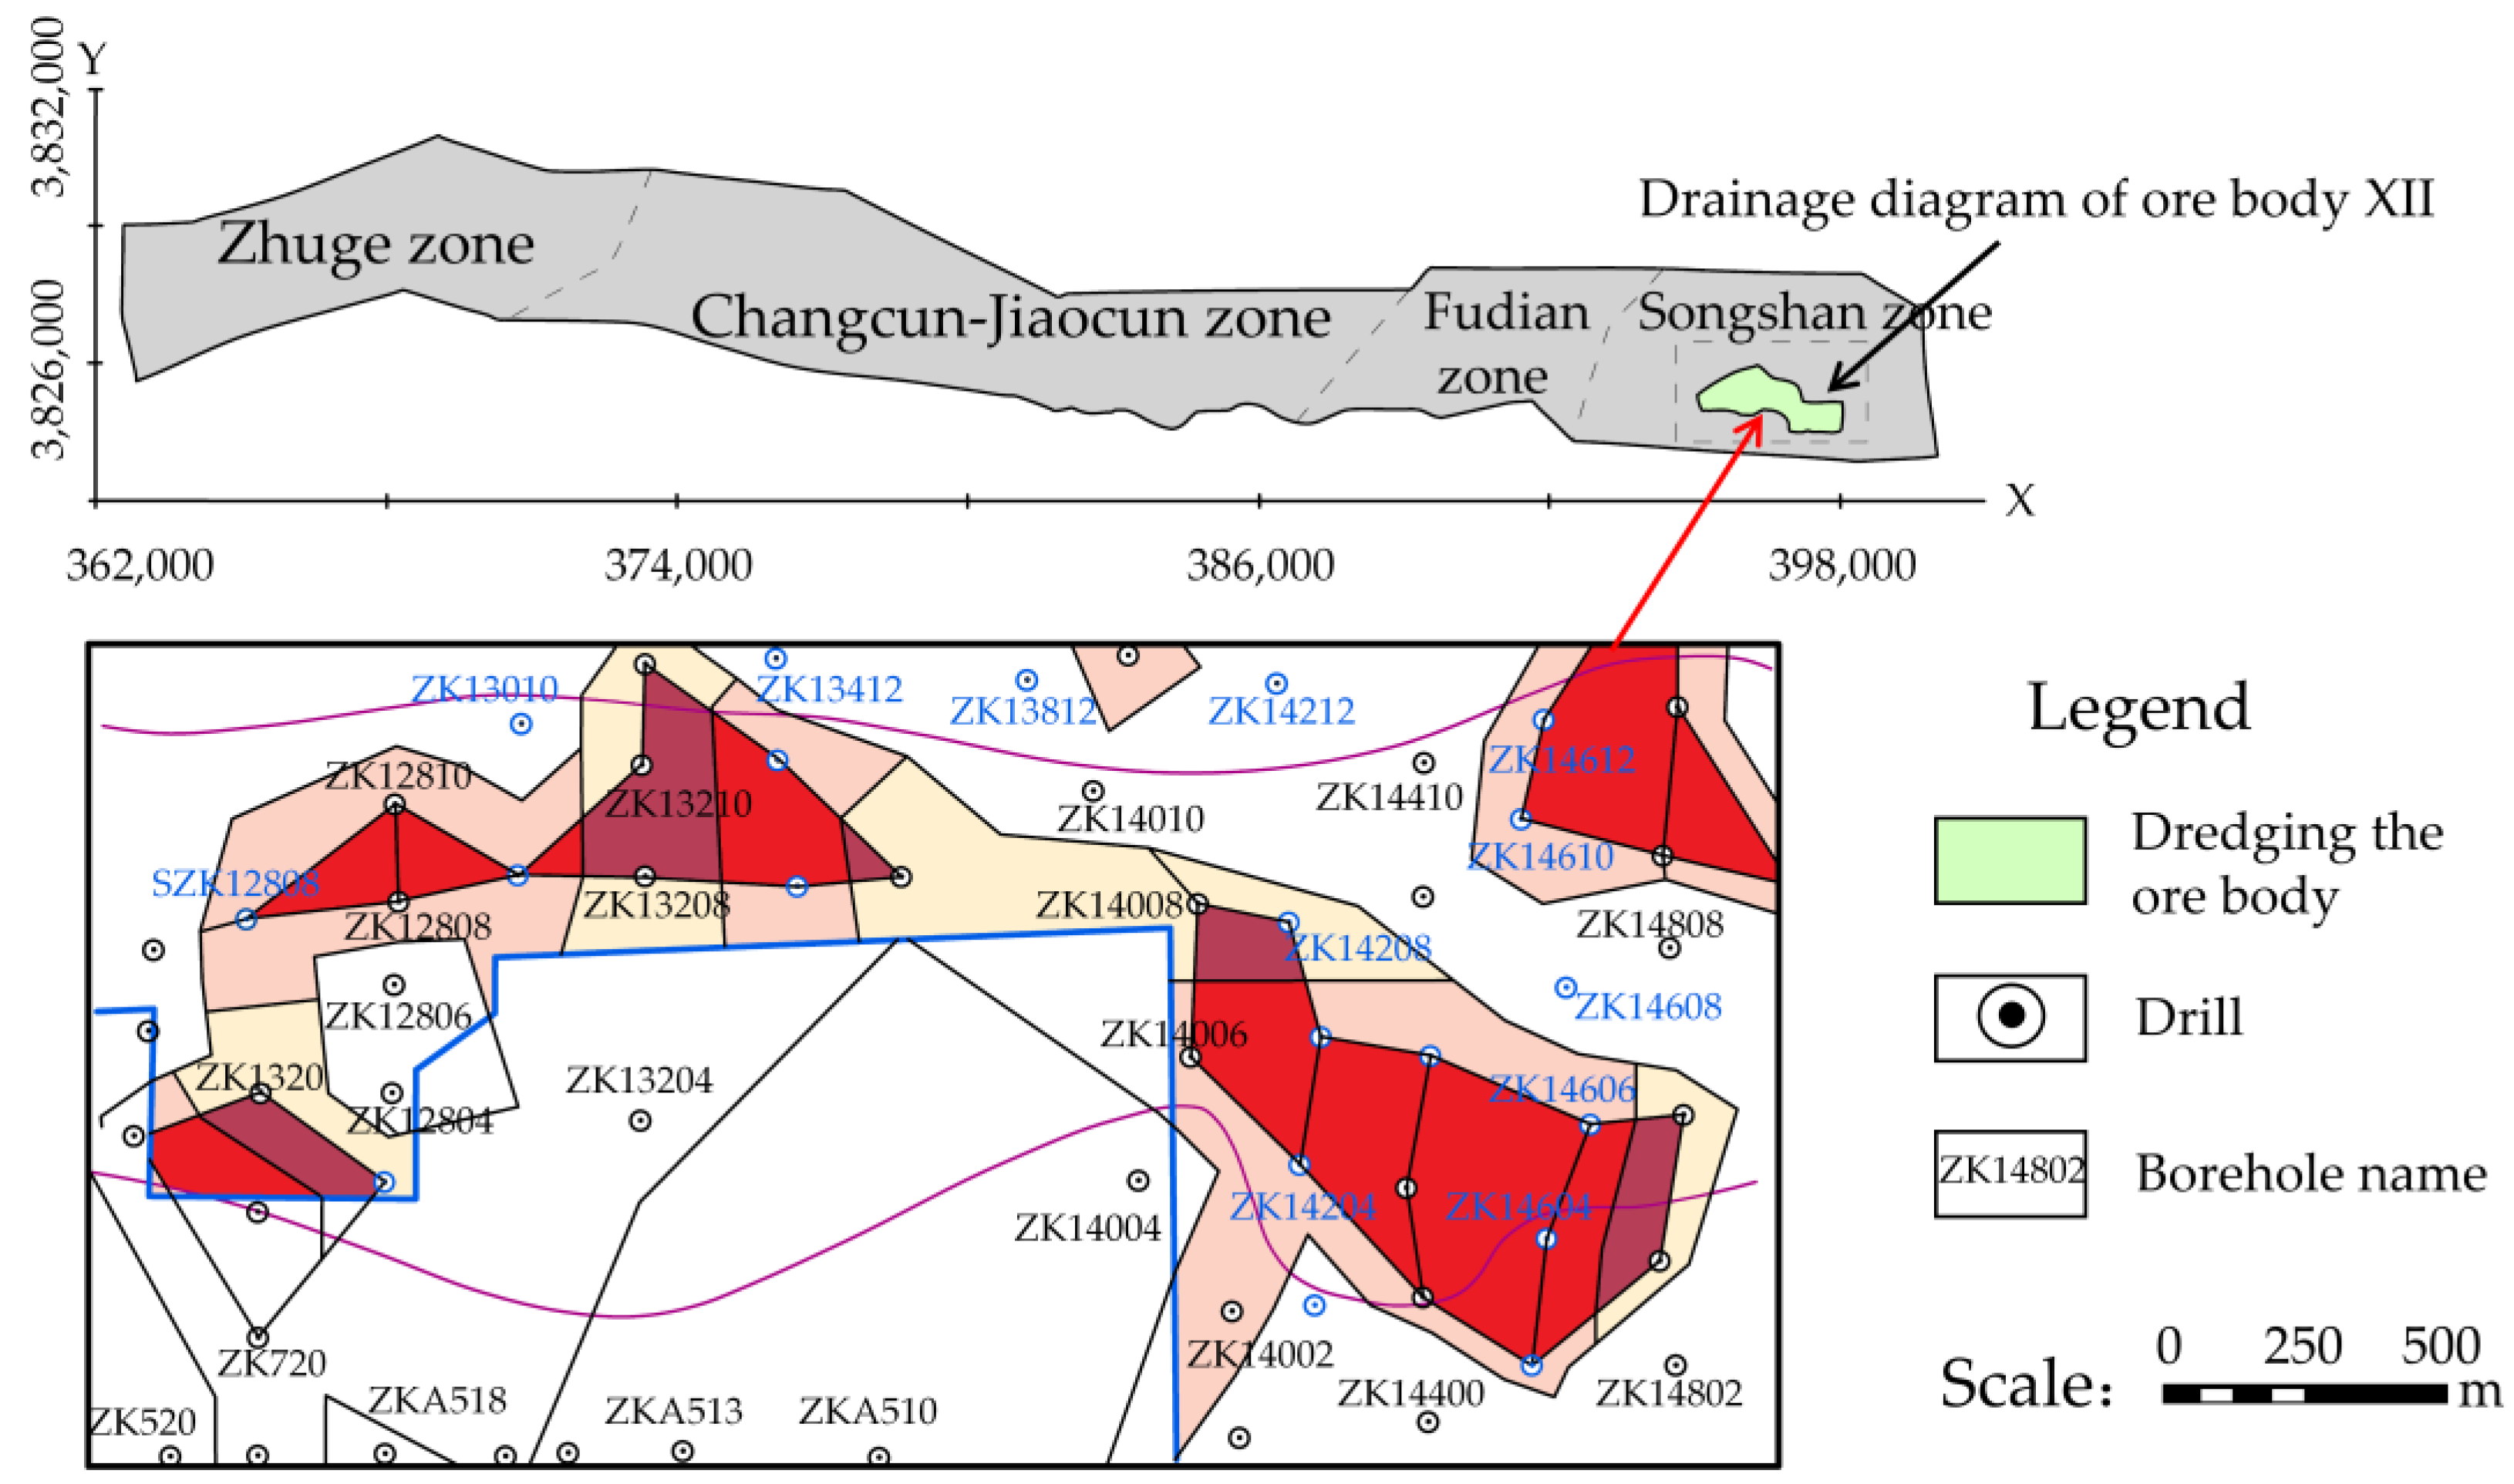
2. Overview of the Research Area

The Yanlong mining area (34°32′15″–34°33′36″ N, 112°52′40″–112°53′50″ E) is located in Luoyang, Henan Province. In the north are the first and second terraces of the Yiluo River in Luoyang Basin, while in the south is the middle and low mountainous area of the west section of Songshan Mountain Range. The topography is characterized by higher elevation in the south than in the north, as shown in Figure 1. The average precipitation in the mining area ranges from 550 to 900 mm, and the spatiotemporal rainfall distribution is uneven. The precipitation from June to September accounts for 57.5% to 61.1% of the annual precipitation, and mountainous areas receive more rainfall [30]. The mining area is located on the northern flank of the Songshan anticline, southeast of Luoyang Basin. The Songshan anticline controls the exposed strata and generally exhibits a gentle monoclinal structure. The mining area is principally characterized by concealed faults, with three sets of faults trending east–west, northeast–southwest, and northwest–southeast. These faults are regional in scale and large in size, with significant displacement and an extensive distribution.
The mining area hydrogeological unit is the Fuguangquan karst water subsystem within the Yanshi–Longmen karst water system. The southern boundary of the Yanshi–Longmen karst water system is marked by a watershed, which acts as both a surface water divide and an underground water divide in the axial part of the southern syncline. In the eastern and western parts, the boundary is formed by fault zones. The Wuziling fault in the eastern part exhibits compressional and wrenching properties, with the fault zone being filled with fault clay, providing good water-blocking characteristics. No hydraulic connection between the karst water on either side of the fault forms a water-blocking boundary in the eastern part of the system. The Caodian fault in the western part, affected by northwest-trending regional tectonic stress, has undergone sinistral strike–slip motion and behaves as a water-blocking fault with compressional and wrenching properties, forming a water-blocking boundary in the western part of the system. It acts as a water-blocking boundary in the northern part, where the carbonate rocks are buried at a depth greater than 1500 m. Therefore, four different boundaries make the Longmen karst water system relatively independent.
According to 265 points of borehole data (Figure 1), the mining area is divided into six layers (Figure 2). The middle Ordovician Majiagou Formation (O2m) comprises thick-bedded and dolomitic limestone. This layer is the bauxite deposit direct water-bearing floor in the Yanlong mining area. The karst forms in the boreholes are diverse, with a cave visibility rate of 15%, indicating uneven karst development. The hydrostatic pressure of the Ordovician limestone is relatively high. It can supply water to the limestone aquifer of the Taiyuan Formation through water-conducting faults and fractures, making it one of the factors affecting the water influx in the bauxite roof. The Carboniferous Benxi Formation (C2b) is the host layer of the bauxite deposit, with an average thickness of 12.3 m. It has an overall poor development of fractures and low water conductivity, serving as a vital aquiclude within the area. The Permian Taiyuan Formation (P1t) comprises thick-bedded argillaceous limestone, sandstone, and interbedded coal. The karst fractures are poorly developed and mostly filled with calcite veins. The formation can be divided into three sections, with the lower section of limestone serving as the direct water-bearing roof of the bauxite deposit. The Permian Shanxi Formation (P1s) consists of fine-grained sandstone, carbonaceous shale, and siltstone interbedded with coal. It has a large thickness, compact structure, and poor water permeability. This layer is the primary coal-bearing stratum, with the bottom coal seam (E2-1) being the central exploitable coal seam. The goaf is mainly distributed in this layer. The Permian Shihezi Formation (P1-2s) includes feldspar quartz sandstone, thick-bedded shale, and mudstone. The Quaternary and Neogene (Q + N) is extensively spread with a significant thickness on the mining area surface. It unconformably covers various bedrock formations. It mainly consists of slope deposits, alluvial deposits, and gravel layers, with interbedded clay layers. The thickness gradually increases from the southeast to the northwest. Only in the southern part does it directly come into contact with the Taiyuan Formation limestone and the Ordovician limestone, which has a replenishing relationship with the water-bearing layers of the roof and bottom of the ore deposit but has little impact on the water influx into the bauxite deposit.
On basis of the lithology and occurrence status of groundwater, the groundwater in the Yanlong mining area is classified into four basic types: porous water-bearing rocks in loose formations, porous-fractured water-bearing rocks in clastic rocks, carbonate rocks fractured-karst water-bearing rocks, and fractured water-bearing rocks in bedrock. Only a tiny amount of bedrock and limestone outcrop in the southern area, gradually submerging beneath the loose layers towards the north. The burial depth increases gradually to the north. In the Yihe area, a thick, loose layer of nearly a kilometer is formed due to river alluvium, with limestone buried at a depth greater than 1500 m. The porous water in loose formations is an important water supply source for bauxite flooding, mainly replenished by atmospheric precipitation infiltration, surface water leakage, irrigation water infiltration, and lateral inflow from groundwater. The drainage pathways include evaporation, mining drainage, northward outflow from the mining area, and downward replenishment to other aquifers. Isotope analysis shows that karst water is a mixture of old water (water from the 1940s to 1960s) and new water (recent atmospheric precipitation).

3. Research Methods

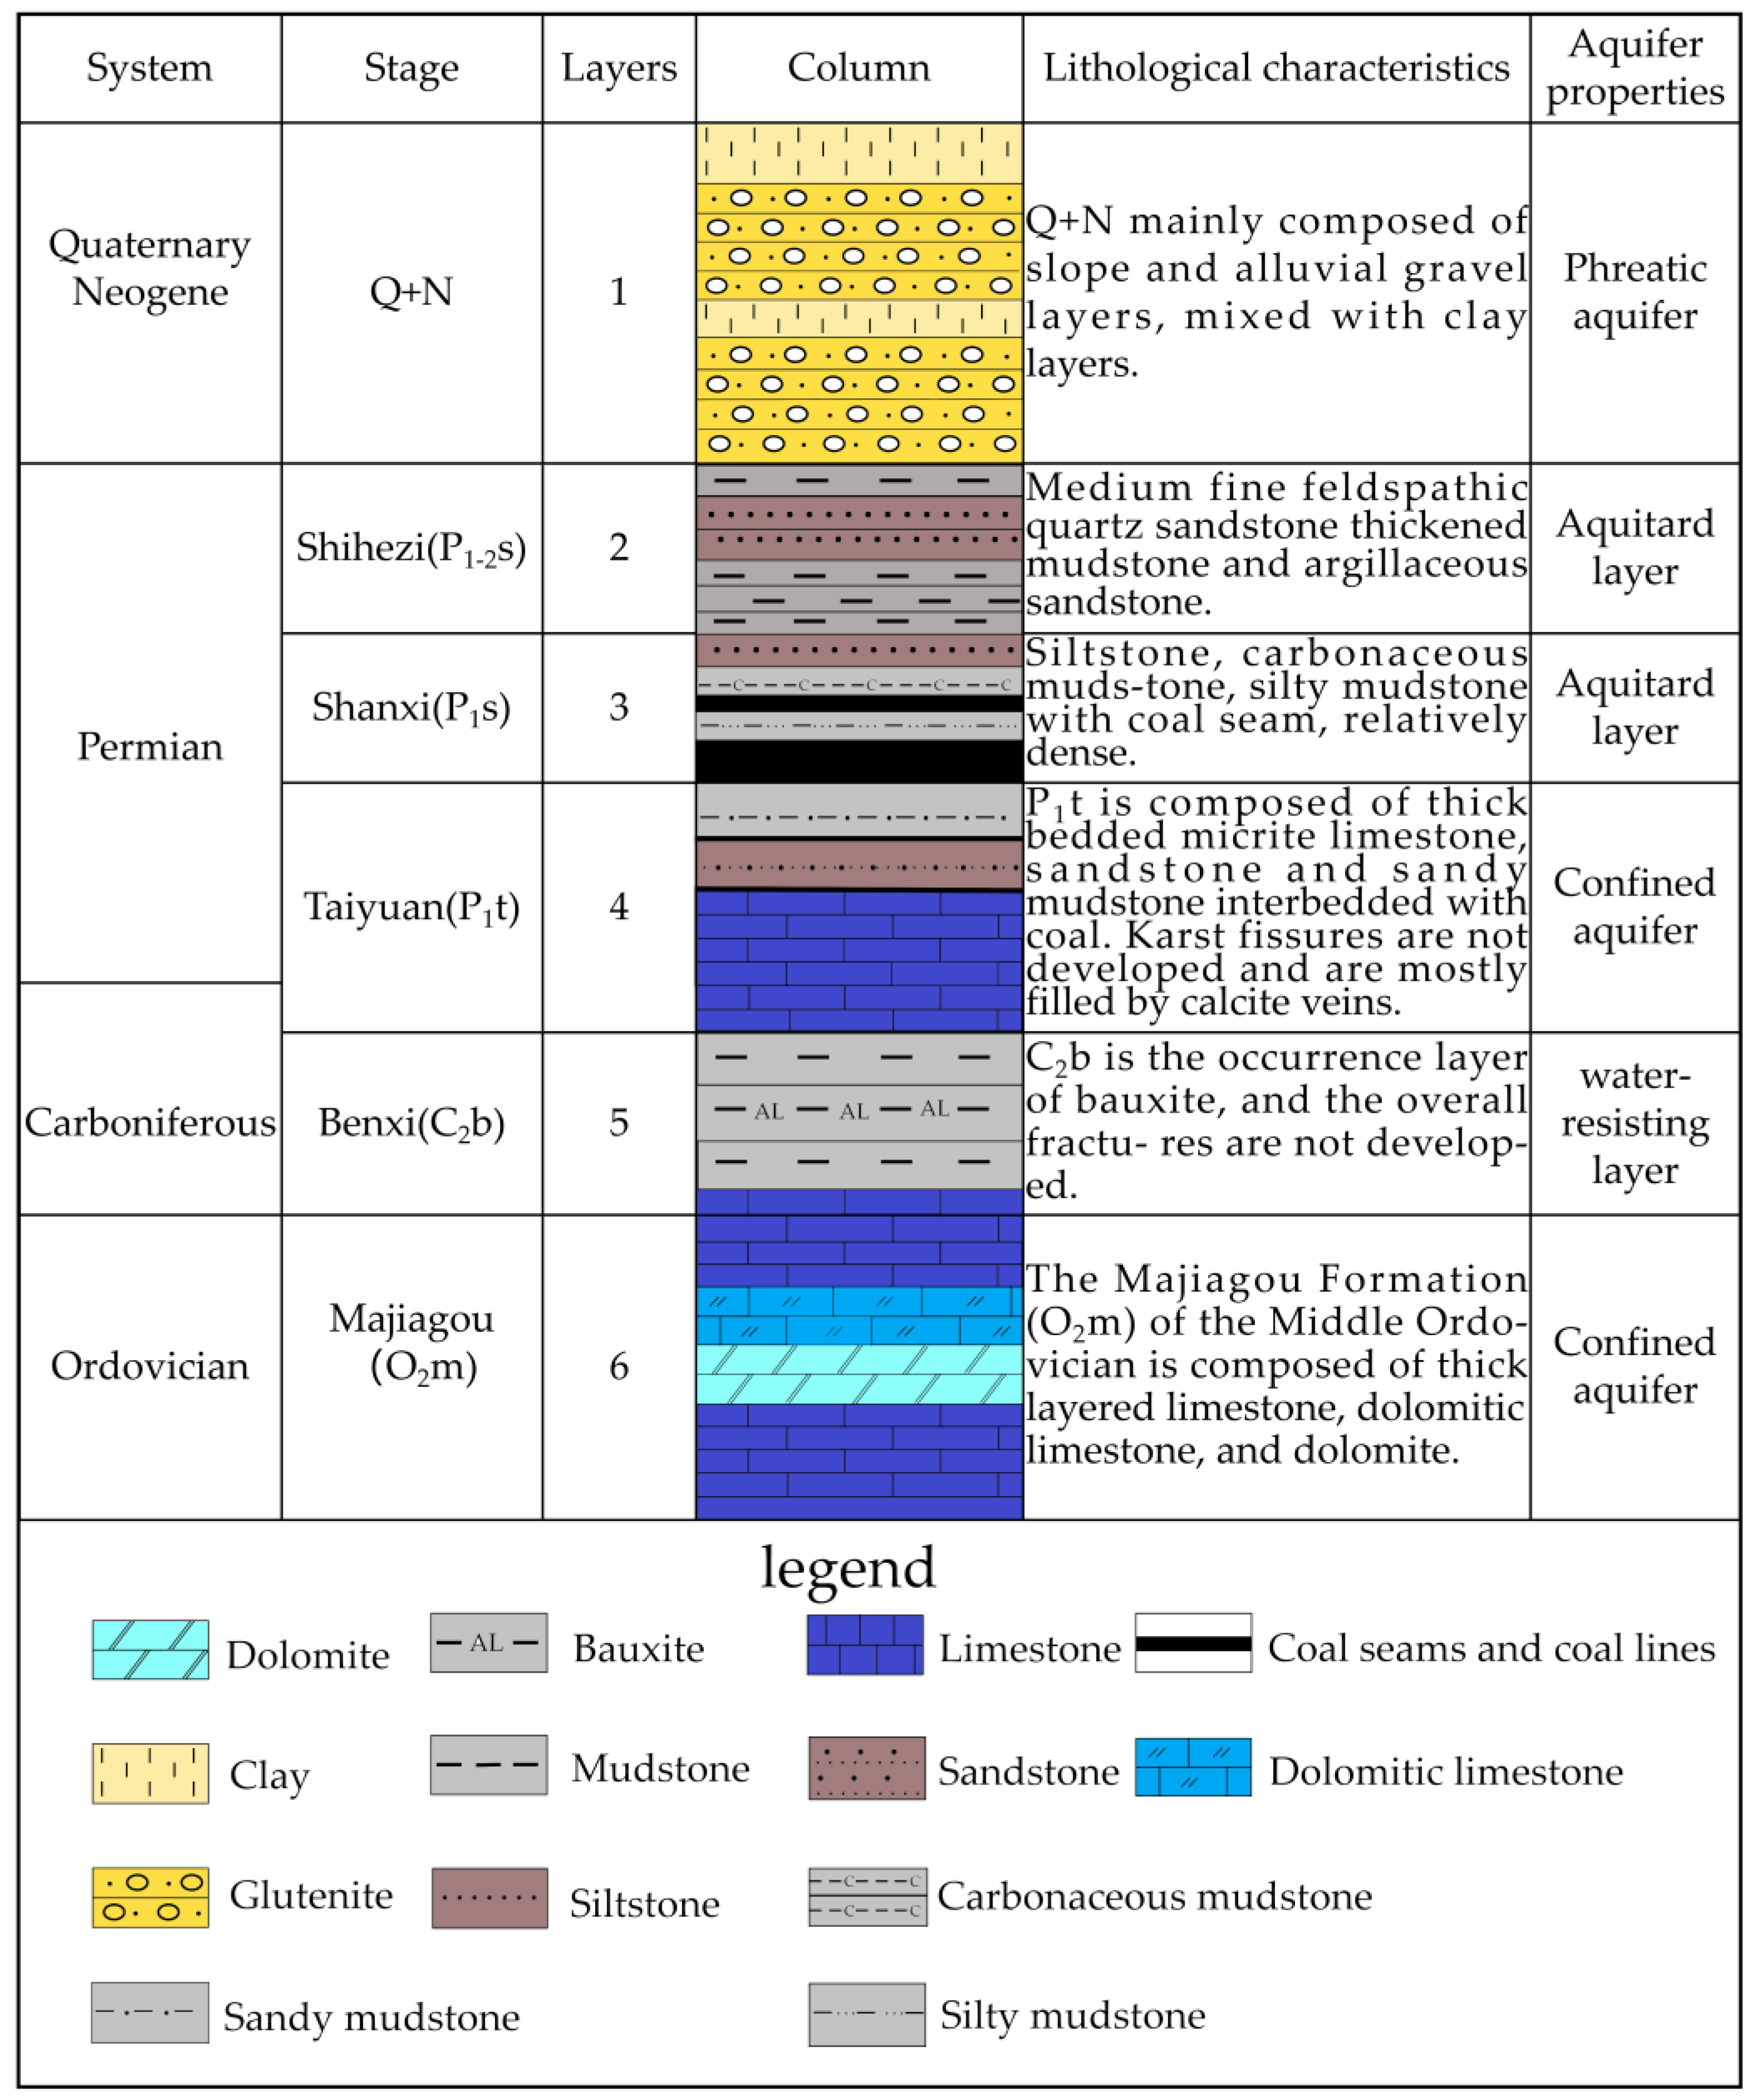
3.1. Establishment of Hydrogeological Conceptual Model

The Wuzhiling fault, the Caodian fault, and the Yihe fault bound the simulated area. It extends 1 km beyond the mining area to the south, with an approximate area of 288 km2, as shown in Figure 1d. The stratigraphy is generalized into six layers from youngest to oldest, namely the Quaternary and Neogene aquifer (Q + N), Permian Shihetanzi Formation low-permeability layer (P1-2s), Permian Shanxi Formation low-permeability layer (P1s), Permian Taiyuan Formation limestone confined aquifer (P1t), Carboniferous Benxi Formation aquiclude (C2b) (including the bauxite layer), and Ordovician Majiagou Formation limestone confined aquifer (O2m), as shown in Figure 2.
The groundwater system exhibits inherent interconnectivity with its surrounding environment, operating as a cohesive entity that perpetually interacts with its surroundings. As a result, modifications in the surrounding environment lead to modifications in the hydrological conditions inside the designated research region. Therefore, it is crucial to systematically construct boundary conditions that accurately represent the real-world characteristics of the study region. The faults on the eastern and western sides are defined as the aquitard boundaries, representing zero-flow boundaries. The model’s northern boundary is a fixed-head boundary based on nearby borehole water level data. The southern boundary is a flow boundary because of direct recharge from rainfall infiltrating the aquifer or runoff generated by rainfall. The model’s top boundary vertically represents the water table, which exchanges water with the external environment. The bottom boundary is generalized as the bottom boundary of the Majiagou Formation, representing an aquitard boundary.
Due to the different lithology, thickness, porosity, and degree of fracture development in different layers and regions within the Yanlong mining area, the permeability varies. The parameters change with space, reflecting the heterogeneity of the system. However, there is no apparent directionality. The input and output of the groundwater system vary with time and space, making the groundwater flow non-steady. The mining area is generalized into an inhomogeneous and isotropic three-dimensional unstable groundwater flow system.

3.2. Establishment of a Mathematical Model of Hydrogeology

The flow in the Yanlong area could be projected in both vertical and horizontal directions within the geological units. In groundwater flow, the various flow parameters vary with time and space. Based on Darcy’s law, the principles of seepage theory, and mass conservation law, the numerical model for three-dimensional non-steady groundwater flow in the study area is given by [31]
S s t = x ( K x x H x ) + y ( K y y H y ) + z ( K z z H z ) + ε , ( x , y , z ) Ω , t 0
μ h t = K x x ( H x ) 2 + K y y ( H y ) 2 + K z z ( H z ) 2 K z z H z + p , ( x , y , z ) Γ 0 , t 0
H ( x , y , z , t ) t = 0 = h 0 , ( x , y , z ) Ω , t 0
H ( x , y , z , t ) Γ 1 = H 1 ( x , y , z , t ) , ( x , y , z ) Γ 1 , t 0
K H n Γ 2 = q ( x , y , z , t ) , ( x , y , z ) Γ 2 , t 0
where H is the groundwater level (m); t is the time (d); h 0 is the initial groundwater level (m); H 1 is the water level at the aquifer boundary (m); K x x , K y y and K z z are the permeability coefficients (m/d); S s is the aquifer storage coefficient (1/m); μ is the gravity-specific yield in the phreatic aquifer (1/m); q is the flow through the unit area on the flow boundary; ε is the source–sink term in the aquifer (1/d); p is the source–sink term of the phreatic surface (m/d); Ω is the seepage zone; Γ 0 is the free surface of groundwater; Γ 1 is the water head boundary; Γ 2 is the flow boundary and n is the outer normal direction of the boundary.
GMS (7.1) software is taken to simulate groundwater flow by the MODFLOW module. The MODFLOW program is based on the finite difference method for solving the mathematical model of water flow.

3.3. Water Inflow Prediction Methods

The water inflow is predicted by combining analysis and numerical simulation in bauxite mining. The analytical method adopts the “large well method”. The basic principle is to treat the mining area as an equivalent “large well”. The groundwater forms a cone of depression around the “large well”, and when the inflow water reaches a steady state, the inflow water volume in the mine can be considered equivalent to that of the “large well”. In the case of mining using tunnelling methods, the irregular tunnels in the mining area are regarded as an ideal “large well” in operation. The area enclosed by the tunnelling system is considered equivalent to the “large well” area. The inflow water volume of the entire tunnelling system is then equivalent to the inflow water volume of the “large well”. The aquifer must be fully dewatered during mining, so the confined-to-unconfined water conversion formula is selected. The analytical formula for the large well method is as follows [32]:
Q = 1.336 K 2 H M M log R 0 / r 0
r 0 = F / π
R = 10 H π
R 0 = R + r 0
where Q is the water inflow of the mine (m3/d); K is the permeability coefficient of the aquifer (m/d); H is the water level reduction value (m); M is the thickness of aquifer (m); R is the influence radius (m); r 0 is the reference radius (m); F is the ore body area (m2); and R 0 is the reference influence radius of the large well (m).
The numerical simulation method involves calculating the inflow water volume by establishing a virtual well in the numerical model and pumping water from it. The water volume when the water level reaches a safe elevation, or the bottom of the aquifer in the virtual well, is considered the inflow water volume of the mine [18,23].

3.4. Establishing a Numerical Simulation Model of Yanlong Area

The hydrogeological conceptual model is generalized as isotropic in the horizontal direction, while the hydrogeological parameters vary across different layers in the vertical direction. The origin coordinates on the plane grid are X = 362,000.000 and Y = 3,823,500.000. The model is divided into 200 rows and 40 columns on the plane and 6 layers in the vertical direction. There are a total of 48,000 grid cells, with 27,227 active cells. The simulation period is chosen from 1 January 2017 to 31 May 2020, with one month representing one stress period and a time step of 1 day.
The survey, detailed investigation, and a steady-state pumping test were carried out. The hydrogeological parameters, such as the permeability coefficient of the Taiyuan and Majiagou formations, were calculated based on the pumping test data. Table 1 shows the permeability coefficients of limestone in the Taiyuan and Majiagou formations in the Yanlong mining area. The water level recovery method determines the gravity-specific yield (μ), calculated as 0.20. According to the borehole disclosure and geophysical data, the visible rate of karst caves is 15% in the Majiagou Formation, and the karst development is uneven. The karst fractures in the Taiyuan Formation are not developed and are mostly filled with calcite veins. The water storage coefficient ( S s ) values of the Taiyuan Formation and Majiagou Formation, whose values in the same study area are referred to, are 0.15 × 10⁻⁴ and 0.29 × 10⁻³ [23,32], respectively.
According to the 3D visualization map of the formation made using the borehole data, the average layer thickness from youngest to oldest is 182.61, 200, 81.66, 40.69, 12.26, and 505.5 m, respectively.
The bottom seam E2-1 of the Shanxi Formation is the mineable coal seam in the entire area, and mining activities have resulted in goaf formation. The distribution range of goaf and old kiln water within the key study area was identified through field surveys, mining data analysis, the mutual verification of various geophysical methods, and geological drilling verification. The goaf and old kiln water have caused corresponding changes in the original structure of the aquifer, leading to changes in hydrogeological parameters. Based on hydrogeological and pumping test data, parameter zoning was conducted for the Shanxi and Taiyuan Formation. The Shanxi Formation was divided into goaf and non-goaf areas (Figure 3a). The Taiyuan Formation was divided into four zones (Figure 3b), from left to right: Zhuge zone, Changcun and Jiaocun zone, Fudian zone, and Songshan zone. Different parameter values were assigned to the model based on the average values of hydrogeological parameters obtained from hydrological boreholes in each zone layer.
The model boundary conditions are shown in Section 3.1. The source and sink items include atmospheric rainfall recharge (0.0041495 m/d, the sum of each month’s rainfall recharge rate), the infiltration recharge of farmland irrigation water and lateral recharge of the river (5.203 ×   10 6 m3/y), diving evaporation (0.0336 mm/d), and surface drainage points (26,440 m3/d). The water level value from 10 January 2018 is selected as the initial water level. The MODFLOW module simulates the underground flow system in the mining area. The model identification and validation are based on water level data from hydrological boreholes from January 2018 to May 2019, with data monitored every 5–10 days.
Parameter sensitivity analysis can be performed during the model identification and validation process. The simulation model is established using measured borehole data, and the factor variation method in local sensitivity analysis is used for sensitivity analysis. Sensitivity analysis is conducted for permeability, specific yield, rainfall, and storage coefficients, with seven levels set for each parameter. The model’s identified and validated values are considered the 0% variation level, while the other levels are set at −5%, −10%, −20%, 5%, 10%, and 20% variation from the 0% level. In the established model, the permeability coefficient, gravity-specific yield, rainfall, and storage coefficient are individually varied to calculate the fluctuation in groundwater levels. A designed sensitivity index is used as a measure of parameter sensitivity, as shown in Equation (10):
M = 1 T i = 1 n ( h i h i ) 2
where M is the sensitivity index (m2); n is the number of parameter horizontal levels (set as 7 in this case); h i   is the average simulated water level of the wells during the identification phase (m); h i   is the average simulated water level at wells for different parameter levels (m); and T is the number of water level change points in parameter analysis, where the value 7 is taken.
The average water level change in the observation well and the parameter sensitivity index corresponding to the calculation of different parameter changes are shown in Table 2. The sensitivity index of the permeability coefficient is the largest, followed by the gravity-specific yield.

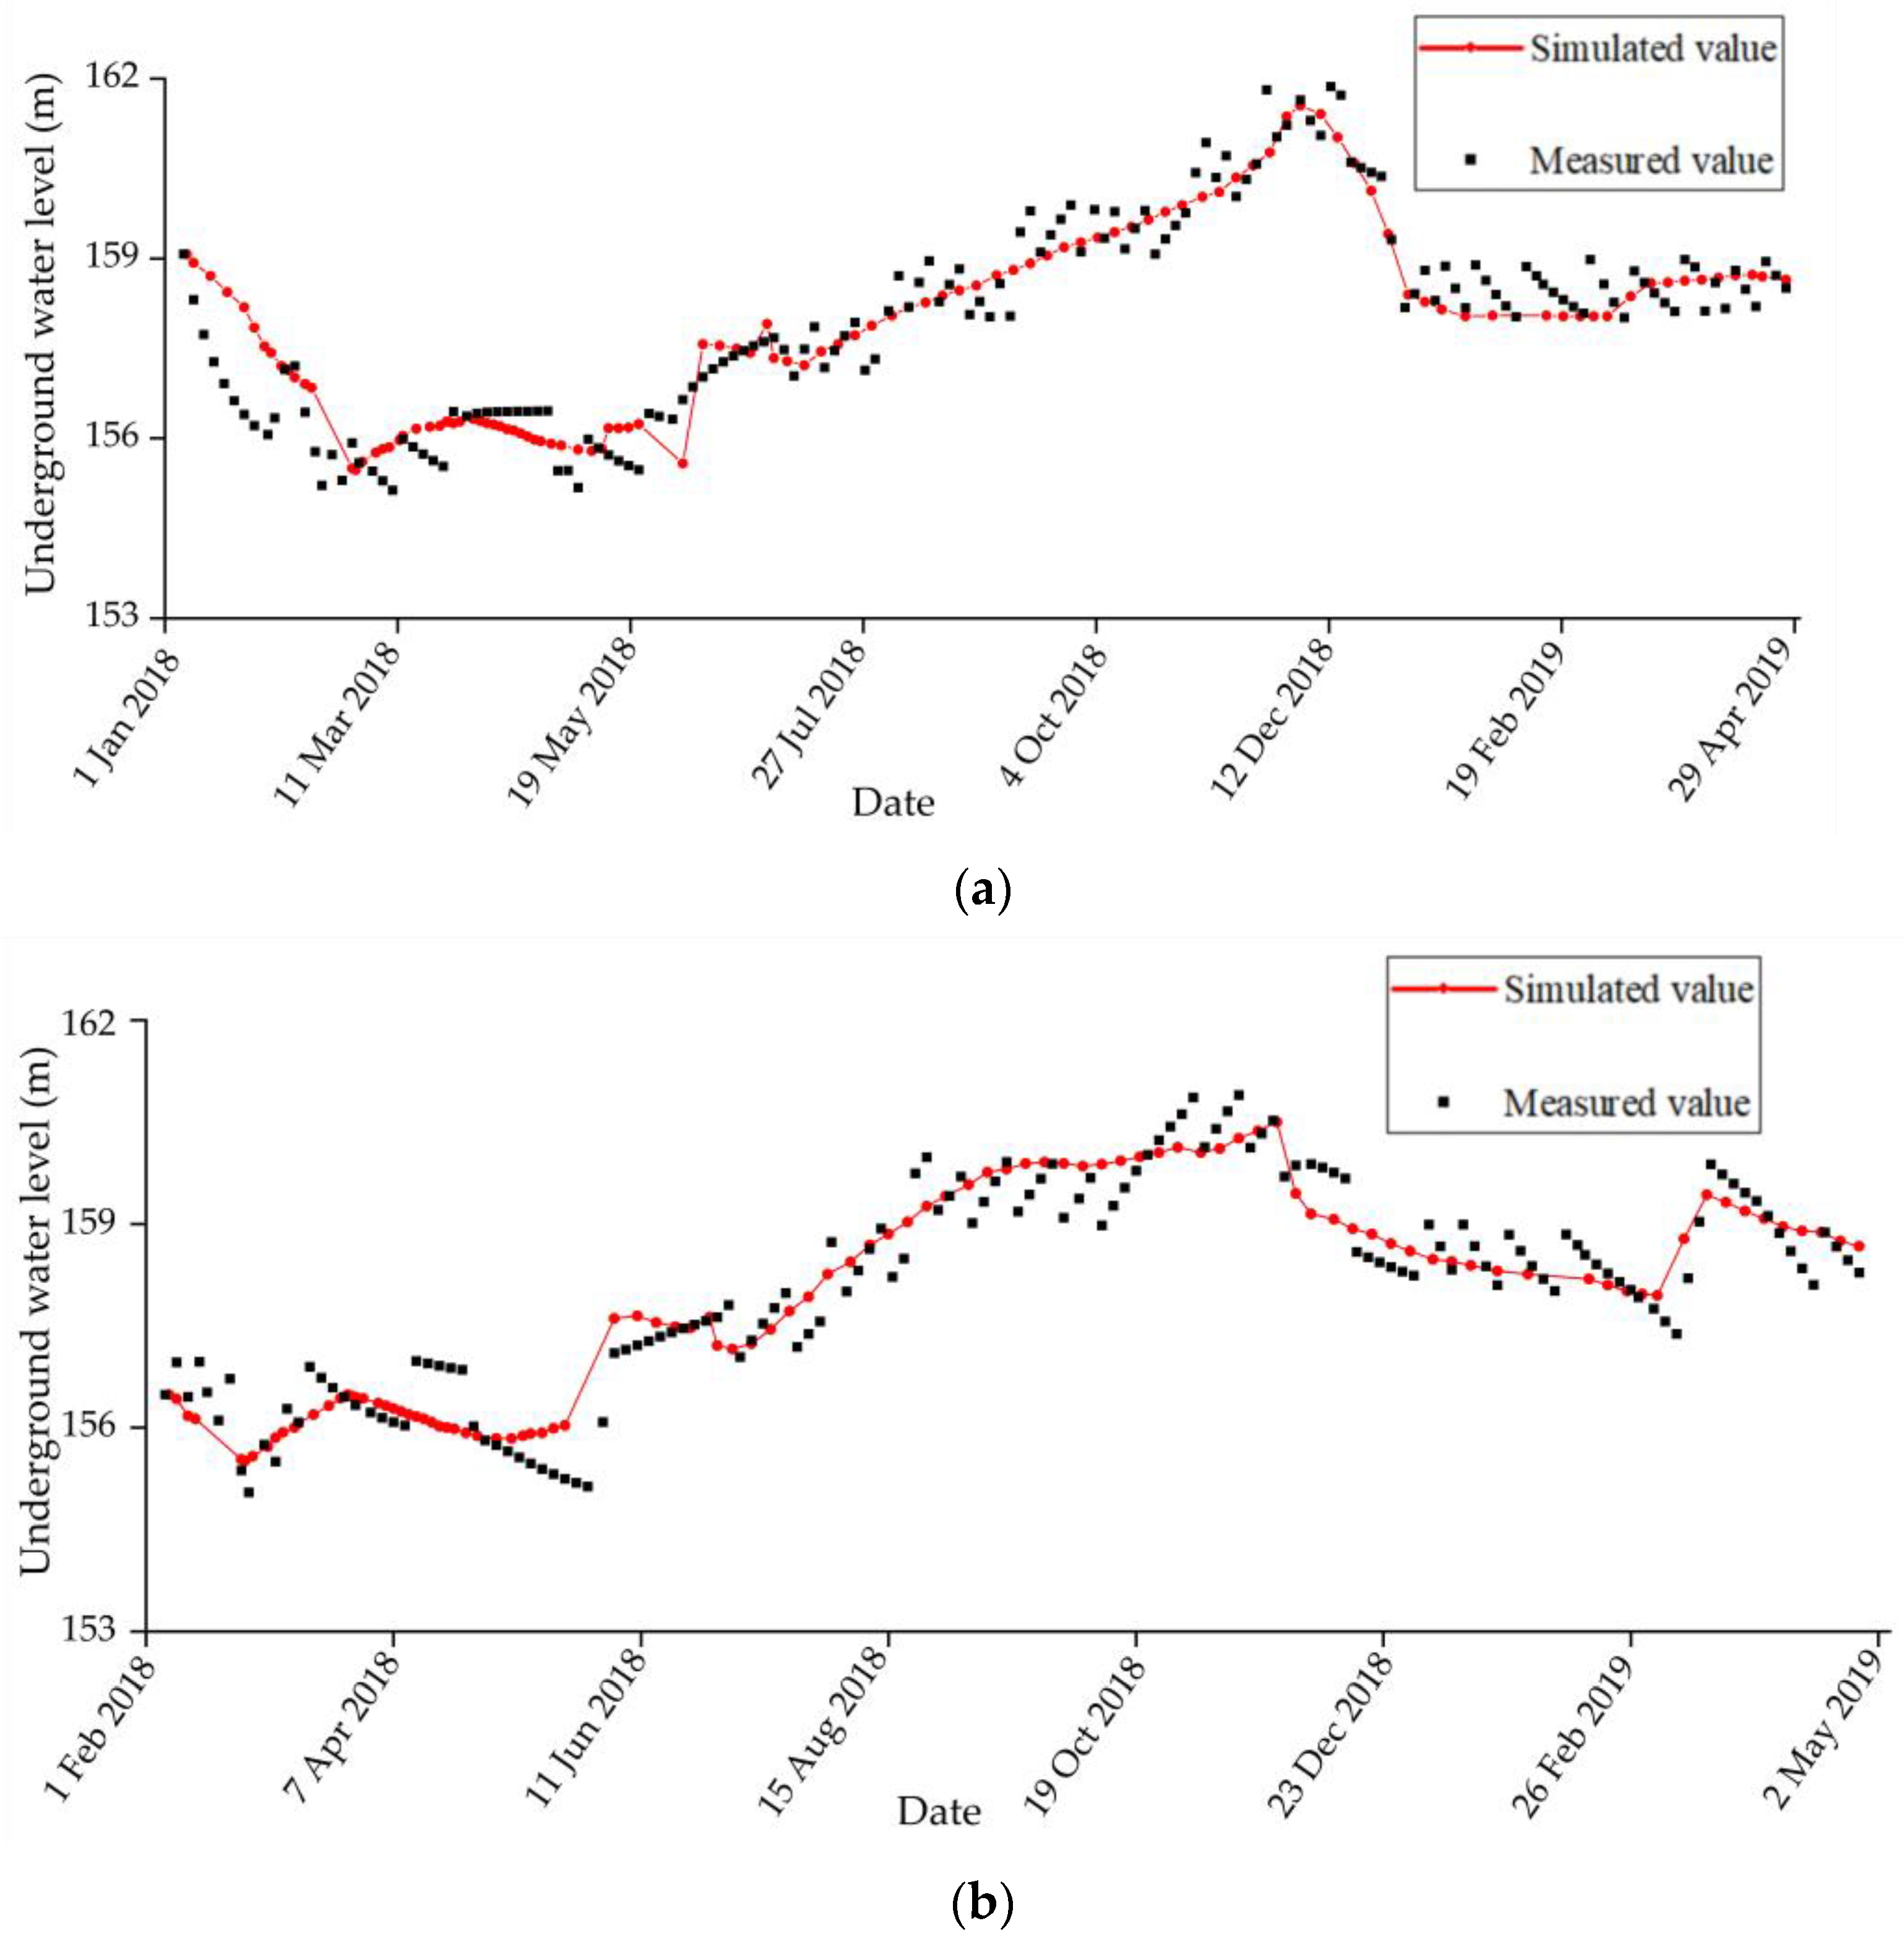
3.4.1. Calibration and Verification of Model Parameters

Model identification and validation are performed using continuous monitoring data from six observation wells: ZK13408, ZK7100, SJ02, ZK9606, ZK2304, and ZK4108. The first step in model identification and validation is to set a threshold for model error. Then, hydrogeological parameters are adjusted iteratively to match the dynamic groundwater variation process with the actual conditions. The model simulation values should fall within the threshold range of the measured values. The GMS (7.1) software uses the automatic comparison feature for water level fitting. The simulation is considered complete when the color of all observation wells changes from red to green. The effectiveness of the model simulation is evaluated using statistical parameters, including the determination coefficient ( R 2 ), Nash efficiency coefficient ( E n s ), and percentage deviation ( P B I A S ). The formulas for these statistical parameters are as follows:
R 2 =   [ i = 1 n ( Q i Q ¯ ) ( P i P ¯ ) ] 2 i = 1 n ( Q i Q ¯ ) 2 · i = 1 n ( P i P ¯ ) 2
E n s = 1 i = 1 n ( Q i P i ) 2 i = 1 n ( Q i Q ¯ ) 2
P B I A S = i = 1 n ( Q i P i ) × 100 i = 1 n Q i
where Q i is the i   th measured value; Q ¯ is the average of all measured values; P i is the i -th simulated value; P ¯ is the average of all simulated values; and n is the number of measured values.
An R 2 value closer to 1 indicates a better agreement between the simulated and measured values. A E n s value closer to 1 signifies better applicability and an improved simulation performance of the model. If E n s is negative, this indicates a significant difference between the simulated and measured values. A negative P B I A S value indicates an underestimation in the simulated values, while a positive P B I A S value indicates an overestimation. Generally, when P B I A S 25 , the simulated results are considered acceptable. The closer the absolute value of P B I A S is to zero, the better the simulation results.
The evaluated results are given in Table 3. The average values of R 2 ,   E n s , and P B I A S are 0.86, 0.81, and 2.71, respectively, which are all within the precision range. Thus, the simulation result is effective.
The fitting relationship between the simulated and measured values for boreholes ZK2304 and SJ02 is shown in Figure 4a,b, respectively. From Figure 4, the simulation of groundwater levels is highly accurate. The simulated values closely follow the trend of the measured values, indicating a high extent of fit between the simulated and observed values. This demonstrates that the established flow field can effectively reflect groundwater flow conditions. The model can simulate and forecast future water inflow in the mine.

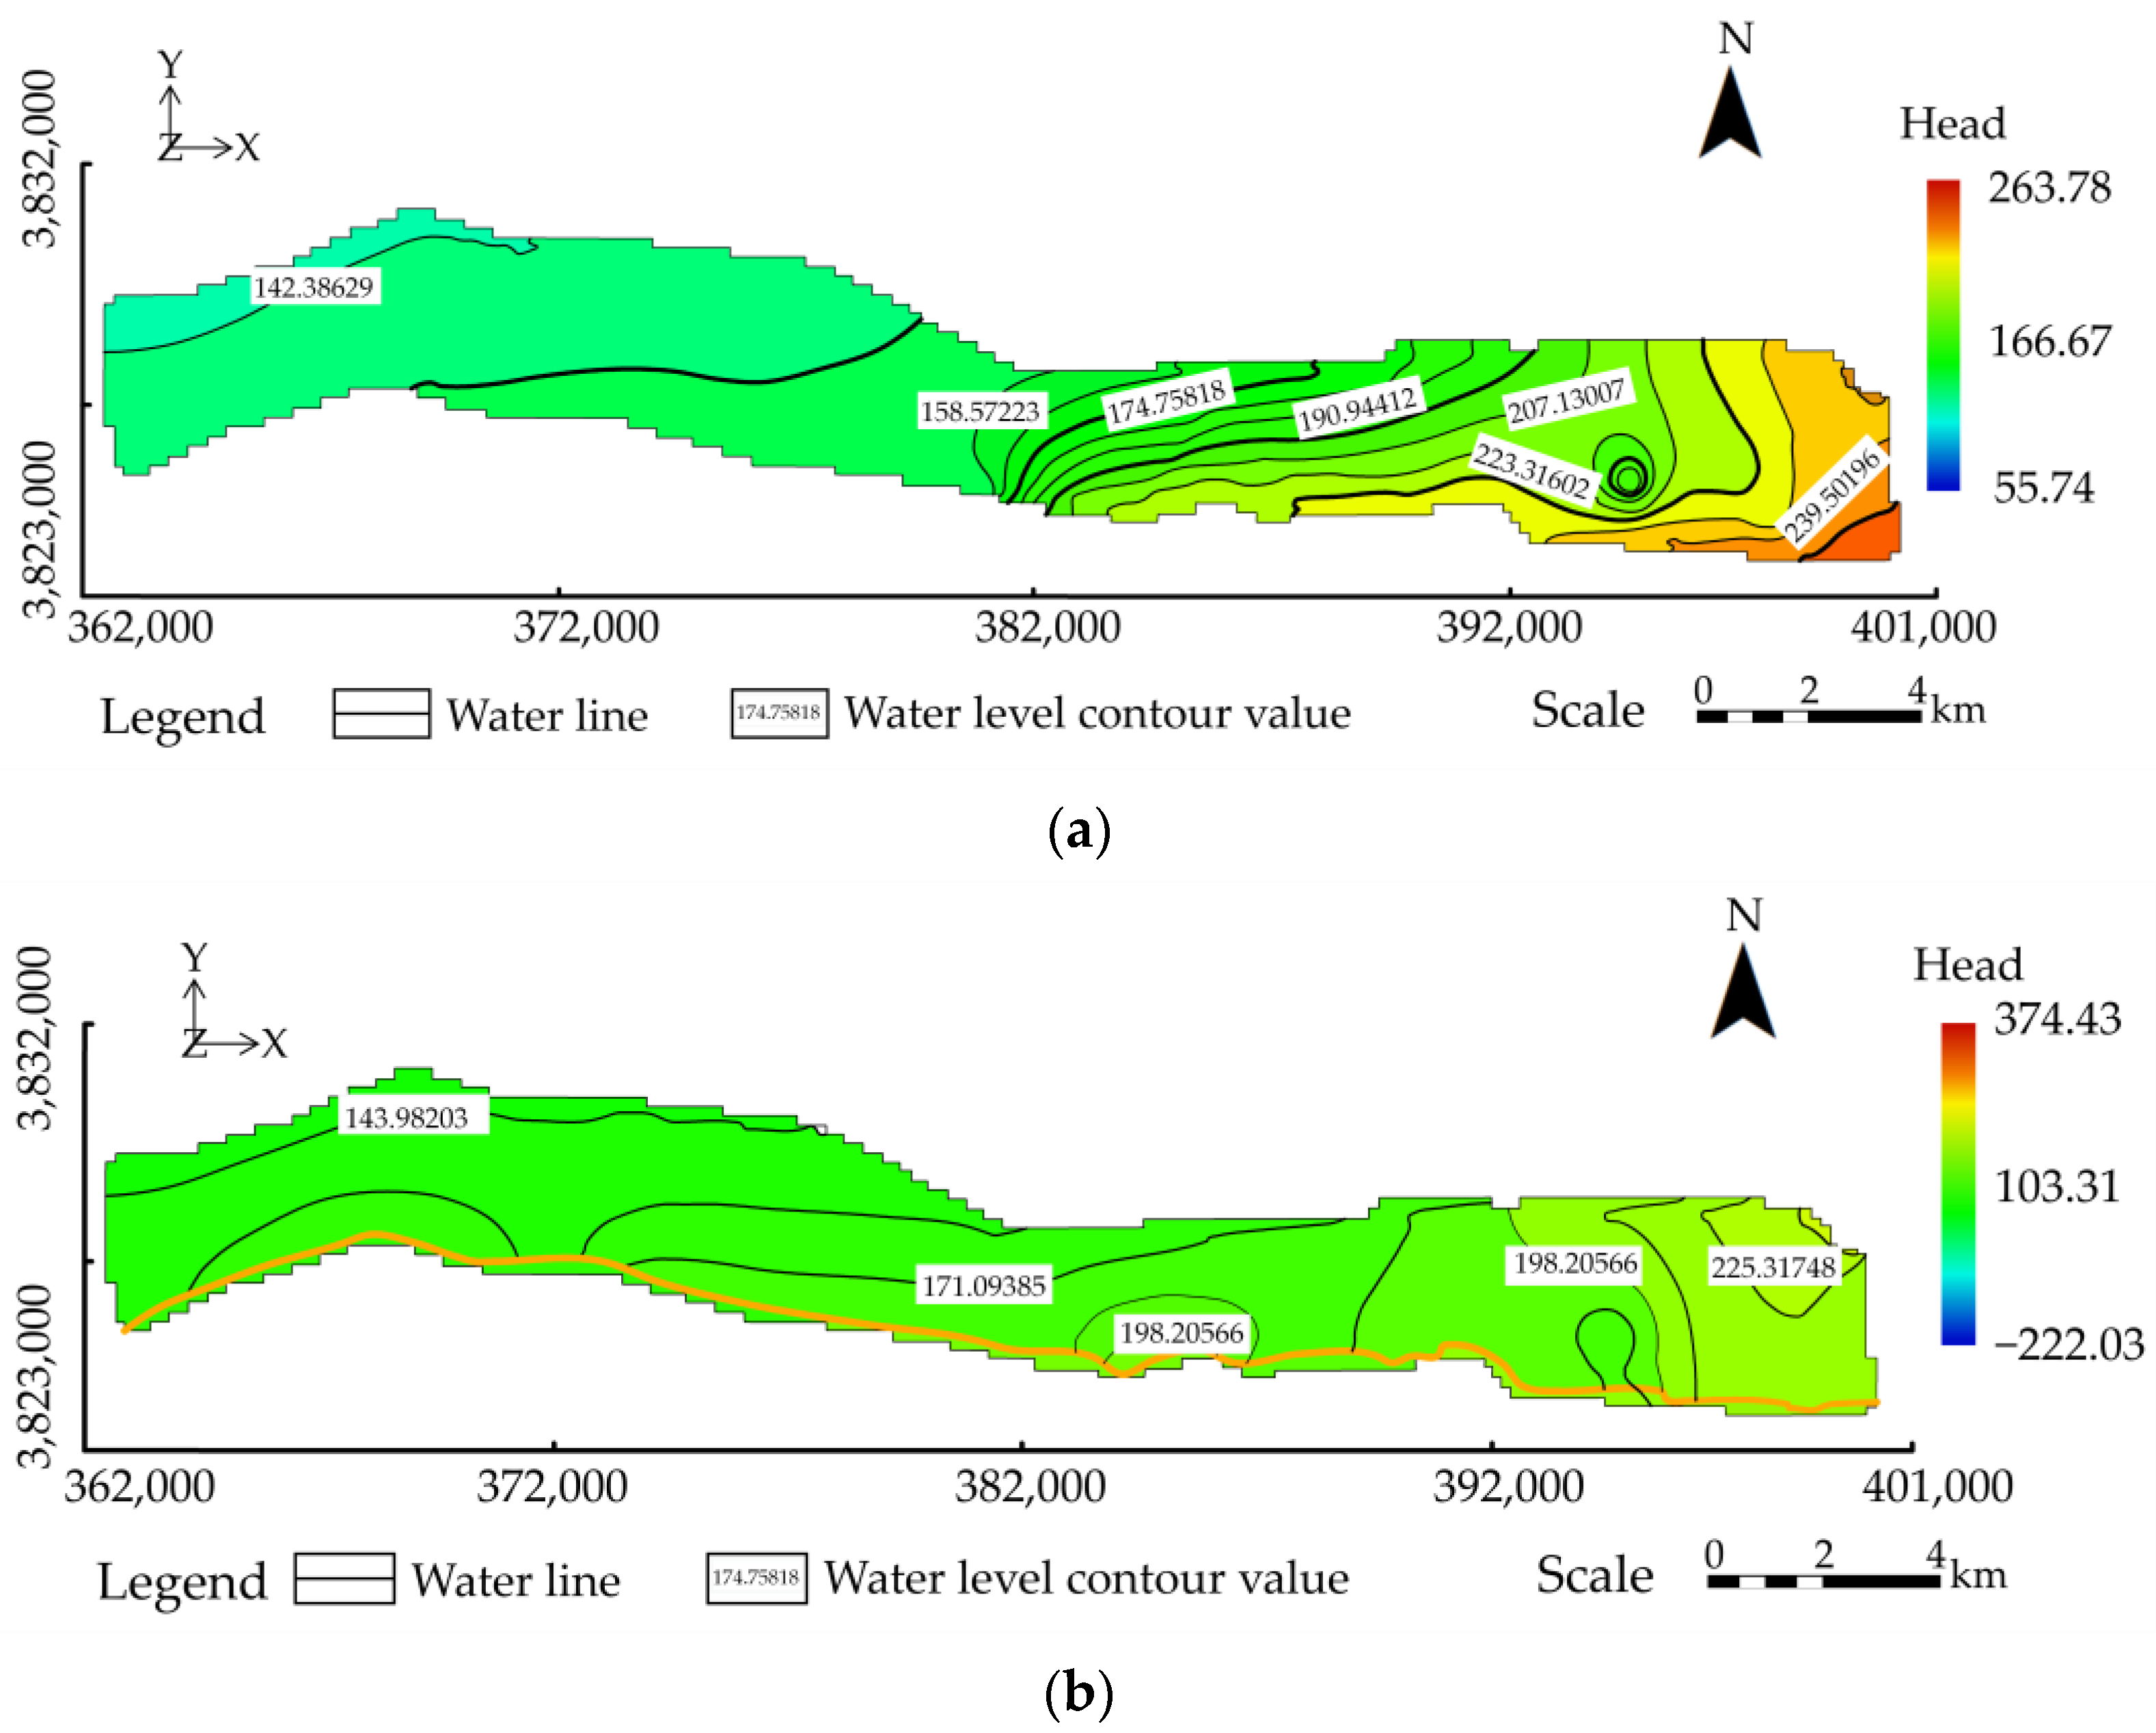
3.4.2. Hydrogeological Parameters and Flow Map

The identified and validated values for the permeability, gravity-specific yield, and elastic storage coefficient are presented in Table 4. The groundwater level flow field map for the Taiyuan and Majiagou formations on 19 October 2018 is shown in Figure 5. The general flow direction of water is from southeast to northwest.

4. Results and Analysis

4.1. Predicting Water Inflow of Deposit XII Using the Analytical Method

The “large well method” is put to use to forecast the water inflow of a typical deposit in the Yanlong mining area. The Songshan mining area, situated in the eastern Yanlong area, is examined in detail. It is known for its abundant bauxite reserves and is considered economically viable for extraction. Taking No. XII orebody in the Songshan mining area as an example, its deposit map and generalized drainage map are given in Figure 6.
According to the “large well method” in Formula (6), the inflow volume of the Taiyuan Formation aquifer in the bauxite roof is calculated. However, due to data limitations, no prediction is made for the Majiagou Formation floor. The area of No. XII orebody is 2.28 km2, and the reference radius (r₀) is calculated as 853 m using Formula (7). The influence radius (R) is calculated as 3154 m using Formula (8), resulting in a reference influence radius of 4007 m. The calculated average inflow volume of the Taiyuan Formation aquifer in the No. XII orebody is 72,786.66 m3/d, as shown in Table 5. The maximum inflow volume of a mine is generally 1.4 times the average inflow volume. Therefore, the maximum inflow volume of the Taiyuan Formation aquifer in No. XII orebody is estimated to be 101,901.32 m3/d.

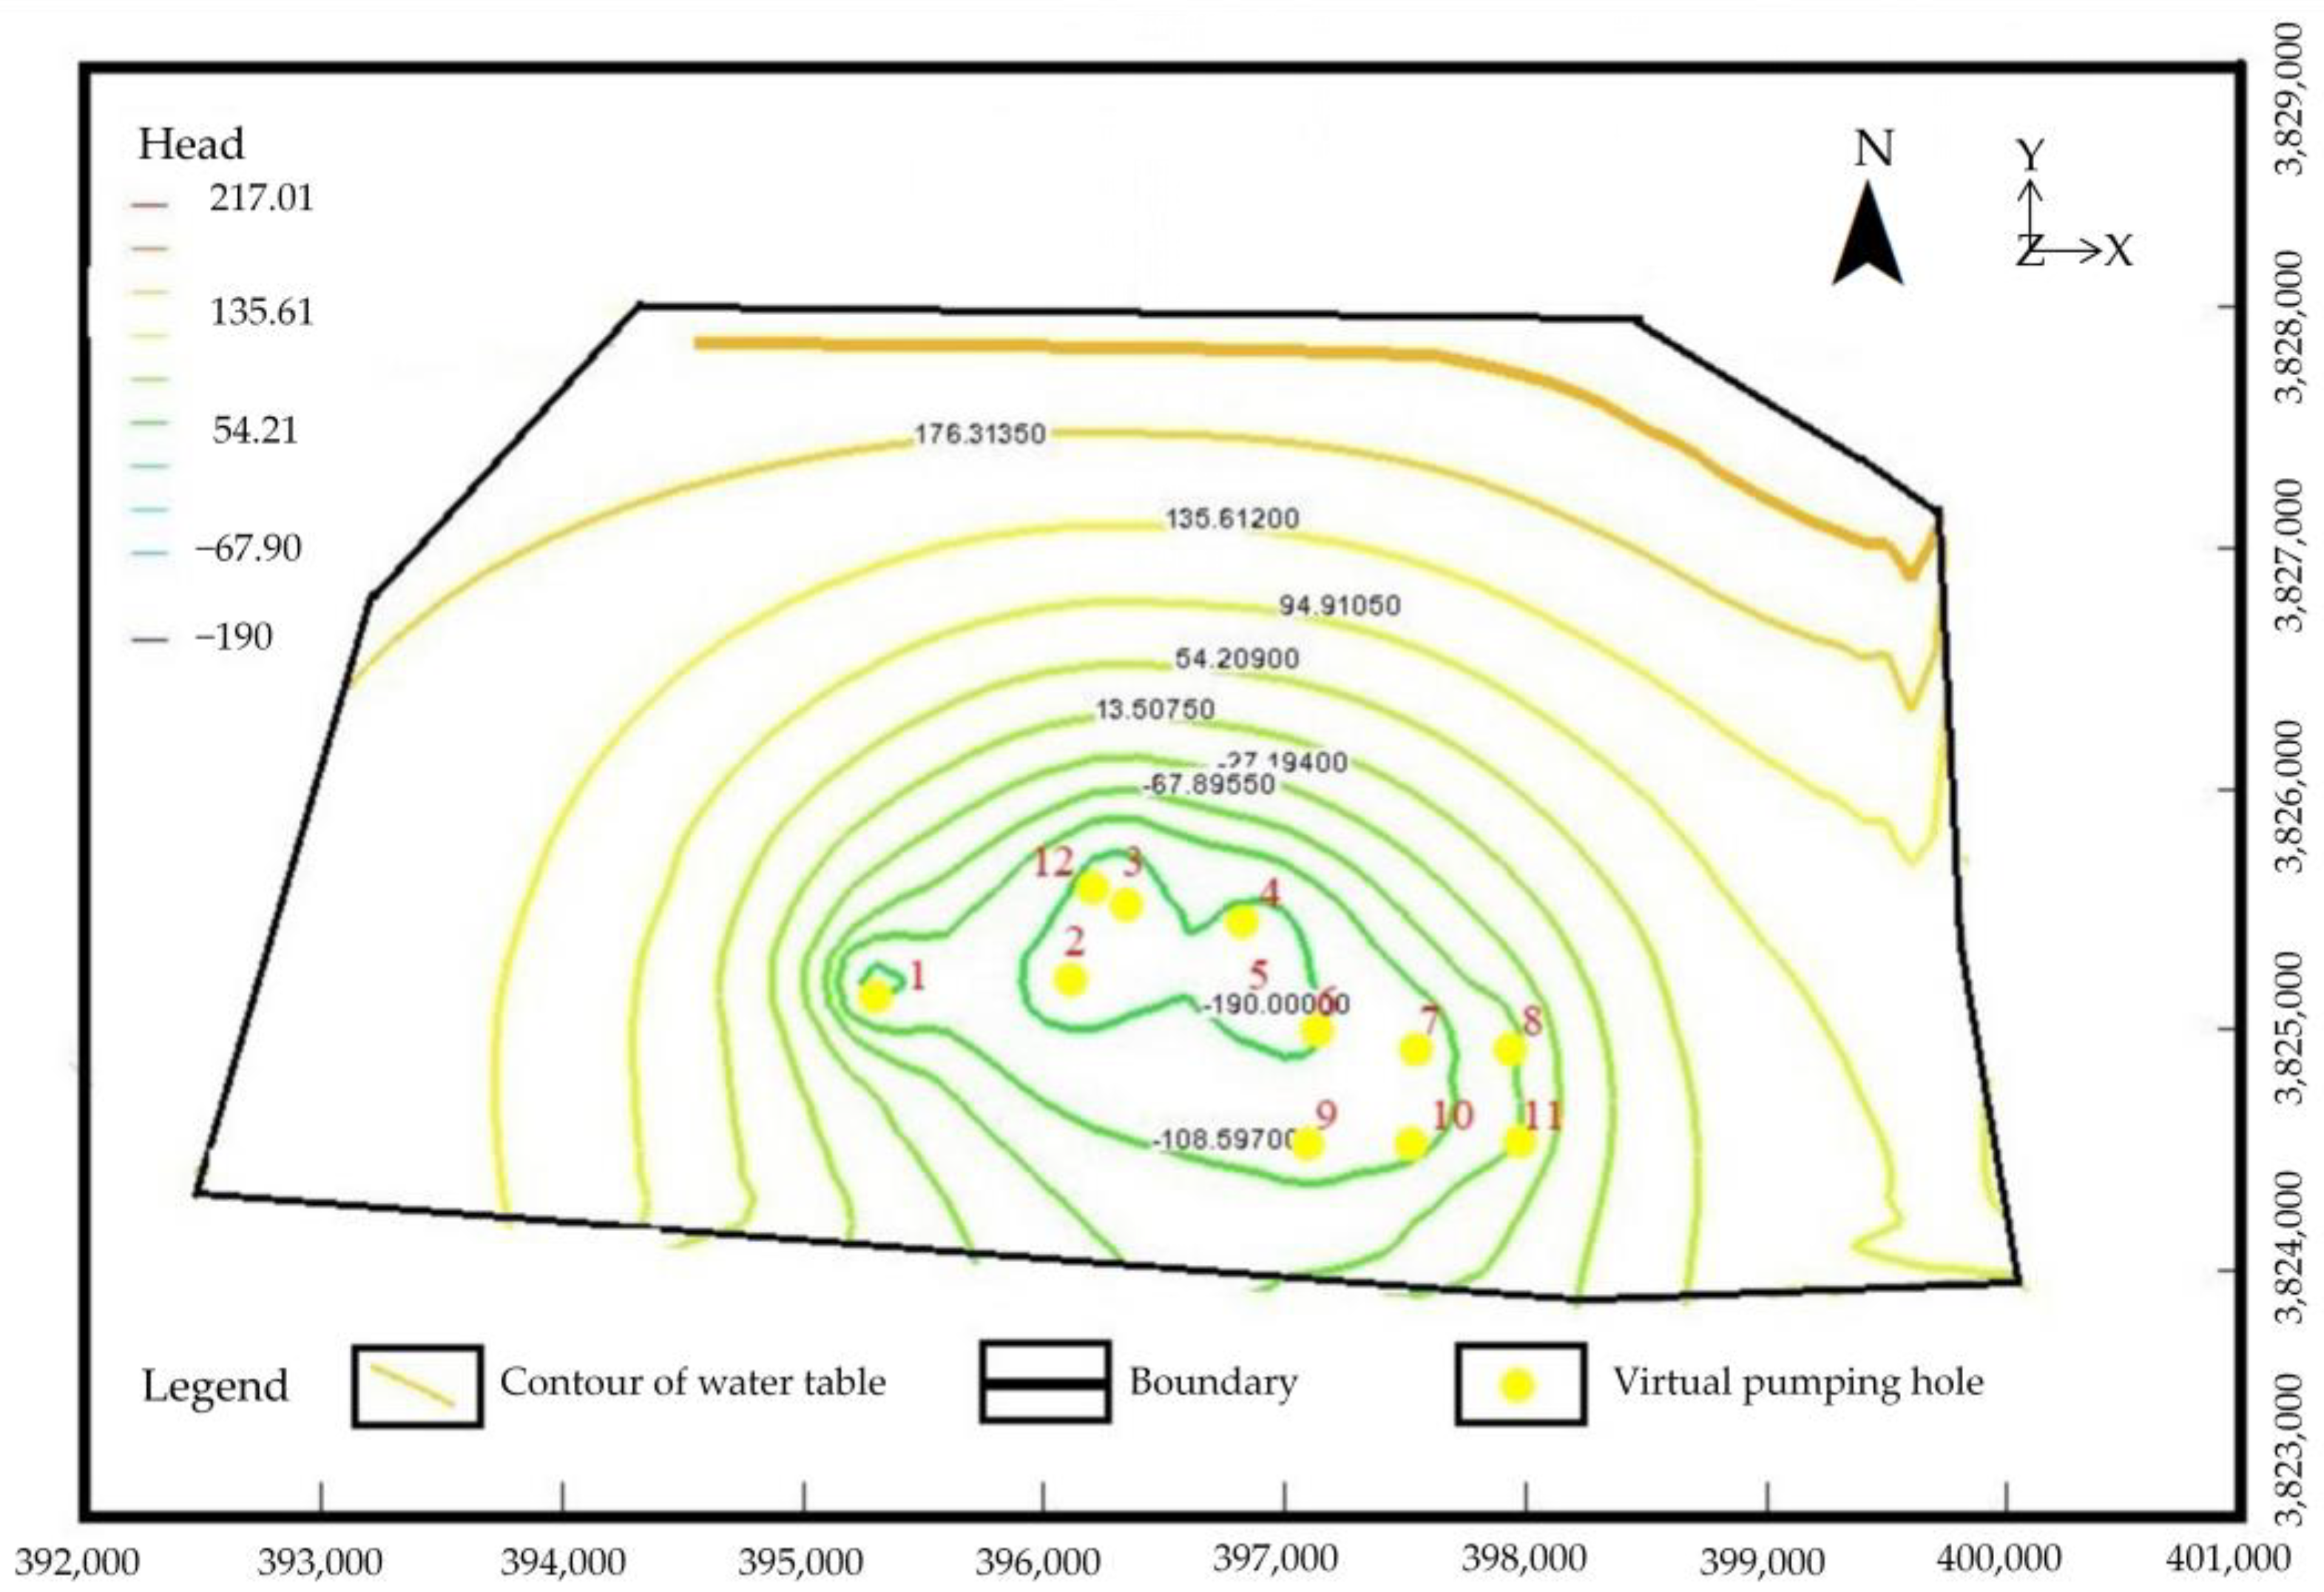
4.2. Numerical Method for Predicting Water Inflow of Ⅻ Orebody

Similarly, taking No. XII orebody in the Songshan mining area as an example, the identified and validated mathematical model is utilized to forecast the inflow water volume of the Taiyuan Formation limestone aquifer in the bauxite roof and the Majiagou Formation limestone aquifer in the floor. The initial simulation time is set to 1 January 2020.
Virtual pumping wells are reasonably arranged within the target aquifer to establish the model. Pumping is performed until the water level declines to the elevation of the aquifer floor or the safe mining elevation. Once the drawdown cone stabilizes, the total pumping volume represents the future inflow volume of the mine. The model sets a well group for pumping in No. XII orebody of the Songshan mining area (Figure 6) to simulate the inflow volumes in the roof and floor. The inflow volume in the Taiyuan Formation aquifer, which corresponds to the bauxite roof, is considered normal when the groundwater level declines to the elevation of the Taiyuan Formation floor. The inflow volume in the Majiagou Formation aquifer, corresponding to the bauxite floor, is considered normal when the groundwater level declines to a safe level. The maximum inflow volume in the Majiagou Formation is estimated to be 1.4 times the average inflow volume. Determining the safe level takes into account the hydraulic head of the groundwater. The water pressure must be reduced below the safe hydraulic head to ensure safety during bauxite mining. The theoretical safe water pressure (P) is as follows:
P = T s × M
where P is the theoretical safe water pressure (MPa); Ts is the inrush coefficient (MPa/m); and M is the adequate aquitard thickness (m). The critical water inrush coefficient at −50 to 200 m mining elevation is usually set to 0.06 MPa/m [33].

4.2.1. Inflow Water Volume of Bauxite Roof

Twelve virtual pumping wells are arranged in the Taiyuan Formation bauxite roof of the No. XII orebody, as shown in Figure 7. The coordinates and elevation of the Taiyuan Formation floor for these twelve wells are listed in Table 6. Different pumping rates are applied to each well, and the pumping rates of different wells are continuously adjusted until stability is achieved, with the groundwater level falling below the elevation of the Taiyuan Formation floor. The combined pumping rates of this group of wells, representing the inflow water volume, amount to −71,500 m3/d, with an average hourly pumping rate of −2980 m3/h. The total inflow water volume from the Taiyuan Formation in the No. XII orebody is estimated to be 71,500 m3/d. Well T12 has the highest pumping rate among the pumping wells at 10,000 m3/d, while well T3 has the lowest at 1100 m3/d. The equipotential contour map is shown in Figure 7.

4.2.2. Inflow Water Volume of Bauxite Floor

The bauxite floor in the mining area is composed of the Ordovician Majiagou Formation limestone aquifer, which has a thickness of about 600 m. During bauxite mining, the limestone aquifer water level should be lowered below the safe mining elevation. The average thickness of the bauxite deposit in the Benxi Formation is about 12 m, and the minimum thickness and maximum thickness are 4.03 m and 21.49 m, respectively. The effective aquitard thickness of the Benxi Formation bauxite deposit is set to 4 m. Calculating the theoretical safe water pressure using Formula (10), it is determined to be 0.24 MPa. Note that 1 MPa equals a water column height of 100 m [34]. The critical safe water levels for the twelve wells are listed in Table 7. Similarly, twelve virtual pumping wells are arranged in the Majiagou Formation beneath the No. XII orebody, as shown in Figure 8. Different pumping rates are applied to each well, and the pumping rates of different wells are continuously adjusted until the groundwater level stabilizes below the safe level. The equipotential contour map is shown in Figure 8 when the water level stabilizes. Well T3 has the highest pumping rate at 12,500 m3/d, while well T10 has the lowest at 200 m3/d. The total pumping volume is −59,000 m3/d, and the average hourly pumping rate is −2458 m3/h. The normal inflow water volume from the Majiagou Formation in the Ordovician system is estimated to be 59,000 m3/d, with a maximum inflow water volume of 82,600 m3/d.

4.3. Comparison of the Two Methods

The predicted inflow water volume for the Taiyuan Formation using the large well method and numerical method are 72,786.66 m3/d and 71,500 m3/d, respectively. The predicted value from the large well method is higher than that from the numerical method, consistent with previous research [17,18]. This is because the analytical method (large well method) is a lumped parameter method that generalizes the actual conditions, while the method of numerical simulation is a distributed parameter method that considers more influencing factors and discretizes the study area in time and space, providing a more accurate reflection of the actual conditions in the study area. Therefore, the numerical method is more exact than the large well method. However, in previous research [21], the predicted value from the numerical method is more significant than that from the large well method, which may be attributed to the generalization in the large well method.
Compared to the analogy and regression methods, the numerical method is more reliable for predicting inflow water volume [35,36]. In the early stages, the numerical method predicted the inflow water volume by setting the dewatering volume and dewatering time, considering the dewatering volume needed to lower the water level to the specified elevation as the inflow water volume [37]. For complex ore bodies, the model in numerical simulation is divided and discretized according to hydrogeological profiles, and hydrogeological parameters are assigned to the discretized grid, thereby improving the prediction accuracy [38]. In the case of no other water sources during a sudden water inrush, the stable inrush water volume predicted by the numerical method represents the water inflow volume during coal seam mining [39]. In this study, when predicting the average inflow water volume of the bauxite roof and floor using the numerical method, a virtual well group is set up, the grid is refined, and parameters are detailed and divided into zones. Pumping wells are simultaneously dewatered at different rates to the elevation of the floor and below the safe mining elevation. Therefore, the results are reliable, and the numerical values can offer a scientific basis for the mining area drainage design and dewatering mining scheme formulation.

5. Discussion

The groundwater flow simulation model functions as an analogue for real-world groundwater flow, and its level of accuracy greatly impacts the reliability of projected water inflow estimations. This study utilizes three factors to evaluate the model’s accuracy, with R-squared (R2) being the significant metric for assessing the model’s performance. The R2 values for the drilling locations ZK9606, ZK2304, SJ02, ZK13408, ZK7100, and ZK4108 are documented as 0.91, 0.90, 0.89, 0.85, 0.82, and 0.78, respectively. The average R2 value across these locations is calculated to be 0.86. It is worth mentioning that borehole ZK9606 has the maximum degree of precision, as indicated by its R2 value of 0.91, whilst borehole ZK4108 exhibits the lowest level of precision, with an R2 value of 0.78. The researchers utilized the MODFLOW-CFP model to simulate the dynamic flow of spring water. The simulation yielded correlation coefficients of 0.891 and 0.866 between the simulated flow results of Spring Creeks Springs and Wakulla Springs, respectively, and the observed observations [40]. The steady flow simulation of the groundwater level of Kabodarahang aquifer in Hamadan province, Iran, was carried out with MODFLOW, and the correlation coefficient was 0.917 [41]. When examining the simulated correlation coefficients given in this study, it is observed that they exhibit a modest decrease compared to the correlation coefficients obtained in the steady flow simulations. Nevertheless, it is essential to highlight that the simulated correlation coefficients for most boreholes examined in this work exceed those obtained from unsteady flow simulation. Simulating steady flow is easier than turbulent flow, which may explain the correlation coefficient variation. The quantity of hydrological boreholes has limited this simulation’s accuracy. Expanding the hydrological borehole network and pumping experiments may improve the model’s accuracy for Yanlong mining activities. This proactive technique can improve groundwater flow estimates and decision making in mining.
In the Yanlong mining area, the overlying coal mines of the bauxite ore have already been exploited in some places, and the bauxite ore is currently in the pre-mining stage. The numerical method can be applied to forecast the water inflow in the mining faces under different simulated mining scenarios [42]. The projection of mine gushing water needs to consider multiple factors, requiring a case-by-case analysis. When adopting the open-pit to underground mining method in the mining field, the water inflow of the mining pit system needs to consider both the surface pit runoff infiltration and the underground water inflow [43]. During open-pit coal mining, the control of the underground water system is reached through the construction of curtain walls. By combining the numerical simulation of the underground water system with the study of dewatering in open-pit mining, the impact of curtain wall construction and open-pit mining on the dewatering intensity of the mining pit is predicted and analyzed [44]. On account of the site characteristics of the Éléonore mine, the inflow of water from two major faults under different grouting scenarios is designed and simulated [45]. By using the pumping test and groundwater numerical simulation method, the water inflow of iron ore surrounded by an incomplete grouting curtain is evaluated [46]. By constructing the numerical drainage model of inclined group holes in the underground coal mine, the water gushing rule of a group of holes in a working face of the Binchang Mining area is analyzed under different numbers of inclined holes and different spacings of drilling fields. The findings provide a basis for the dredging treatment practice of roof drilling [47,48].
The new water in the limestone aquifer of the bauxite ore roof and floor is mainly influenced by the direct infiltration of precipitation in the south of the mining area. Based on these research findings, considering the hydrogeological conditions of the Yanlong mining area and the water-filling path of the ore body, it is suggested that when mining the bauxite ore in the mining area, curtain walls should be constructed in the south of the mining area to reduce the infiltration of precipitation into the bauxite ore roof and floor. This is beneficial for the drainage of the bauxite ore roof and the dewatering of the floor below the critical safe water level. The Yanlong mining area is situated in the northern wing of a syncline, which has an overall gentle monocline structural form. There are some minor faults distributed in the mining area. If fault distributions exist in the mining area, grouting and inclined borehole pumping can be used for dewatering and drainage. If open-pit mining is conducted, the drainage during mining should consider the infiltration of surface pit runoff.
Using a 3D hydrogeological visualization model built with the drilling data, it is shown that the bauxite overlying aquifer where the thickness of the bauxite is relatively thin cannot be excavated to the bottom to hold back water inrush accidents from the bottom aquifer if mining bauxite. From the predicted outcomes of bauxite water inflow in the Songshan mining area, the predicted value of the large well method (72,786.66 m3/d) is greater than that of the numerical method (71,500 m3/d) on bauxite roof. The average and maximum water inflow of bauxite floor is predicted to be 5900 m3/d and 82,600 m3/d, respectively. For security, the more significant value of the water inflow is generally taken, that is, the minimum extraction of the bauxite roof and floor is 72,786.66 m3/d and 82,600 m3/d in the Songshan mining area. Where the bauxite is thin, the upper aquifer cannot be excavated to the bottom, and the lower aquifer must be further lowered to prevent water inrush.

6. Conclusions

By adopting comprehensive exploration methods, the hydrogeological conditions of the Yanlong area have been determined. Hydrogeological conceptual models and numerical simulation models of the mining area have been constructed using the GMS software as the platform. The water inflow in the bauxite ore roof and floor has been predicted as follows:
(1)
The model is identified and verified by the measured water level, and the average values of R 2 ,   E n s and P B I A S are 0.86, 0.81 and 2.71, respectively. The correlation or interdependence of the 3D simulation model is built in order to forecast water inflow in the bauxite layer.
(2)
The large well method and numerical method predict the water inflow in the Taiyuan Formation of the No. XII orebody in the Songshan mining area to be 72,786.66 m3/d and 71,500 m3/d, respectively. The numerical method predicts the average inflow and maximum inflow of the Majiagou Formation in the No. XII orebody to be 59,000 m3/d and 82,600 m3/d, respectively. Thus, it is established that the bauxite in the Songshan mining area will be exploited; the displacement of the roof and floor is greater than 72,786.66 m3/d and 82,600 m3/d.
(3)
When mining bauxite ore, it is recommended to construct curtain walls in the southern mining area to reduce the infiltration of precipitation into the bauxite ore roof and floor. Alternatively, the grouting and inclined borehole pumping methods can be used, which are beneficial for draining the bauxite ore roof and dewatering the floor below the critical safe water level.
The anticipated water inflow data significantly assist prospective bauxite mining activities within the designated research region. Moreover, this process can be a model or point of reference for analogous mining initiatives in comparable environments.

Author Contributions

Conceptualization and methodology, H.Z., J.W., Y.L. and A.H.; validation, Y.L., K.H. and J.W.; resources and data curation, H.Z., Z.R., K.H. and S.H.; writing—original draft preparation, H.Z., J.W., Y.L., K.H. and S.H.; writing—review and editing, H.Z., J.W., Y.L., K.H. and A.A. All authors have read and agreed to the published version of the manuscript.

Funding

The research supported by the Geological Research Project of Henan Provincial Department of Natural Resources (2018-132-7) and the National Natural Science Foundation of China (Grant Nos. 42261144749 and 41877232).

Data Availability Statement

Not applicable.

Conflicts of Interest

The authors announce no financial conflict. The funders did not participate in designing the study, collecting and analyzing the data, writing the manuscript, or publishing the results.

References

  1. Huo, A.; Wang, X.; Zhao, Z.; Yang, L.; Zhong, F.; Zheng, C.; Gao, N. Risk Assessment of Heavy Metal Pollution in Farmland Soils at the Northern Foot of the Qinling Mountains, China. Int. J. Environ. Res. Public. Health 2022, 19, 14962. [Google Scholar] [CrossRef] [PubMed]
  2. Huo, A.; Zhao, Z.; Luo, P.; Zheng, C.; Peng, J.; Abuarab, M.E.L.S. Assessment of Spatial Heterogeneity of Soil Moisture in the Critical Zone of Gully Consolidation and Highland Protection. Water 2022, 14, 3674. [Google Scholar] [CrossRef]
  3. Huo, A.; Yang, L.; Luo, P.; Cheng, Y.; Peng, J.; Nover, D. Influence of landfill and land use scenario on runoff, evapotranspiration, and sediment yield over the Chinese Loess Plateau. Ecol. Indic. 2021, 121, 107208. [Google Scholar] [CrossRef]
  4. Li, T.; Song, H.; Huang, G.; Bi, Y.; Li, X. Assessment of groundwater changing trends through the generalized large well method with confined–unconfined flow model in open-pit mine area. Environ. Earth Sci. 2014, 72, 4599–4606. [Google Scholar] [CrossRef]
  5. Liu, J.; Zhao, Y.; Tan, T.; Zhang, L.; Zhu, S.; Xu, F. Evolution and modeling of mine water inflow and hazard characteristics in southern coalfields of China: A case of Meitanba mine. Int. J. Min. Sci. Technol. 2022, 32, 513–524. [Google Scholar] [CrossRef]
  6. Zhang, X.; Wei, J.; Zhang, Y.; Wu, X.; Li, X. Principal component analysis and BP neural network of mine water inflow prediction research. Coal Technol. 2018, 37, 201–203. (In Chinese) [Google Scholar]
  7. Miladinović, B.; Vakanjac, V.R.; Bukumirović, D.; Dragišić, V.; Vakanjac, B. Simulation Of Mine Water Inflow: Case Study Of The Štavalj Coal Mine (Southwestern Serbia). Arch. Min. Sci. 2015, 60, 955–969. [Google Scholar] [CrossRef]
  8. Ren, T. Analysis of hydrogeological characteristics and prediction of mine inflow in Xinqiao coal mine. West-China Explor. Eng. 2019, 31, 156–158. (In Chinese) [Google Scholar]
  9. Li, B.; Zhang, H.; Luo, Y.; Liu, L.; Li, T. Mine inflow prediction model based on unbiased Grey-Markov theory and its application. Earth Sci. Inform. 2022, 15, 855–862. [Google Scholar] [CrossRef]
  10. Ma, D.; Bai, H. Groundwater inflow prediction model of karst collapse pillar: A case study for mining-induced groundwater inrush risk. Nat. Hazards 2014, 76, 1319–1334. [Google Scholar] [CrossRef]
  11. Hadiyan, P.P.; Moeini, R.; Ehsanzadeh, E. Application of static and dynamic artificial neural networks for forecasting inflow discharges, case study: Sefidroud Dam reservoir. Sustain. Comput. Inform. Syst. 2020, 27, 100401. [Google Scholar] [CrossRef]
  12. Ren, B. Analysis on hydrological features and prediction on mine water inrush value in Hongling mine. Coal Eng. 2012, 4, 46–49. (In Chinese) [Google Scholar]
  13. Rupp, D.E.; Schmidt, J.; Woods, R.A.; Bidwell, V.J. Analytical assessment and parameter estimation of a low-dimensional groundwater model. J. Hydrol. 2009, 377, 143–154. [Google Scholar] [CrossRef]
  14. Wang, D.; Sui, W. Hydrogeological Effects of Fault Geometry for Analysing Groundwater Inflow in a Coal Mine. Mine Water Environ. 2021, 41, 93–102. [Google Scholar] [CrossRef]
  15. Wang, J.; Chen, S.; Wu, Y.-Q.; Hu, A. Simulation and prediction of water quality nitrogen based on ANN in Jinghe River, Shaanxi Province. Yellow River 2014, 36, 67–70+110. (In Chinese) [Google Scholar]
  16. Golian, M.; Teshnizi, E.S.; Nakhaei, M. Prediction of water inflow to mechanized tunnels during tunnel-boring-machine advance using numerical simulation. Hydrogeol. J. 2018, 26, 2827–2851. [Google Scholar] [CrossRef]
  17. Dong, D.; Sun, W.; Xi, S. Optimization of Mine Drainage Capacity Using FEFLOW for the No. 14 Coal Seam of China’s Linnancang Coal Mine. Mine Water Environ. 2012, 31, 353–360. [Google Scholar] [CrossRef]
  18. Surinaidu, L.; Gurunadha Rao, V.V.S.; Srinivasa Rao, N.; Srinu, S. Hydrogeological and groundwater modeling studies to estimate the groundwater inflows into the coal Mines at different mine development stages using MODFLOW, Andhra Pradesh, India. Water Resour. Ind. 2014, 7-8, 49–65. [Google Scholar] [CrossRef]
  19. Körner, P.; Pluntke, T.; Sachse, A.; Böttcher, N.; Naumov, D.; Kolditz, O.; Bernhofer, C. Inverse determination of groundwater inflow using water balance simulations. Environ. Earth Sci. 2014, 72, 4757–4769. [Google Scholar] [CrossRef]
  20. Ma, Q.; Luo, Z. Three-dimensional numerical simulation for predicting mine water inflow. J. Xi’an Univ. Sci. Technol. 2015, 35, 236–241. (In Chinese) [Google Scholar]
  21. Zhang, K.; Cao, B.; Lin, G.; Zhao, M. Using Multiple Methods to Predict Mine Water Inflow in the Pingdingshan No. 10 Coal Mine, China. Mine Water Environ. 2015, 36, 154–160. [Google Scholar] [CrossRef]
  22. Wu, C.; Wu, X.; Zhu, G.; Qian, C. Predicting mine water inflow and groundwater levels for coal mining operations in the Pangpangta coalfield, China. Environ. Earth Sci. 2019, 78, 130. [Google Scholar] [CrossRef]
  23. Yin, H.; Wei, J.; Lefticariu, L.; Guo, J.; Xie, D.; Li, Z.; Zhao, P. Numerical Simulation of Water Flow from the Coal Seam Floor in a Deep Longwall Mine in China. Mine Water Environ. 2016, 35, 243–252. [Google Scholar] [CrossRef]
  24. Gao, R.; Yan, H.; Ju, F.; Mei, X.; Wang, X. Influential factors and control of water inrush in a coal seam as the main aquifer. Int. J. Min. Sci. Technol. 2018, 28, 187–193. [Google Scholar] [CrossRef]
  25. Wang, J.; Liu, H.; Tu, W.; Mou, C.; Wan, X. Numerical-Analytical Method for Predicting Water Inflow into the Tunnel through Conductive Fault Fracture Zone. Pol. J. Environ. Stud. 2023, 32, 2885–2892. [Google Scholar] [CrossRef] [PubMed]
  26. Bai, Y.; Wu, Z.; Huang, T.; Peng, D. A Dynamic Modeling Approach to Predict Water Inflow during Karst Tunnel Excavation. Water 2022, 14, 2380. [Google Scholar] [CrossRef]
  27. Farhadian, H.; Nikvar Hassani, A.; Katibeh, H. Groundwater inflow assessment to Karaj Water Conveyance tunnel, northern Iran. KSCE J. Civ. Eng. 2016, 21, 2429–2438. [Google Scholar] [CrossRef]
  28. Gabov, V.V.; Zadkov, D.A.; Babyr, N.V.; Fangwei, X. Nonimpact rock pressure regulation with energy recovery into the hydraulic system of the longwall powered support. Eurasian Min. 2021, 2021, 55–59. [Google Scholar] [CrossRef]
  29. Zadkov, D.A.; Gabov, V.V.; Babyr, N.V.; Stebnev, A.V.; Teremetskaya, V.A. Adaptable and energy-efficient powered roof support unit. Min. Informational Anal. Bull. 2022, 6, 46–61. [Google Scholar] [CrossRef]
  30. Zhao, J.; Nie, G.; Wen, Y. Monthly precipitation prediction in Luoyang city based on EEMD-LSTM-ARIMA model. Water Sci. Technol. 2023, 87, 318–335. [Google Scholar] [CrossRef]
  31. Huo, A.; Wang, X.; Liang, Y.; Jiang, C.; Zheng, X. Integrated numerical model for irrigated area water resources management. J. Water Clim. Chang. 2020, 11, 980–991. [Google Scholar] [CrossRef]
  32. Chang, H. Hydrogeological characteristics analysis and mine inflow prediction of Shangzhai coal mine in Guanling County. Resour. Inf. Eng. 2017, 32, 61–62+64. (In Chinese) [Google Scholar]
  33. Li, P.; Guo, H.; Wu, K.; Jin, M.; Li, X. Numerical Simulation and Forecast of Mine Discharge in Wanghe Coal Mine. Earth Sci. -J. China Univ. Geosci. 2011, 36, 755–760. (In Chinese) [Google Scholar]
  34. Zhang, Z.; Li, L. Groundwater Resources in China (Comprehensive Volume); China Cartographic Publishing House: Beijing, China, 2004; pp. 21–30. (In Chinese) [Google Scholar]
  35. Li, B.; Wu, H.; Liu, P.; Fan, J.; Li, T. Construction and application of mine water inflow prediction model based on multi-factor weighted regression: Wulunshan Coal Mine case. Earth Sci. Inform. 2023, 16, 1879–1890. [Google Scholar] [CrossRef]
  36. Huo, A.; Peng, J.; Cheng, Y.; Luo, P.; Zhao, Z.; Zheng, C. Hydrological Analysis of Loess Plateau Highland Control Schemes in Dongzhi Plateau. Front. Earth Sci. 2020, 8, 528632. [Google Scholar] [CrossRef]
  37. Cao, D. Numerical simulation of underground water drainage and dewatering quantity from Ordovician limestone of low group seam in Dongtan mine. Coal Sci. Technol. 2011, 39, 98–102. (In Chinese) [Google Scholar]
  38. Mehl, S.; Hill, M.C. Development and evaluation of a local grid refinement method for block-centered finite-difference groundwater models using shared nodes. Adv. Water Resour. 2002, 25, 497–511. [Google Scholar] [CrossRef]
  39. Luo, Q.; Zhao, B.; Mao, X.; Han, Y.; Luo, X.; Hu, Y. Prediction and analysis of mine water inflow based on numerical simulation method. J. Northwest Univ. Nat. Sci. Ed. 2022, 52, 1100–1110. (In Chinese) [Google Scholar]
  40. Xu, Z.; Hu, B.X.; Davis, H.; Kish, S. Numerical study of groundwater flow cycling controlled by seawater/freshwater interaction in a coastal karst aquifer through conduit network using CFPv2. J. Contam. Hydrol. 2015, 182, 131–145. [Google Scholar] [CrossRef]
  41. Malekzadeh, M.; Kardar, S.; Shabanlou, S. Simulation of groundwater level using MODFLOW, extreme learning machine and Wavelet-Extreme Learning Machine models. Groundw. Sustain. Dev. 2019, 9, 100279. [Google Scholar] [CrossRef]
  42. Wu, Q.; Zhou, W. Prediction of inflow from overlying aquifers into coalmines: A case study in Jinggezhuang Coalmine, Kailuan, China. Environ. Geol. 2007, 55, 775–780. [Google Scholar] [CrossRef]
  43. Yihdego, Y.; Paffard, A. Predicting Open Pit Mine Inflow and Recovery Depth in the Durvuljin soum, Zavkhan Province, Mongolia. Mine Water Environ. 2016, 36, 114–123. [Google Scholar] [CrossRef]
  44. Veyskarami, M.; Hassani, A.H.; Ghazanfari, M.H. Modeling of non-Darcy flow through anisotropic porous media: Role of pore space profiles. Chem. Eng. Sci. 2016, 151, 93–104. [Google Scholar] [CrossRef]
  45. Domingue, C.; Lemieux, J.-M.; Grenon, M.; Molson, J.; Therrien, R.; Lajoie, P.-L.; Blessent, D. Numerical Evaluation of Grouting Scenarios for Reducing Water Inflows from Major Faults in Underground Excavations. Mine Water Environ. 2019, 38, 497–506. [Google Scholar] [CrossRef]
  46. Chen, W.; Li, W.; Wang, Q.; Qiao, W. Evaluation of Groundwater Inflow into an Iron Mine Surrounded by an Imperfect Grout Curtain. Mine Water Environ. 2021, 40, 520–538. [Google Scholar] [CrossRef]
  47. Fan, L.; Ma, X. A review on investigation of water-preserved coal mining in western China. Int. J. Coal Sci. Technol. 2018, 5, 411–416. [Google Scholar] [CrossRef]
  48. Lu, Y.; Lu, Y.; Lu, T.; Wang, B.; Zeng, G.; Zhang, X. Computing of Permeability Tensor and Seepage Flow Model of Intact Malan Loess by X-ray Computed Tomography. Water 2023, 15, 2851. [Google Scholar] [CrossRef]
Figure 1. The Yanlong mining area. (a) Research area; (b) the Yanlong karst water system and subsystem in Henan Province; (c) the Yanlong karst water system and subsystem; (d) a plane view of the simulated area.
Water 15 03680 g001
Figure 2. Formation generalization and aquifer properties.
Water 15 03680 g002
Figure 3. (a) Parameter partition map of Shanxi formation; (b) parameter partition map of Taiyuan group.
Water 15 03680 g003aWater 15 03680 g003b
Figure 4. (a) Fitting the graph of simulated values and observed values of SJ02; (b) fitting the graph of simulated values and observed values of ZK2304.
Water 15 03680 g004
Figure 5. (a) Iso-water level map of Taiyuan Formation; (b) iso-water level map of Majiagou Formation.
Water 15 03680 g005
Figure 6. No. XII orebody map and dredging schematic diagram.
Water 15 03680 g006
Figure 7. Distribution map of virtual pumping holes and iso-water lines in Taiyuan Formation, No. XII orebody roof, Songshan Mining area.
Water 15 03680 g007
Figure 8. Distribution map of virtual pumping holes and iso-water lines in Majiagou Formation, No. XII orebody floor, Songshan Mining area.
Water 15 03680 g008
Table 1. The permeability coefficient of Taiyuan and Majiagou formations in the Yanlong mining area.
Drill HoleWater
Inflow (L/S.M)
Permeability
Coefficient
(m/d)
FormationWater Inflow
(L/S.M)
Permeability
Coefficient
(m/d)
Formation
ZK134080.3070.4893P1t0.16431.4033O2m
ZK146060.0470.21240.03310.1763
ZK126080.1710.28380.02820.1227
ZK158120.1010.14350.06060.2493
ZK158020.5470.81250.01610.0588
ZK96060.03930.06480.006680.0174
ZK23040.6350.95380.02950.1283
ZK41080.03920.04890.04110.1682
Table 2. Average groundwater level changes and parameter sensitivity indices.
ParameterAverage Water Level Change in Observation Well (m)M
−20%−10%−5%0%5%10%20%
K 1.35860.70140.24710−0.1128−0.2386−0.67145.7
μ −0.4114−0.2986−0.147100.17180.33570.67962.4
Rainfall−0.0443−0.0186−0.001400.01570.03290.07570.2
S s −0.0691−0.0457−0.015700.01140.00710.01140.1
Table 3. Comparative evaluation of measured and simulated values.
BoreholeEvaluation Index
R 2 E n s P B I A S
SJ020.890.881.72
ZK23040.900.88−0.62
ZK96060.910.73−1.70
ZK134080.850.833.39
ZK41080.780.72−4.92
ZK71000.820.803.92
Table 4. Hydrogeological parameters after model identification and validation.
NumberFormationParameter PartitionHorizontal
Permeability
Coefficient (m/d)
Vertical
Permeability
Coefficient (m/d)
Storage
Coefficient (1/m)
Gravity-
Specific
Yield (1/m)
1Q + N 121.20.2
2P1-2s 0.00120.000120.000011
3P1s1–71.20.120.00001
80.40.040.000012
4P1t10.190.0190.000015
20.530.0530.000015
30.280.0280.000015
40.40.040.000015
5C2b 0.000150.0000150.000011
6O2m 2.60.260.000030
Table 5. Water inflow forecast by large well method in Taiyuan Formation (P1t) aquifer.
XII Ore Body
Parameters
K (m/d)H (m)M (m)F (km2)R (m)r0 (m)R0 (m)Q (m3/d)
Taiyuan Formation0.40498.7299.702.283154.00853.004007.0072,786.66
Table 6. Properties and water inflow of pumping well of Taiyuan Formation P1t aquifer.
Virtual Pumping WellX CoordinateY CoordinateFloor Elevation of
Taiyuan Formation (m)
Water Inflow (m3/d)Formation
T11397,9663,824,53297−1900P1t
T9397,1053,824,55066−1800
T6397,1533,825,038−68−5000
T8397,9423,824,942−11−5000
T7397,5513,824,960−42−5000
T10397,5153,824,55066−1300
T3396,3043,825,523−207−1100
T1395,3373,825,162−158−8500
T2396,1153,825,217−144−9000
T5396,8463,825,177−110−6000
T4396,8383,825,429−160−7000
T12395,6613,825,424−189−10,000
The total water inflow −71,500 m3/dP1t
Table 7. Properties and water inflow of pumping well of Majiagou Formation O2m aquifer.
Virtual
Pumping Well
X CoordinateY CoordinateBenxi Formation Floor
Elevation (m)
Minimum Inflow (m3/d)Critical Safe Water Level (m)Normal
Inflow (m3/d)
Maximum Inflow (m3/d)
T11397,9663,824,53284−50060−300−420
T9397,1053,824,55060−50036−300−420
T6397,1533,825,038−75−4000−99−3000−4200
T8397,9423,824,942−22−4500−46−4800−6720
T7397,5513,824,960−60−4000−84−3500−4900
T10397,5153,824,55037−50013−200−280
T3396,3043,825,523−216−12,000−240−12,500−17,500
T1395,3373,825,162−165−8000−189−9850−13,790
T2396,1153,825,217−151−6000−175−6650−9310
T5396,8463,825,177−117−5000−141−4800−6720
T4396,8383,825,429−167−5000−191−5500−7700
T12395,6613,825,424−196−7600−220−7600−10,640
The total water inflow −57,600 m3/d −59,000 m3/d−82,600 m3/d
Disclaimer/Publisher’s Note: The statements, opinions and data contained in all publications are solely those of the individual author(s) and contributor(s) and not of MDPI and/or the editor(s). MDPI and/or the editor(s) disclaim responsibility for any injury to people or property resulting from any ideas, methods, instructions or products referred to in the content.

