A Survey Method for Drift Ice Characteristics of the Yellow River Based on Shore-Based Oblique Images
Abstract
:1. Introduction
2. Drift Ice Survey
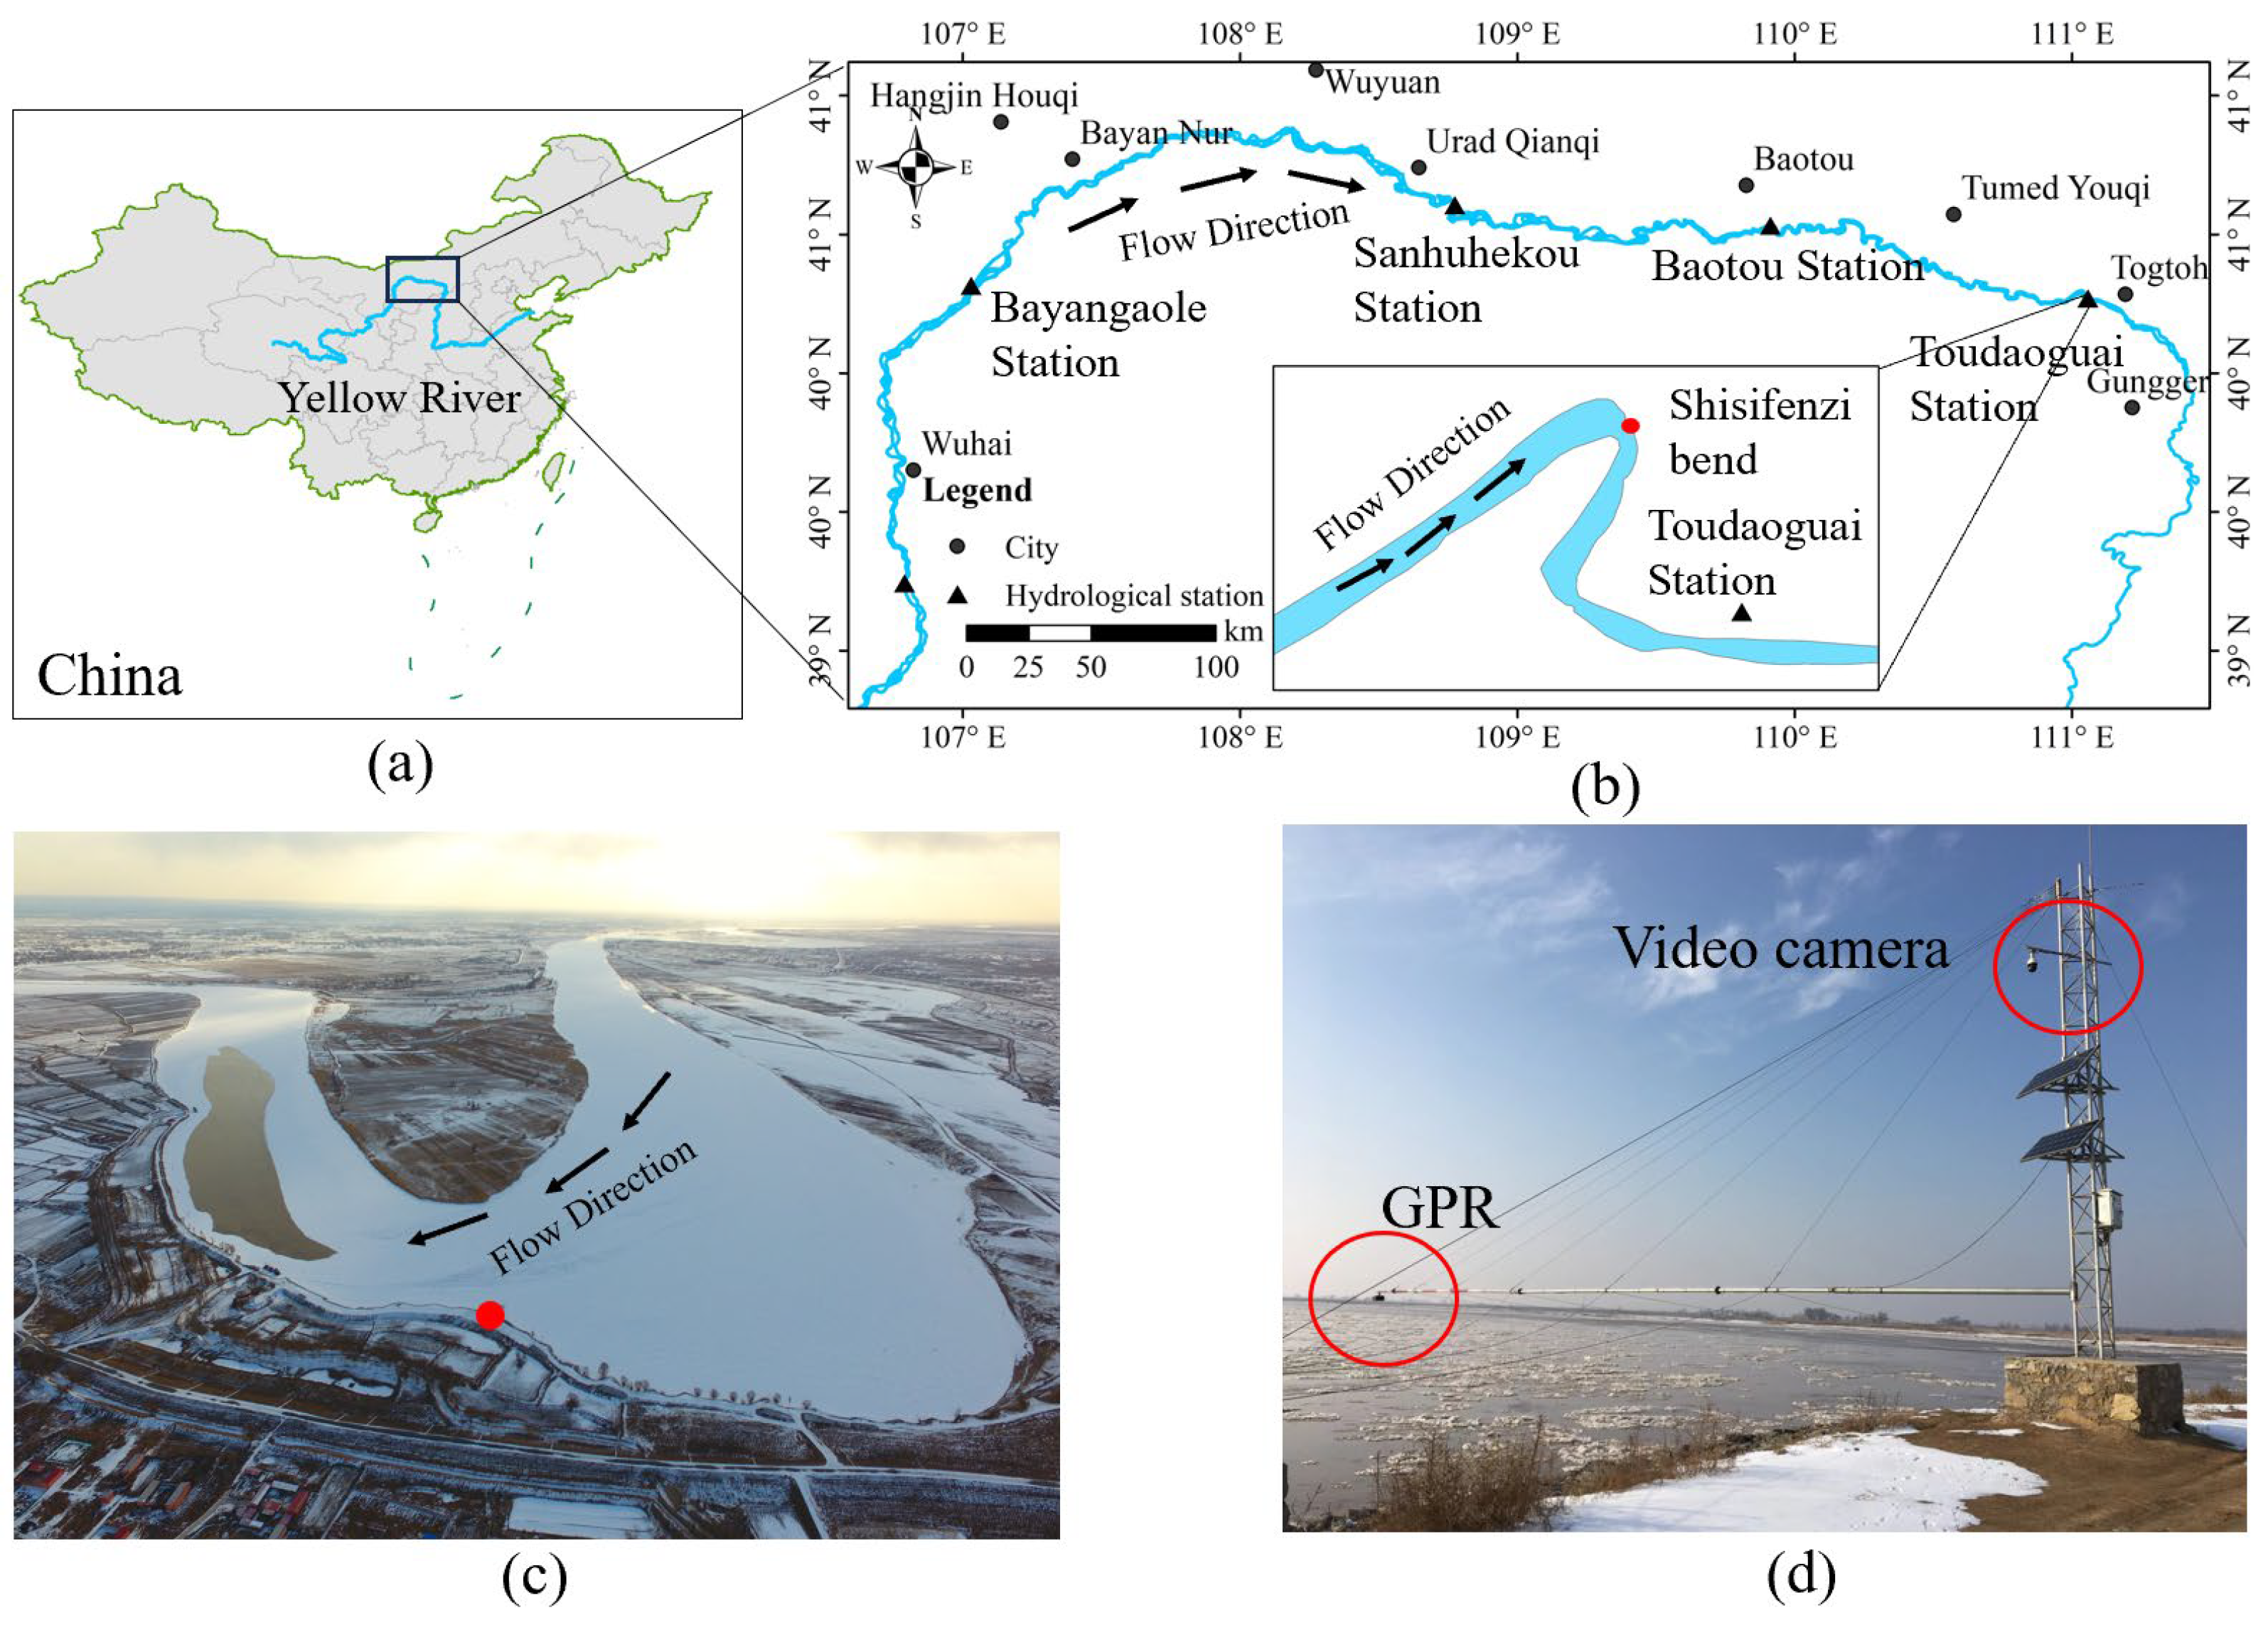
2.1. Study Area and Monitoring Device
2.2. Image Acquisition
3. Oblique Image Orthorectification Method and Calculation of Drift Ice Parameters
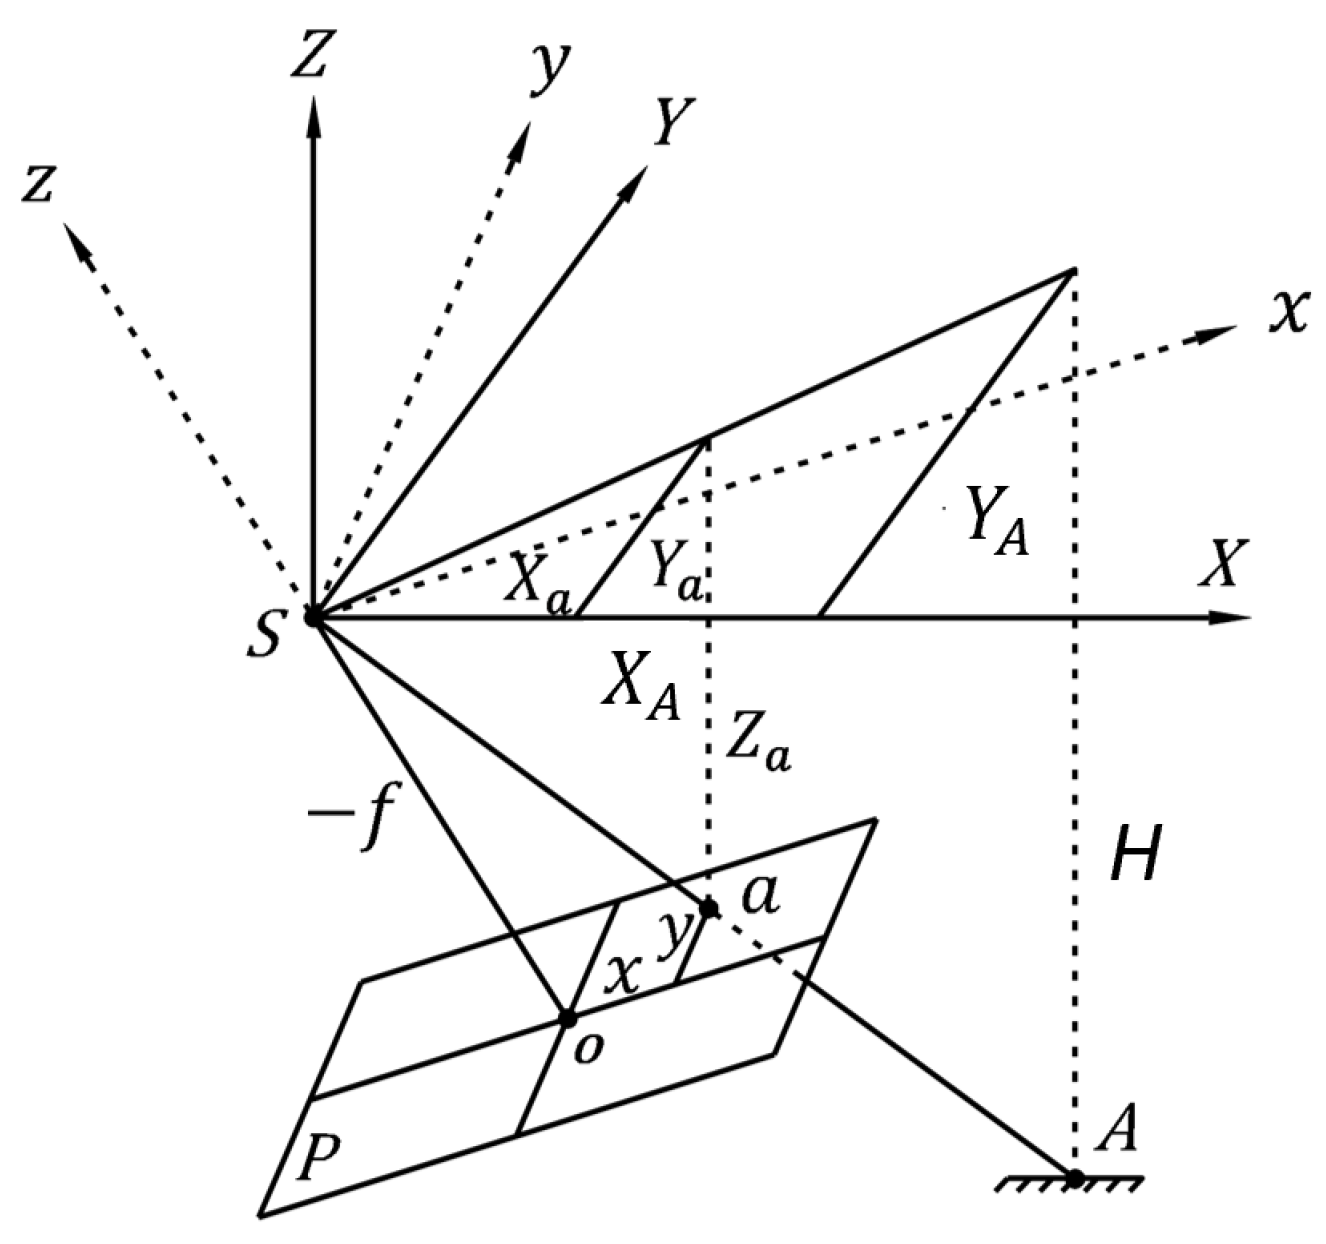
3.1. Basics of Photographic Images
3.2. Pixel Point Scale Method
3.3. In-Site Calibration and Parameters Fitting
3.4. Image Correction Steps
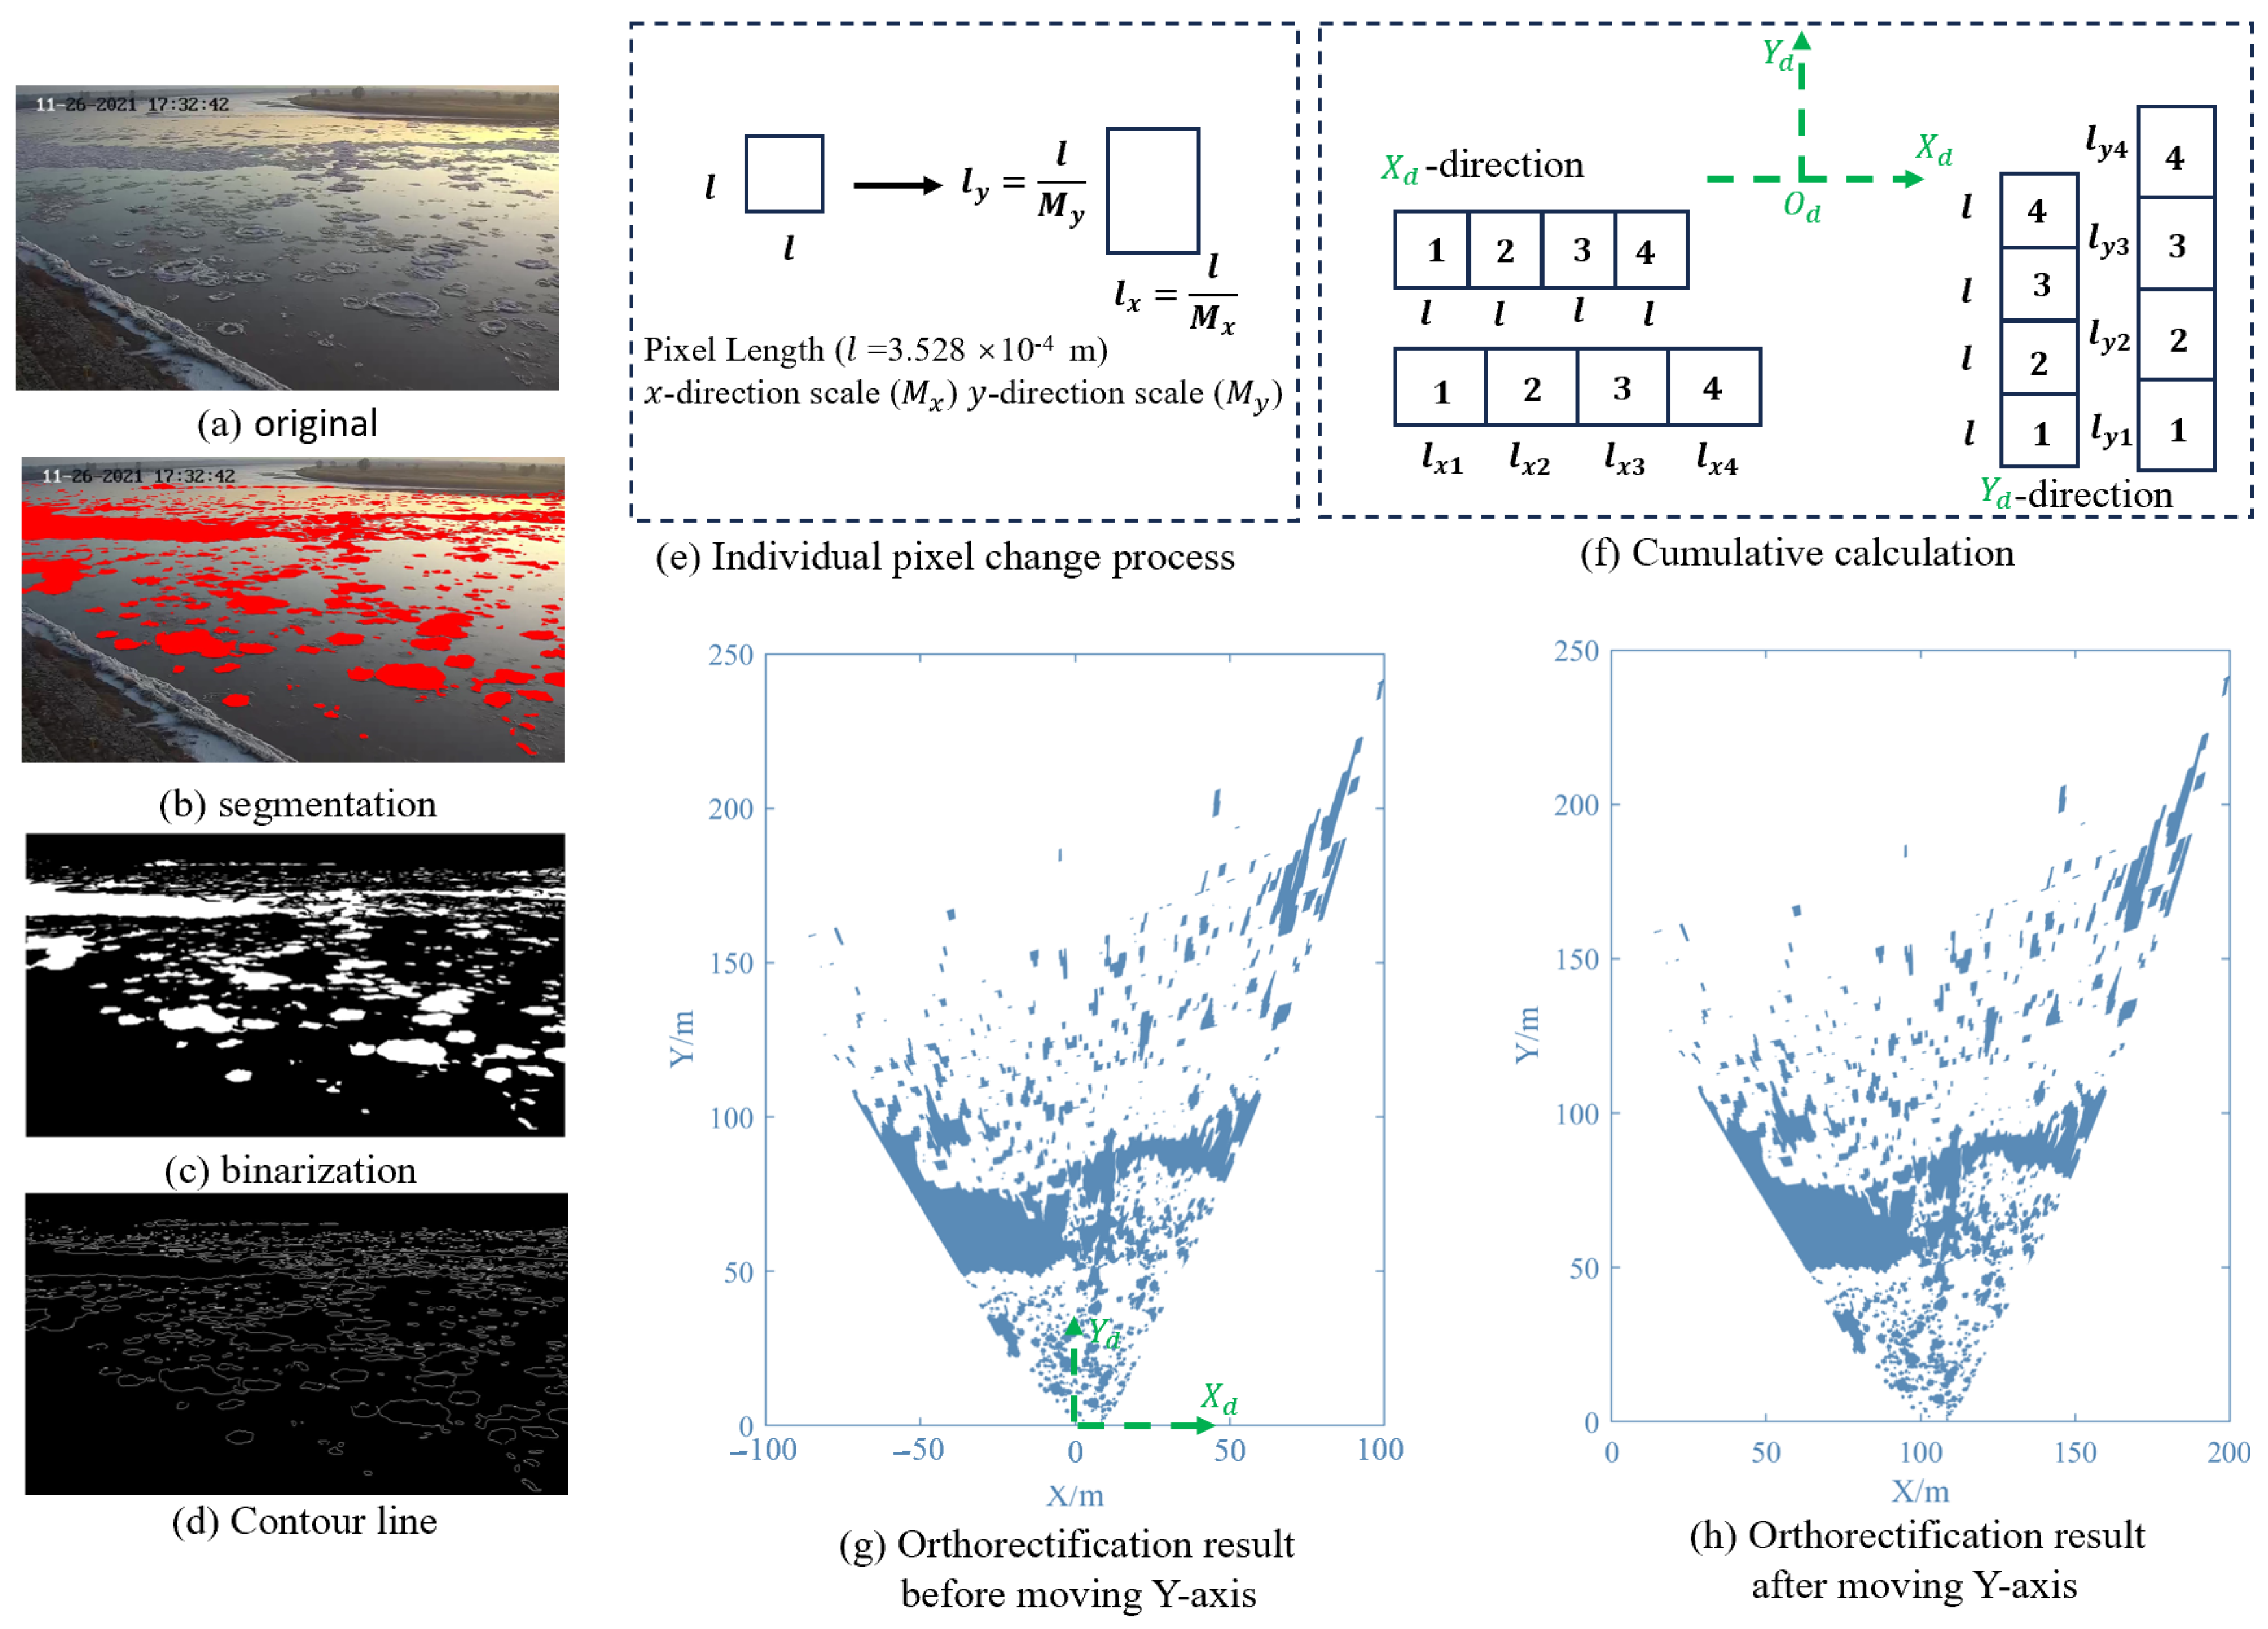
- Drift ice segmentation. Initially, we automatically used the thresholding method to segment drift ice in the original image (Figure 6a). However, some drift ice cannot be segmented because their grey is similar to the grey of water due to light at different time and drift ice thickness. The thinner drift ice is similar in grey to the water. In order to segment completely drift ice, we use Photoshop software (version: CS5) to draw all the drift ice marked in red, as shown in Figure 6b.
- Image binarization. Based on the red drift ice, we use the global threshold method in MATLAB software (version: R2021a) to convert images to binarization, as shown in Figure 6c.
- Based on the binarization image, the pixel coordinates of the contour line of each drift ice are extracted based on the binarization image, as shown in Figure 6d.
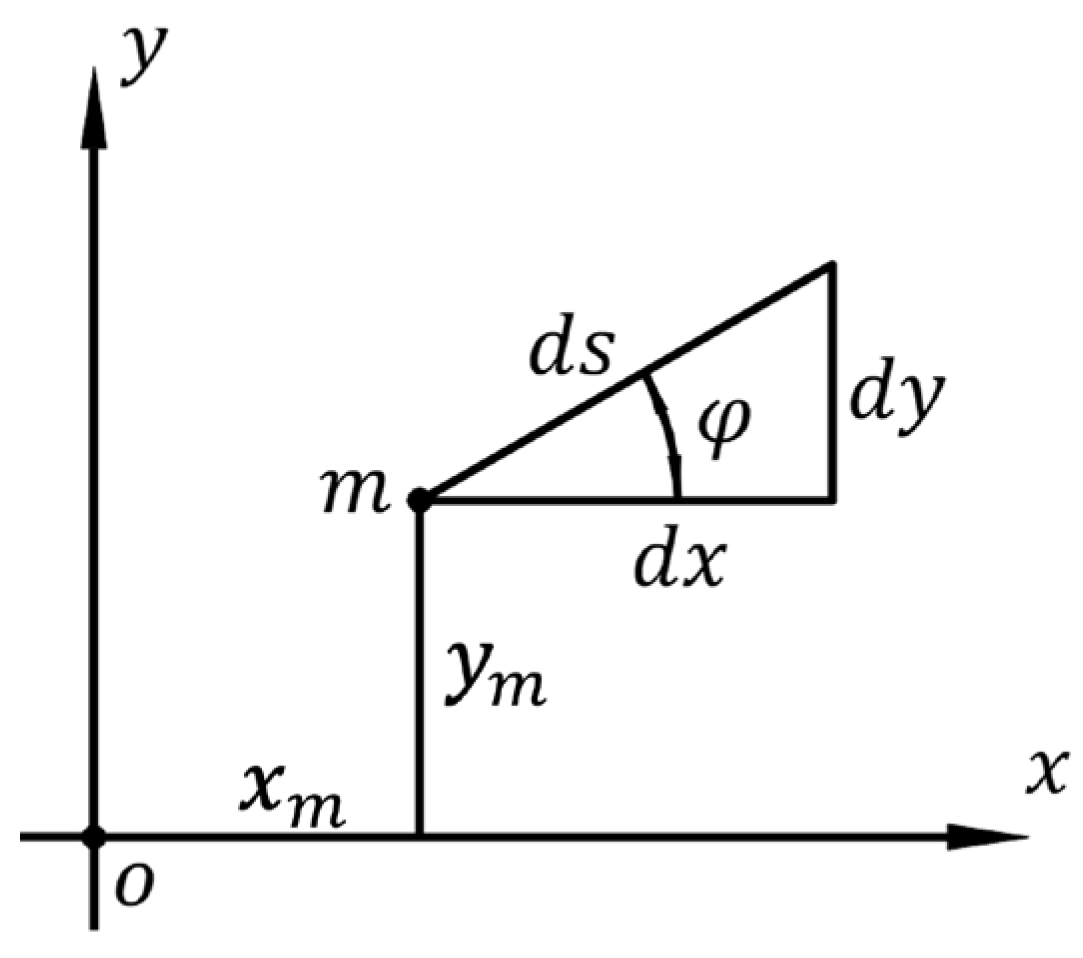
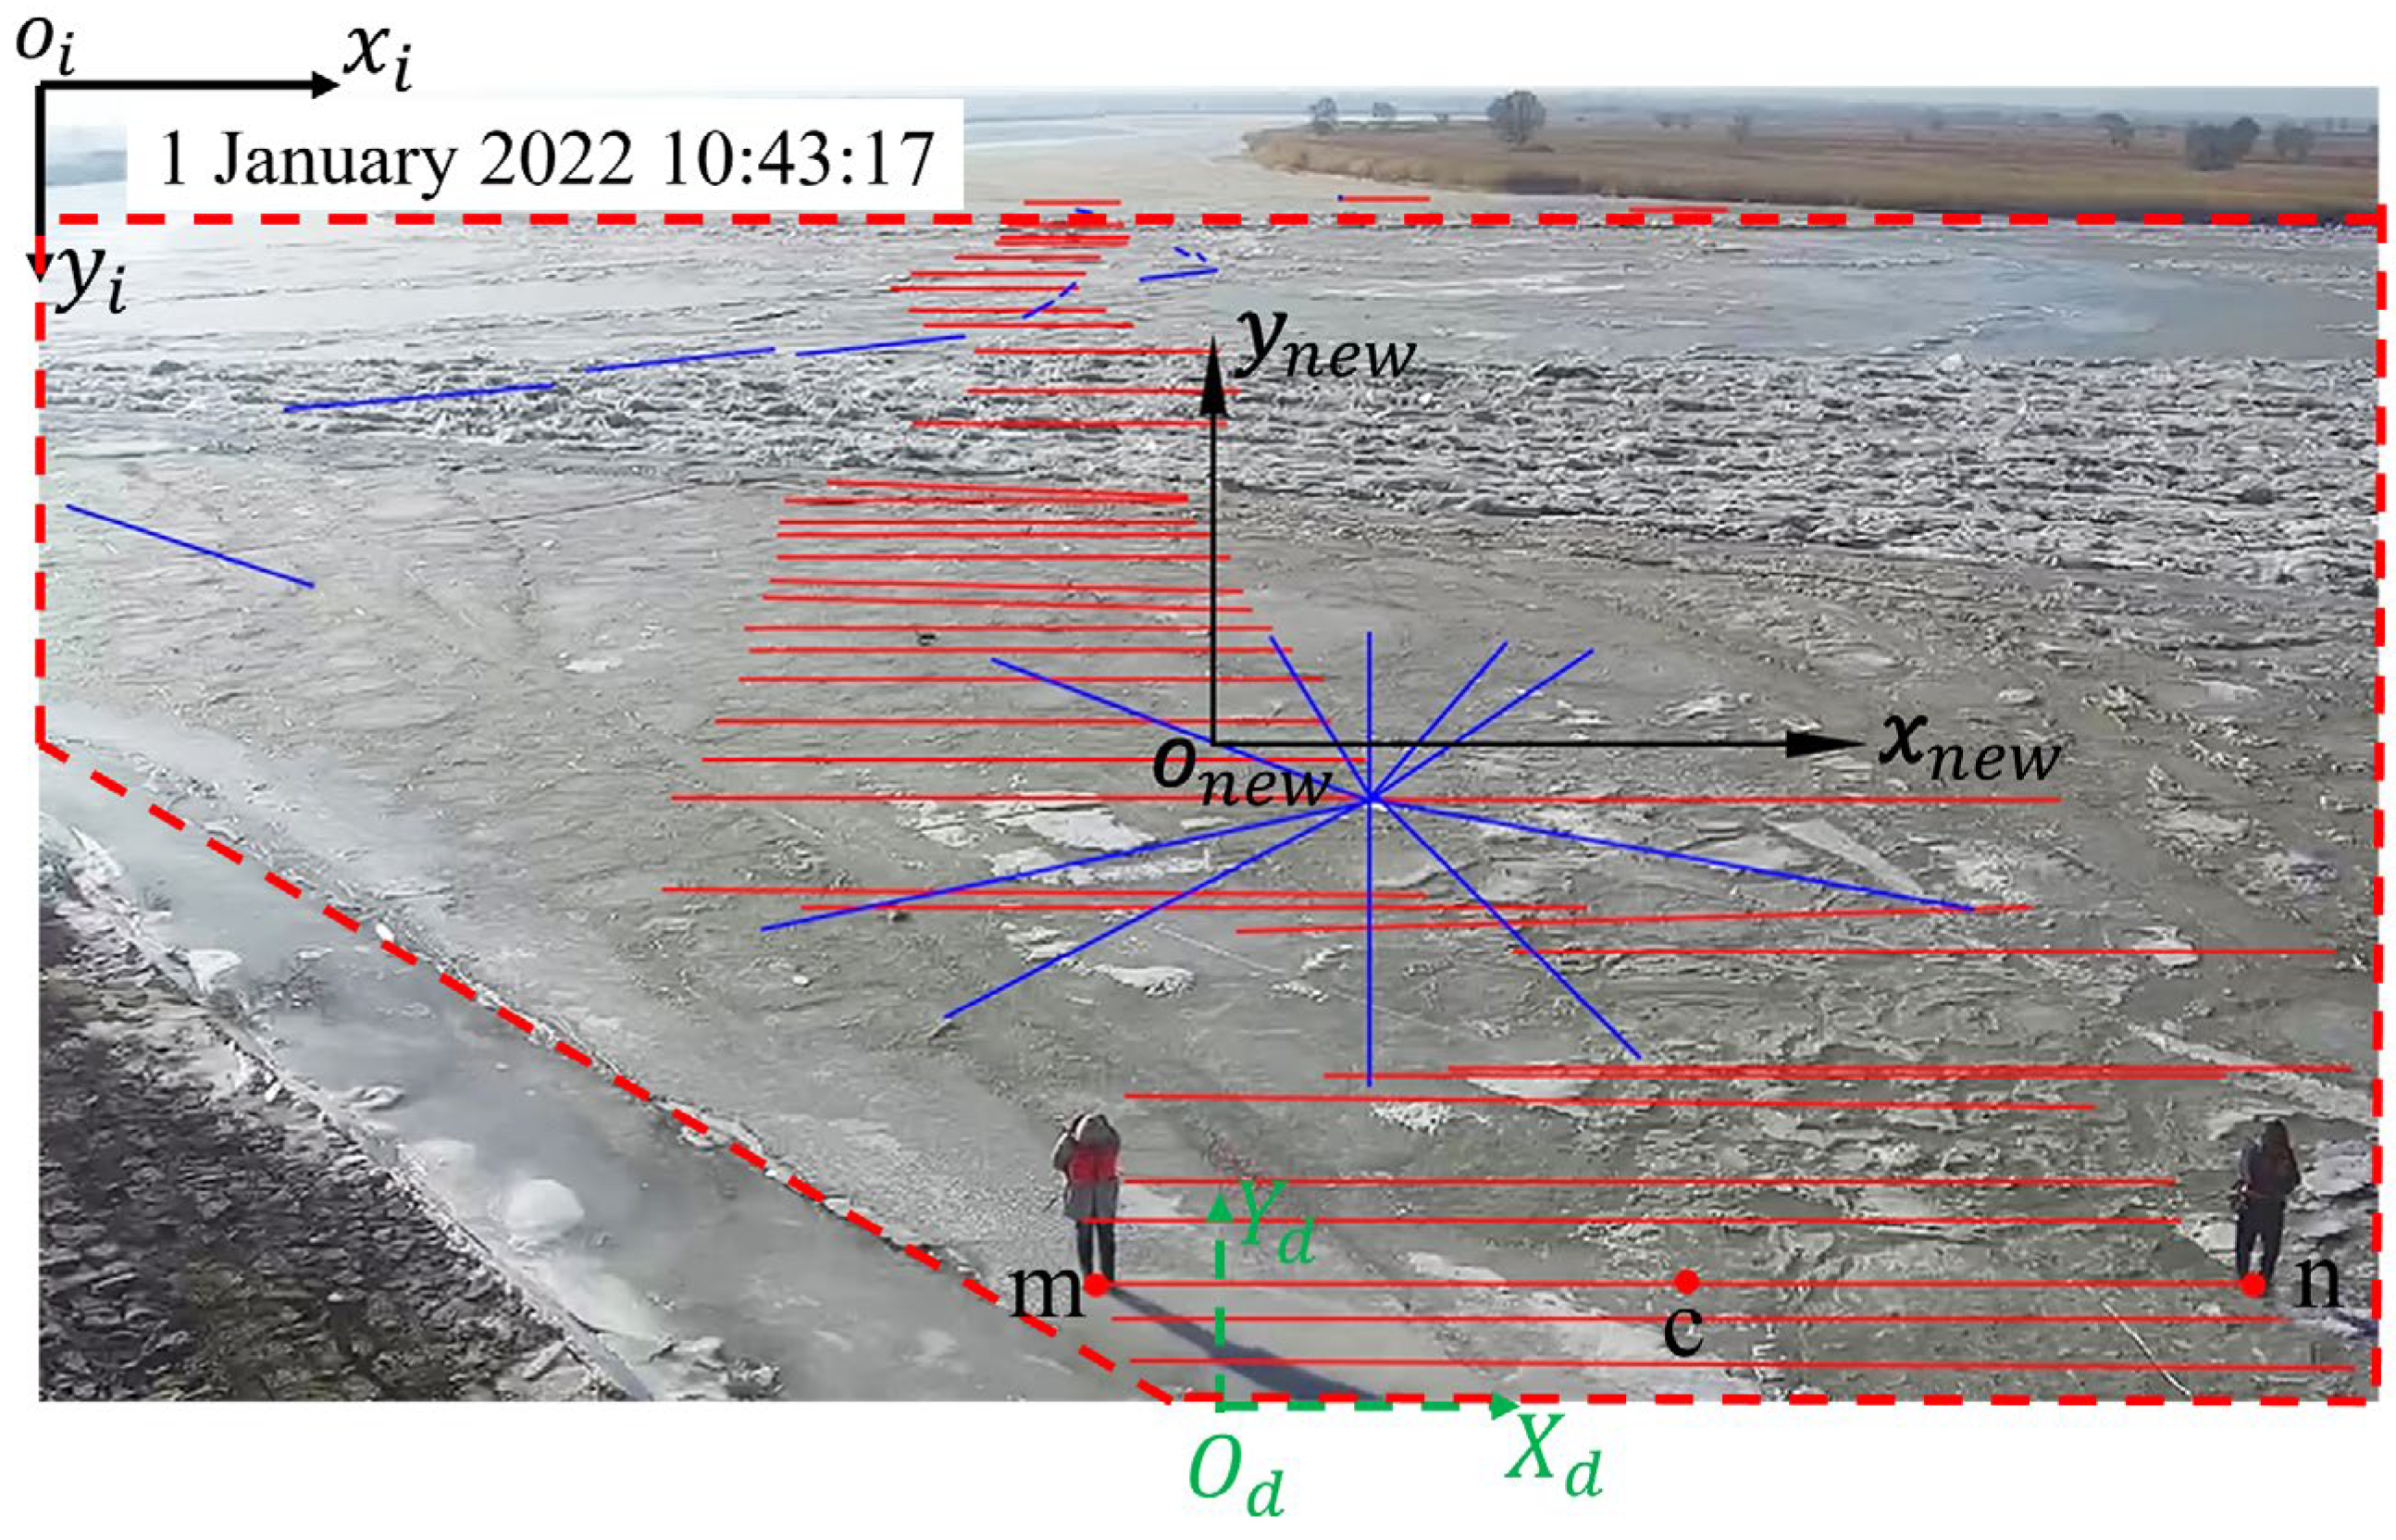
- These pixel coordinates are converted to the new coordinate system where the coordinate origin is the center of image (Figure 5). The original image is 1280 pixels wide and 720 pixels high. The side length () of each pixel is 3.528 × 10⁻⁴ m. Equation (24) is the conversion method for the new coordinate system.where ) is the default original coordinate; ) is the transformed coordinate, as shown in Figure 5.
- The calculation of the pixel point scale and . Each is brought into Equations (22) and (23) to calculate the pixel scale and in the direction and direction, respectively.
- The true length of individual pixels need be calculated by Equation (25), as shown in Figure 6e.where is the true length after correction in the -direction; is the true length after correction in -direction; is individual pixel length; and are the pixel scale.
- Orthorectification result. Figure 6g shows the orthorectification result of cumulation calculation. In order to avoid negative value, the Y-axis is moved to the left edge of the image, i.e., all pixels are added by 100 m in X-axis, as shown in Figure 6h. The final orthorectification image is shown in Figure 6h.
3.5. Calculation of Drift Ice Parameters
- Area (). In order to accurately calculate the parameter of individual drift ice, the separate and well-defined drift ice are manually selected and painted red in the Photoshop software. After image orthorectification, each drift ice is segmented and numbered, and the area is calculated in the Image J software (version: 1.1), which is also used to automatically calculate , , , and .
- Perimeter (). Counting the length of the pixel paths around the edge of drift ice.
- Equivalent diameter (). This equivalent diameter is known as the average Ferret diameter or average caliper diameter. Rothrock and Thorndike [49] and Lu et al. [50] introduced the measurements, namely measuring the distance between two parallel lines that are set against the drift ice’s sidewall. It can be directly calculated in the Image J software.
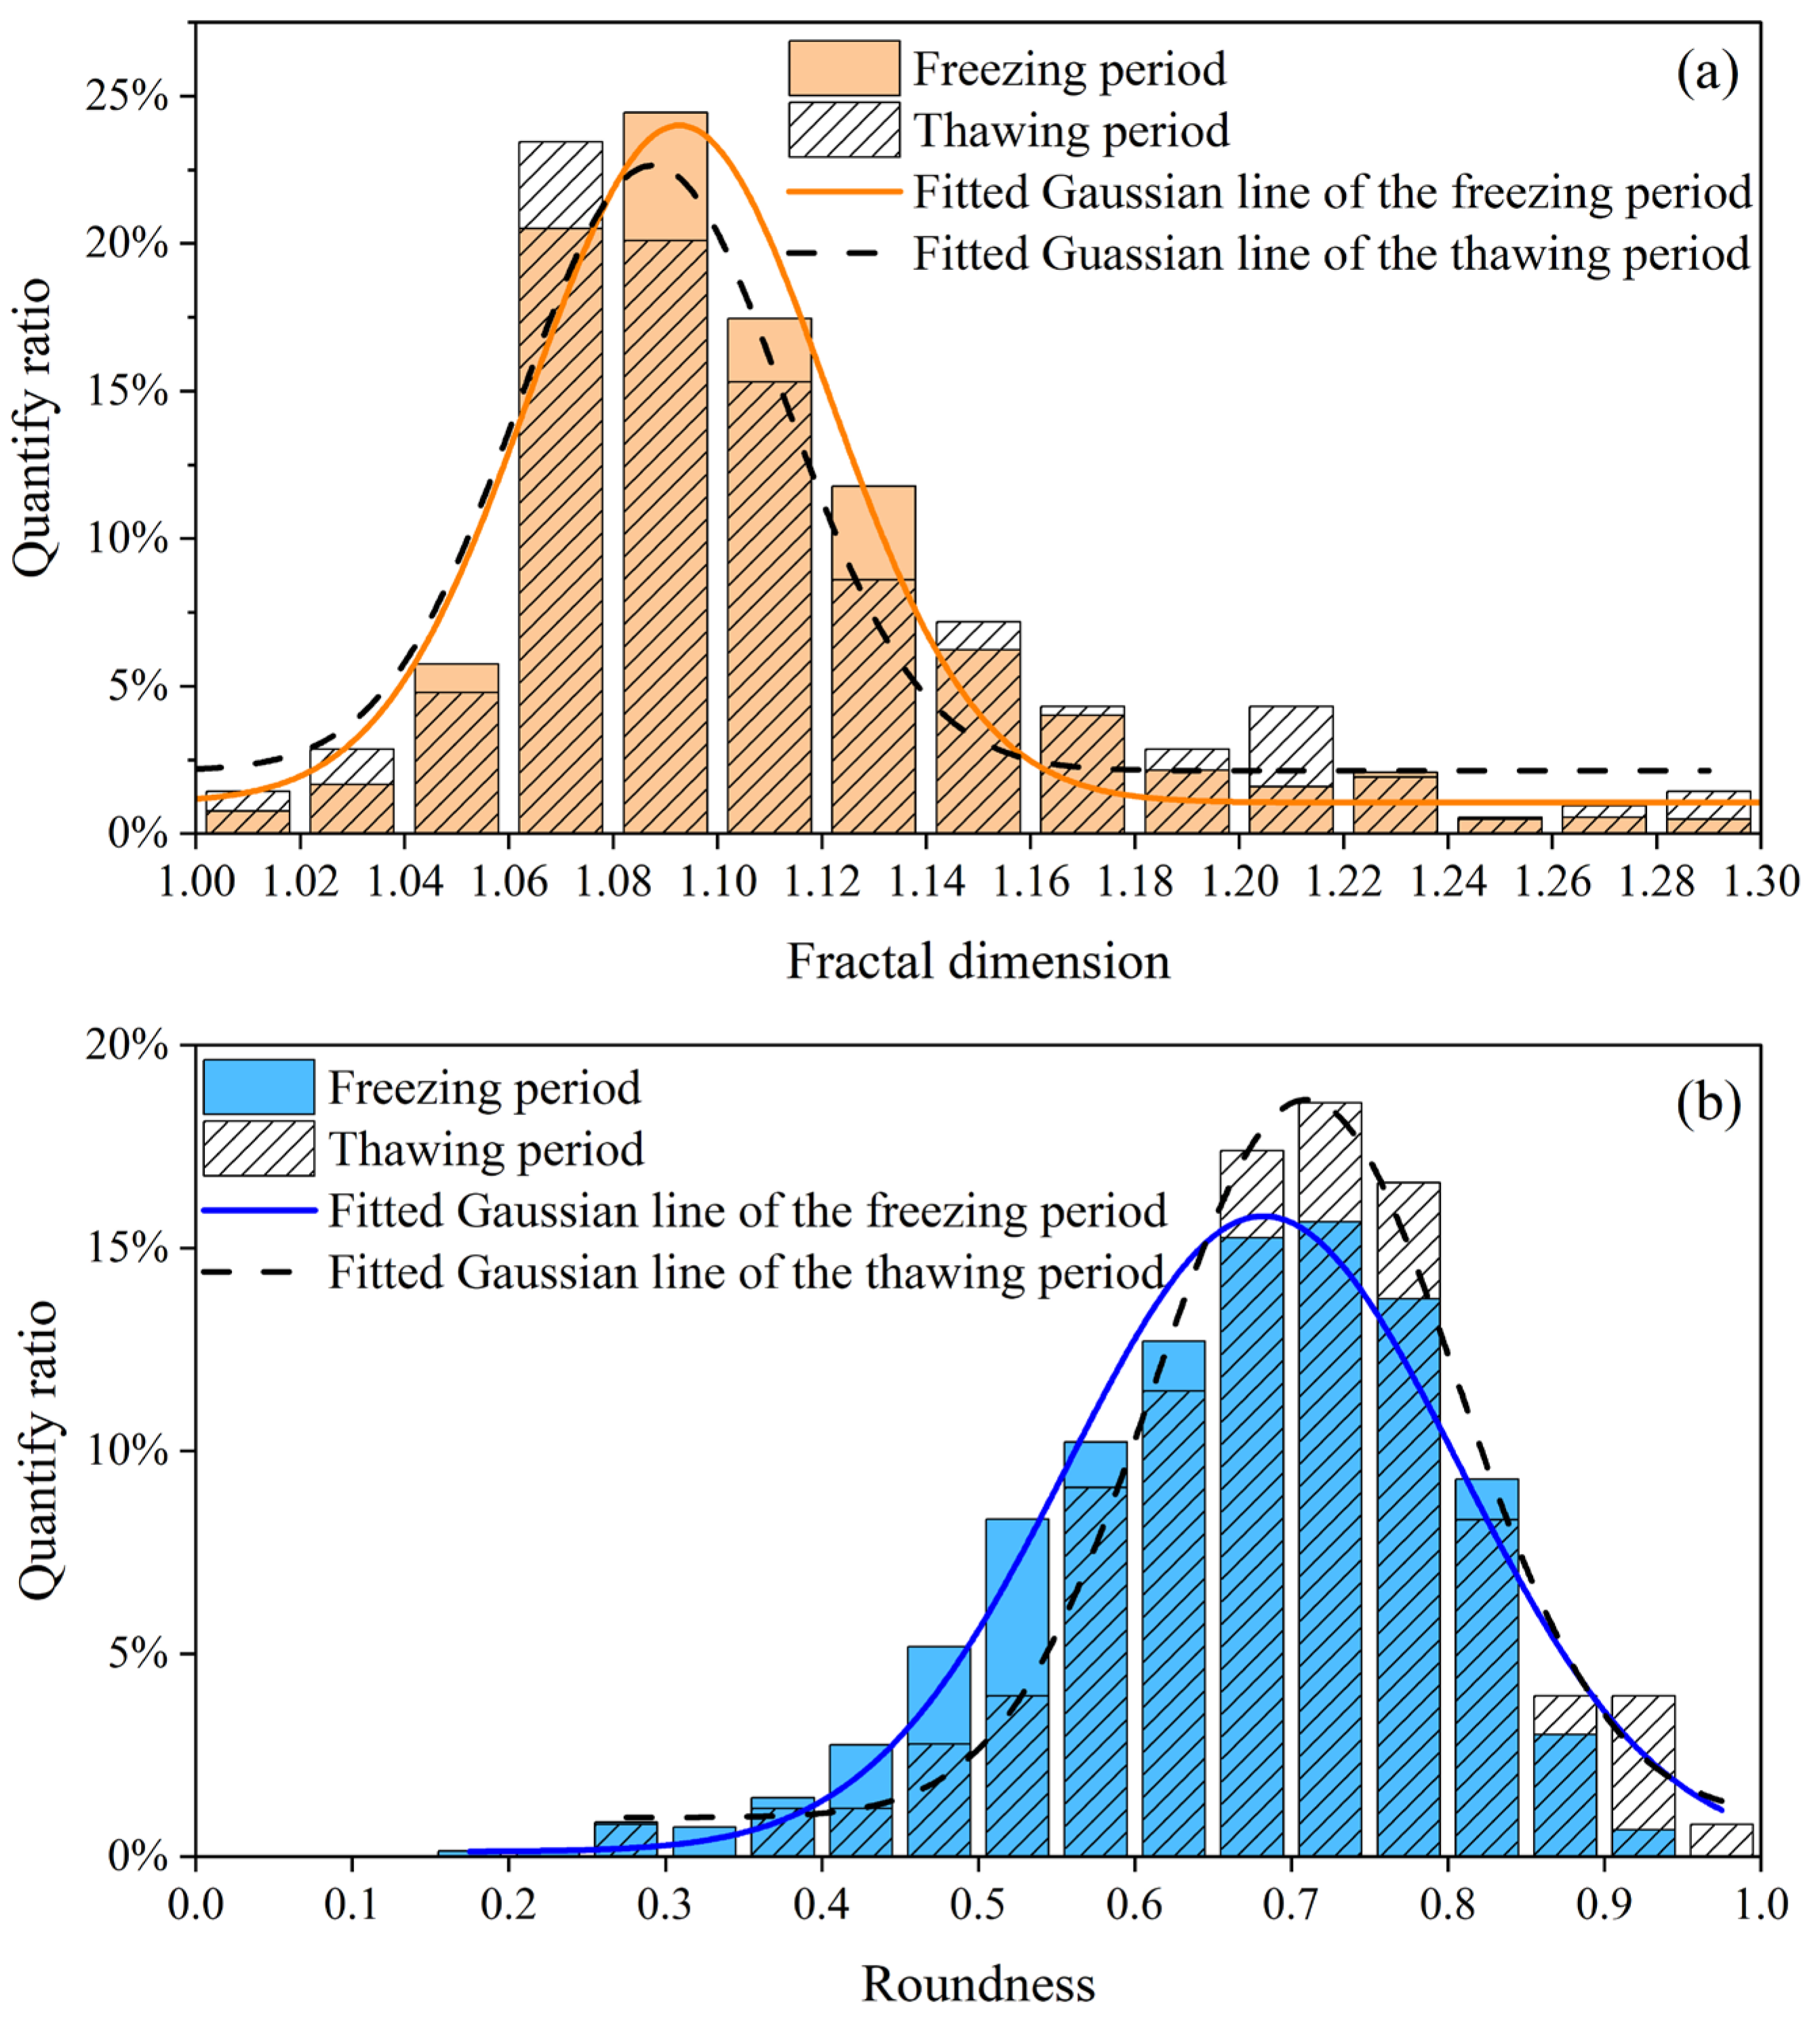
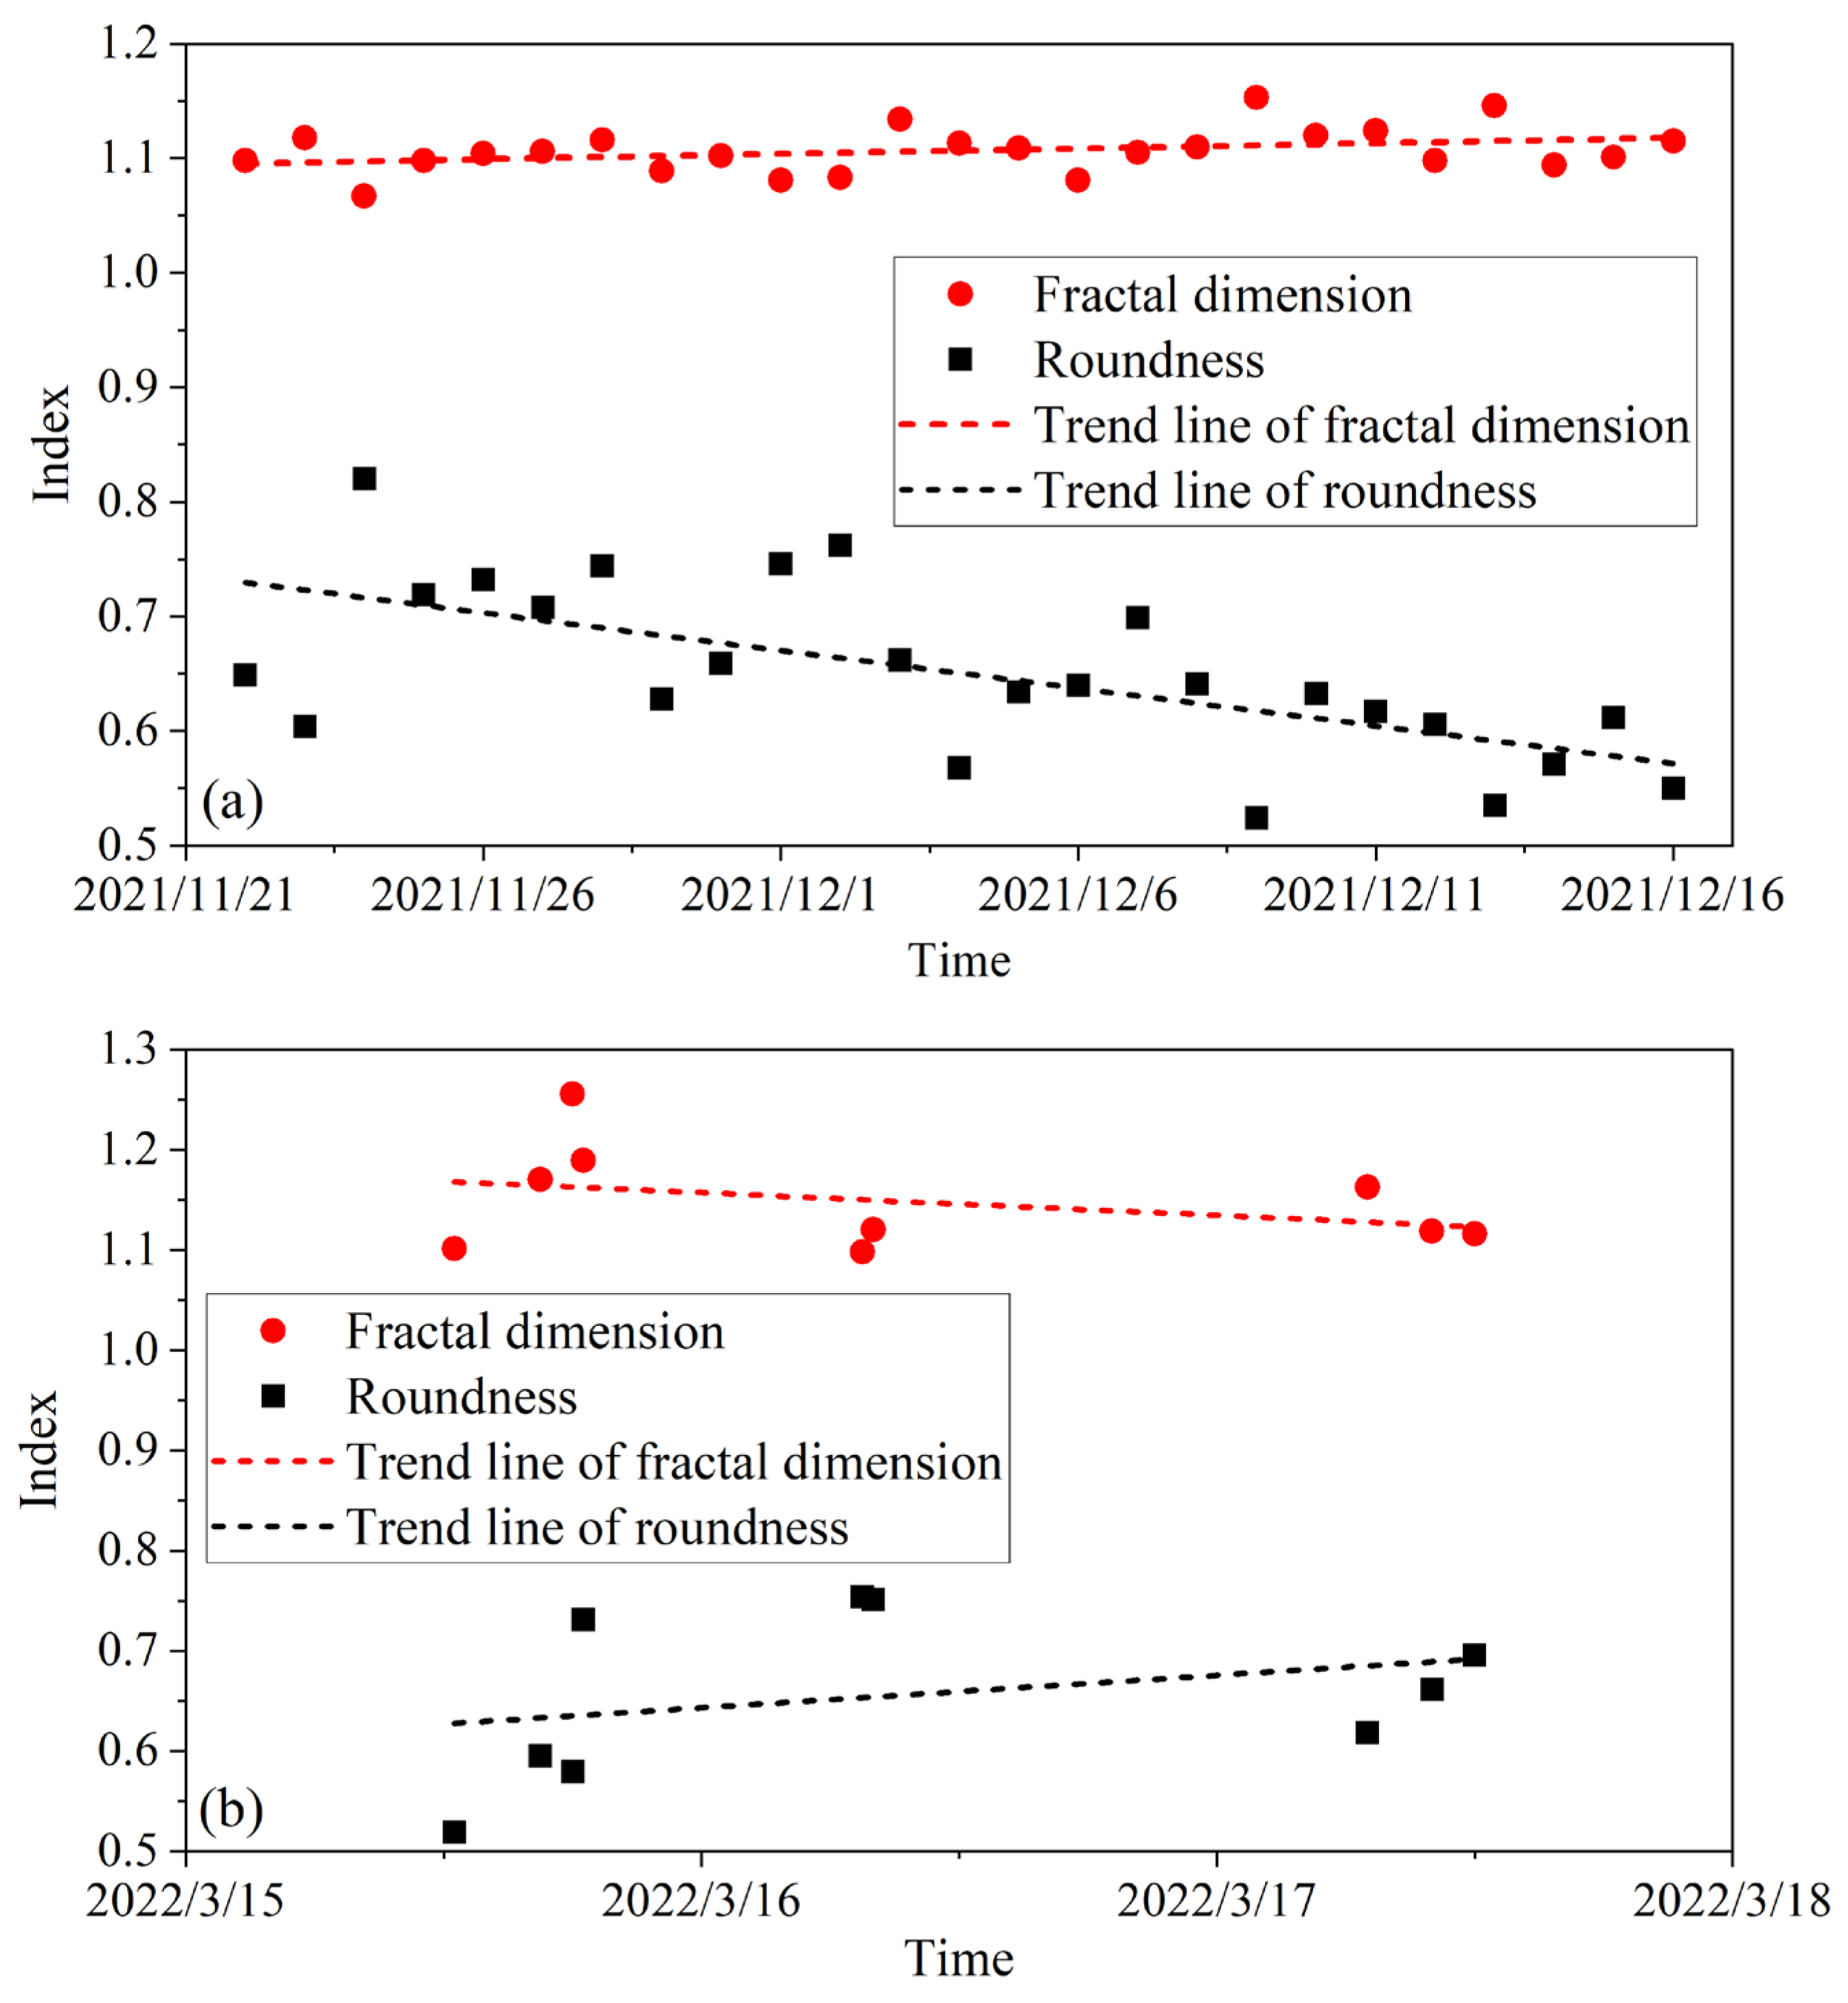
- Roundness (). Equation (26) is its calculation formula. When = 1, drift ice is circular. The closer is to 1, the more circular the drift ice.
- Fractal dimension (). Since pieces of drift ice can collide with each other, the fractal dimension is used to characterize the complexity and roughness of drift ice. This paper used the box-counting method [51,52] to calculate fractal dimension. It can be directly calculated in the Image J software. The larger the , the more curved the drift ice boundary [53].
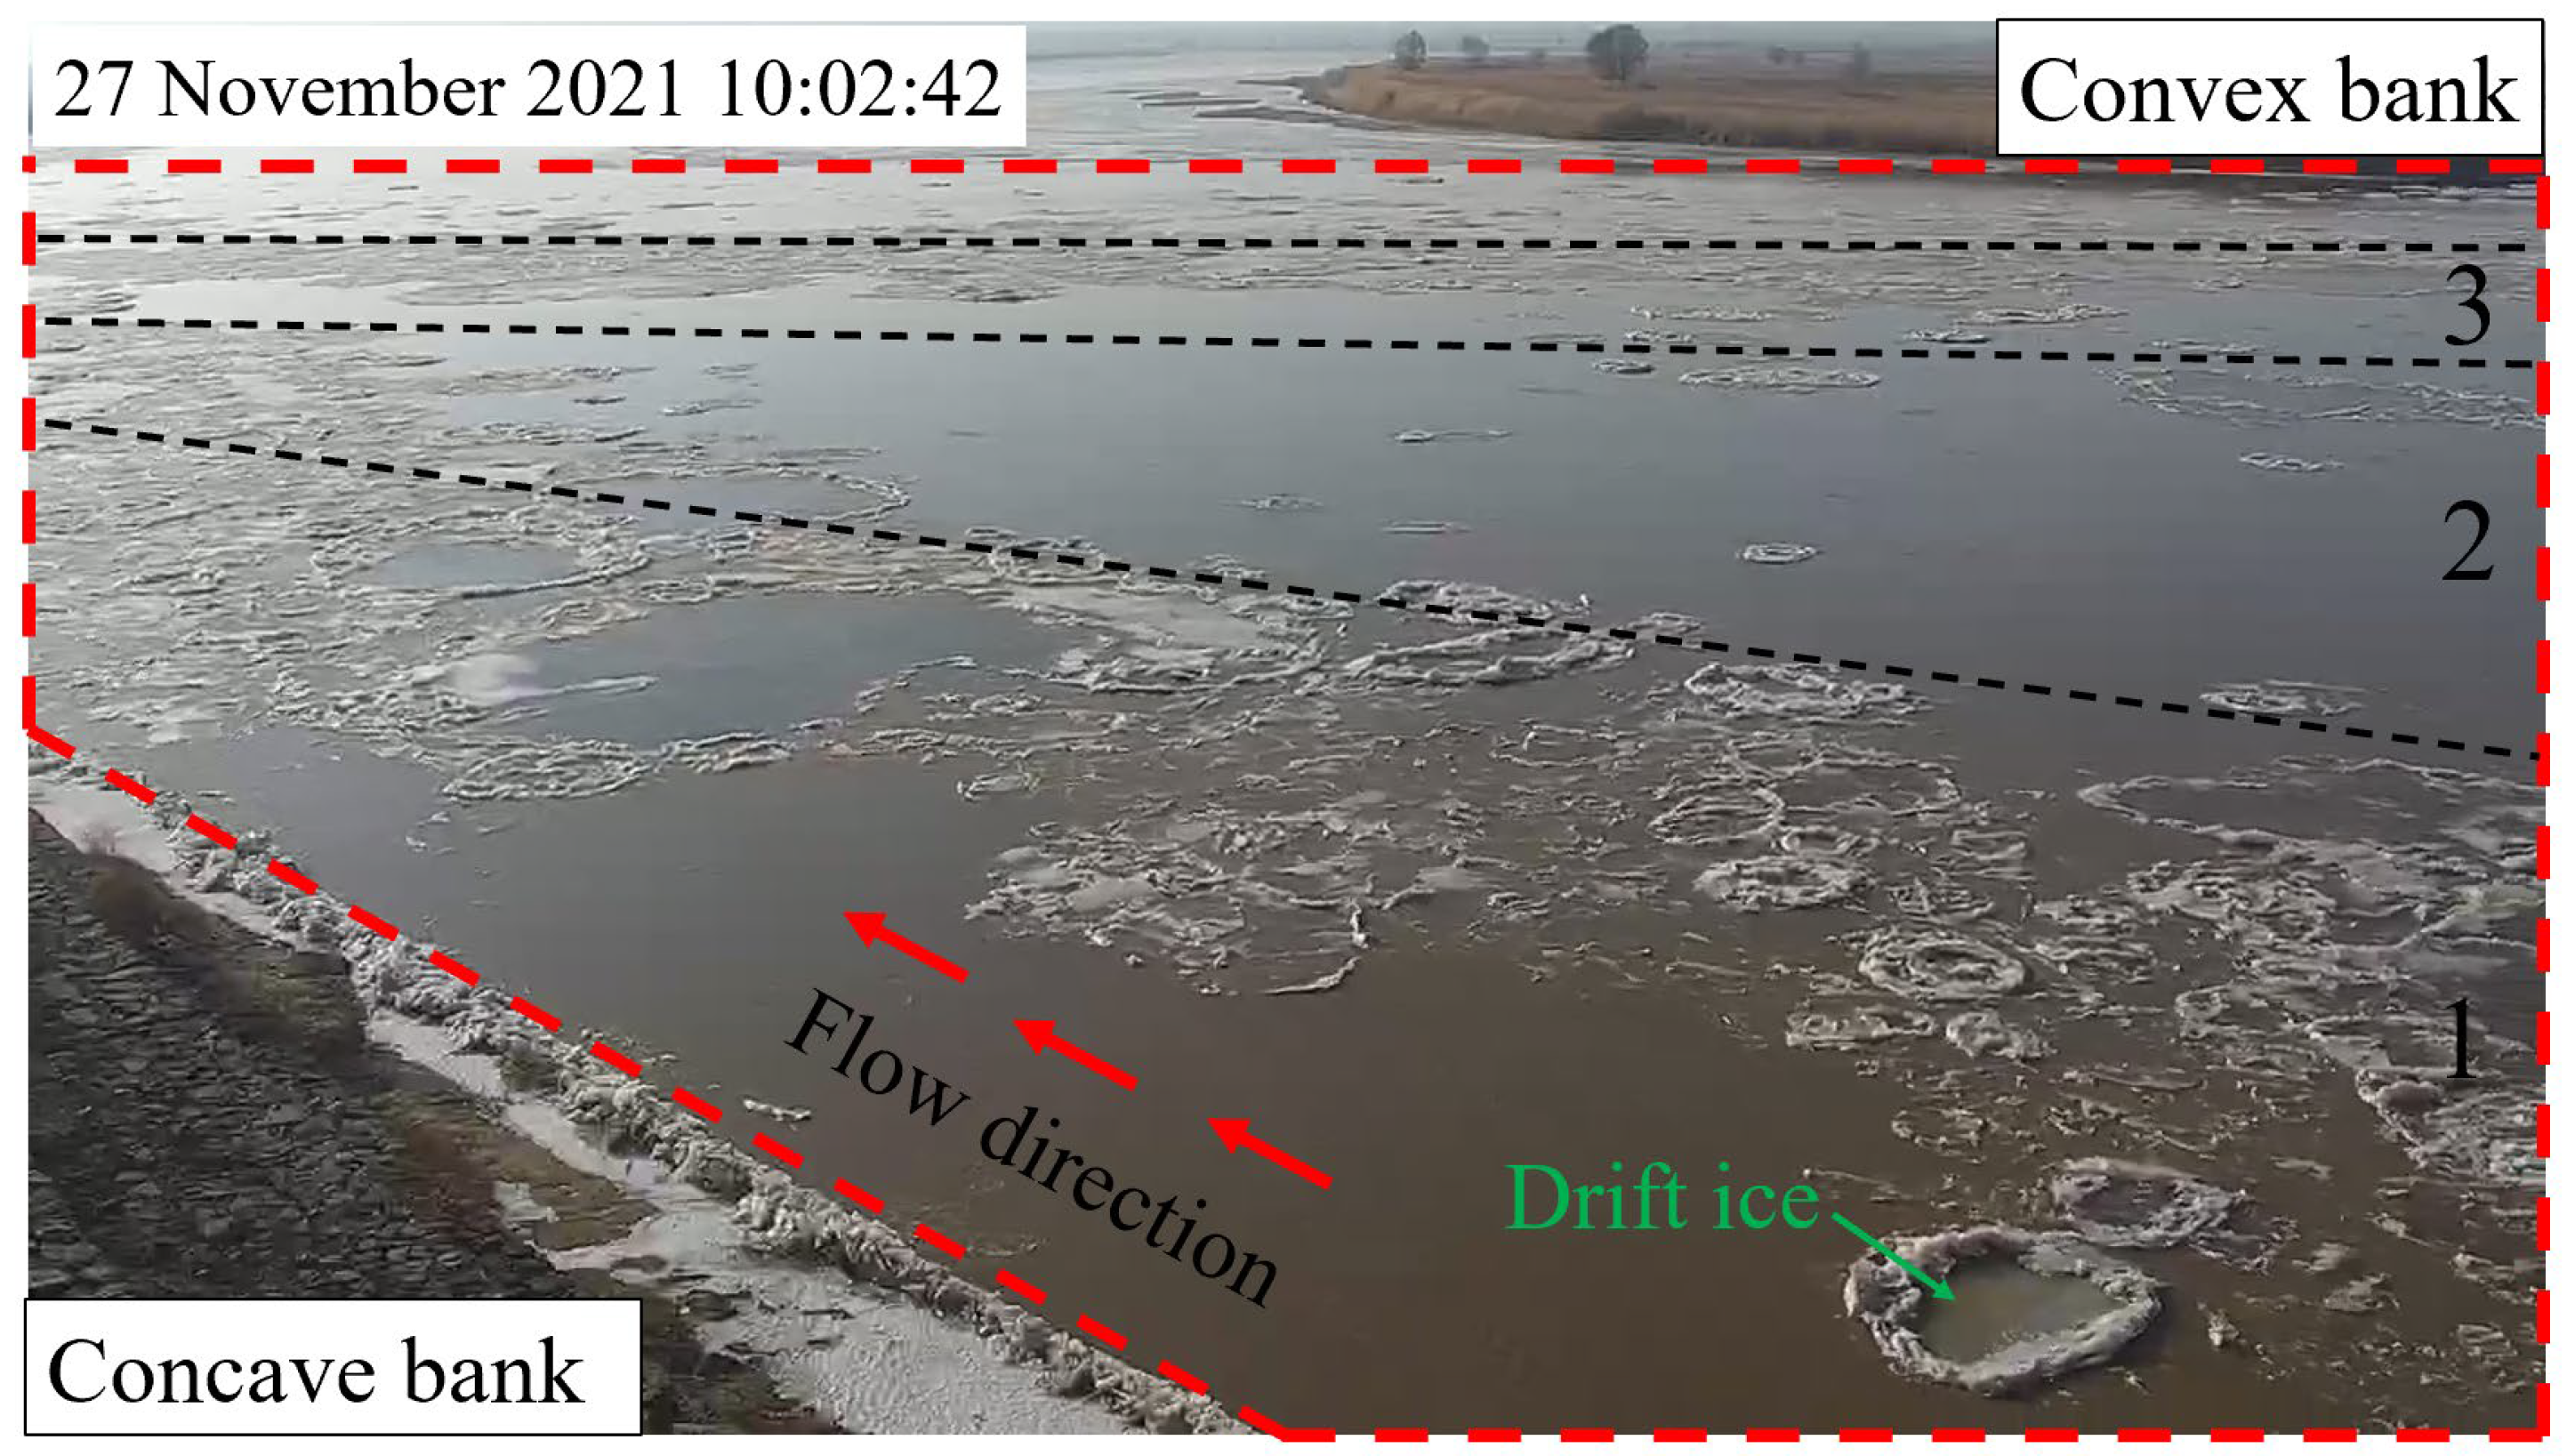
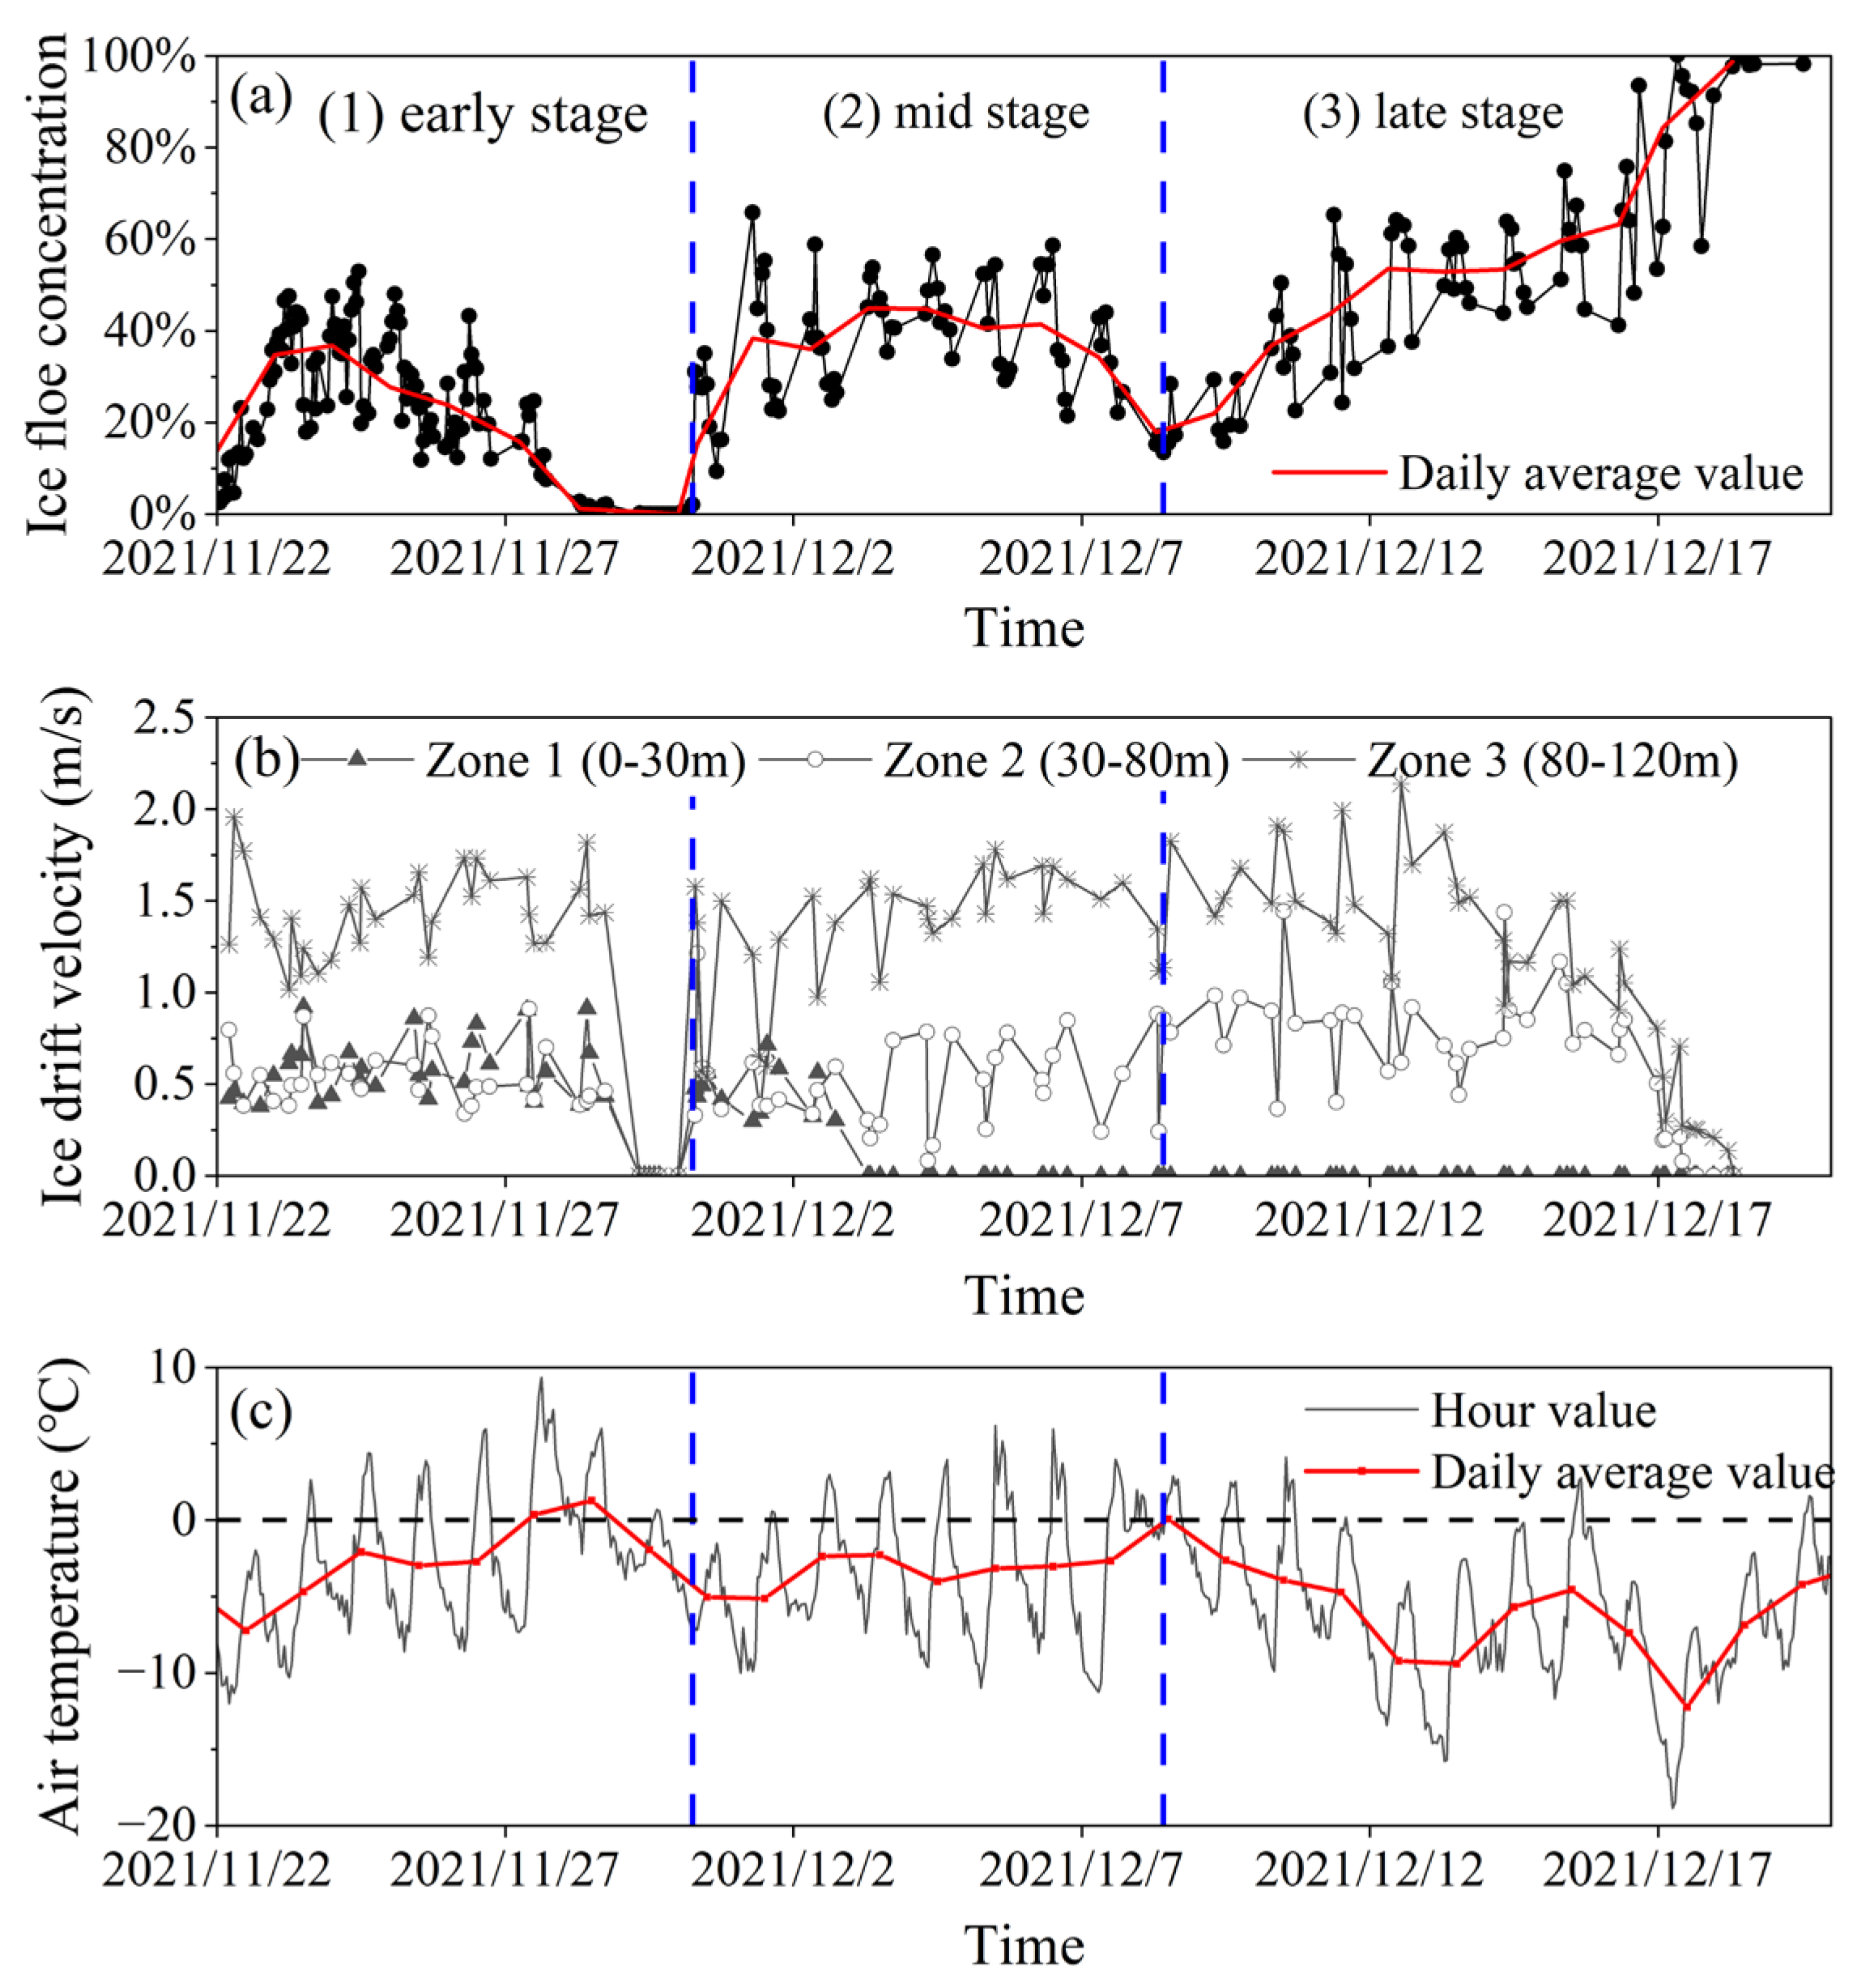
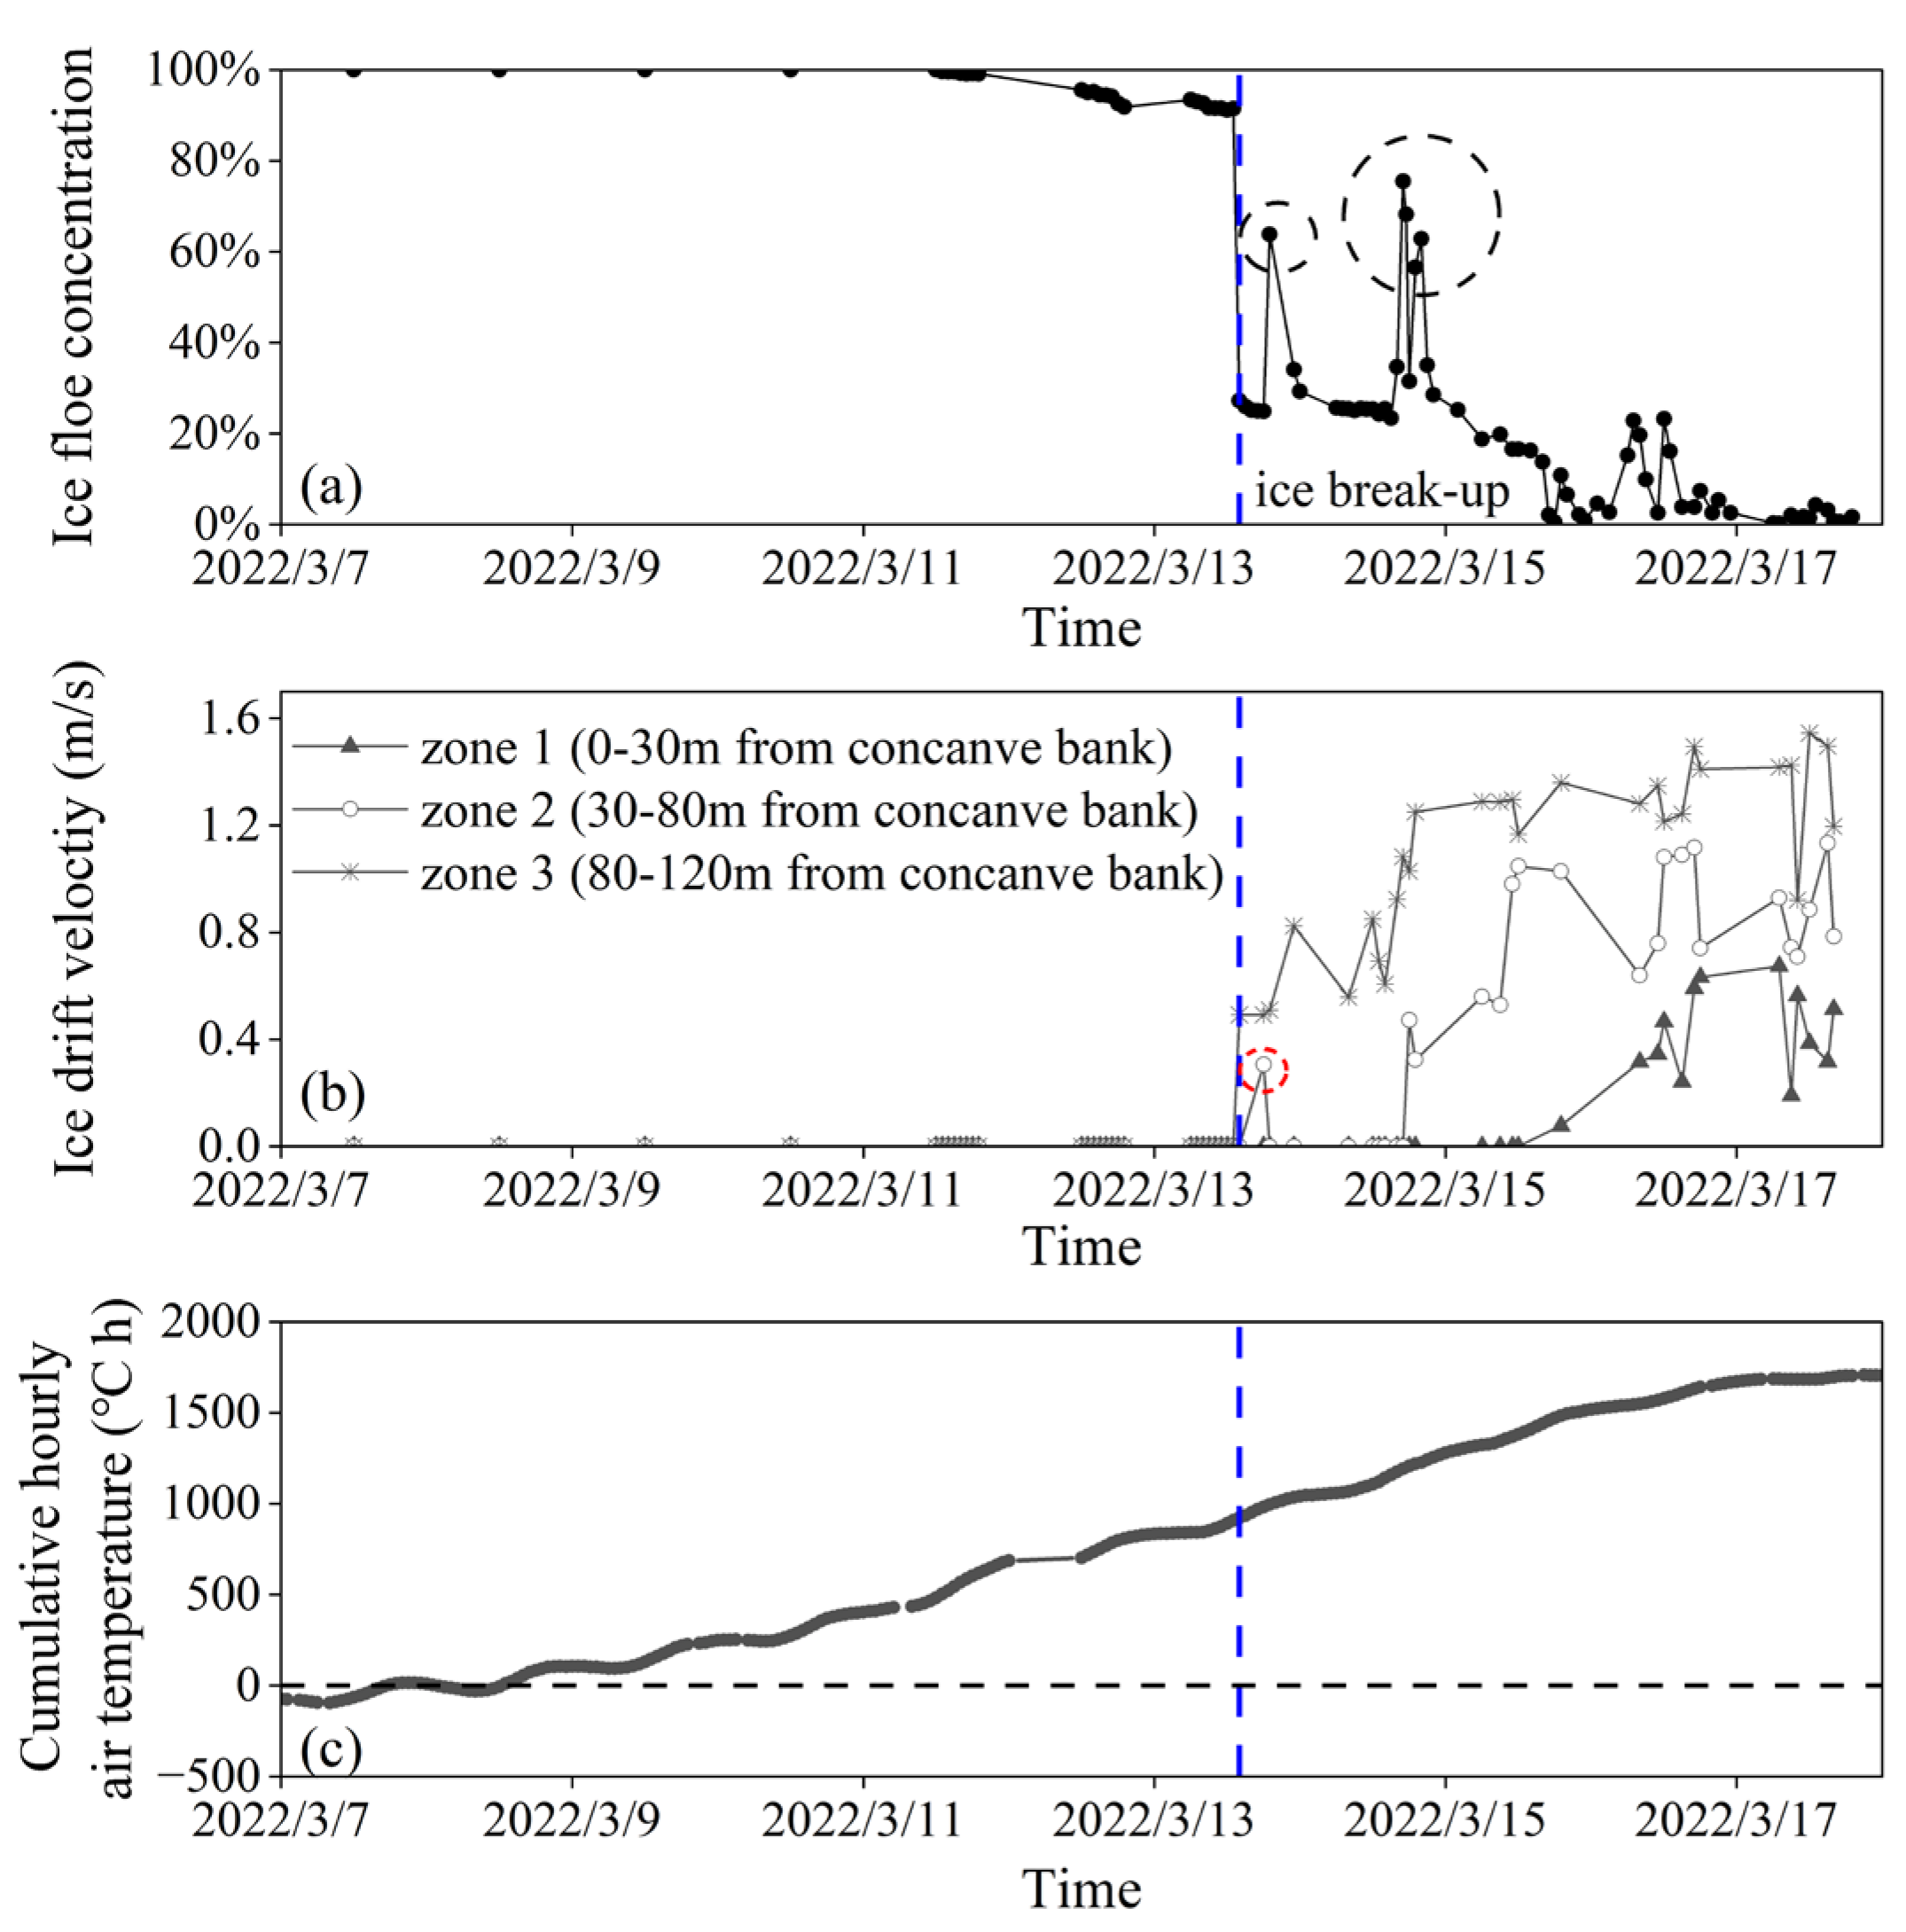
- Drift velocity (). The video image is screenshotted every 5 s. The easily identifiable feature point of drift ice is selected, and its pixel coordinate is recorded and converted to the true position by Equations (22) and (23). In the image 5 s later, the pixel coordinate of the same feature points of the same drift ice is recorded and converted to the true position. The velocity is the ratio of the distance between the two true positions to 5 s. According to the division of the black dotted line in Figure 2, ice drift velocity of zone 1, zone 2, and zone 3 are calculated from the concave bank to the convex bank. Zone 1 is less than 30 m from the concave bank. Zone 2 is greater than 30 m and less than 80 m from the concave bank. Zone 3 is greater than 80 m and less than 120 m from the concave bank.
4. Results and Discussions
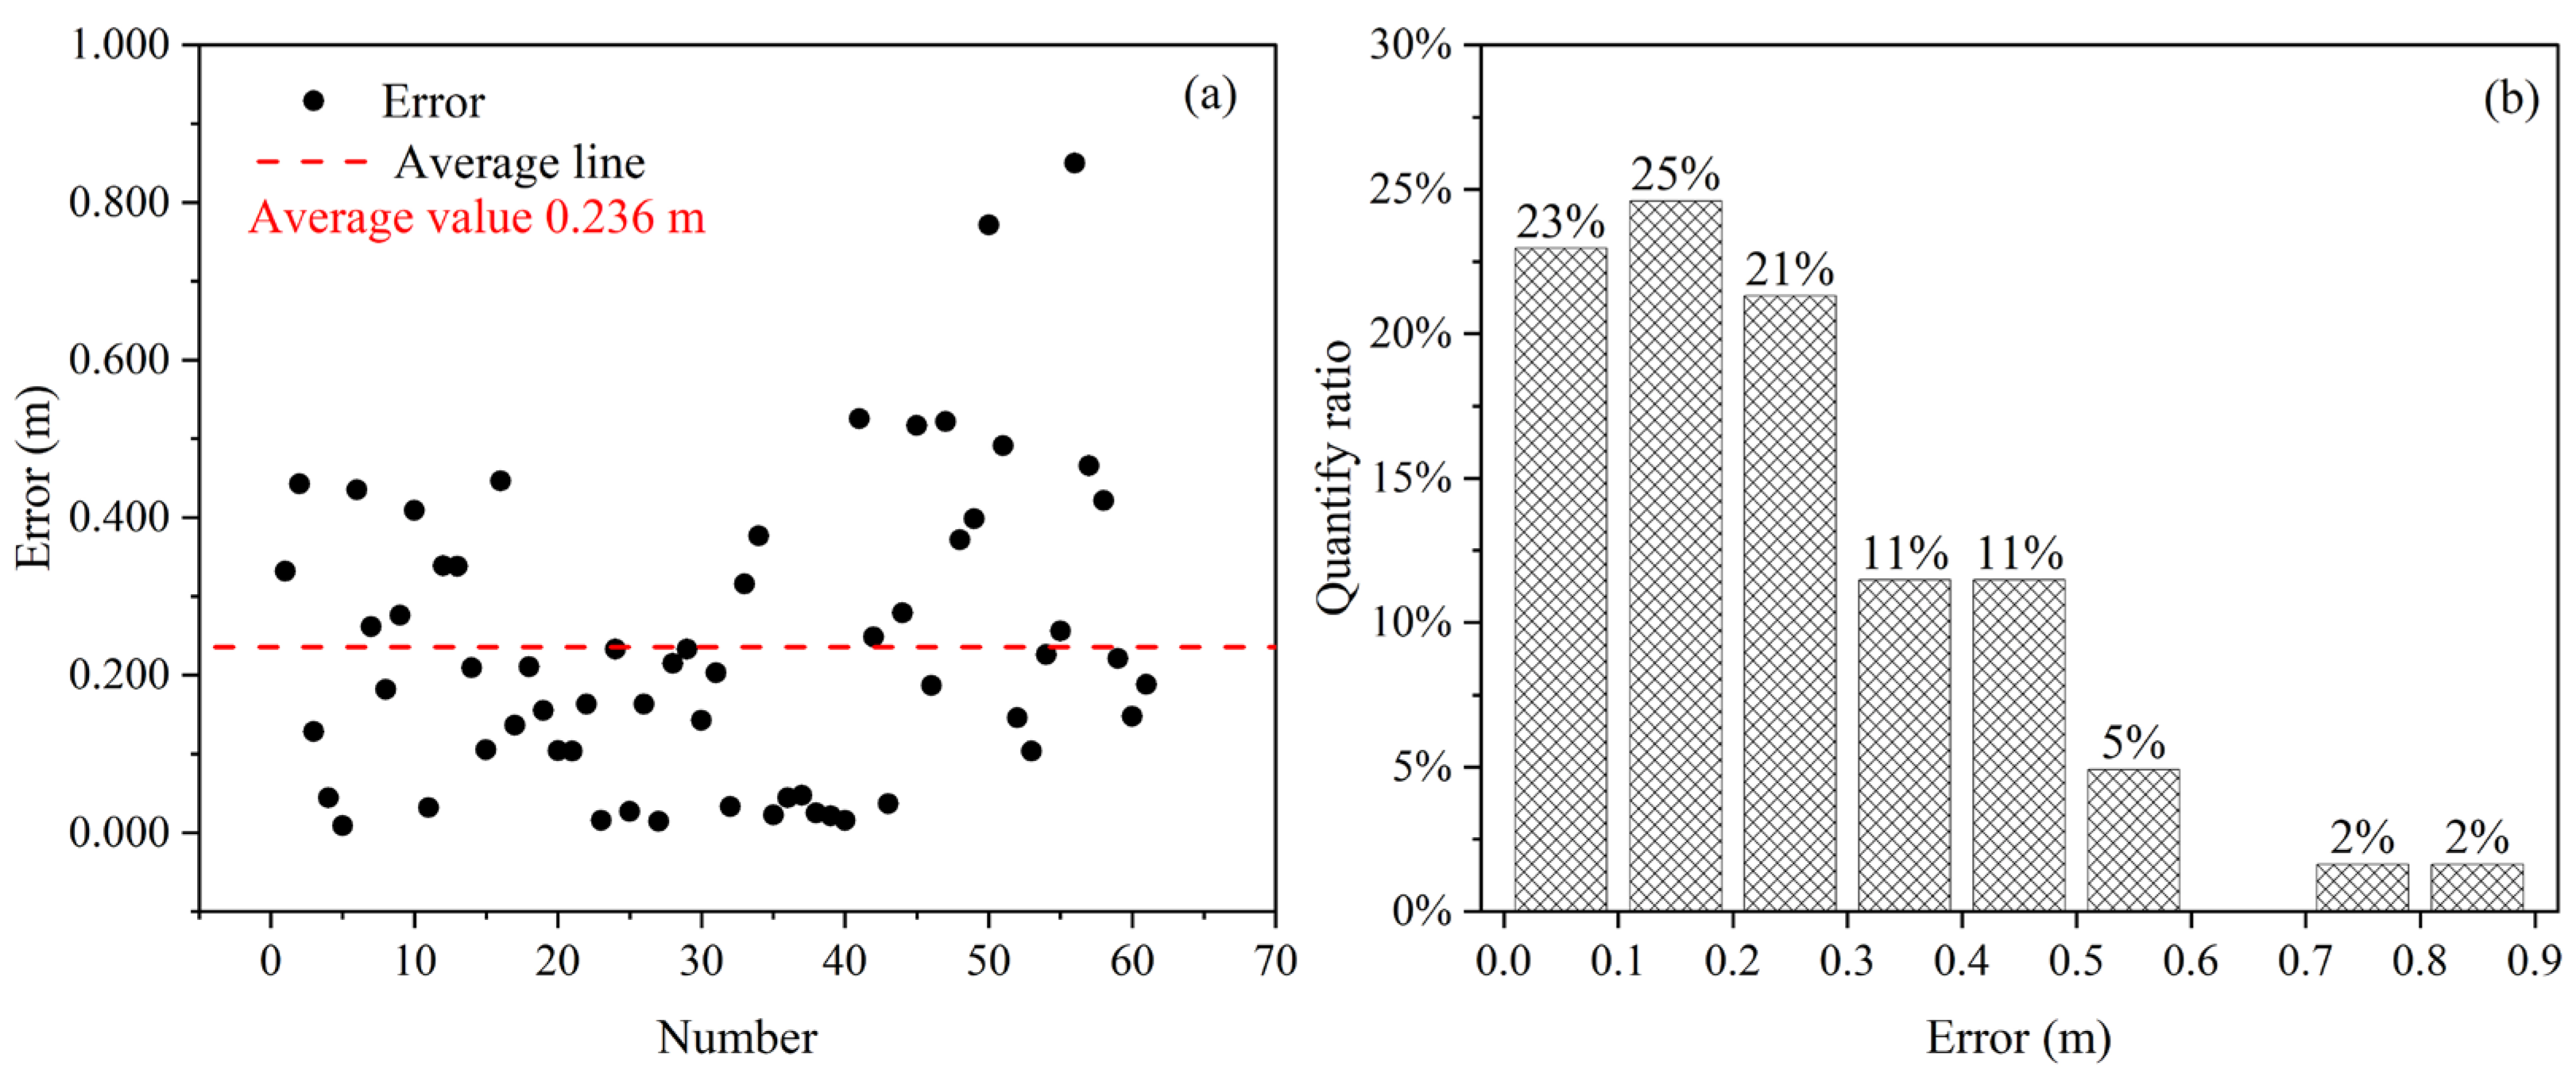
4.1. Calibration Accuracy Analysis
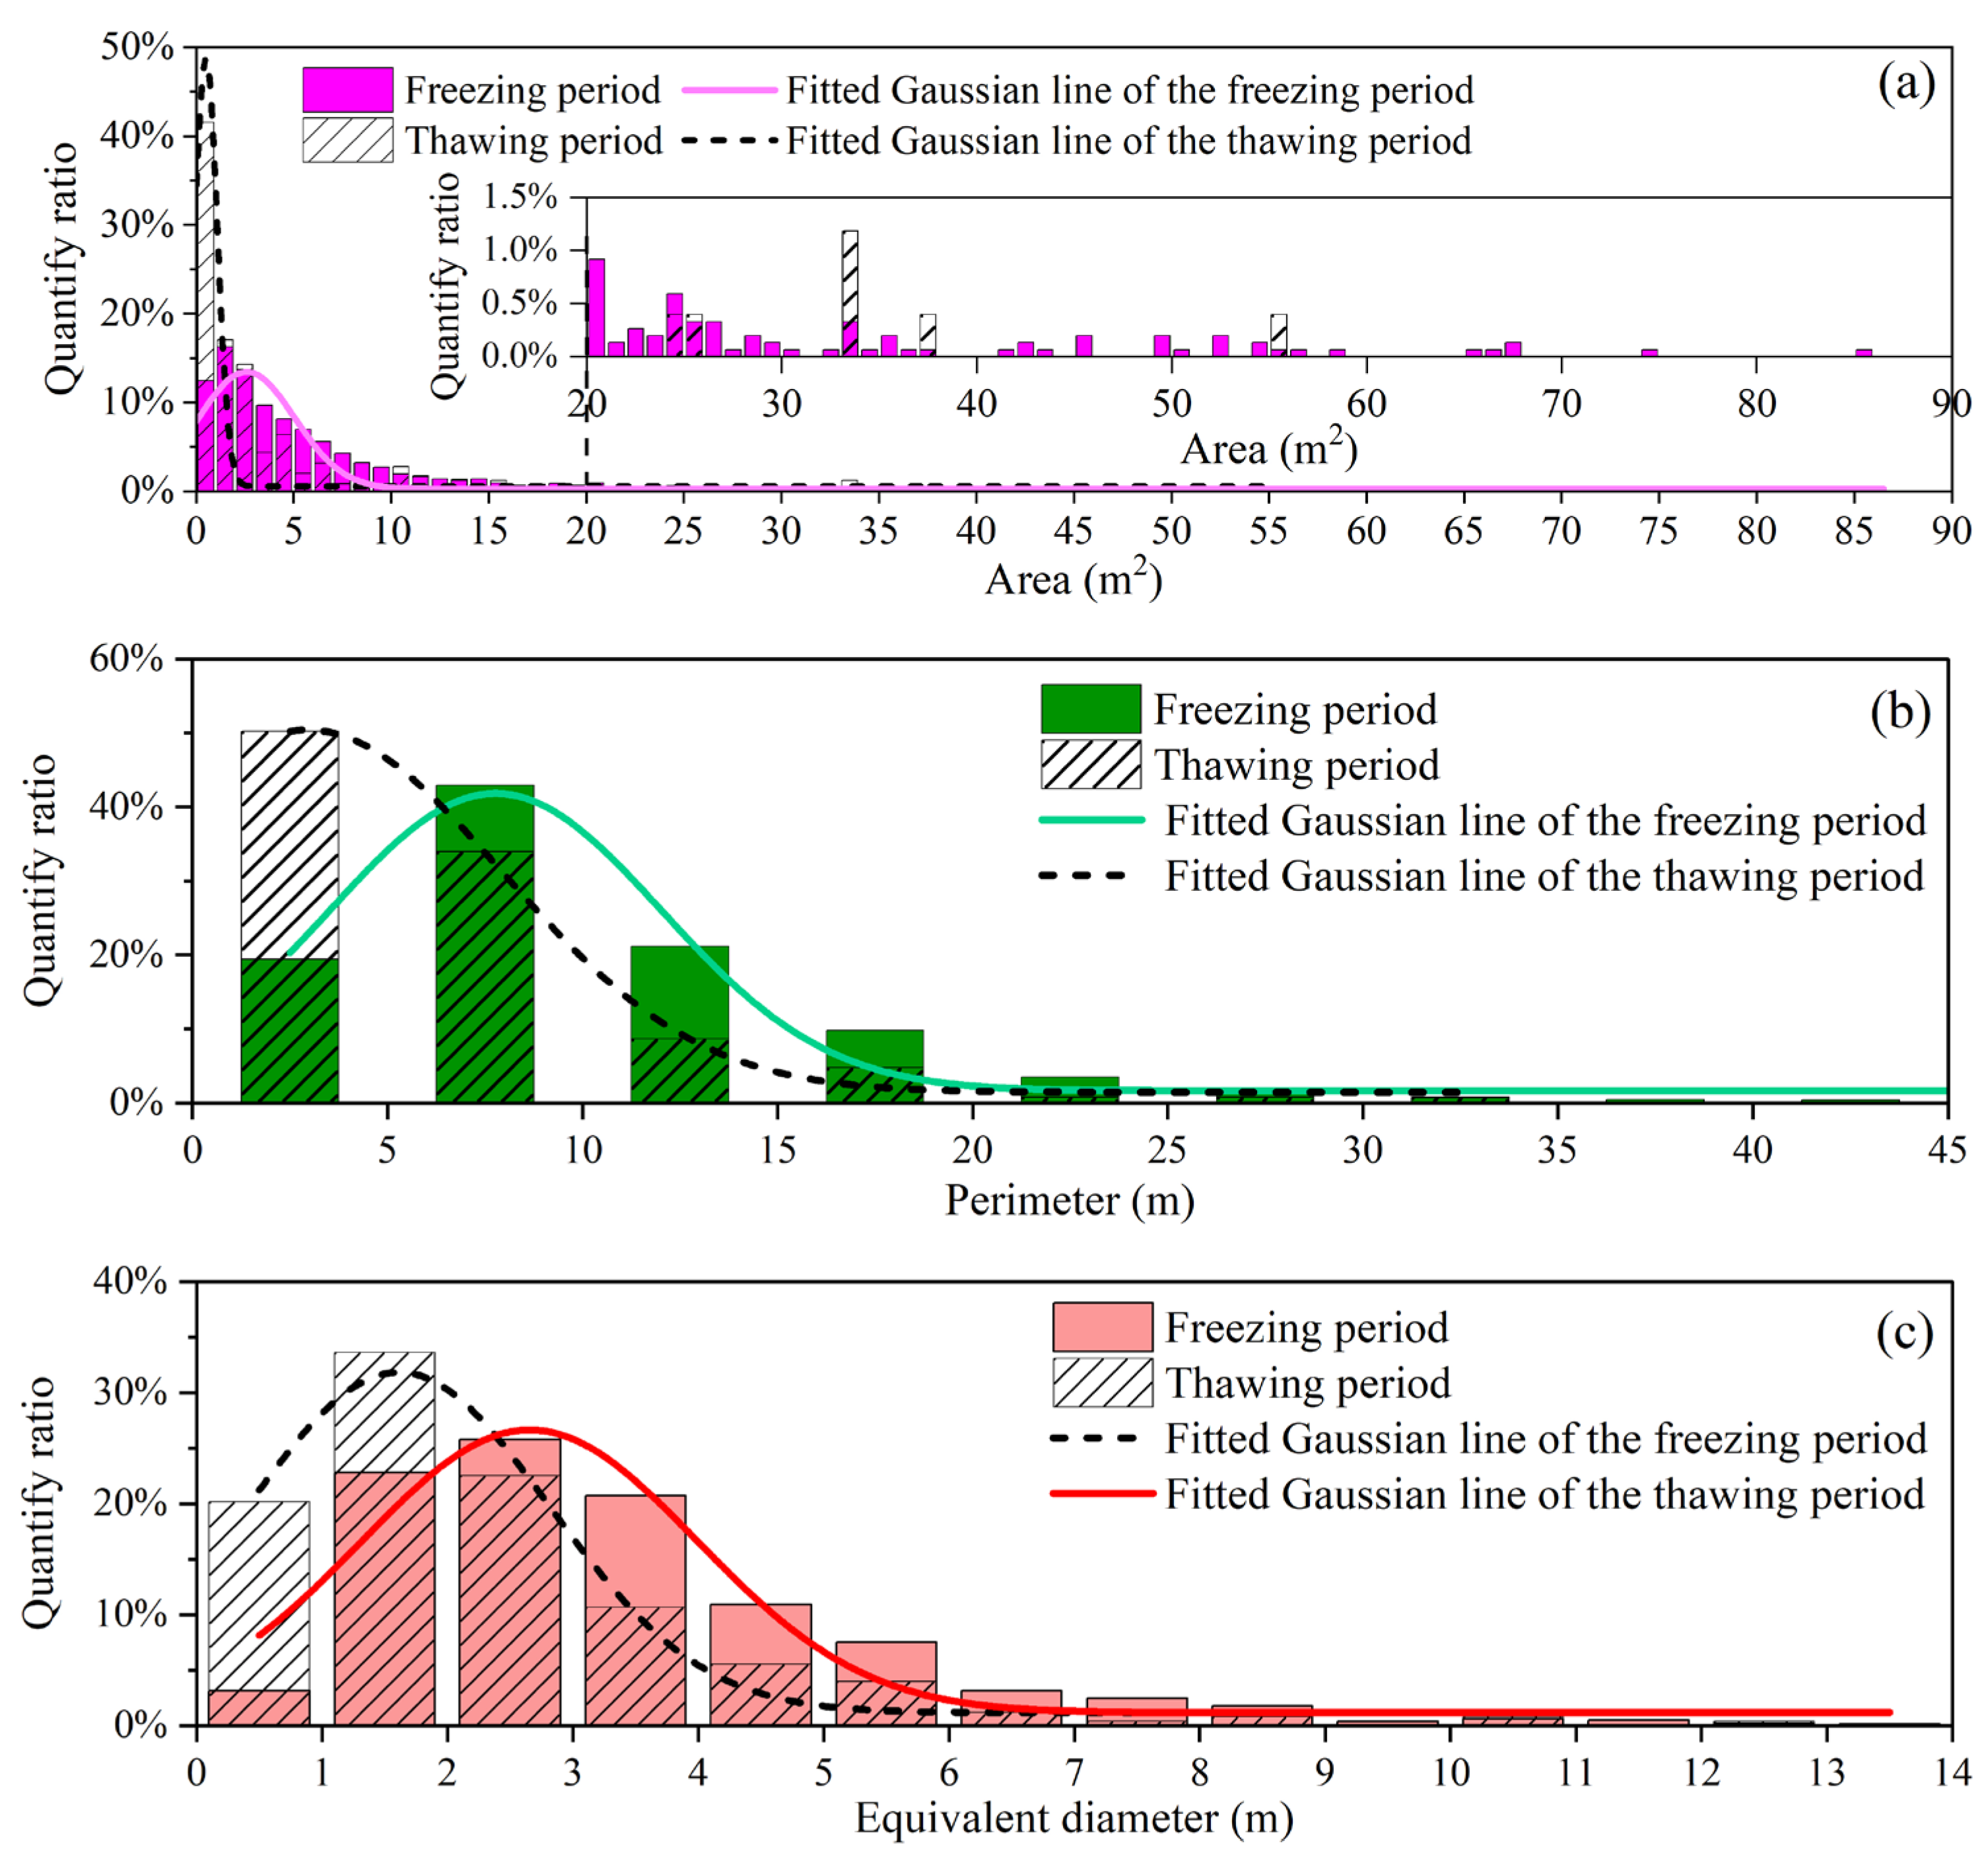
4.2. Drift Ice Size (Area, Perimeter, and Equivalent Diameter)
4.3. Drift Ice Shape (Fractal Dimension and Roundness)
4.4. Ice Concentration and Drift Velocity
5. Conclusions
Author Contributions
Funding
Data Availability Statement
Conflicts of Interest
References
- Chu, T.; Lindenschmidt, K. Integration of space-borne and air-borne data in monitoring river ice processes in the Slave River, Canada. Remote Sens. Environ. 2016, 181, 65–81. [Google Scholar] [CrossRef]
- McFarlane, V.; Loewen, M.; Hicks, F. Field measurements of suspended frazil ice—Part II: Observations and analyses of frazil ice properties during the principal and residual supercooling phases. Cold Reg. Sci. Technol. 2019, 165, 102796. [Google Scholar] [CrossRef]
- Zhang, Y.; Li, Z.; Xiu, Y.; Li, C.; Zhang, B.; Deng, Y. Microstructural characteristics of frazil particles and the physical properties of frazil ice in the Yellow River, China. Crystals 2021, 11, 617. [Google Scholar] [CrossRef]
- Kempema, E.W.; Ettema, R. Anchor ice rafting: Observations from the Laramie River. River Res. Appl. 2011, 27, 1126–1135. [Google Scholar] [CrossRef]
- Beltaos, S. Threshold between mechanical and thermal breakup of river ice cover. Cold Reg. Sci. Technol. 2003, 37, 1–13. [Google Scholar] [CrossRef]
- Ashton, G.D. River ice. Annu. Rev. Fluid Mech. 1978, 10, 369–392. [Google Scholar] [CrossRef]
- Liu, L.; Li, H.; Shen, H. A two-dimensional comprehensive river ice model. In Proceeding of the 18th IAHR International Symposium on Ice, Sapporo, Japan, 28 August–1 September 2006. [Google Scholar]
- Shen, H.T. Mathematical modeling of river ice processes. Cold Reg. Sci. Technol. 2010, 62, 3–13. [Google Scholar] [CrossRef]
- Lindenschmidt, K. RIVICE-A non-proprietary, open-source, one-dimensional river-ice model. Water 2017, 9, 314. [Google Scholar] [CrossRef] [Green Version]
- Knack, I.M.; Shen, H.T. Numerical modeling of ice transport in channels with river restoration structures. Can. J. Civ. Eng. 2017, 44, 813–819. [Google Scholar] [CrossRef]
- Zhai, B.; Liu, L.; Shen, H.T.; Ji, S. A numerical model for river ice dynamics based on discrete element method. J. Hydraul. Res. 2022, 60, 543–556. [Google Scholar] [CrossRef]
- Blackburn, J.; She, Y. A comprehensive public-domain river ice process model and its application to a complex natural river. Cold Reg. Sci. Technol. 2019, 163, 44–58. [Google Scholar] [CrossRef]
- Chassiot, L.; Lajeunesse, P.; Bernier, J. Riverbank erosion in cold environments: Review and outlook. Earth-Sci. Rev. 2020, 207, 103231. [Google Scholar] [CrossRef]
- Vandermause, R.; Harvey, M.; Zevenbergen, L.; Ettema, R. River-ice effects on bank erosion along the middle segment of the Susitna river, Alaska. Cold Reg. Sci. Technol. 2021, 185, 103239. [Google Scholar] [CrossRef]
- Ettema, R.; Zabilansky, L. Ice influences on channel stability: Insights from Missouri’s Fort Peck reach. J. Hydraul. Eng. 2004, 130, 279–292. [Google Scholar] [CrossRef]
- Beltaos, S.; Burrell, B.C. Transport of suspended sediment during the breakup of the ice cover, Saint John River, Canada. Cold Reg. Sci. Technol. 2016, 129, 1–13. [Google Scholar] [CrossRef]
- Kalke, H.; Loewen, M. Support vector machine learning applied to digital images of river ice conditions. Cold Reg. Sci. Technol. 2018, 155, 225–236. [Google Scholar] [CrossRef]
- Chen, P.; Cheng, T.; Wang, J.; Cao, G. Accumulation and evolution of ice jams influenced by different ice discharge: An experimental analysis. Front. Earth Sci. 2023, 10, 1054040. [Google Scholar] [CrossRef]
- Luo, H.; Ji, H.; Gao, G.; Zhang, B.; Mou, X. Study on the characteristics of flow and ice jam in Shisifenzi bend in the Yellow River during the freeze-up period. J. Hydraul. Eng. 2020, 51, 1089–1100. (In Chinese) [Google Scholar] [CrossRef]
- Fu, H.; Guo, X.; Wu, P.; Wang, T.; Guo, Y.; Li, J. River-ice blasting, and explosive weight optimization for ice-flooding mitigation: A case study. Cold Reg. Sci. Technol. 2020, 177, 103103. [Google Scholar] [CrossRef]
- Beltaos, S.; Bonsal, B. Climate change impacts on Peace River ice thickness and implications to ice-jam flooding of Peace-Athabasca Delta, Canada. Cold Reg. Sci. Technol. 2021, 186, 103279. [Google Scholar] [CrossRef]
- Beltaos, S. The role of waves in ice-jam flooding of the Peace—Athabasca Delta. Hydrol. Process. 2007, 21, 2548–2559. [Google Scholar] [CrossRef]
- Beltaos, S. Ice-jam flood regime of the Peace-Athabasca Delta: Update in light of the 2014 event. Cold Reg. Sci. Technol. 2019, 165, 102791. [Google Scholar] [CrossRef]
- Luo, D. Yellow River Ice Disaster Risk Management Based on Grey Prediction and Decision Method. In Emerging Studies and Applications of Grey Systems; Yang, Y., Liu, S., Eds.; Springer: Singapore, 2023; pp. 183–219. [Google Scholar] [CrossRef]
- Zakharova, E.; Agafonova, S.; Duguay, C.; Frolova, N.; Kouraev, A. River ice phenology and thickness from satellite altimetry: Potential for ice bridge road operation and climate studies. Cryosphere 2021, 15, 5387–5407. [Google Scholar] [CrossRef]
- Yang, Q.; Song, K.; Hao, X.; Wen, Z.; Tan, Y.; Li, W. Investigation of spatial and temporal variability of river ice phenology and thickness across Songhua River Basin, northeast China. Cryosphere 2020, 14, 3581–3593. [Google Scholar] [CrossRef]
- Rokaya, P.; Morales-Marín, L.; Bonsal, B.; Wheater, H.; Lindenschmidt, K. Climatic effects on ice phenology and ice-jam flooding of the Athabasca River in western Canada. Hydrol. Sci. J. 2019, 64, 1265–1278. [Google Scholar] [CrossRef]
- Liu, B.; Ji, H.; Zhai, Y.; Luo, H. Estimation of river ice thickness in the Shisifenzi reach of the Yellow River with remote sensing and air temperature data. IEEE J. Sel. Top. Appl. Earth Obs. Remote Sens. 2023, 16, 5645–5659. [Google Scholar] [CrossRef]
- Li, H.; Li, H.; Wang, J.; Hao, X. Monitoring high-altitude river ice distribution at the basin scale in the northeastern Tibetan Plateau from a Landsat time-series spanning 1999–2018. Remote Sens. Environ. 2020, 247, 111915. [Google Scholar] [CrossRef]
- Li, H.; Li, H.; Wang, J.; Hao, X. Revealing the river ice phenology on the Tibetan Plateau using Sentinel-2 and Landsat 8 overlapping orbit imagery. J. Hydrol. 2023, 619, 129285. [Google Scholar] [CrossRef]
- Zhang, F.; Mosaffa, M.; Chu, T.; Lindenschmidt, K.-E. Using remote sensing data to parameterize ice jam modeling for a northern inland delta. Water 2017, 9, 306. [Google Scholar] [CrossRef] [Green Version]
- Bourgault, D. Shore-based photogrammetry of river ice. Can. J. Civil Eng. 2008, 35, 80–86. [Google Scholar] [CrossRef] [Green Version]
- Ansari, S.; Rennie, C.D.; Seidou, O.; Malenchak, J.; Zare, S.G. Automated monitoring of river ice processes using shore-based imagery. Cold Reg. Sci. Technol. 2017, 142, 1–16. [Google Scholar] [CrossRef]
- Deng, Y.; Li, C.; Li, Z.; Zhang, B. Dynamic and full-time acquisition technology and method of ice data of Yellow River. Sensors 2021, 22, 176. [Google Scholar] [CrossRef]
- Wang, E.; Hu, S.; Han, H.; Li, Y.; Ren, Z.; Du, S. Ice velocity in upstream of Heilongjiang Based on UAV low-altitude remote sensing and the SIFT algorithm. Water 2022, 14, 1957. [Google Scholar] [CrossRef]
- Das, A.; Sagin, J.; Sanden, J.; Evans, E.; Mckay, H.; Lindenschmidt, K. Monitoring the freeze-up and ice cover progression of the Slave River. Can. J. Civ. Eng. 2015, 42, 609–621. [Google Scholar] [CrossRef]
- Zhang, X.; Jin, J.; Lan, Z.; Li, C.; Fan, M.; Wang, Y.; Yu, X.; Zhang, Y. ICENET: A Semantic Segmentation Deep Network for River Ice by Fusing Positional and Channel-Wise Attentive Features. Remote Sens. 2020, 12, 221. [Google Scholar] [CrossRef] [Green Version]
- Zhang, X.; Zhou, Y.; Jin, J.; Wang, Y.; Fan, M.; Wang, N.; Zhang, Y. ICENETv2: A Fine-Grained River Ice Semantic Segmentation Network Based on UAV Images. Remote Sens. 2021, 13, 633. [Google Scholar] [CrossRef]
- Ansari, S.; Rennie, C.D.; Clark, S.P.; Seidou, O. IceMaskNet: River ice detection and characterization using deep learning algorithms applied to aerial photography. Cold Reg. Sci. Technol. 2021, 189, 103324. [Google Scholar] [CrossRef]
- Pei, C.; She, Y.; Loewen, M. Deep learning-based river surface ice quantification using a distant and oblique-viewed public camera. Cold Reg. Sci. Technol. 2023, 206, 103736. [Google Scholar] [CrossRef]
- Emond, J.; Morse, B.; Richard, M.; Stander, E.; Viau, A.A. Surface ice observations on the St. Lawrence River using infrared thermography. River Res. Appl. 2011, 27, 1090–1105. [Google Scholar] [CrossRef]
- Daigle, A.; Bérubé, F.; Bergeron, N.; Matte, P. A methodology based on Particle image velocimetry for river ice velocity measurement. Cold Reg. Sci. Technol. 2013, 89, 36–47. [Google Scholar] [CrossRef]
- Morse, B.; Hessami, M.; Bourel, C. Characteristics of ice in the St. Lawrence River. Can. J. Civ. Eng. 2003, 30, 766–774. [Google Scholar] [CrossRef]
- Ghobrial, T.R.; Loewen, M.R.; Hicks, F.E. Continuous monitoring of river surface ice during freeze-up using upward looking sonar. Cold Reg. Sci. Technol. 2013, 86, 69–85. [Google Scholar] [CrossRef]
- Li, C.; Li, Z.; Yang, Y.; Wang, Q.; Zhang, B.; Deng, Y. Theory and application of ice thermodynamic and mechanics for the natural sinking of gabion mattresses on a floating ice cover. Cold Reg. Sci. Technol. 2023, 213, 103925. [Google Scholar] [CrossRef]
- Li, C.; Li, Z.; Huang, W.; Zhang, B.; Deng, Y.; Li, G. Morphology dynamics of ice cover in a river bend revealed by the UAV-GPR and sentinel-2. Remote Sens. 2023, 15, 3180. [Google Scholar] [CrossRef]
- Li, Z.; Li, C.; Yang, Y.; Zhang, B.; Deng, Y.; Li, G. Physical Mechanism and Parameterization for Correcting Radar Wave Velocity in Yellow River Ice with Air Temperature and Ice Thickness. Remote Sens. 2023, 15, 1121. [Google Scholar] [CrossRef]
- Wu, S.; Li, C.; Li, Z.; Zhang, L.; Zhang, B.; Deng, Y. Theoretical basis, and practice of improving the accuracy of identifying river slope ice run image. Yellow River 2023, 45, 115–120,125. (In Chinese) [Google Scholar] [CrossRef]
- Rothrock, D.A.; Thorndike, A.S. Measuring the sea ice floe size distribution. J. Geophys. Res. Ocean. 1984, 89, 6477–6486. [Google Scholar] [CrossRef]
- Lu, P.; Li, Z.; Zhang, Z.; Dong, X. Aerial observations of floe size distribution in the marginal ice zone of summer Prydz Bay. J. Geophys. Res. Ocean. 2008, 113, C02011. [Google Scholar] [CrossRef]
- Weiss, J. Fracture and fragmentation of ice: A fractal analysis of scale invariance. Eng. Fract. Mech. 2001, 68, 1975–2012. [Google Scholar] [CrossRef]
- Ai, T.; Zhang, R.; Zhou, H.W.; Pei, J.L. Box-counting methods to directly estimate the fractal dimension of a rock surface. Appl. Surf. Sci. 2014, 314, 610–621. [Google Scholar] [CrossRef]
- Allen, M.; Brown, G.J.; Miles, N.J. Measurement of boundary fractal dimensions: Review of current techniques. Powder Technol. 1995, 84, 1–14. [Google Scholar] [CrossRef]
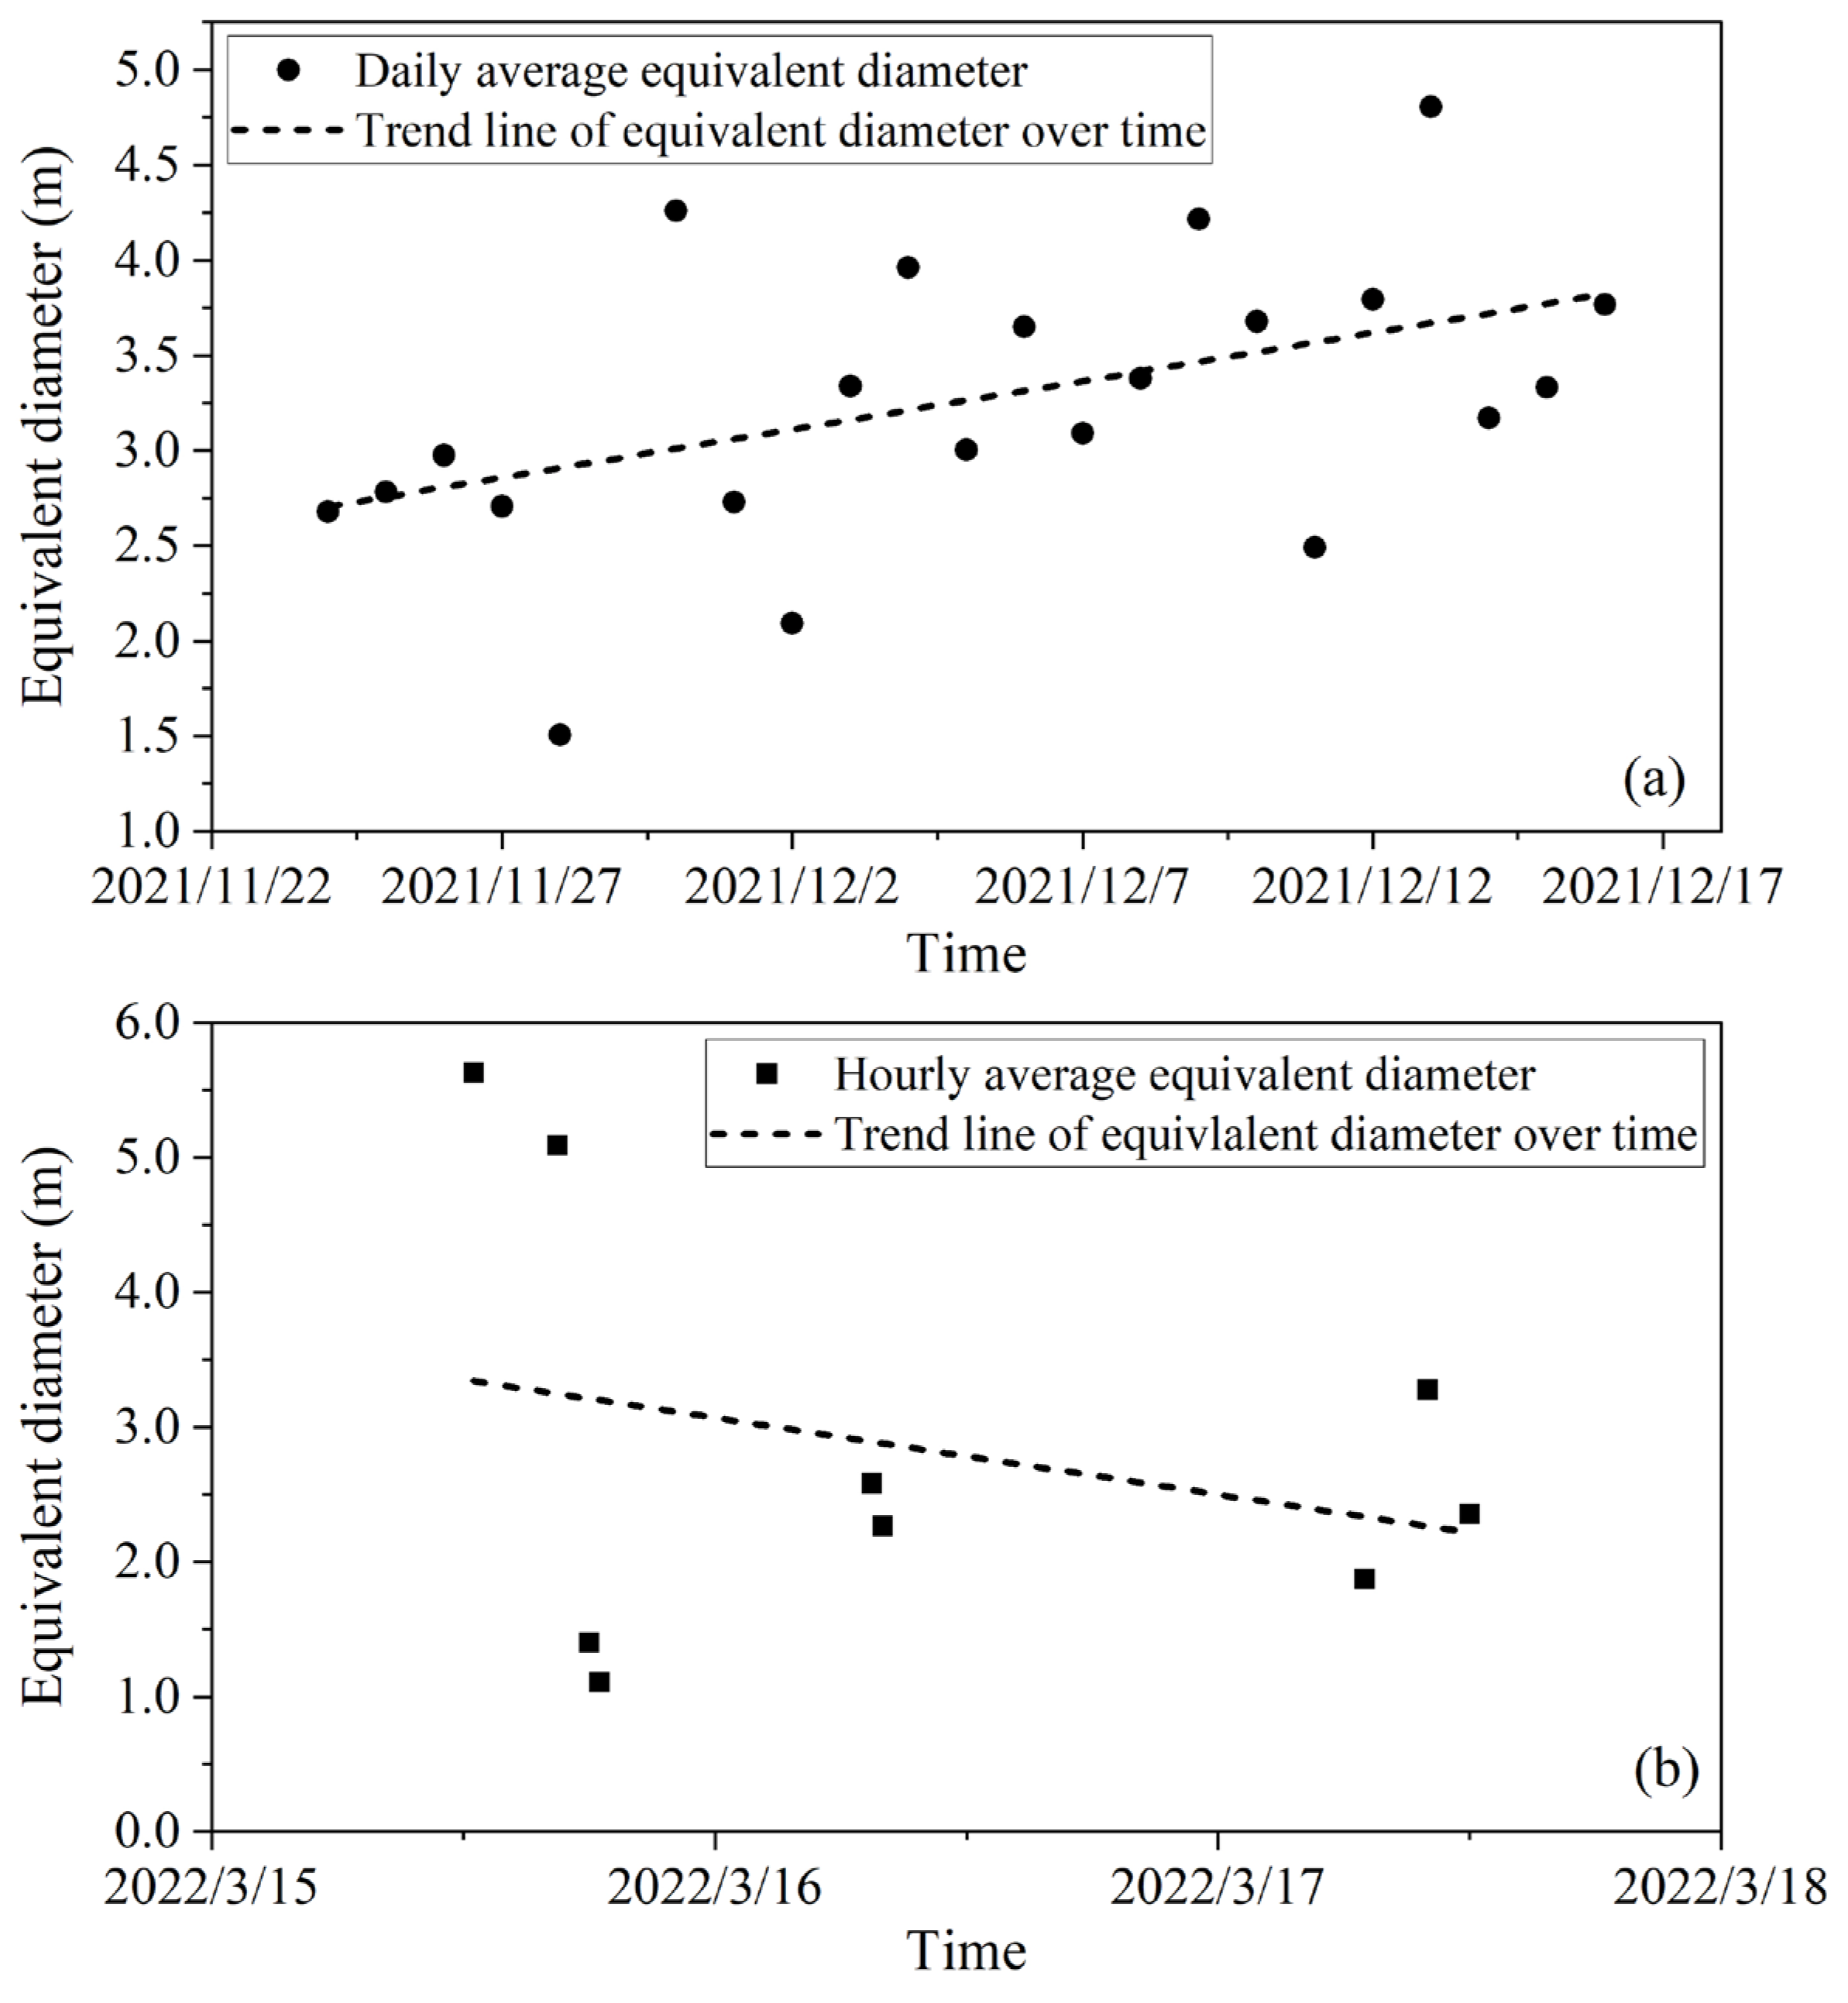
| Size Item | Ice Period | Average Value | The Range of Observed Values |
|---|---|---|---|
| Area (m2) | Freezing | 6.50 | 0.11–85.60 |
| Thawing | 3.53 | 0.02–55.22 | |
| Perimeter (m) | Freezing | 10.00 | 1.32–46.18 |
| Thawing | 6.43 | 0.48–32.12 | |
| Equivalent diameter (m) | Freezing | 3.36 | 0.52–13.10 |
| Thawing | 2.30 | 0.20–12.54 |
| Area | Perimeter | Equivalent Diameter | ||||
|---|---|---|---|---|---|---|
| Freezing Period | Thawing Period | Freezing Period | Thawing Period | Freezing Period | Thawing Period | |
| 0.003 | 0.005 | 0.017 | 0.014 | 0.012 | 0.012 | |
| 2.583 | 0.500 | 7.771 | 2.944 | 2.656 | 1.611 | |
| 4.938 | 1.159 | 8.504 | 10.014 | 2.677 | 2.408 | |
| 0.814 | 0.700 | 4.282 | 6.146 | 0.855 | 0.926 | |
| 0.859 | 0.765 | 0.963 | 0.993 | 0.923 | 0.975 | |
| Shape Item | Ice Period | Average Value | The Range of Observed Values |
|---|---|---|---|
| Fractal dimension | Freezing | 1.107 | 1.000–1.298 |
| Thawing | 1.110 | 1.001–1.295 | |
| Roundness | Freezing | 0.660 | 0.179–0.946 |
| Thawing | 0.697 | 0.263–0.988 |
| Fractal Dimension | Roundness | |||
|---|---|---|---|---|
| Freezing Period | Thawing Period | Freezing Period | Thawing Period | |
| 0.011 | 0.021 | 0.001 | 0.01 | |
| 1.093 | 1.087 | 0.682 | 0.709 | |
| 0.057 | 0.051 | 0.251 | 0.193 | |
| 0.016 | 0.013 | 0.049 | 0.043 | |
| 0.947 | 0.884 | 0.956 | 0.969 | |
| Parameters | Freezing Period | Thawing Period | ||||
|---|---|---|---|---|---|---|
| Upper Envelop Line | Best Fitted Line | Lower Envelop Line | Upper Envelop Line | Best Fitted Line | Lower Envelop Line | |
| A | 0.0003 | 0.0003 | 0.0003 | 0.0003 | 0.0003 | 0.0003 |
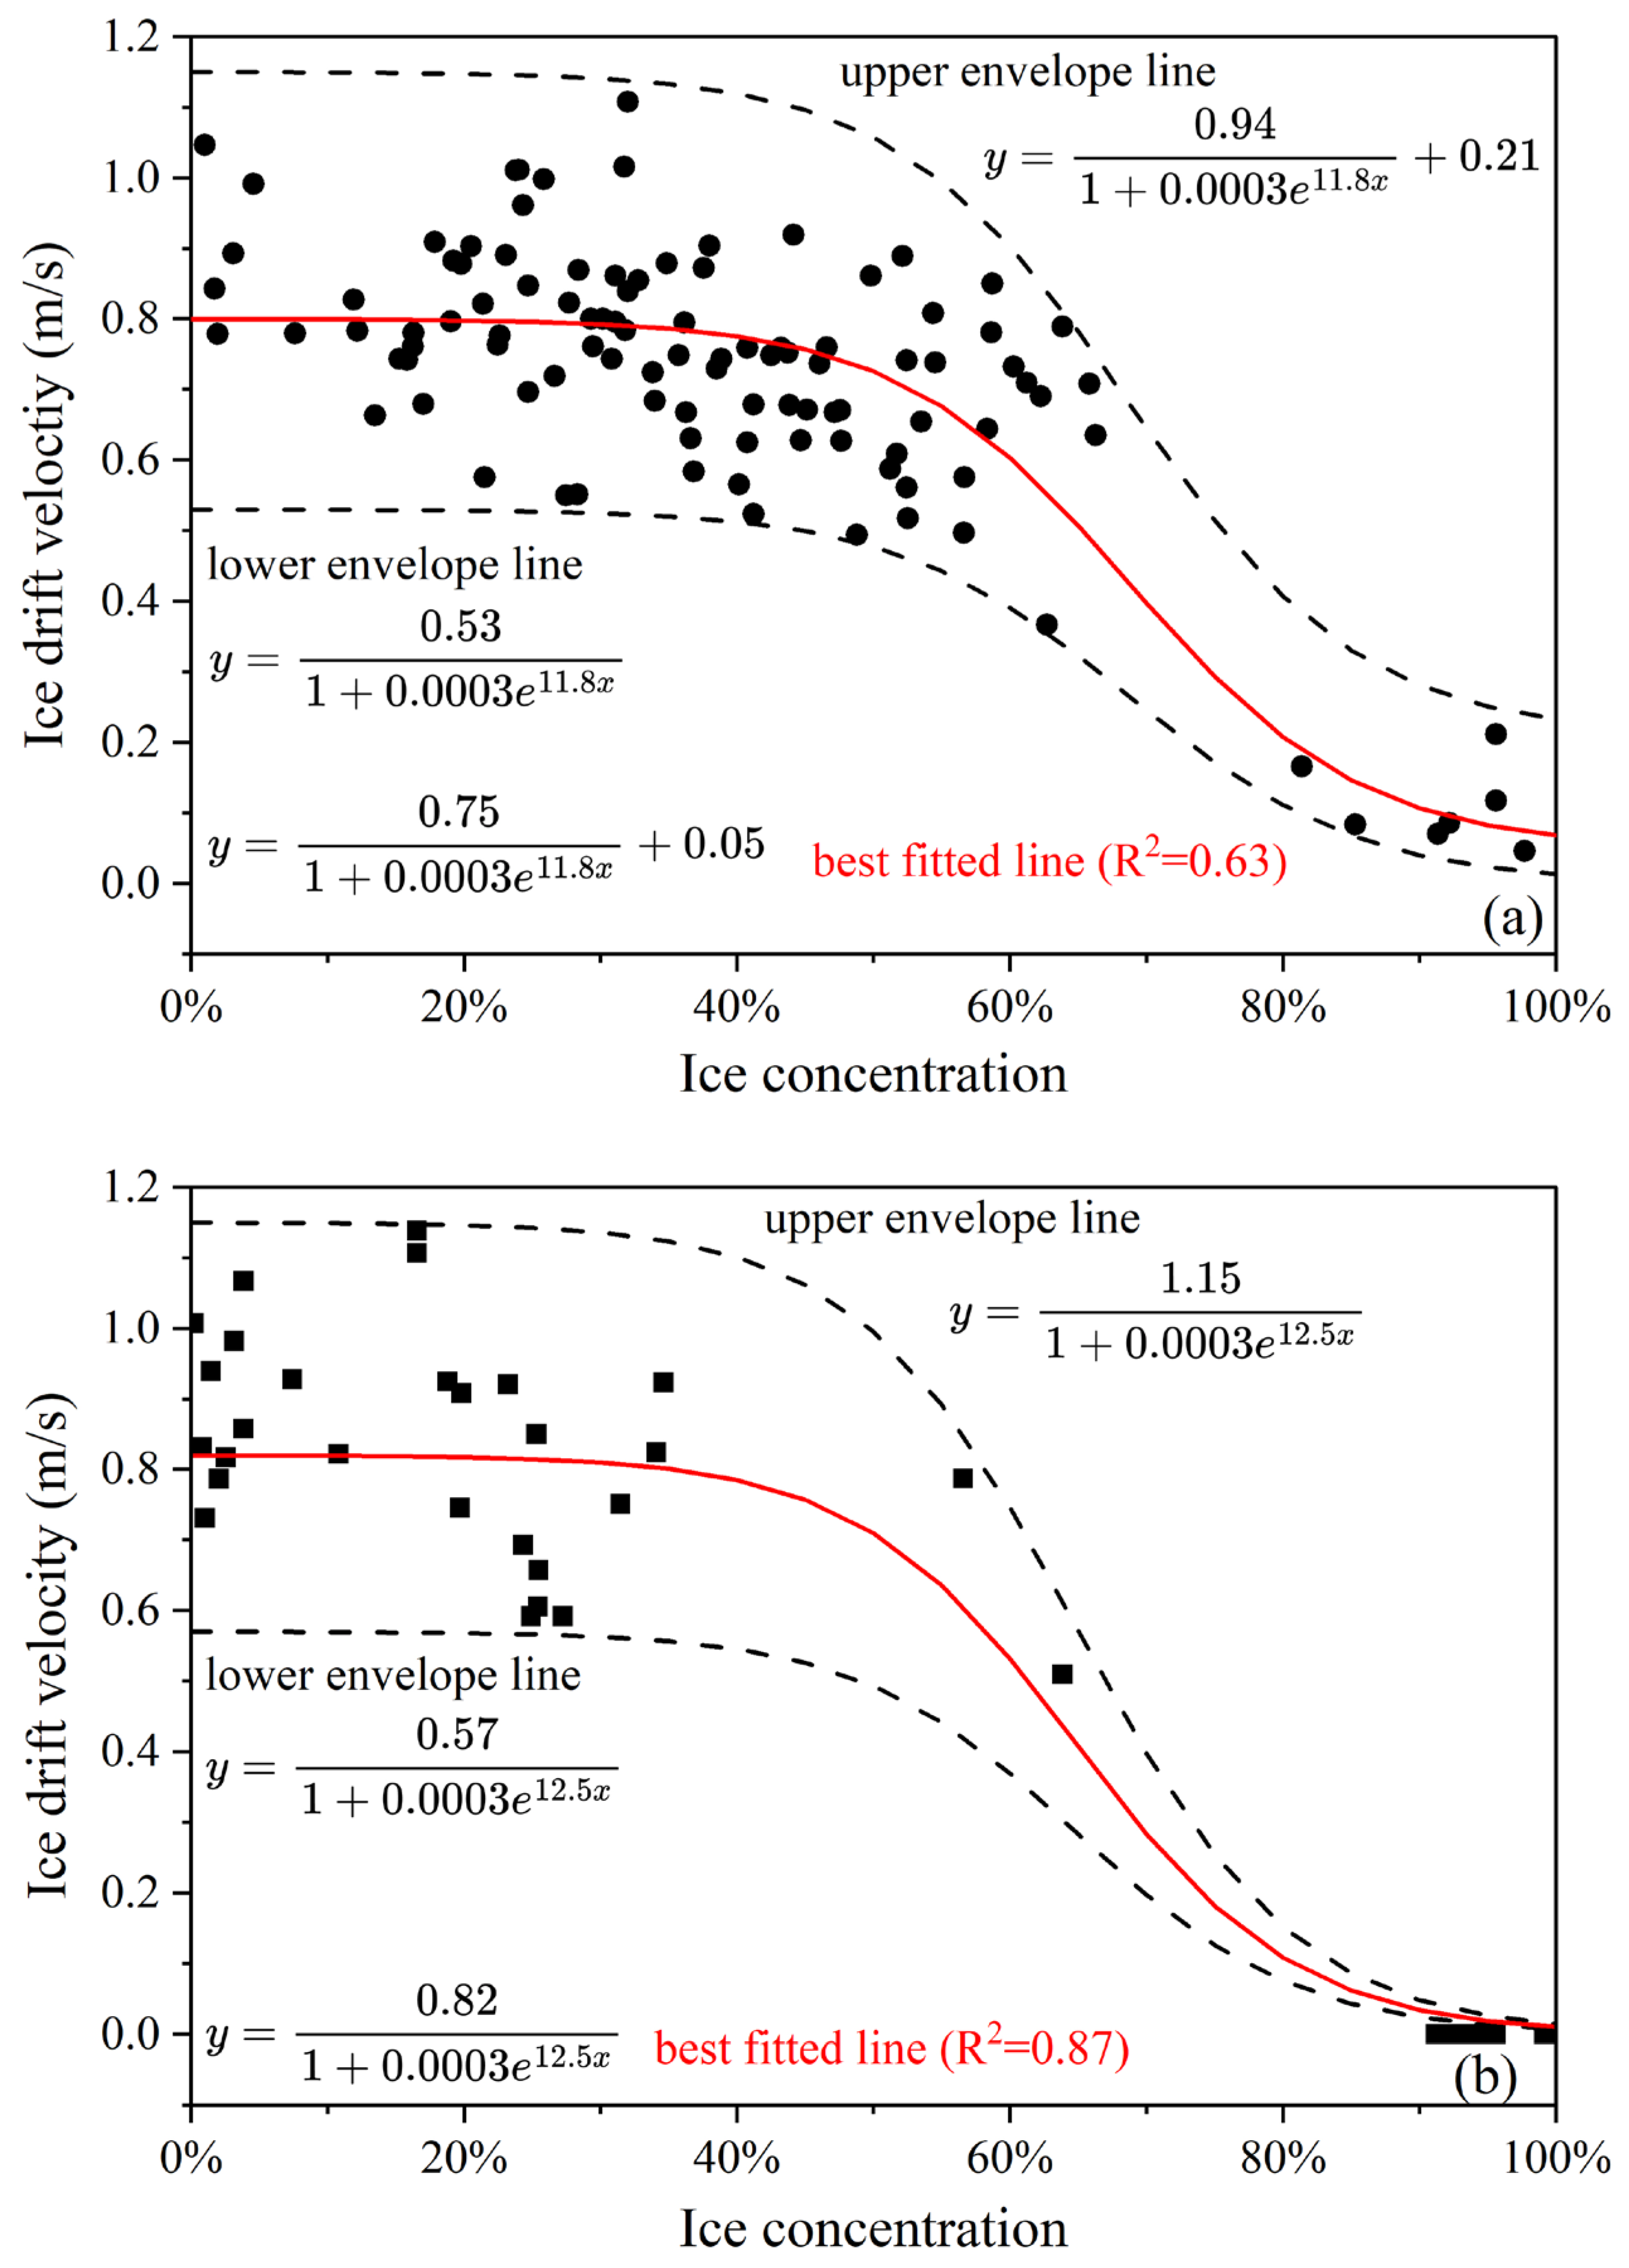
| B | 11.8 | 11.8 | 11.8 | 12.5 | 12.5 | 12.5 |
| C | 0.94 | 0.75 | 0.53 | 1.15 | 0.82 | 0.57 |
| D | 0.21 | 0.05 | 0 | 0 | 0 | 0 |
| R2 | 0.63 | 0.87 | ||||
Disclaimer/Publisher’s Note: The statements, opinions and data contained in all publications are solely those of the individual author(s) and contributor(s) and not of MDPI and/or the editor(s). MDPI and/or the editor(s) disclaim responsibility for any injury to people or property resulting from any ideas, methods, instructions or products referred to in the content. |
© 2023 by the authors. Licensee MDPI, Basel, Switzerland. This article is an open access article distributed under the terms and conditions of the Creative Commons Attribution (CC BY) license (https://creativecommons.org/licenses/by/4.0/).
Share and Cite
Li, C.; Li, Z.; Zhang, B.; Deng, Y.; Zhang, H.; Wu, S. A Survey Method for Drift Ice Characteristics of the Yellow River Based on Shore-Based Oblique Images. Water 2023, 15, 2923. https://doi.org/10.3390/w15162923
Li C, Li Z, Zhang B, Deng Y, Zhang H, Wu S. A Survey Method for Drift Ice Characteristics of the Yellow River Based on Shore-Based Oblique Images. Water. 2023; 15(16):2923. https://doi.org/10.3390/w15162923
Chicago/Turabian StyleLi, Chunjiang, Zhijun Li, Baosen Zhang, Yu Deng, Han Zhang, and Shuai Wu. 2023. "A Survey Method for Drift Ice Characteristics of the Yellow River Based on Shore-Based Oblique Images" Water 15, no. 16: 2923. https://doi.org/10.3390/w15162923
APA StyleLi, C., Li, Z., Zhang, B., Deng, Y., Zhang, H., & Wu, S. (2023). A Survey Method for Drift Ice Characteristics of the Yellow River Based on Shore-Based Oblique Images. Water, 15(16), 2923. https://doi.org/10.3390/w15162923


