Article

Influence of Multi-Cross Structures on the Flood Discharge Capacity of Mountain Rivers in the Yellow River Basin

1
School of Geomatics and Municipal Engineering, Zhejiang University of Water Resources and Electric Power, Hangzhou 310018, China
2
Engineering Research Center of Digital Twin Basin of Zhejiang Province, Hangzhou 310018, China
3
School of Water Conservancy and Hydroelectric Power, Hebei University of Engineering, Handan 056038, China
4
School of Water Conservancy & Environment Engineering, Zhejiang University of Water Resources and Electric Power, Hangzhou 310018, China
5
School of Electric Power, North China University of Water Resources and Hydropower, Zhengzhou 450045, China
*
Author to whom correspondence should be addressed.
Water 2023, 15(15), 2719; https://doi.org/10.3390/w15152719
Submission received: 20 April 2023 / Revised: 14 July 2023 / Accepted: 24 July 2023 / Published: 27 July 2023

Abstract

:
This study investigates the impact of cross structures on flood occurrences in mountainous rivers. The governing equations of open channel flow were formulated based on the Saint-Venant equations. The open channel was segmented, and a node equation was established at each section’s connection point. An overflow model of bridges and weir dams was also developed. The physical model of the open channel was simplified and modeled using actual building data and model calculation requirements. The study found that the primary impact of weirs and bridges on the open channel was the backwater effect on the water level. The influence of these structures on the water level in the Huang Stream urban section in the Yellow River Basin was assessed under various working conditions. The results showed that deleting the #1 weir could reduce the maximum backwater height by 1.14 m, and deleting the #2 weir could reduce it by 1.09 m. While reducing the weir height significantly decreased the backwater range and height, it did not enhance the river’s flood discharge capacity. The Huang Stream contains 17 bridges, 13 of which could potentially affect flood discharge. The eight flat slab bridges in the submerged outflow state had a significant impact on flood discharge, with a maximum water level change of 0.51 m. Conversely, the three single-hole flat slab bridges in the free outflow state downstream had a negligible impact on flood discharge. The study found that bridges had a greater influence on flood discharge capacity than weirs. This research provides valuable insights for the reconstruction of cross structures in mountainous rivers and for managing flood discharge capacity and flood control.

1. Introduction

Floods in mountain rivers are typically characterized by non-constant, open channel flow. In 1871, Saint-Venant established a series of partial differential equations, supported by experimental data, to describe the flow characteristics of unsteady flow in open channels. These equations, known as the Saint-Venant equations, have been widely used for solving fluid mechanics problems such as flood routing, sediment scouring and silting [1,2]. Since the last century, a series of studies have been conducted to improve these equations so as to solve more and more complicated problems. The Muskingum method has been proposed based on water balance equations and channel storage equations to calculate the characteristics of river flow, which contains a convection diffusion equation with a second-order accuracy difference format and can be solved by dividing the river into sections [3]. Kalininh and Milyukov [4] proposed the specific river length method from a study of unstable flow and unit flood routing, which could also be used to solve watershed confluence routing problems. Montes et al. [5] combined the Muskingum model with a simple conceptual model and an error correction scheme to forecast floods and validated the model using the historical floods data from the central Pyrenees. Lee [6] proposed a more convenient calculation method for the Muskingum model and demonstrated the accuracy of this model using historical data. Taking into account the geometry and hydraulic roughness of river sections, Li et al. [7] combined the Muskingum–Cunge–Todini variable parameter method with nonlinear reservoir method to study river flood routing. They found that the accuracy of the Muskingum–Cunge–Todini variable parameter method was higher than that of the piece-wise Muskingum method. Fenton [8] verified a one-dimensional flood routing model and several other methods and found that the Muskingum method was prone to errors when calculating rate parameters for small-slope rivers. However, the convective diffusion method was found to be more accurate for solving practical problems.
With the development of computer science in recent years, numerical simulation methods for flood routing have been greatly developed. Saeed et al. [9] collected hydrometeorological and topographic data from the Kabul River Basin in Pakistan and used an artificial neural network (ANN) model to calculate the flood inundation range. The results showed that the ANN model achieved higher accuracy than the traditional method and could improve the accuracy and reliability of flood early warning systems. Tamiru et al. [10] predicted flood depth and inundation range in the Baro Akobo River Basin in Ethiopia by combining the ANN model with the Hydrologic Engineering Center’s River Analysis System (HEC-RAS) models, obtaining high-accuracy results. Liu et al. [11] analyzed flood risk in the Tieshan River Basin in China using the MIKE FLOOD coupled 1D hydrodynamic model and simulated the flood inundation status of the basin over two periods. They proposed a regulation scheme incorporating two new branches to introduce floods originating from the Shegong River reaches into the Tieshan River. Bulti et al. [12] simulated the upstream watershed of a dam using the Soil and Water Assessment Tool (SWAT) model and simulated the downstream watershed of the same dam using the HEC-RAS model. They analyzed the impact of the dam on watershed hydrology, considering water level, fluid velocity and flow field distribution. Wang et al. [13] used an unsteady flow method based on the MIKE 21 FM hydrodynamics module to study the flow characteristics of complex sections of urban rivers and summarized the general rules for the hydraulic elements of complex sections. Karymbaris et al. [14] determined the extent of flood disasters in the Megalo Rema catchment area in Greece using multicriteria decision analysis and geographic information system (GIS), verifying the accuracy of flood disaster maps using historical flood data. Liu et al. [15] established a one-dimensional and two-dimensional coupling model by calculating the river flow discharge, considering flow discharge as boundary conditions for flood storage and detention areas. Liu et al. [16] conducted flood risk assessments for 2030 and 2050 using a new watershed-scale framework, exploring changes in future flood risks. He et al. [17] used machine learning methods to predict floods in a certain region in 2020 with small errors.
Cross-channel structures, such as bridges, culverts, weirs and dams, are commonly built at the intersection of channels, rivers and roads. These structures have the potential to affect flood conveyance in both mountainous and flat areas. In mountainous areas, weirs, dams and bridges constructed on rivers may affect the flood discharge capacity of rivers. It is necessary to study the influence of cross structures on flood discharge capacity in mountainous areas to provide a scientific reference for flood control. The effect of these structures may be greater in mountainous areas due to factors such as bridge submergence being more common than in flat valleys [18]. A numbers of studies have been conducted to discover the influence of bridges, dams and gates on flood discharge capacity of rivers. Malik et al. [19] conducted a series of physical model experiments to study the influence of the number and spacing of piers on the backwater region of a bridge. Subedi et al. [20] simulated bridge pier sizes and flows considering various river configurations, to study the effect of bridge pier closure on the upstream flood. Ren et al. [21] studied six bridges on the Nandu River, China, using the MIKE 21 model to calculate incremental backwater values at different discharges. They compared the results with those estimated via the Henderson and D’Aubuisson formulas. The MIKE 21 model was more accurate in simulating complicated terrain, while empirical formulas were less accurate. For bridges on complex terrain or crucial for flood control, MIKE 21 should be used to estimate upstream backwater depth for better accuracy. Vaheddoost et al. [22] used energy and momentum equations to define the discharge process in a study of overflow calculation for gates under submerged flow conditions. They employed the implicit optimization method to determine contraction and flow coefficients. Mohamed et al. [23] studied the overflow characteristics of gate types with orifices, finding that they attained a higher overflow capacity than traditional gates. Zhang et al. [24] used numerical simulations to analyze the flood diversion effect of the Huayuan Lake flood area in the Huai River Basin under once-in-a-century flood conditions. The results demonstrated that late opening of the gate could improve the flood discharge capacity of the flood area by effectively slowing down the inundation process of the Huayuan Lake flooding area, which is conducive to improving the capacity of the main stream of the Huaihe River to store floodwater. Baird et al. [25] established a two-dimensional numerical model to simulate the flow process through a physical model of rock vanes and bend weirs, obtaining the hydraulic performance of these structures. Seyedjavad et al. [26] investigated the effect of piano key weirs on the river flow velocity at different locations. Li et al. [27] used numerical simulations to study the influence of inlet and outlet width ratios on the overflow process of piano key weirs. Atashi et al. [28] studied the impact of W weirs on water flow via physical model experiments. Skilodimou et al. [29] proposed a simple method to produce a flood hazard assessment map in burned and urban areas, where primary data are scarce, and applied the method to a case study in Nea Makri, Greece. Salehi et al. [30] investigated the discharge characteristics of different types of gates using dimensional analysis and multiple regression techniques, proposing empirical equations for the overflow process of different gate types. In summary, one-dimensional numerical models can effectively reflect the influence of cross structures on the river water level and flow discharge. Previous research has studied the influence of bridges and weirs on the river flood discharge capacity. However, there is still a gap in how different types of bridges, considering changes in weir height, affect river flood discharge capacity.
This article investigates the impact of cross structures, such as weirs and bridges, on the flood-carrying capacity of rivers, using a combined method of physical experiments and numerical simulations. The aim of this study is to calculate and analyze the impact of different dam heights and bridge types on the flood-carrying capacity of mountainous rivers in the urban section of Huang Stream in the Yellow River Basin under 5% flood frequency conditions. Specifically, this study formulates the governing equations of open channel flow based on the Saint-Venant equations, segments the open channel, establishes a node equation at each section’s connection point and develops an overflow model of bridges and weir dams. The physical model of the open channel is simplified and modeled using actual building data and model calculation requirements. The study assesses the influence of these structures on the water level in the Huang Stream urban section in the Yellow River Basin under various working conditions and provides valuable insights for the reconstruction of cross structures in mountainous rivers and for managing flood discharge capacity and flood control.

2. Methodology

2.1. Mathematical Model

River hydraulic simulation analysis was established based on the Saint-Venant equations for flow in open channels. The principle governing equations are described below.
The first group of governing equations is the Saint-Venant equations, which are a set of partial differential equations that describe the flow of water in an open channel. The basic equations for 1D non-constant flow in an open channel, including continuity and dynamic equations, can be written as:
B T Z t + Q x = q
Q t + x Q 2 A + g A Z x + g A Q Q K 2 = 0
where q is the lateral inflow of the river, m 3 / s ;   B T is the river width, m ;   A is the area of water passing section, m 2 ;   Z is the section water level, m ;   Q is the flow rate of section, m 3 / s ;   K is the flow modulus, m 3 / s .
The second control equation is the nodal equation. River sections are connected via nodes. Each node should meet the following two articulation conditions: flow and power articulation conditions. Regarding flow connection conditions, the flow at each node must meet the water balance principle, i.e., the flow into the node at each moment is equal to the change in node water storage, as follows:
j = 1 n Q i j = d ω i d t
where Q i j is the flow of the river j into node i , m 3 / s ; ω i is the storage capacity of node i , m 3 ; and n is the number of channels discharging into node i .
The node provides storage and regulation functions, and the flow continuity at a given node can be expressed as:
H t = Q t S t
where S t is the water area at the node at time t, m 2 ; H is the node level, m ; and Q t is the node flow sum at time t , m 3 / s .
The difference form of the above nodal equation is:
H t + Δ t = H t + Q ¯ t Δ t S ¯ t
Considering nodes without storage capacity, the following applies:
Q ¯ t = 0
Under dynamic connection conditions at a certain node, the water level and flow of each connecting river section and the average water level at the node must meet the actual dynamic connection conditions, which should satisfy the Bernoulli equation.
If the node provides no regulation and storage functions, the power connection conditions can be simplified as follows:
H i = H n
where H i is the water level of the cross-section of the river connected to the node, m ; and H n is the node water level, m .
If a gate or weir occurs at the node or the water-passing area greatly varies, the power connection conditions can be expressed as:
a H i + b Q i + c H j + d Q j = e
In the above equation, when the node is a gate or weir, e does not equal 0; when the node exhibits a highly variable water-passing area, e is 0.
The entire river is a combination of several river sections and nodes. The governing equation is a differential equation system obtained by combining the governing equations of each channel with the connection conditions of each node and the initial and boundary conditions. By numerically solving the differential equations of the river water volume, hydraulic variables such as the water level and flow rate at the designated section of each river channel and at each node can be obtained.
The third control equation is the inner boundary processing equation. The boundary conditions in the model include three types: concentrated side inflow, sudden change in the water cross-section and overflow of the weir and sluice.
1. Concentrated side inflow. Under concentrated side inflow conditions, a virtual reach can be set to satisfy the basic continuity equation, as follows:
Z j = Z j + 1 Q j + Q f = Q j + 1
where Z j   a n d   Z j + 1 denote the water levels in sections j   a n d   j + 1 , respectively, m ;   Q j   a n d   Q j + 1 denote the flow levels in sections j   a n d   j + 1 , respectively, m 3 / s ;   a n d   Q f is the side concentrate inflow, m 3 / s .
2. Sudden change in the water-passing section. After the boundary has been generalized into a number of one-dimensional river sections connected end to end, the area of each section may not change continuously, and a sudden change in the water-passing section may occur. The compatible conditions are as follows:
Q j = Q j + 1 Z j + u j 2 2 g = Z j + 1 + u j + 1 2 2 g + ζ u j u j + 1 2 2 g
where u j   a n d   u j + 1 denote the flow rates in sections j   a n d   j + 1 , respectively, m 3 / s ; ζ is the local drag coefficient; and g is the acceleration of gravity, m 2 / s .
3. Overflow of weirs and gates. In actual projects, gates are often set up in rivers to control the water volume or water level. The following 3 types of inflow and outflow conditions exist:
When closing the gate, the following applies:
Q = 0
When opening the gate for diversion purposes ( Z d > Z u ) , if Z u Z 0 2 3 Z d Z 0 , free flow occurs, which can be determined as follows:
Q = u 1 ϕ B 2 g Z d Z 0 3 2
If Z u Z 0 > 2 3 Z d Z 0 , the submerged outflow can be determined as:
Q = u 2 ϕ B 2 g ( Z d Z 0 ) Z d Z u
When opening the gate for drainage purposes ( Z d < Z u ), if Z d Z 0 2 3 Z u Z 0 , free flow occurs, which can be obtained as:
Q = u 1 ϕ B 2 g Z u Z 0 3 2
If Z d Z 0 > 2 3 Z u Z 0 , at this point the gate is flooded. The submerged outflow can be obtained as:
Q = u 2 ϕ B 2 g Z u Z 0 Z u Z d
where u 1 is the discharge coefficient of free flow; u 2 is the discharge coefficient of submerged outflow; ϕ is the relative opening height of the gate; B is the width of the gate opening, m ; Q is the drainage flow rate, m 3 / s ; Z u is the upstream water level of the gate, m ; Z d is the downstream water level of the gate, m ; and Z 0 is the gate bottom elevation, m .
The fourth control equation is the bridge backwater height calculation equation. Bridges can be divided into two types: flat slab bridges and arch bridges. The arch bridge overcurrent can be calculated as follows:
Q = 0.7083 K 2 g Y u 3 2 b 1 0.1294 Y u l r 2 0.0177 Y u l r 4
where K is the flow coefficient; Y u is average water depth upstream of the bridge; b is the bridge opening width; r is radius of the curvature; and Y u l is the limit value of the average water depth upstream of the bridge (for Y u r < 1.49555 , Y u l = Y u ; for Y u r > 1.49555 , Y u l = 1.49555 r ).
A flat slab bridge is a common kind of bridge structure which consists of several beams and plates. The overcurrent of piers of flat slab bridges can be obtained as:
Q = K b 2 g Y θ V d S 2 2 g h u h d + β V u s 2 2 g 1 2
where Y is the downstream depth of the bridge, m ;   θ is an adjustment coefficient (the default value is 0.3); V d and V u are the flow velocities upstream and downstream, respectively, of the bridge, m 3 / s ;   h u and h d are the water levels in the upstream and downstream sections, respectively, of the bridge, m ;   a n d   β is an adjustment factor, which varies with the bridge opening.

2.2. Model Solution

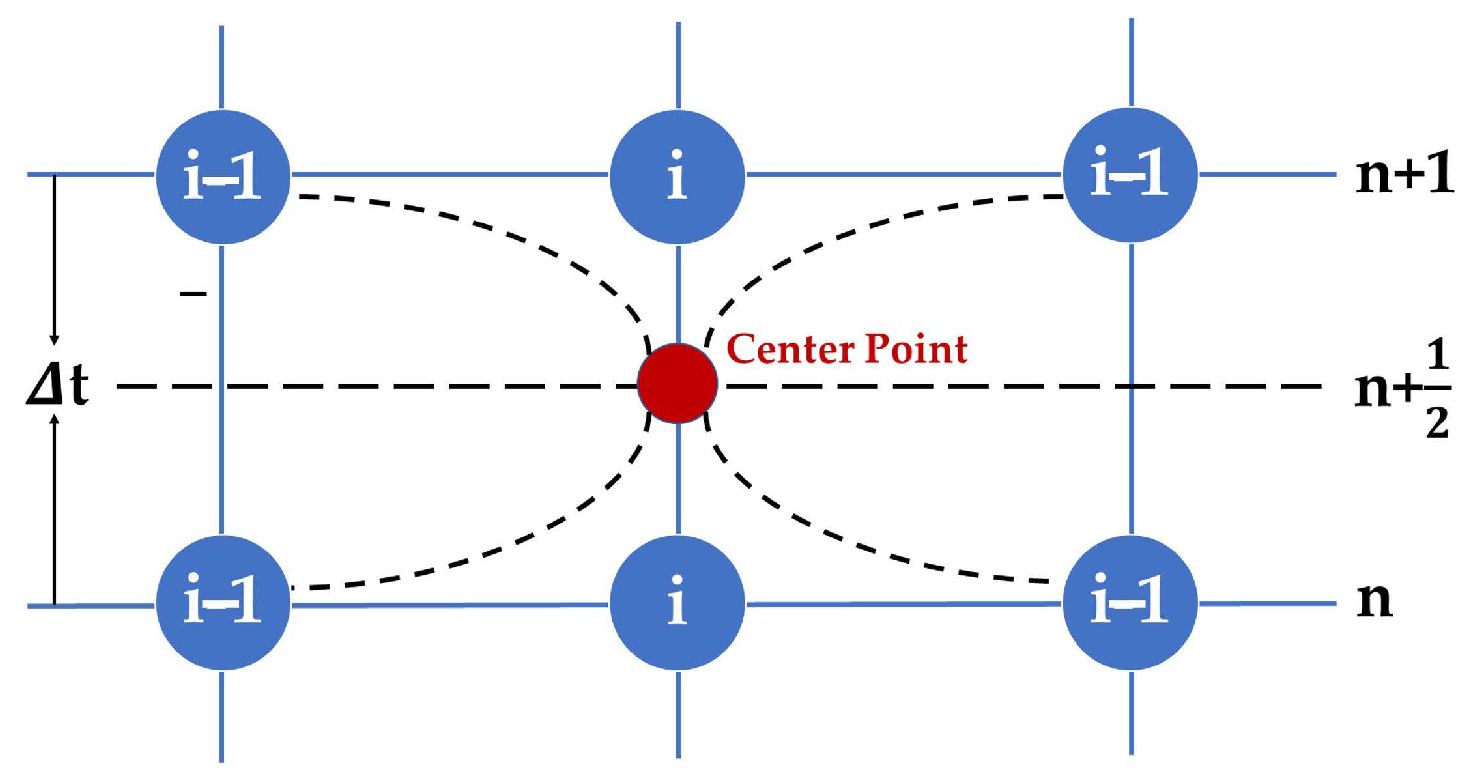
The basic principle of the model solution is to break the river down into a series of single channels, from tributaries to the main stream and from upstream to downstream, which can be solved via the calculation method of a single channel. To facilitate the calculation and maintain data continuity, the river channel should be generalized to establish a numerical model and determine the solution. The basic principle of river generalization is that the storage capacity, water transfer capacity and water surface ratio of the generalized river are similar to those of the actual river. The Saint-Venant equations can mainly be solved via the characteristic line and finite difference methods. This study chose the Abbott–Ionescu six-point implicit finite difference scheme in the solution process. This scheme does not calculate the water level and discharge at each grid point at the same time, but alternately calculates the water level or discharge in a sequential manner, referred to as points H and Q, as shown in Figure 1 and Figure 2, respectively. This format is unconditionally stable and provide stronger stability with a lower error rate. It is also faster.

3. Case Analysis and Results

3.1. Overview of the Research Area

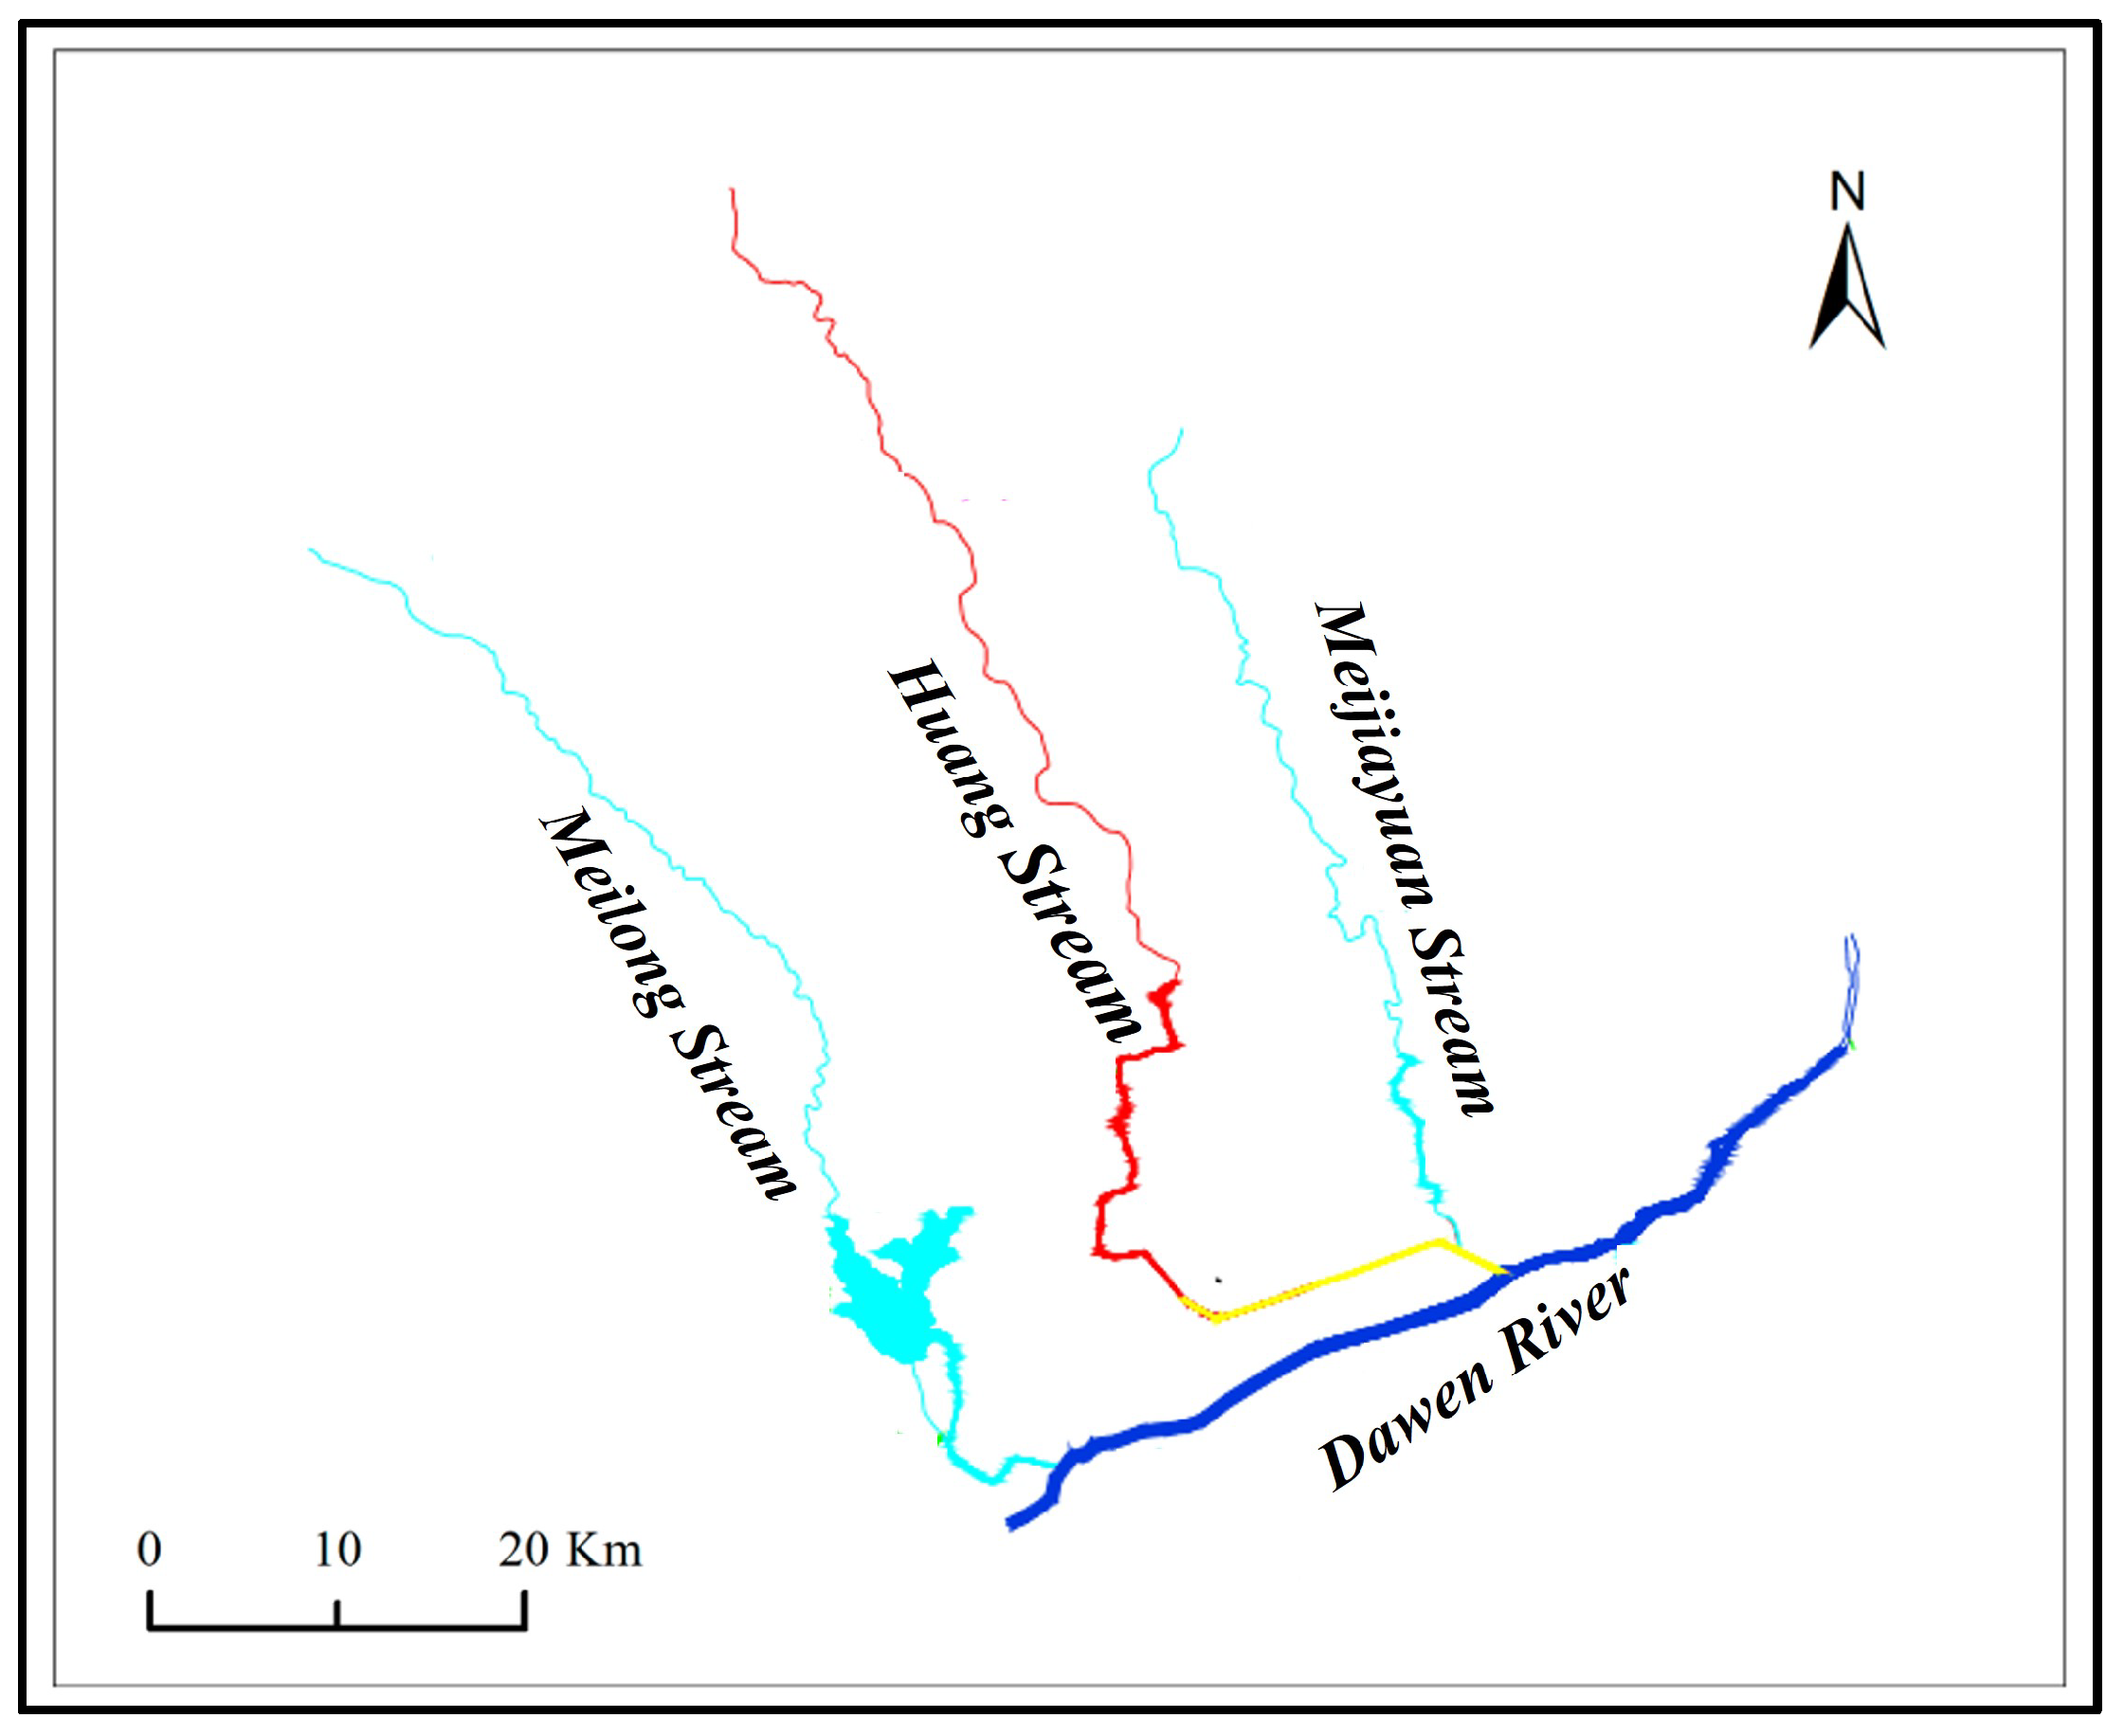
The Huang Stream is a first-class tributary of the Dawen River, which is part of the Yellow River Basin, as shown in Figure 3. The downstream reach includes the central urban area of Yiyuan County. This area is located in the middle of Zibo City in Shandong Province, China, which has a land area of 1636 km2. There are many high mountains, valleys, pits and streams upstream of the Huang Stream, with torrents and surging waves during the rainy season. During the dry season, the river dries up, and the flow rate greatly changes. After inflow into Yiyuan County, the flow velocity declines, which facilitates sediment deposition, and the riverbed is relatively flat. The vegetation upstream of the Huang Stream is abundant. The terrain on both banks of the middle and lower reaches is low. In cases of high floods, the main river channel overflows into the low-lying areas on both banks, driving sediment into the river. Bridges and weirs have been built in the Huang Stream for flood and sand control purposes. The study area is located downstream from the Huang Strean reach where it joins the Dawen River and is depicted in yellow in Figure 3.

3.2. River Simplification

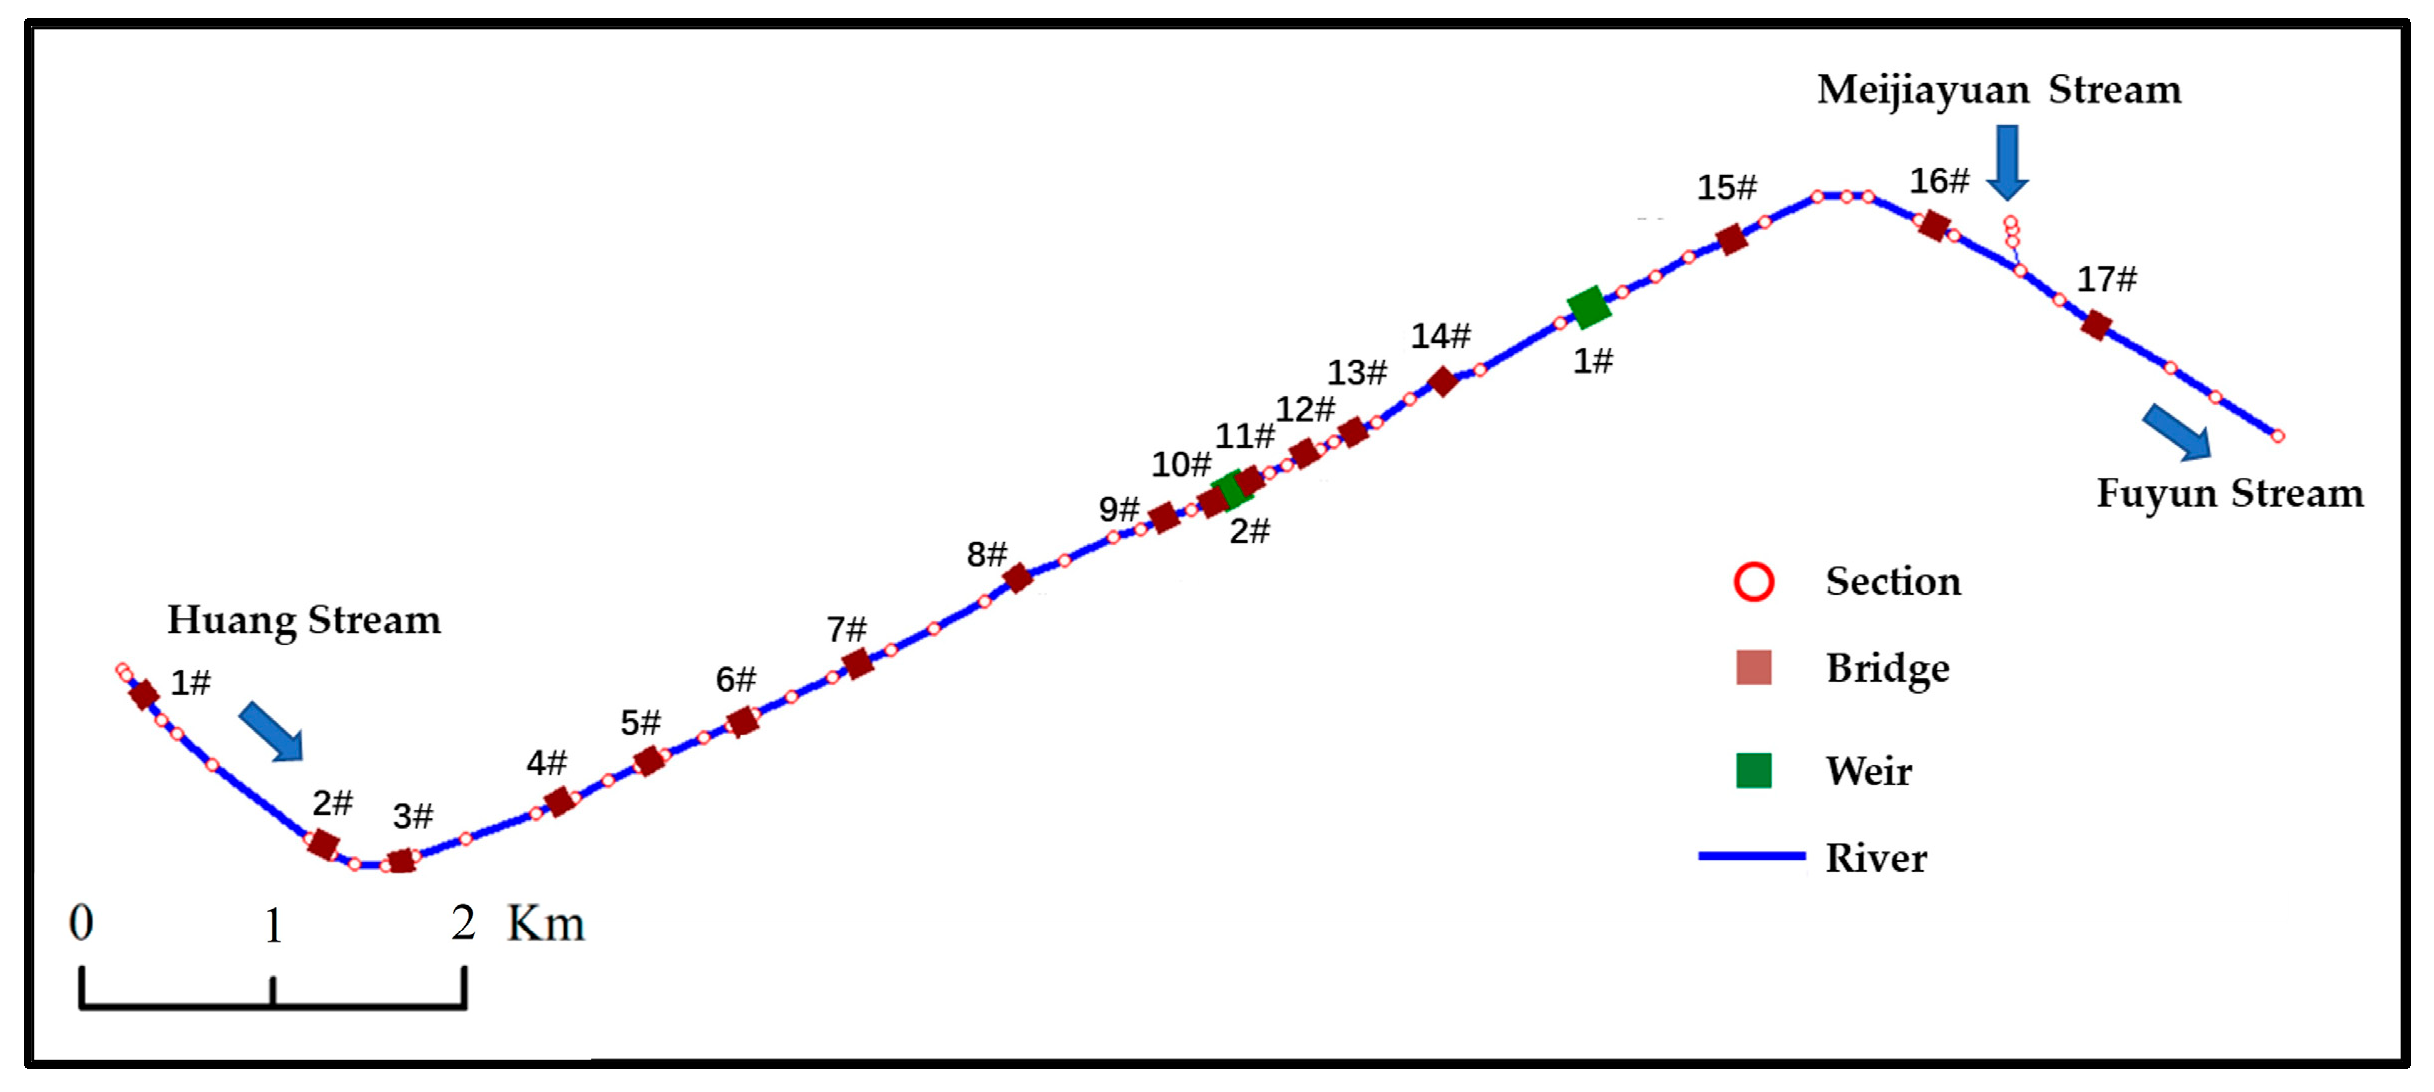
The analysis of the impact of cross structures on the flood discharge capacity of mountain rivers primarily focused on the urban section of the Huang Stream. The study area begins near the power building upstream of the Huang Stream and extends to the confluence of the Huang Stream and Dawen River, covering a total length of 1877.65 m. Within this study area, two types of cross structures are present: weirs and bridges. There are a total of fifteen flat slab bridges, two arch bridges and two weirs. The river simplification process takes into account the Huang Stream, Meijiayuan Stream and the confluence of rivers. Following the fundamental principle of river simplification, fifty-four sections of the Huang Stream and three sections of the Meijiayuan Stream were considered as representative sections. Additionally, seventeen bridges and two weirs were constructed along the river, resulting in a total number of seventy-six sections, as depicted in Figure 4.
Based on the site reconnaissance of each river section’s riverbed and bank, the roughness values were preliminarily determined within the range of 0.025 to 0.04. Rate-constant roughness data using measured flood data, obtained from measured flood data on 22 June 2014, were adopted. The final roughness values were assigned as follows: 0.035 for mortar and masonry revetment, 0.03 for concrete revetment, 0.035 for stone bank revetment, 0.04 for river sections with lush vegetation and 0.03 for newly built dry stone revetment. The calculation time step was set at 4 s.

3.3. Hydraulic Calculation Boundary Conditions

The study area begins upstream of bridge #1 in the Huang Stream, with the Meijiayuan Stream joining the Huang Stream between bridges 16# and 17# and eventually flowing into the Dawen River downstream from bridge 17#. In accordance with the Standards for Flood Control in China [11], a 5% flood frequency was selected as the primary control boundary for this study. The peak flow was applied as the inlet boundary condition, with the Huang Stream having a peak flow of 140 m3/s and the Meijiayuan Stream having a peak flow of 35.8 m3/s. The water level at the confluence of the Huang Stream and Dawen River was set as the outlet boundary at 128.20 m.

3.4. Flood Discharge Capacity under Current Conditions

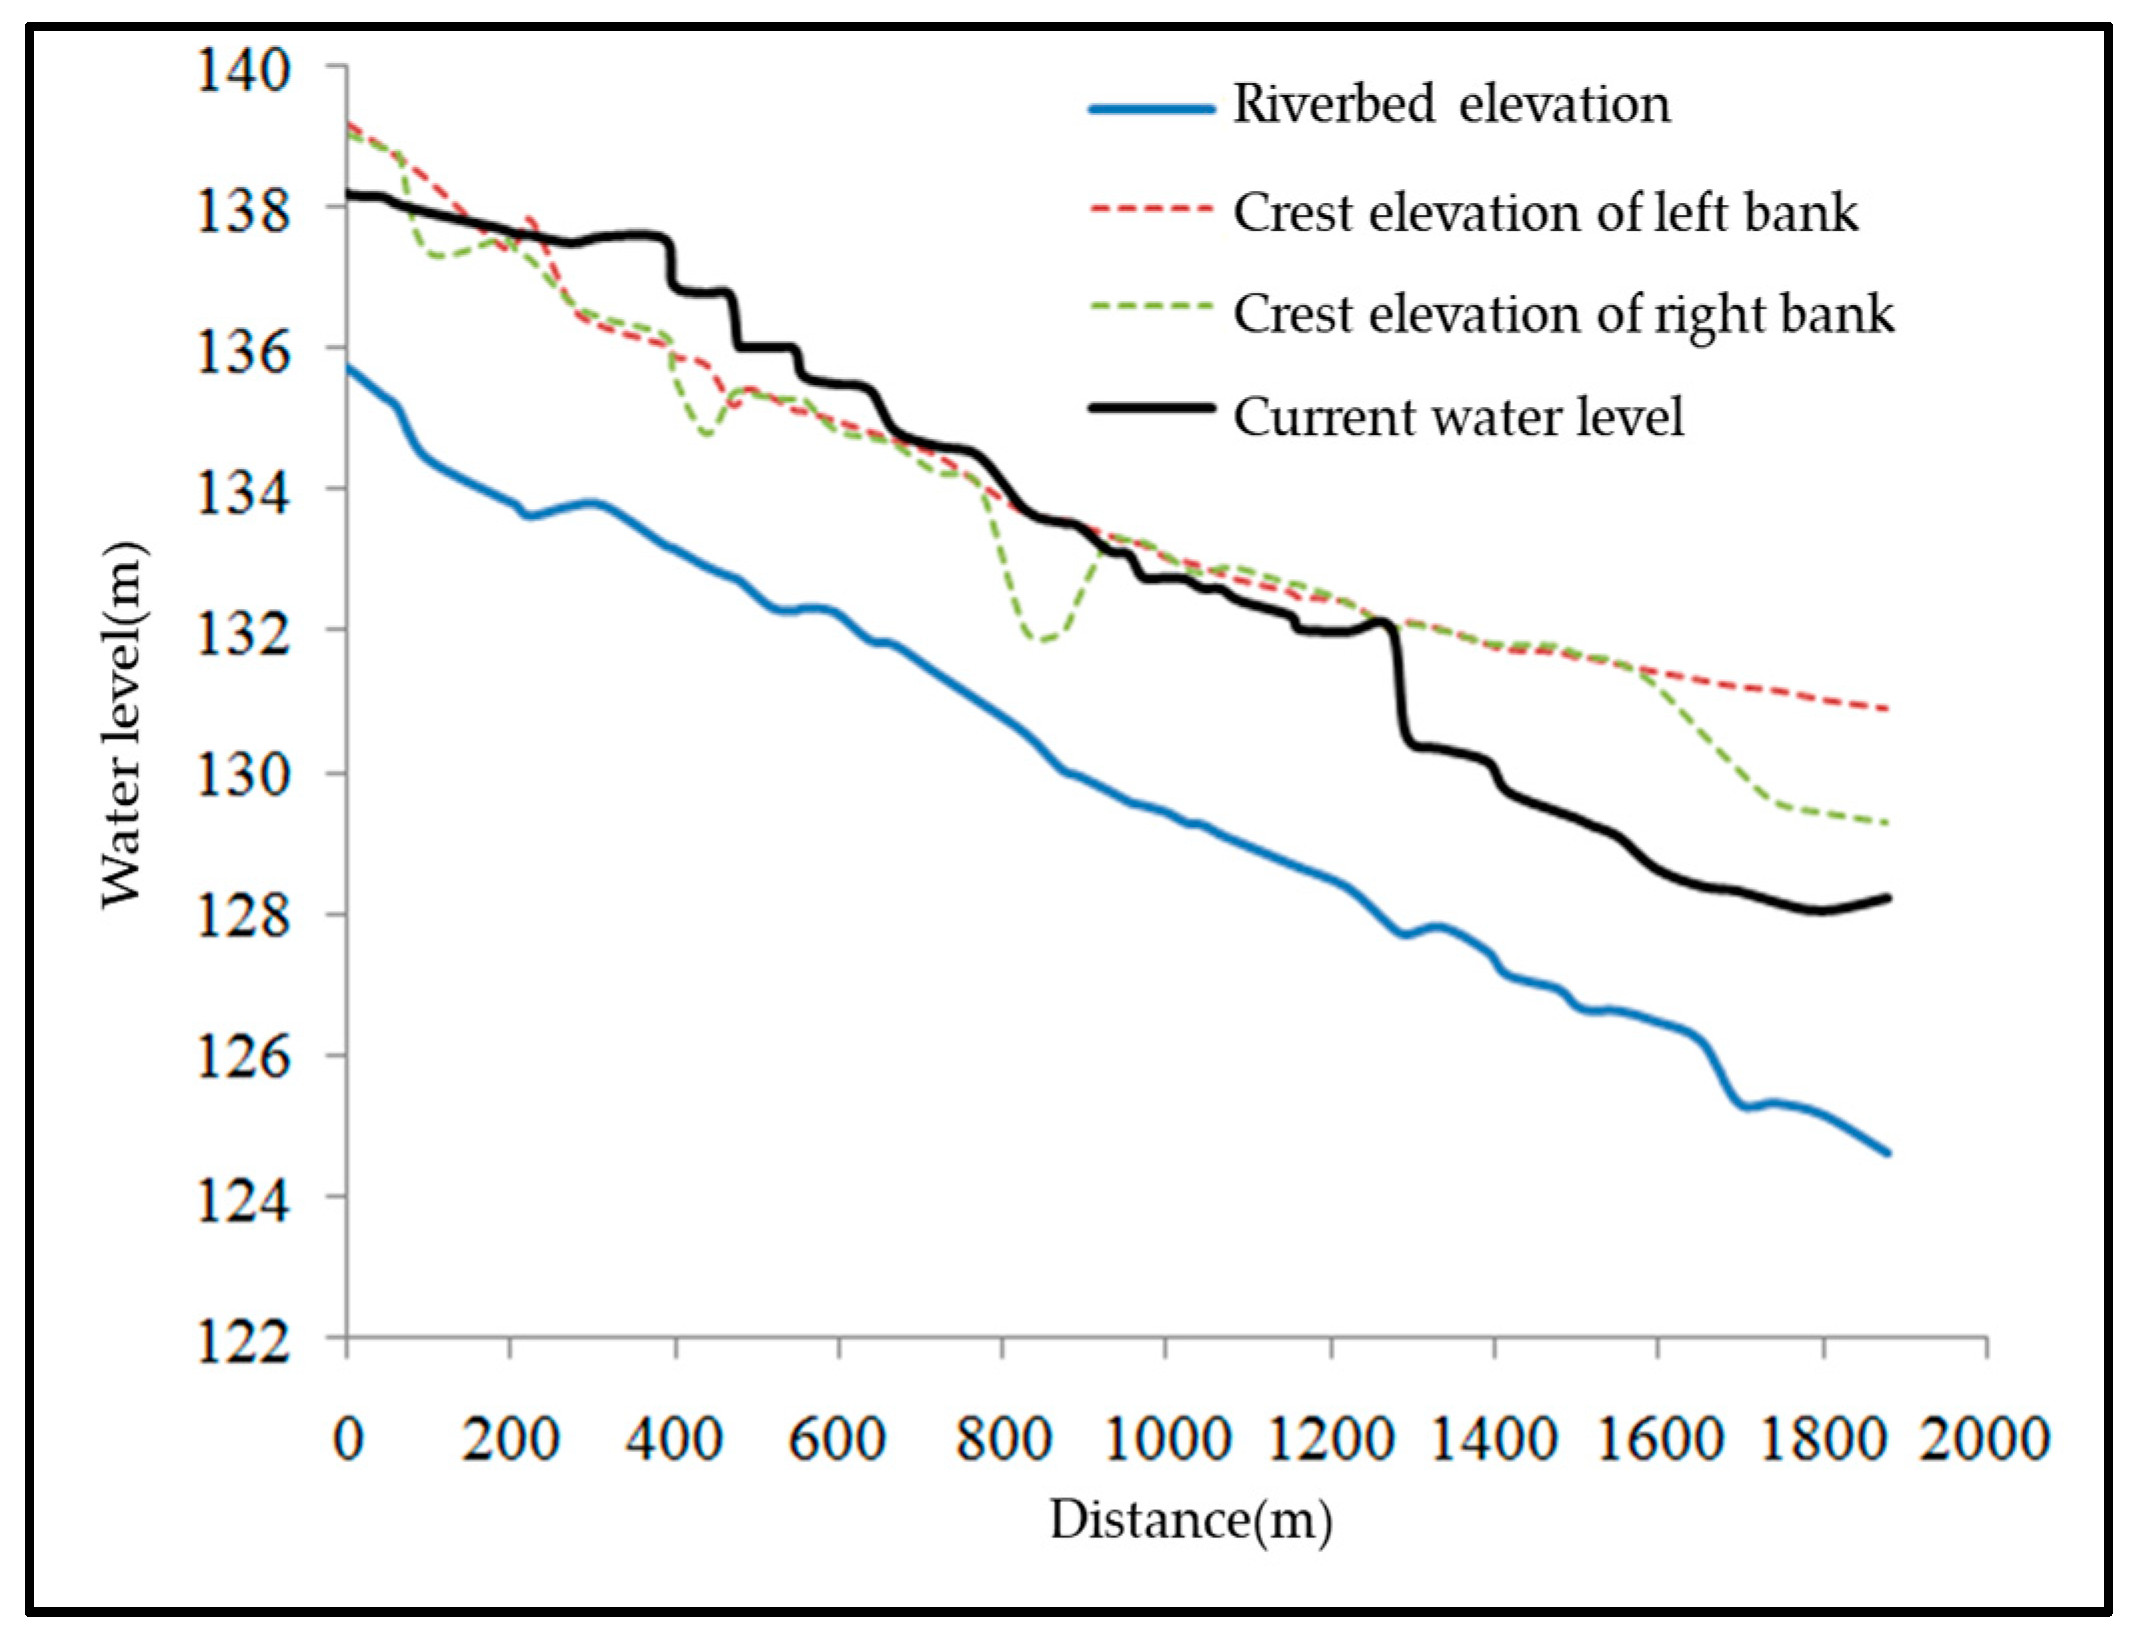
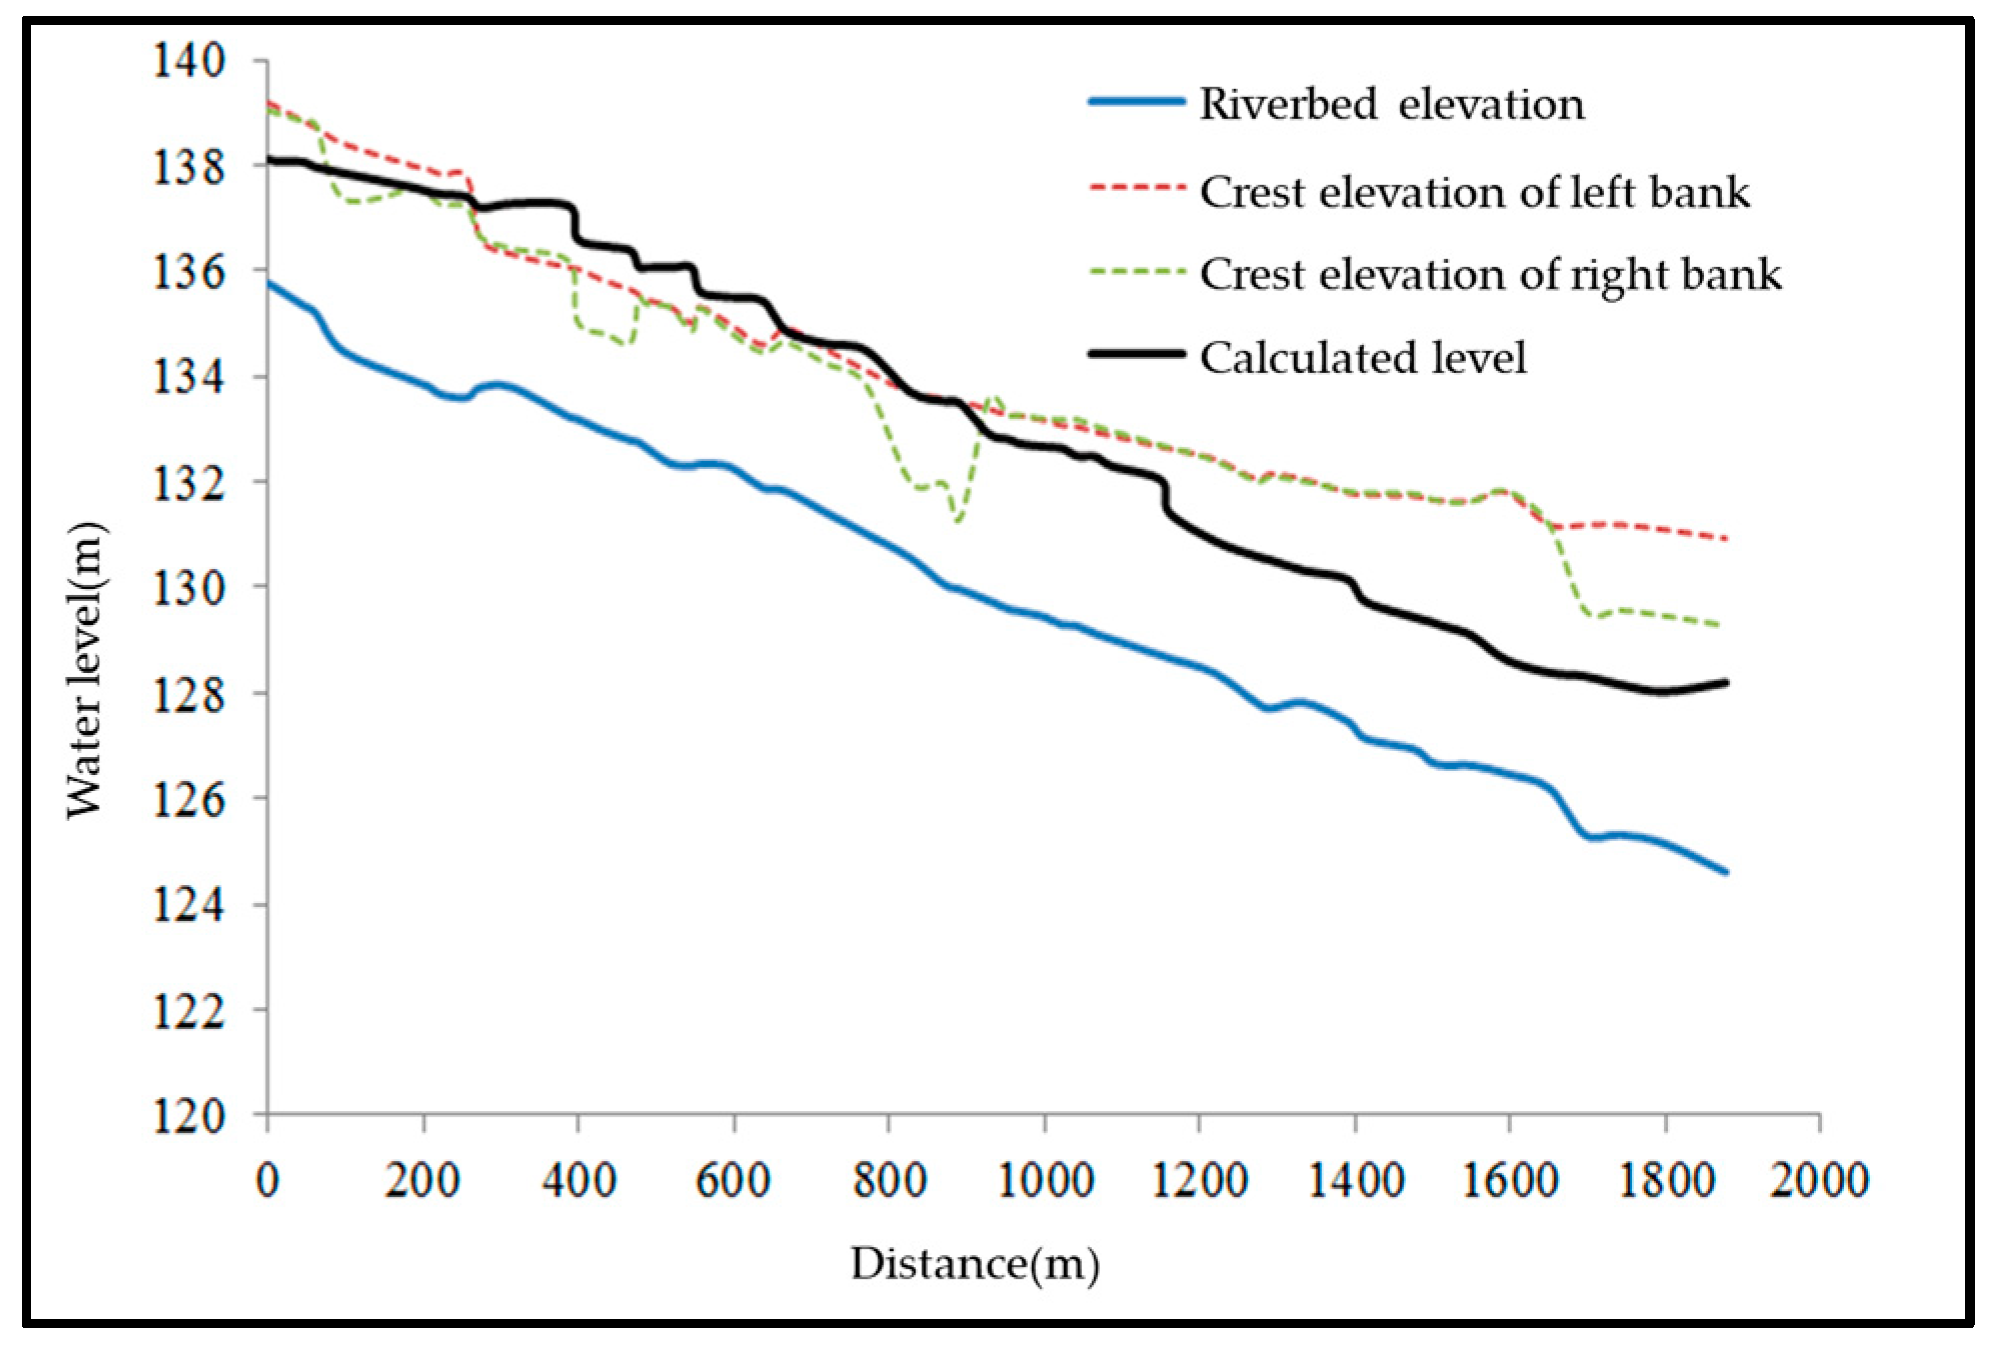
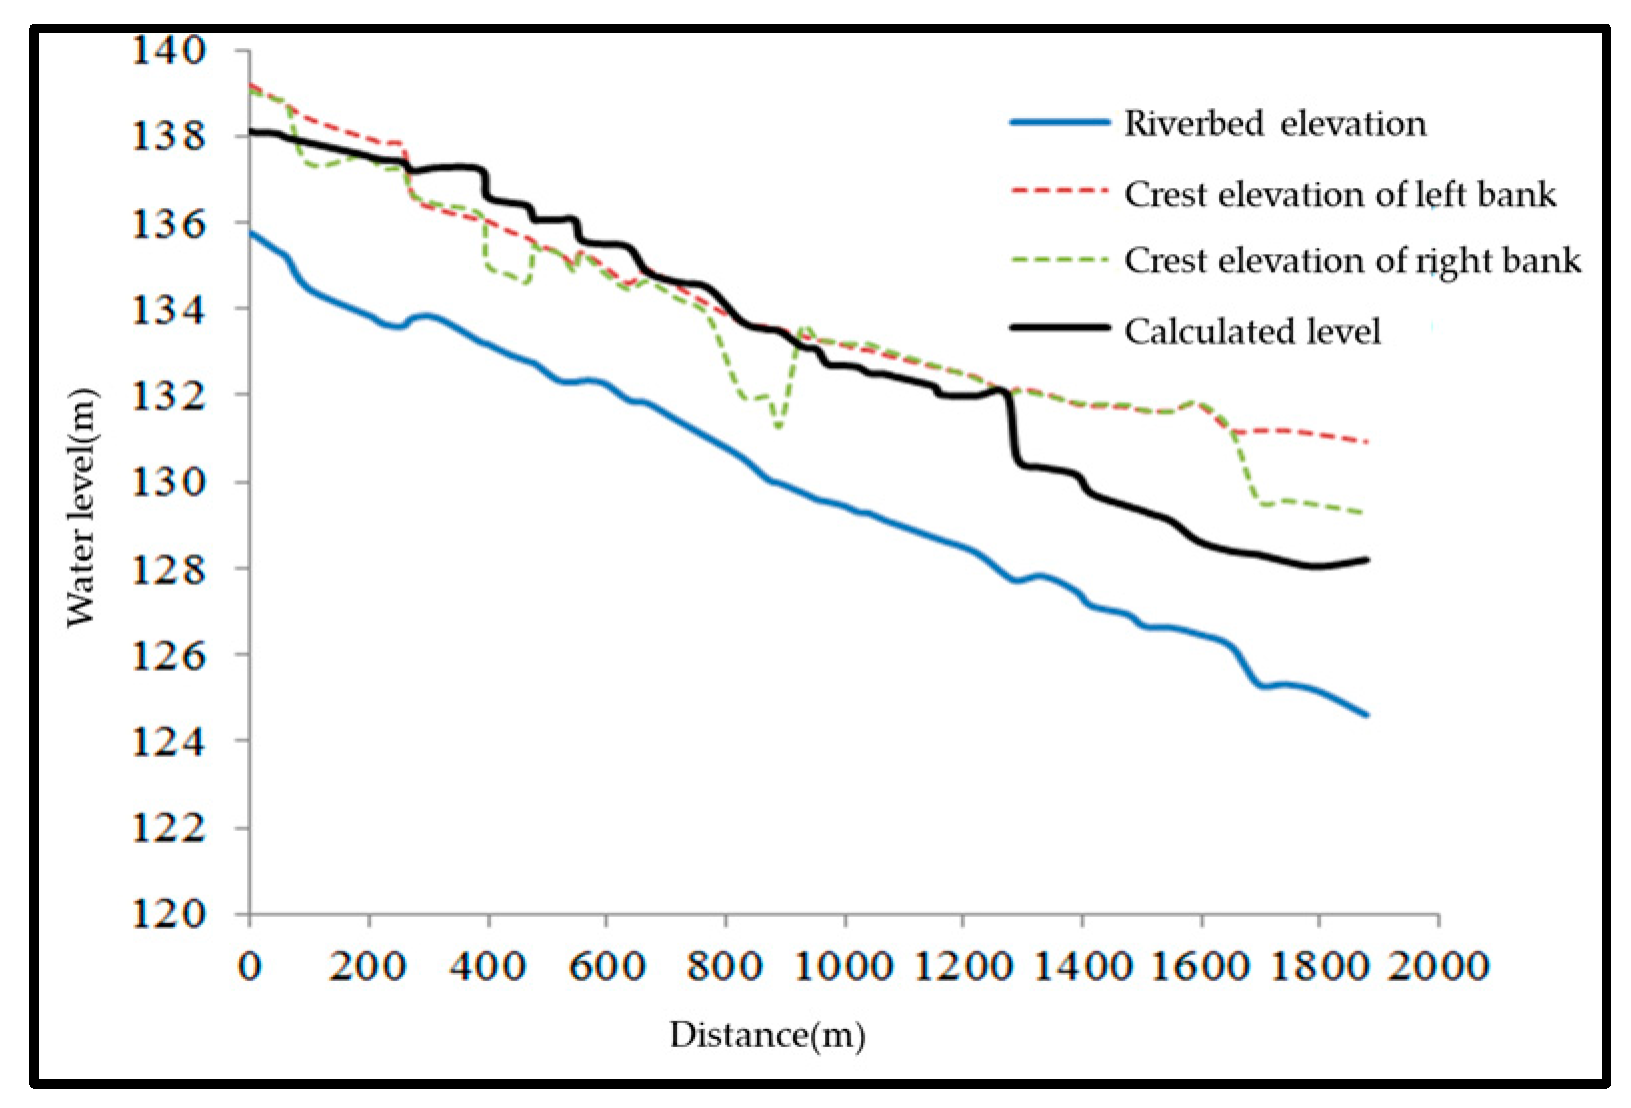
Based on the calculation results of the river’s flood discharge capacity under 5% flood frequency conditions, it was observed that the left bank overflow area ranged from 255.84 to 636.54 m in length, accounting for 20.28% of the total river length. The maximum water level exceeding the dam was 1.22 m at 380.70 m. Similarly, the right bank overflow area ranged from 188.00 to 891.53 m in length, representing 37.47% of the total river length. The maximum water level exceeding the dam reached 1.05 m at 436.24 m. Thus, under 5% flood frequency conditions, 79.7% and 62.5% of the river sections on the left and right banks, respectively, met the flood control standard. The current water level is illustrated in Figure 5. It is evident that multiple overflow areas prone to flood discharge still exist, but the specific impact of each cross structure remains unknown. To facilitate the reconstruction of cross structures and enhance the river’s flood discharge capacity, it is crucial to calculate the degree of impact of each weir and bridge on flood discharge.

3.5. Analysis of the Influence of Weirs on the Flood Discharge Capacity

The main impact of weirs can be represented by the backwater height, which could be analyzed via the backwater range and the maximum water level at weirs. There are two weirs in the Huang Stream analysis reach, which are located at 1283.76 m (denoted as the #1 weir) and 962.43 m (denoted as the #2 weir). At present, the heights of these weirs are 0.75 and 2.0 m, respectively, denoted as condition 1. Condition 2 refers to the removal of #1 weir, condition 3 refers to the removal of #2 weir, and condition 4 refers to the removal of both weirs.
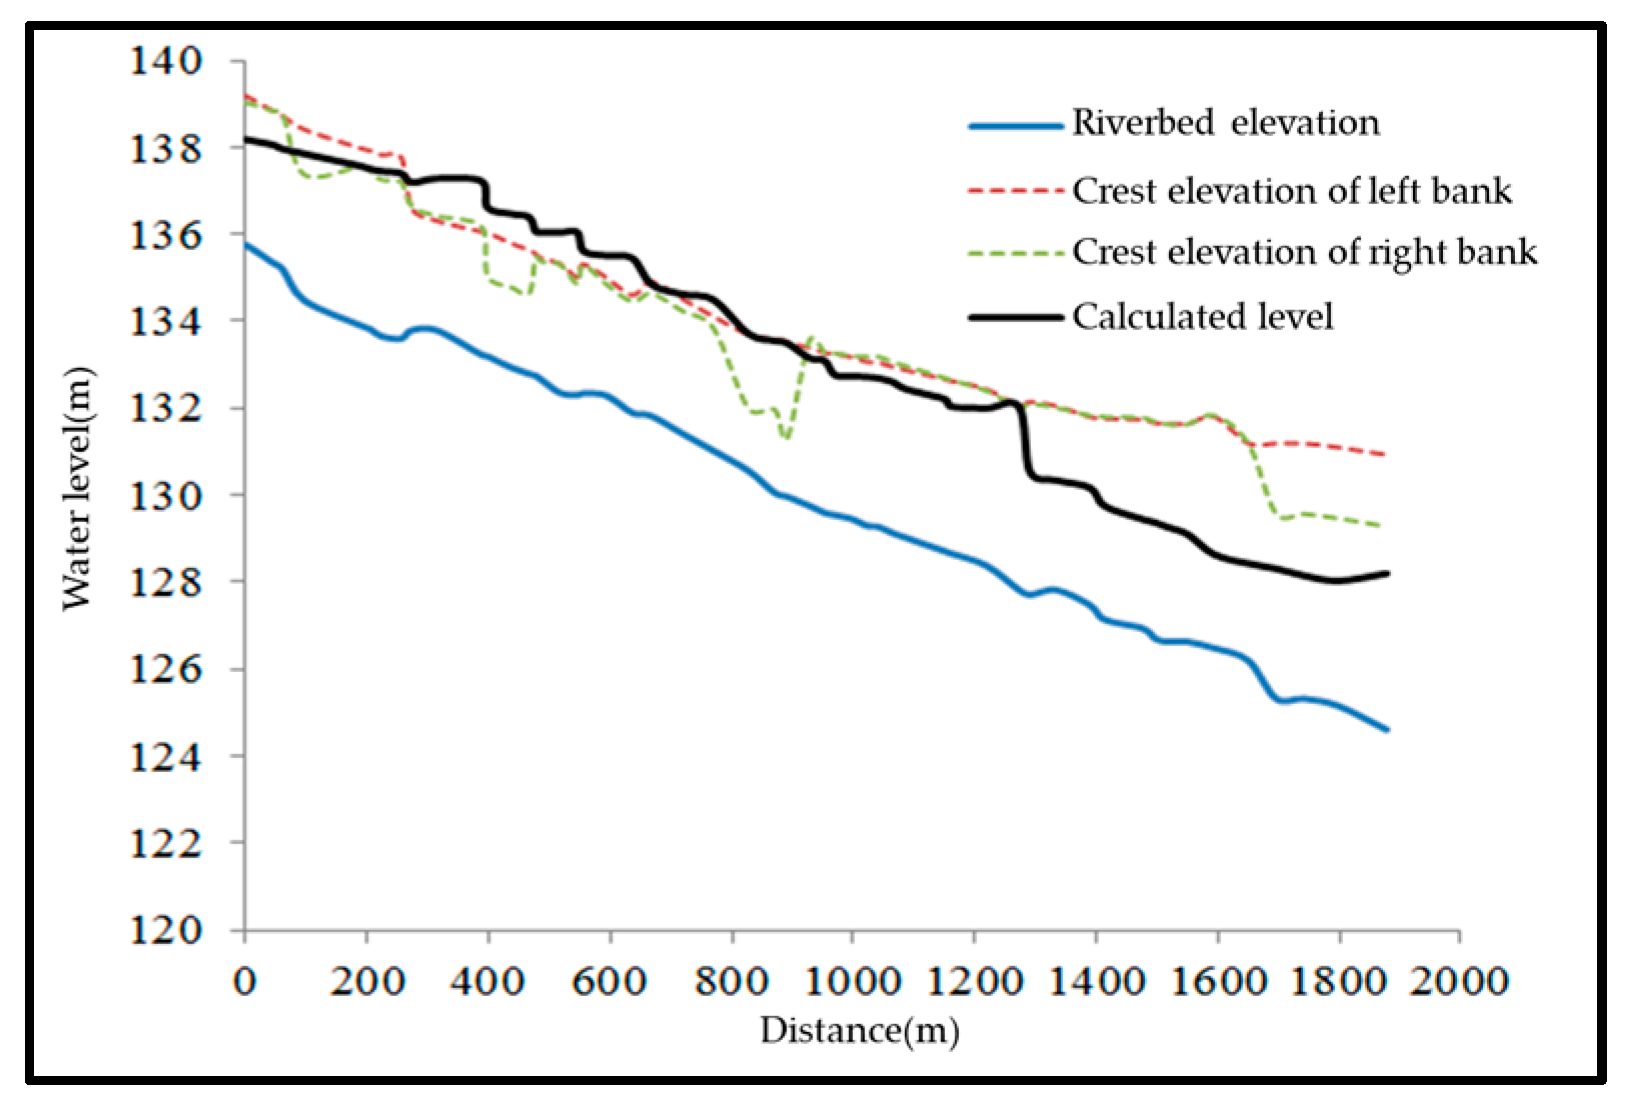
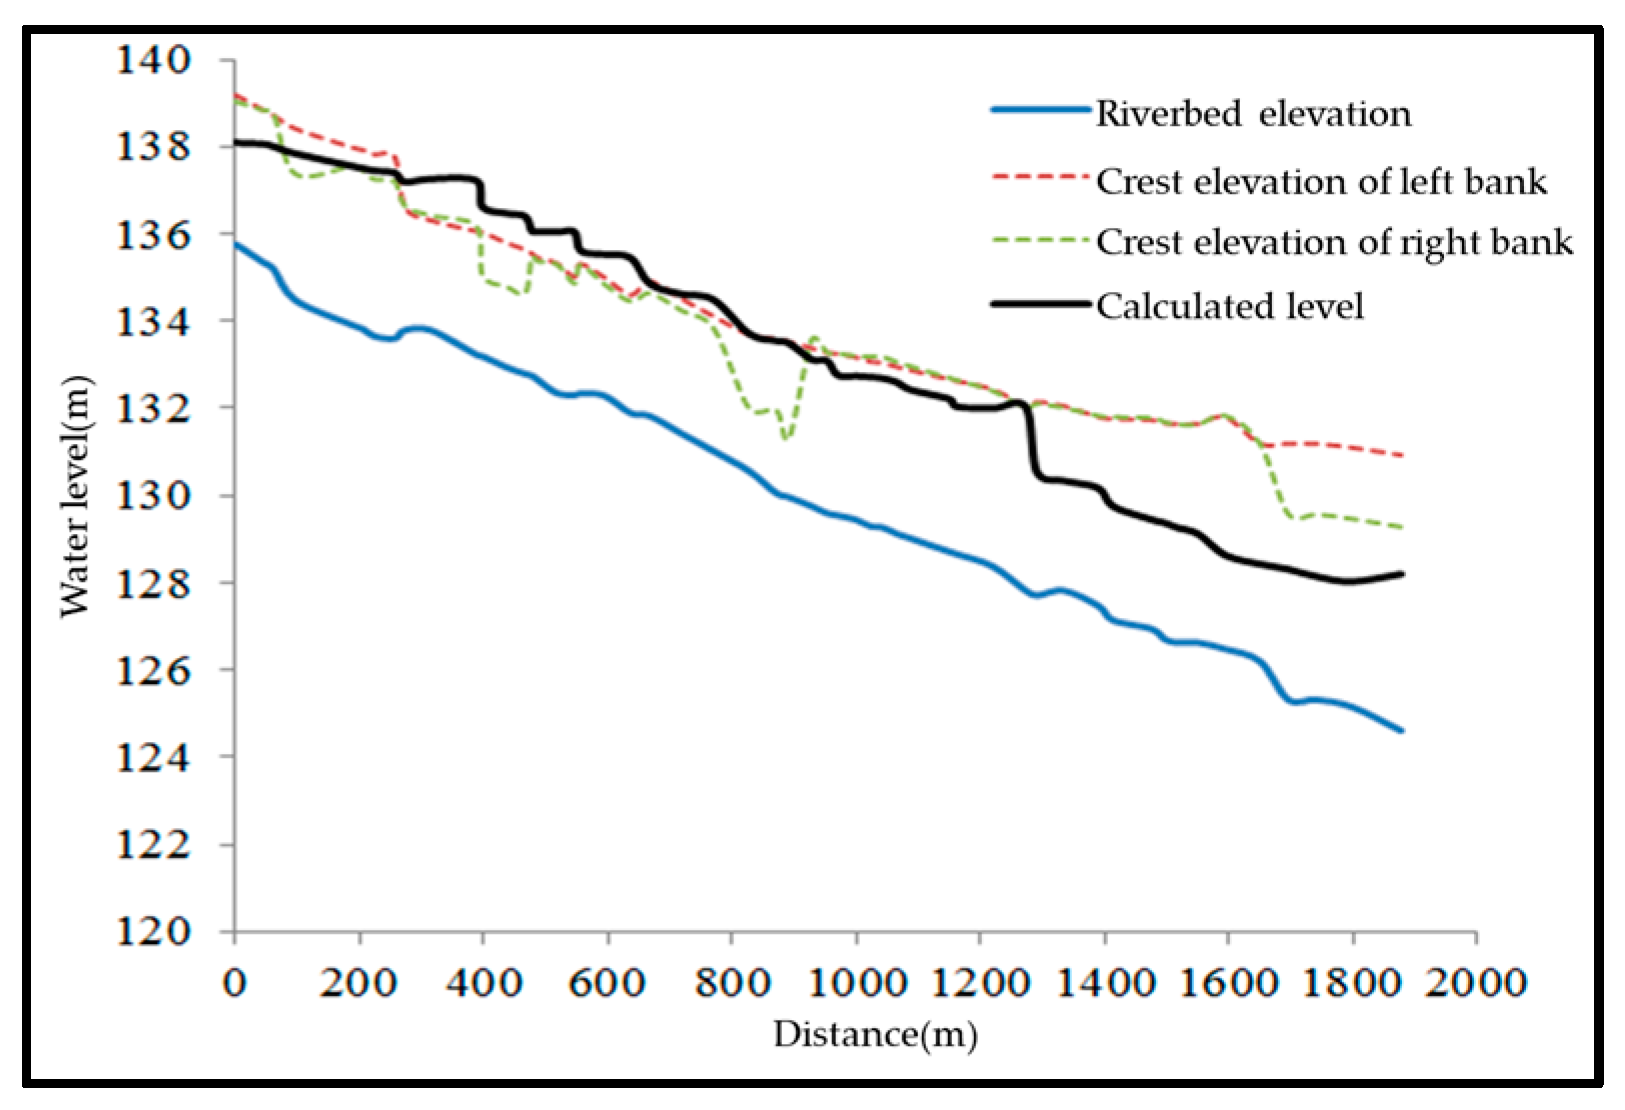
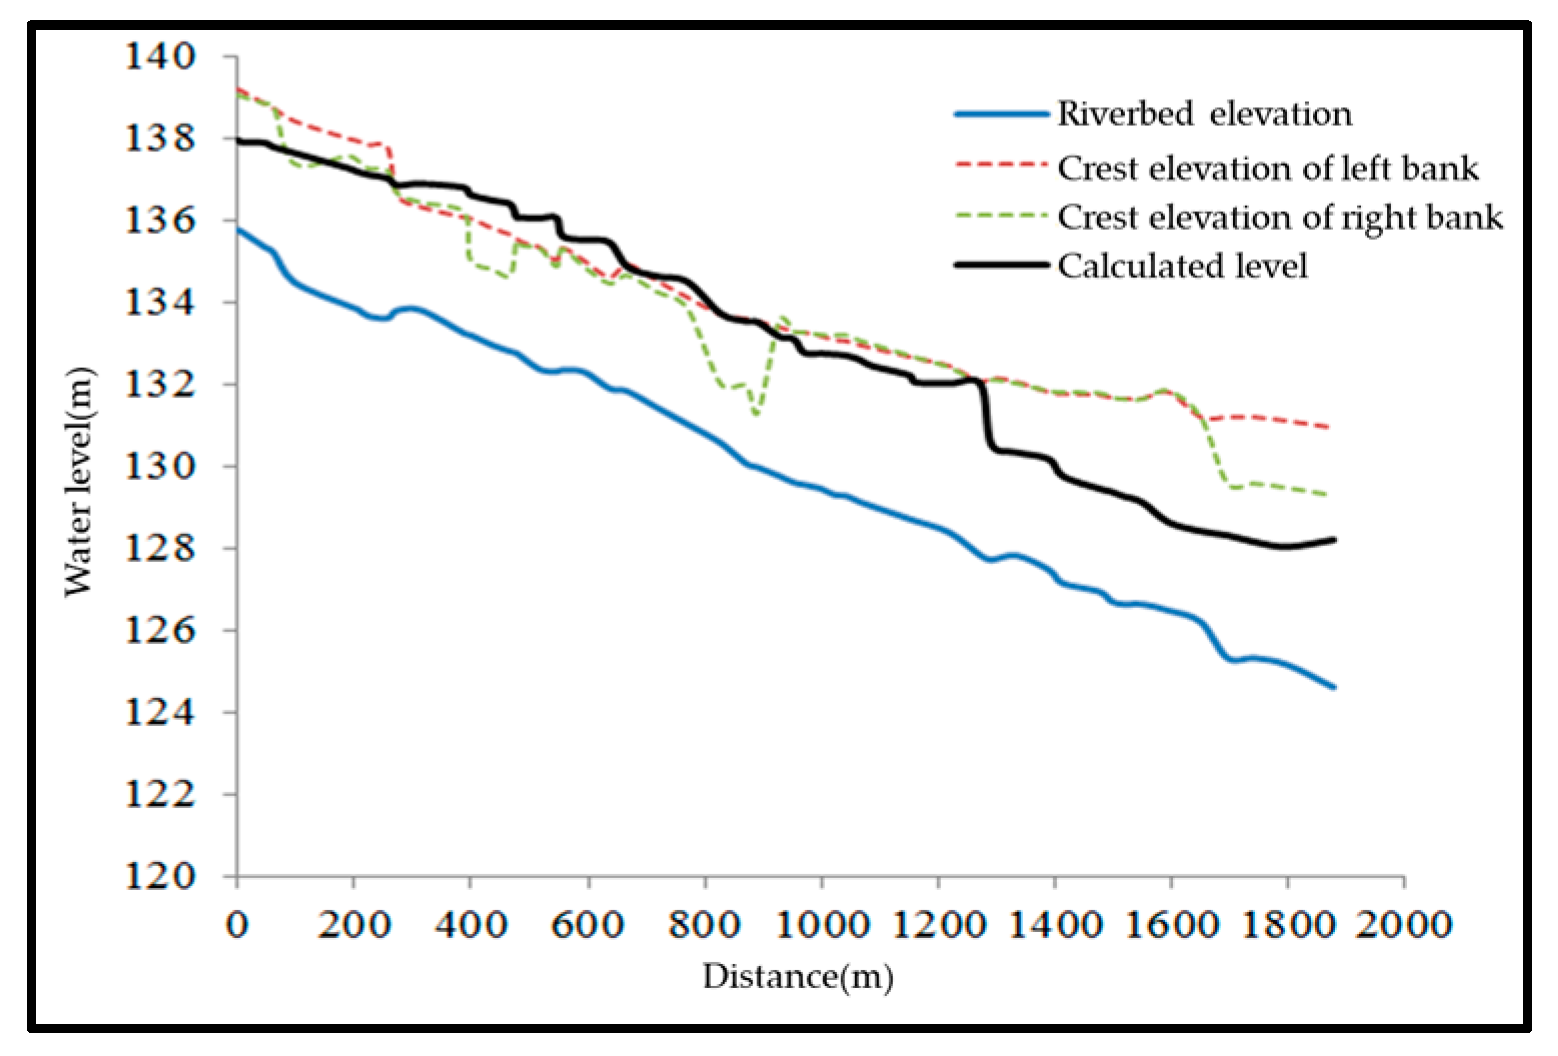
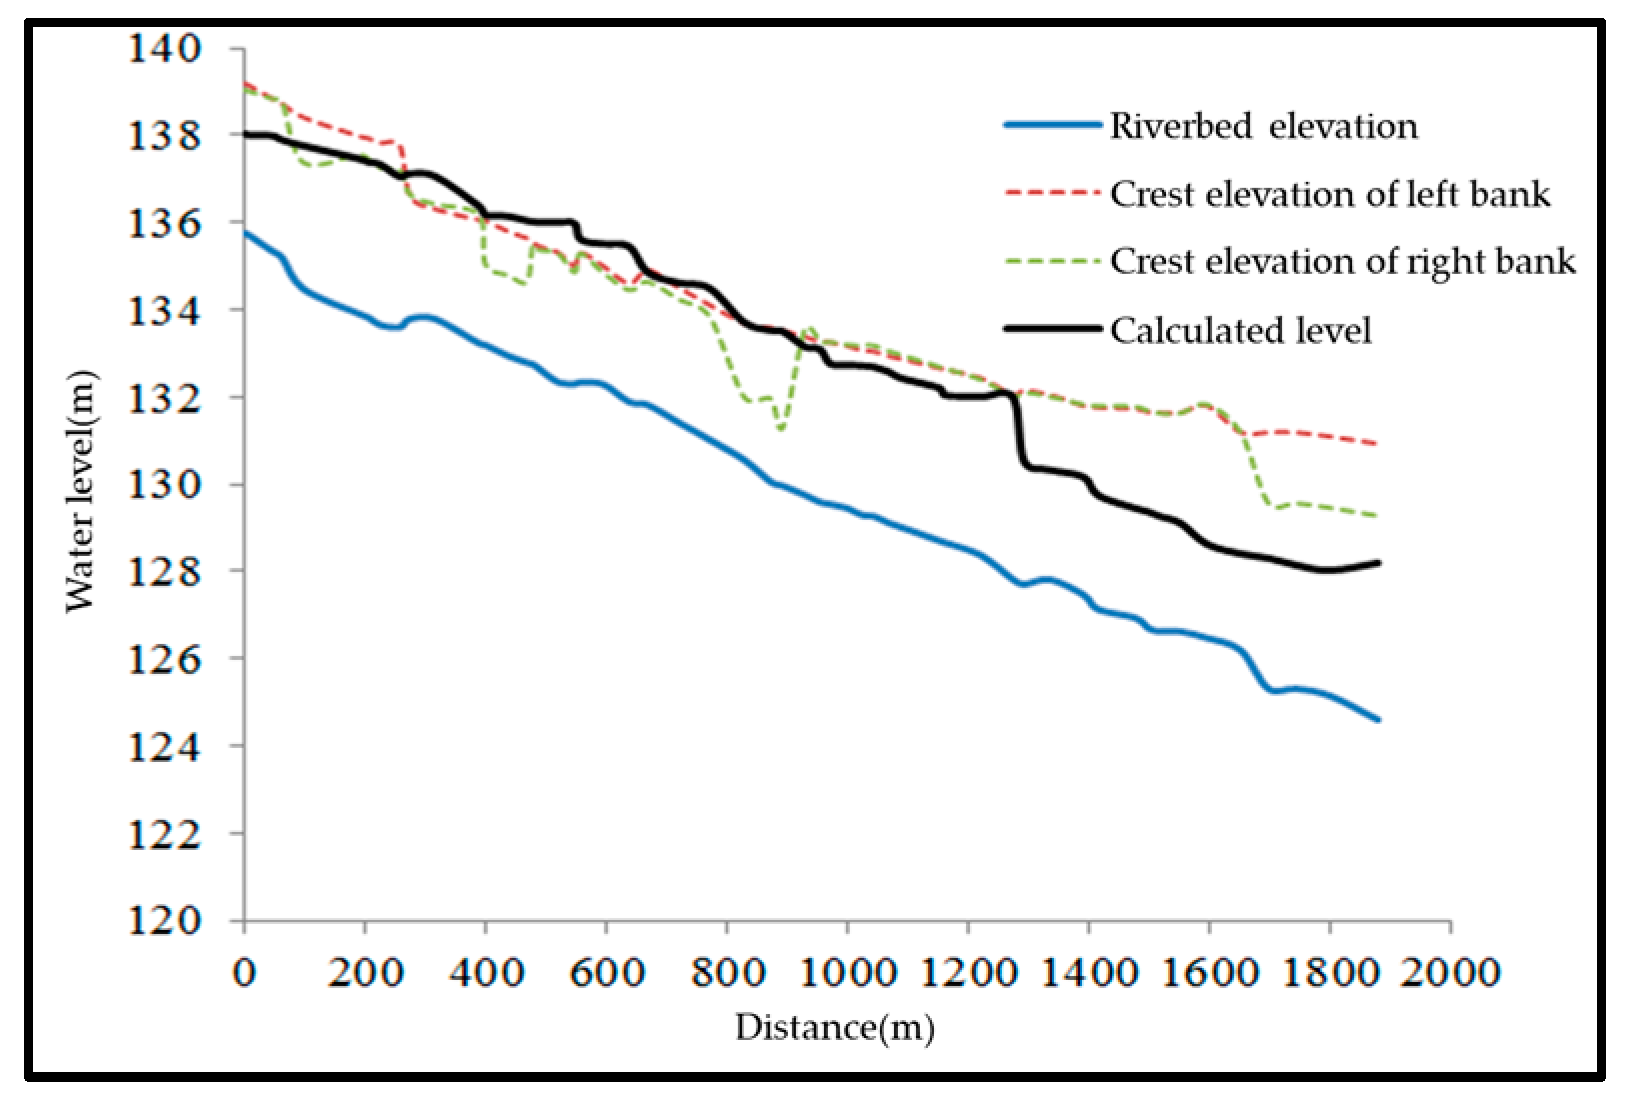
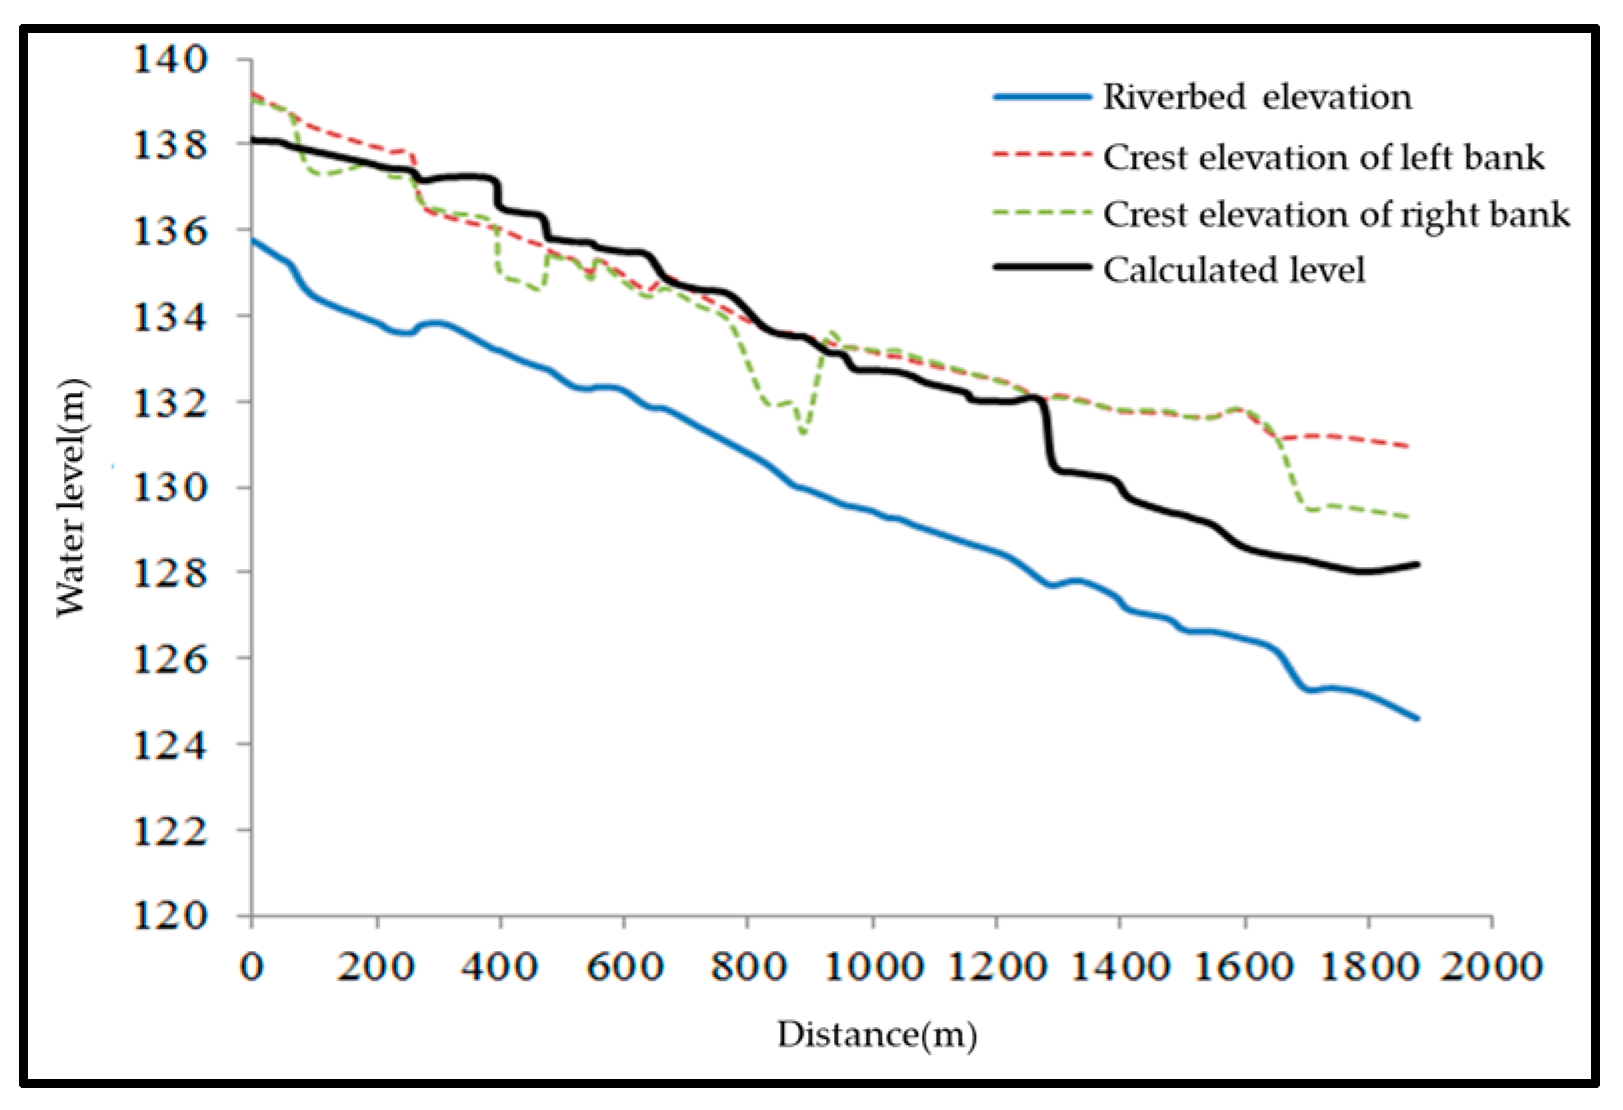
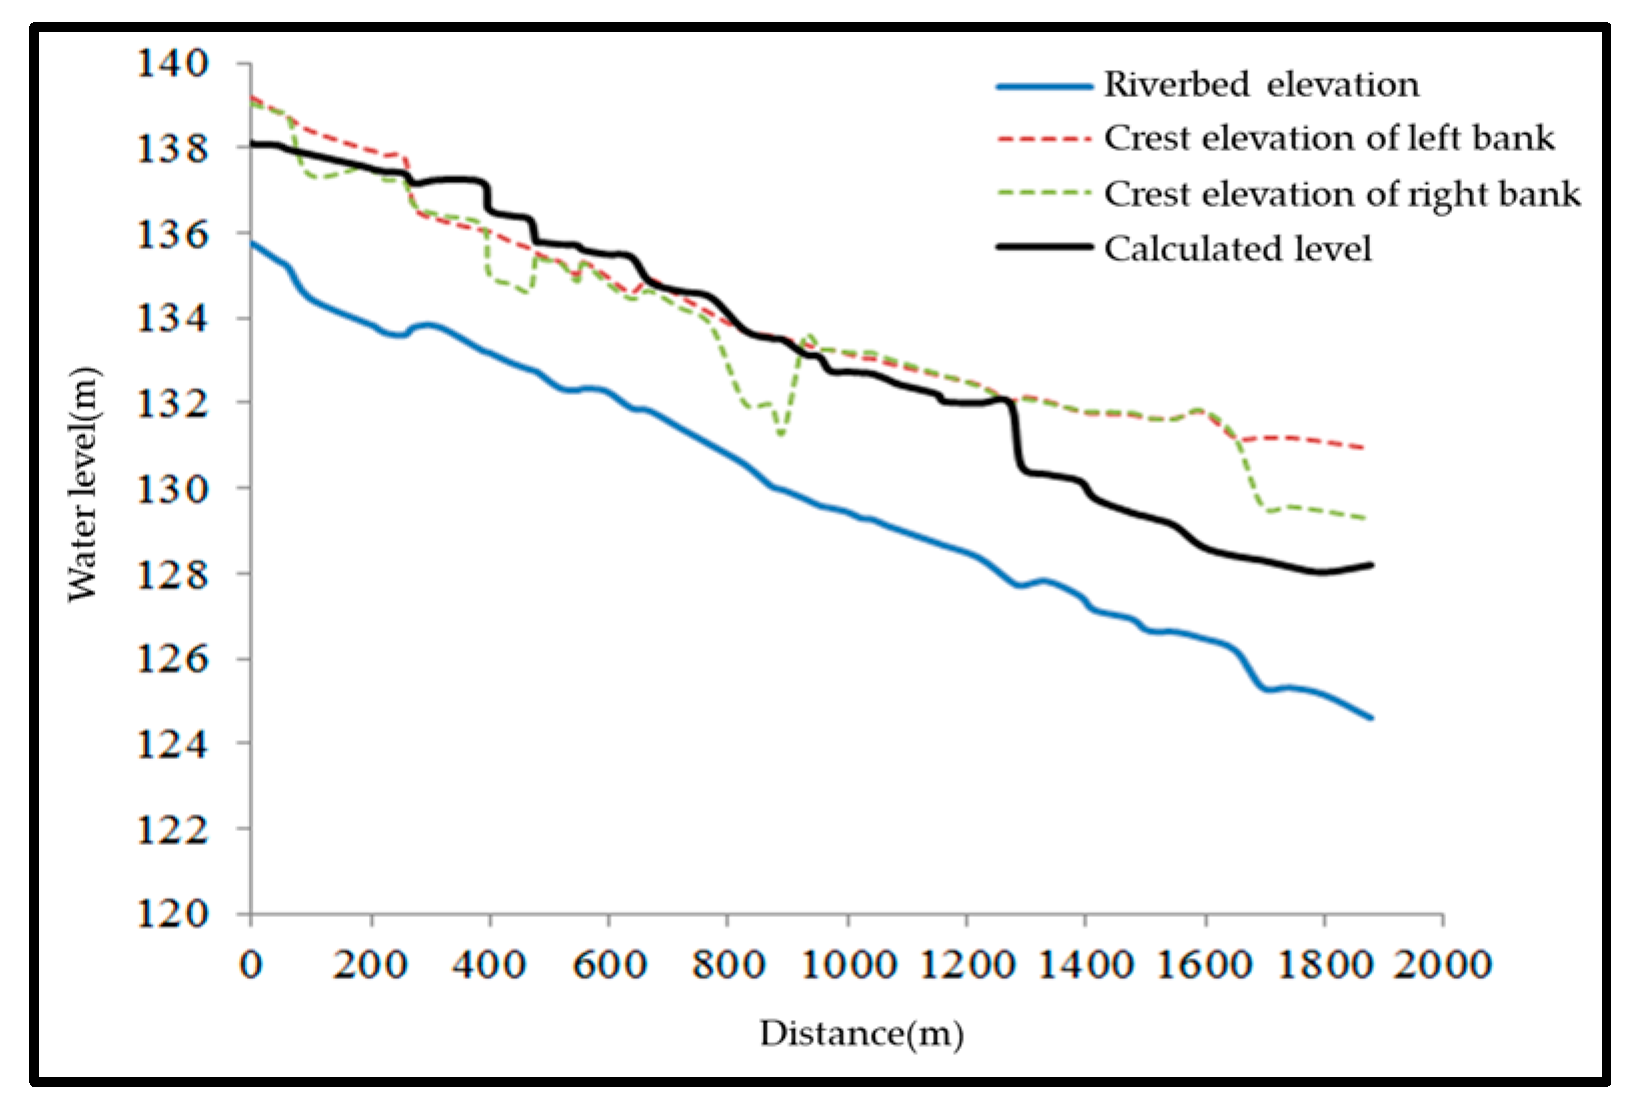
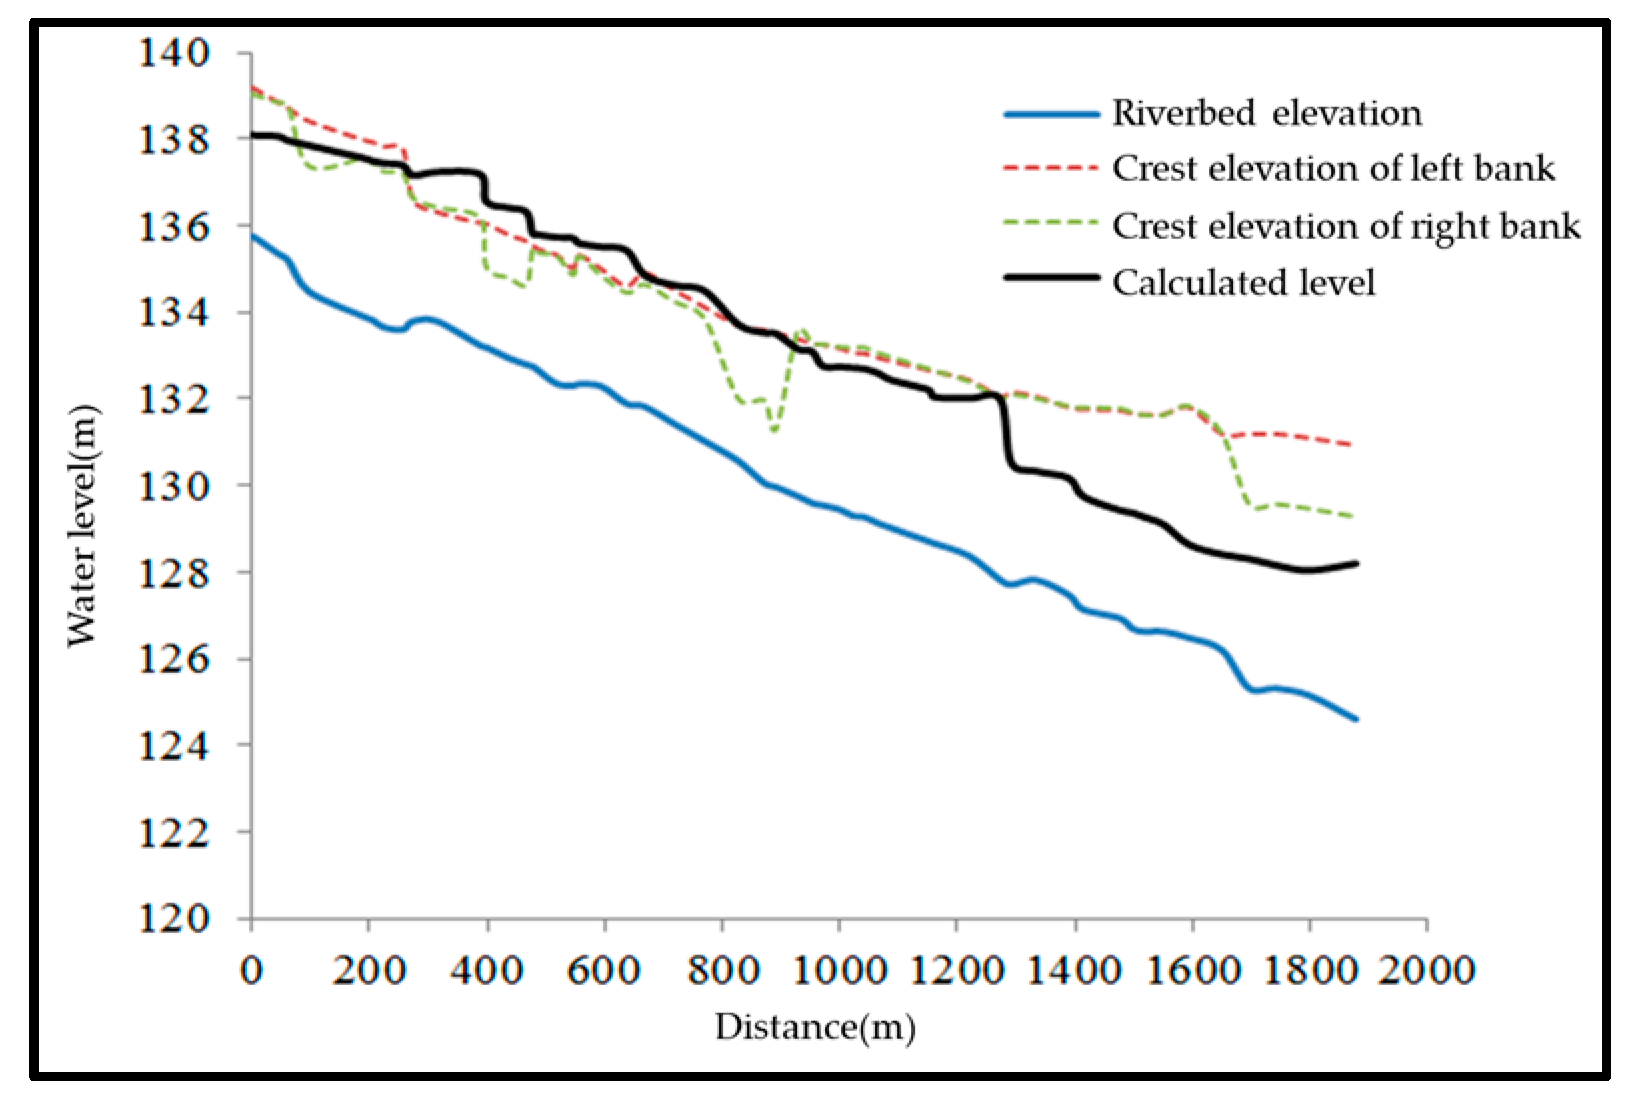
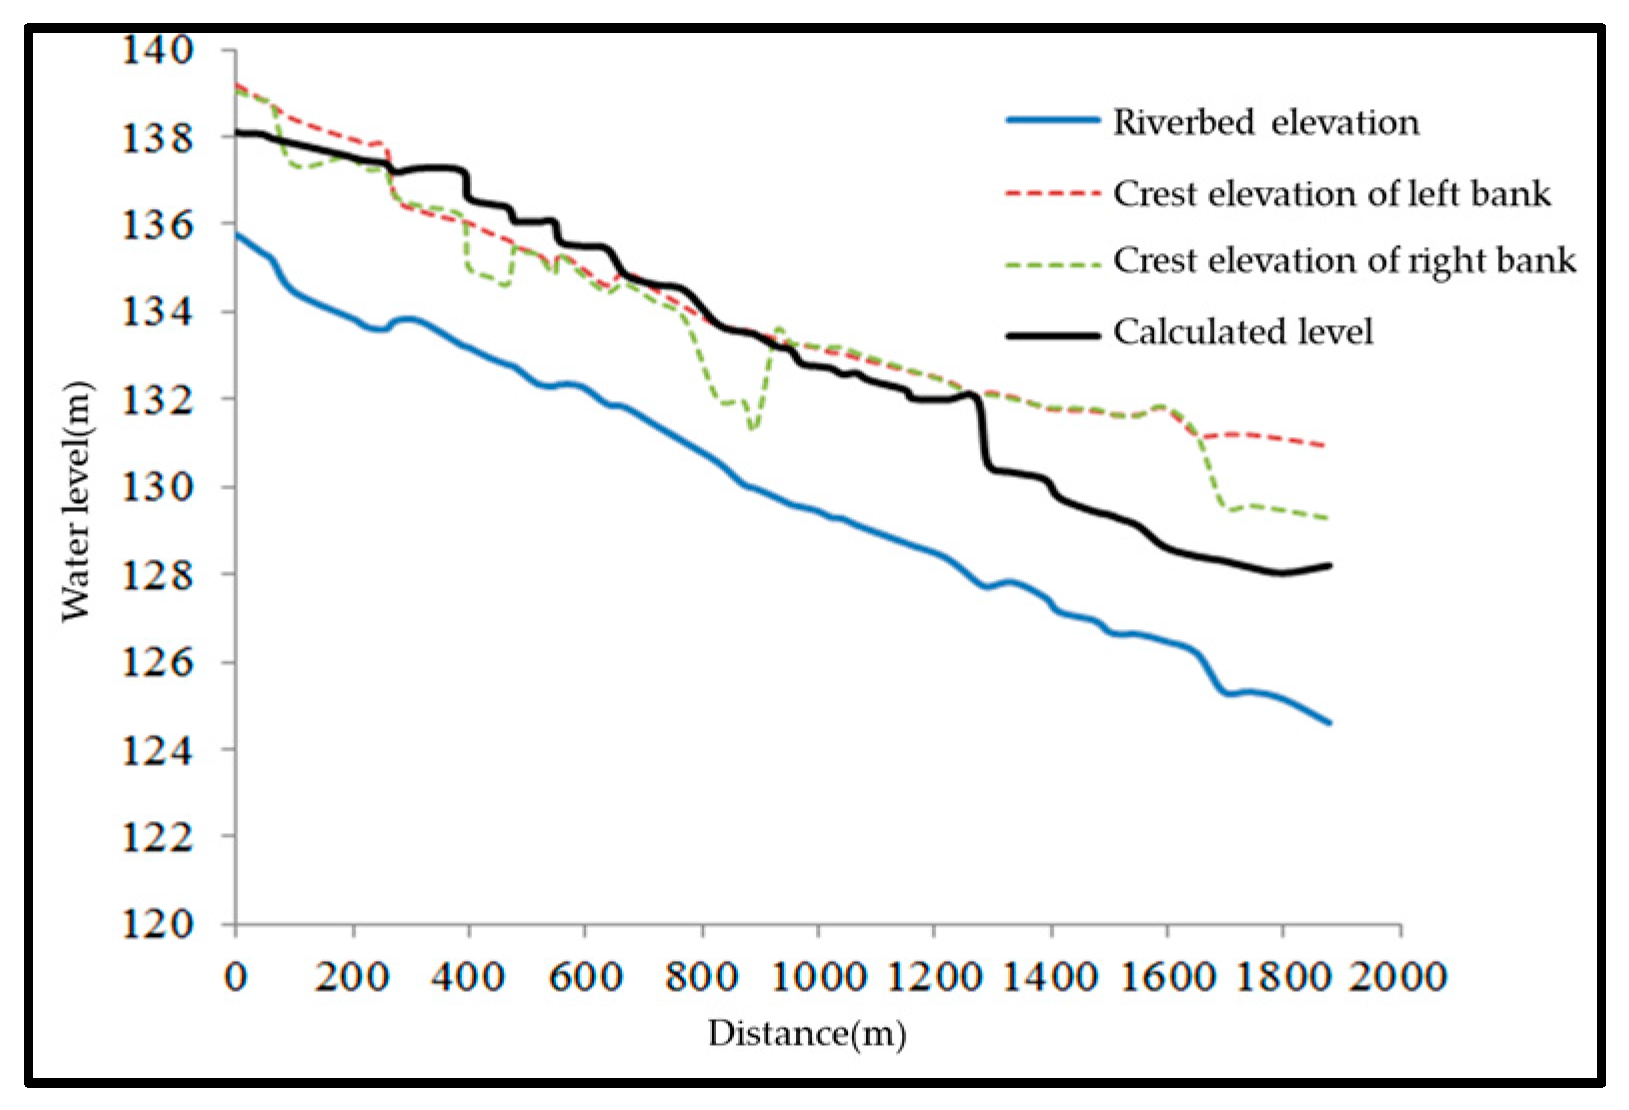
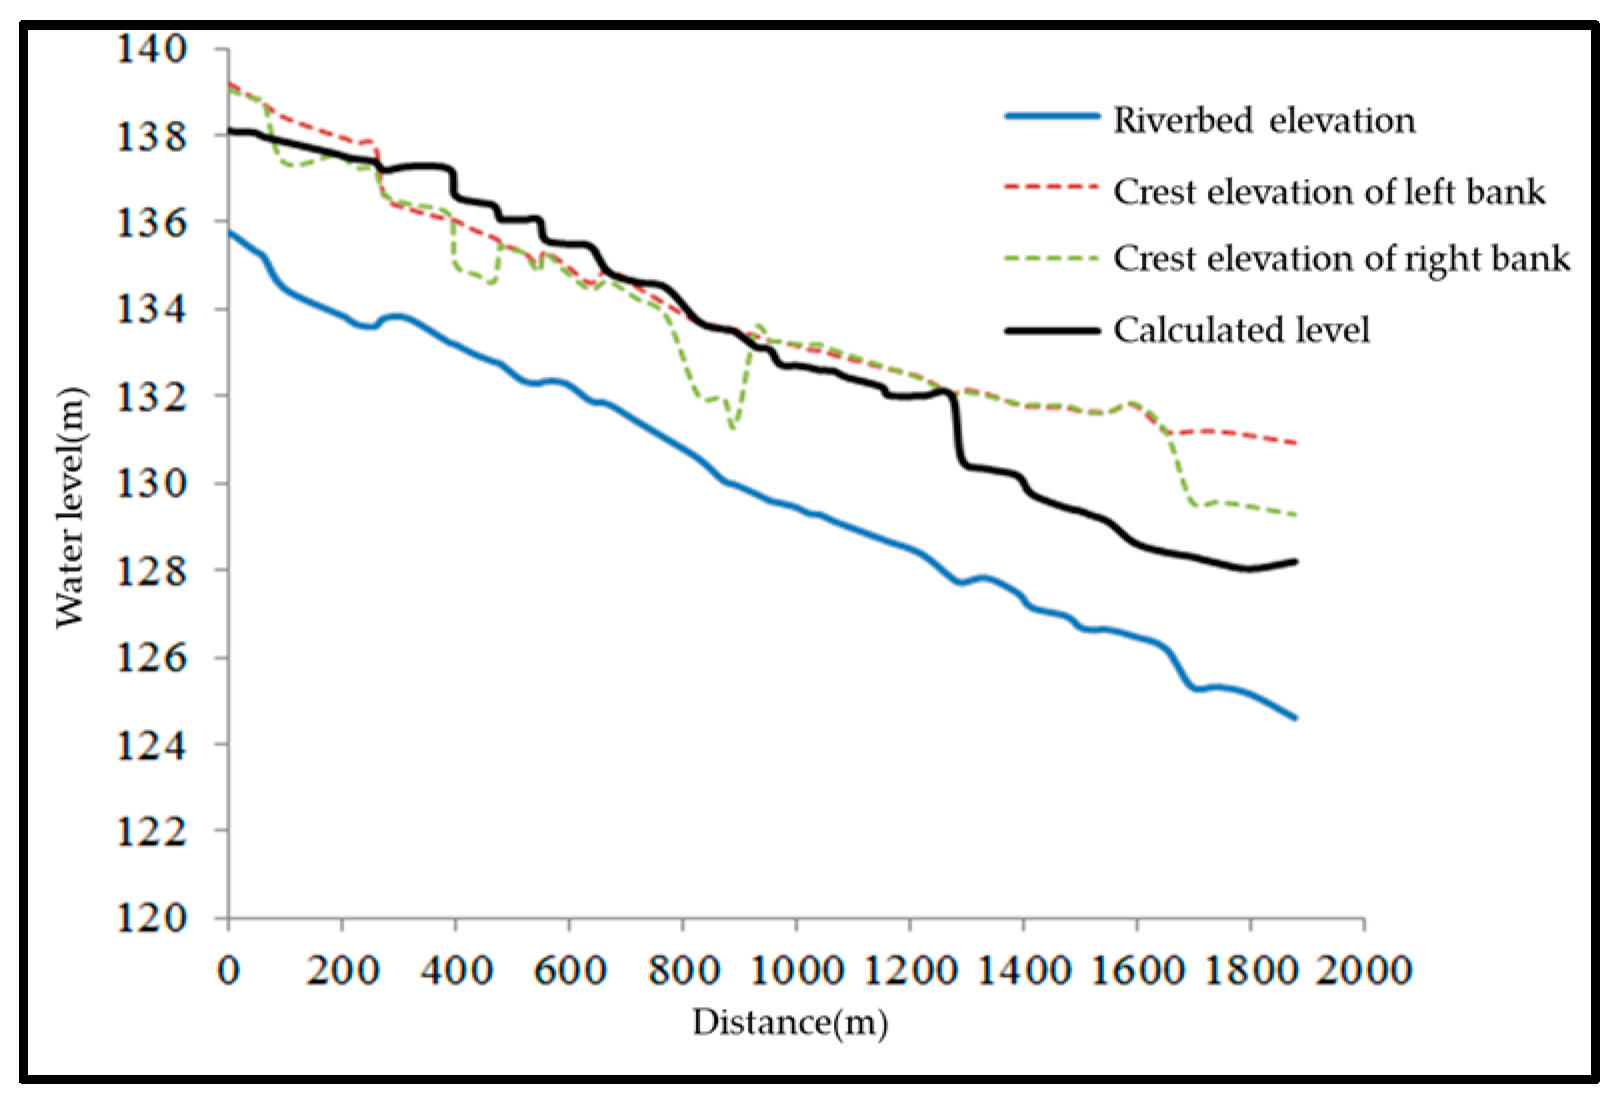
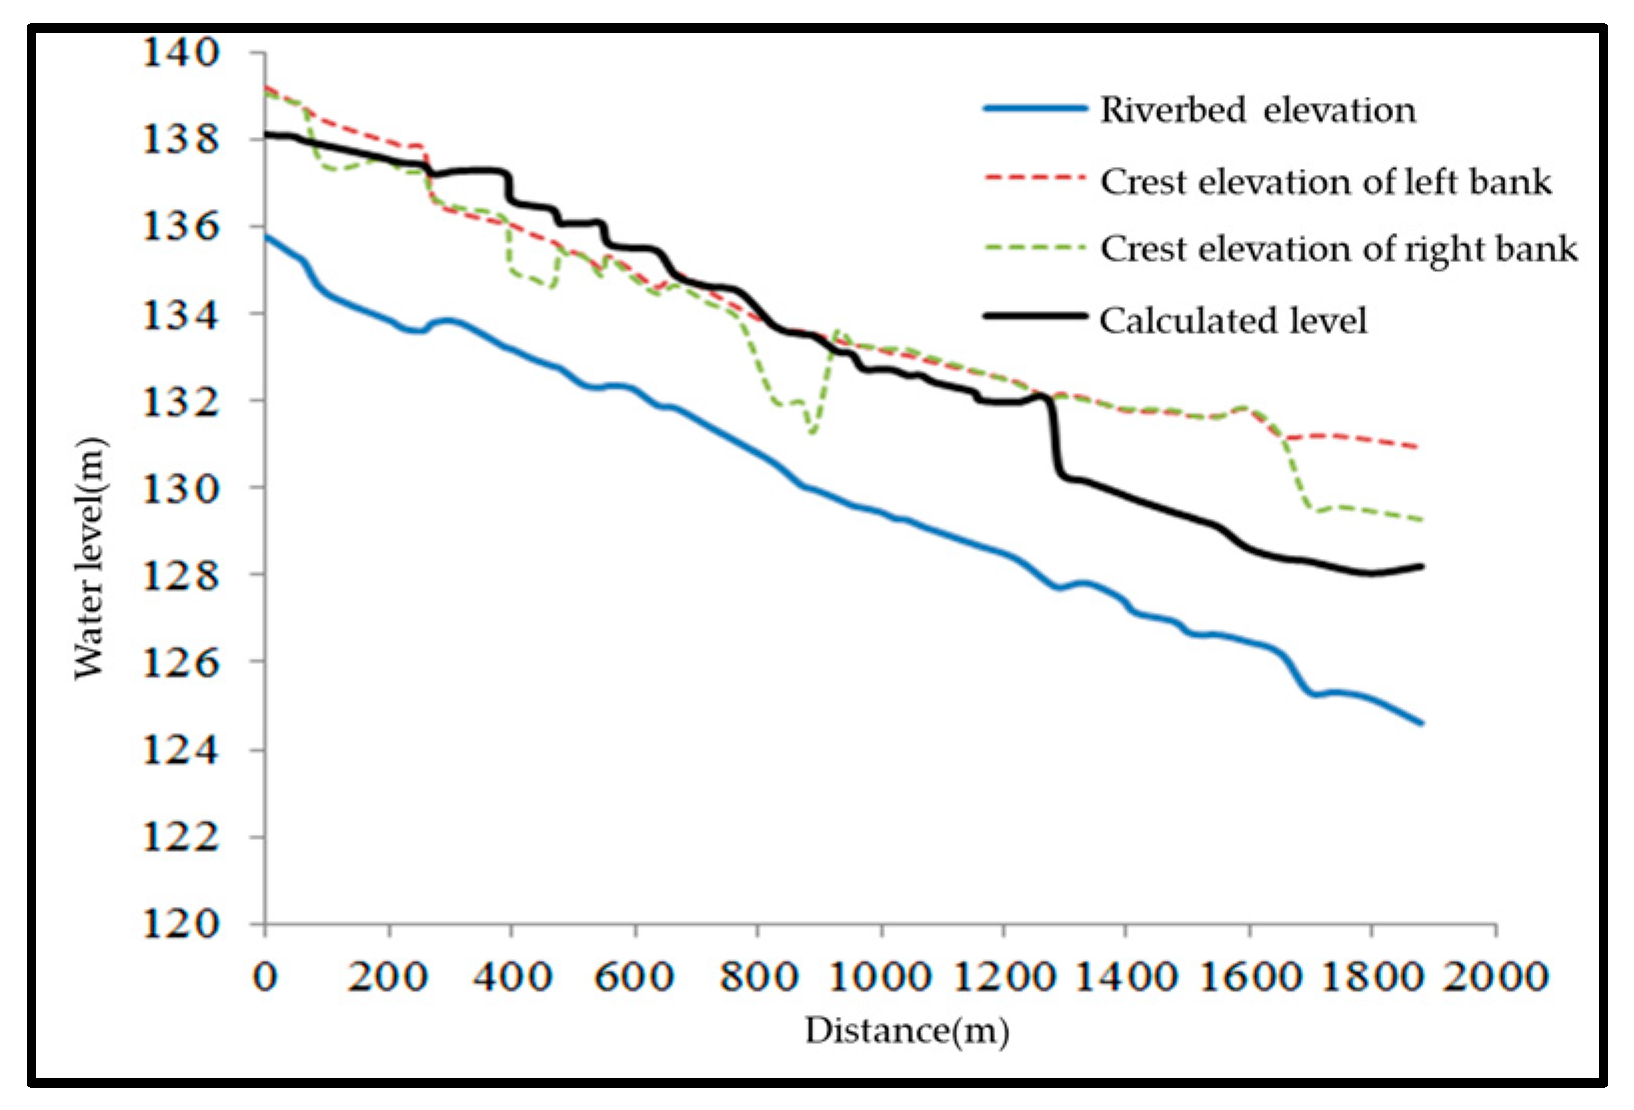
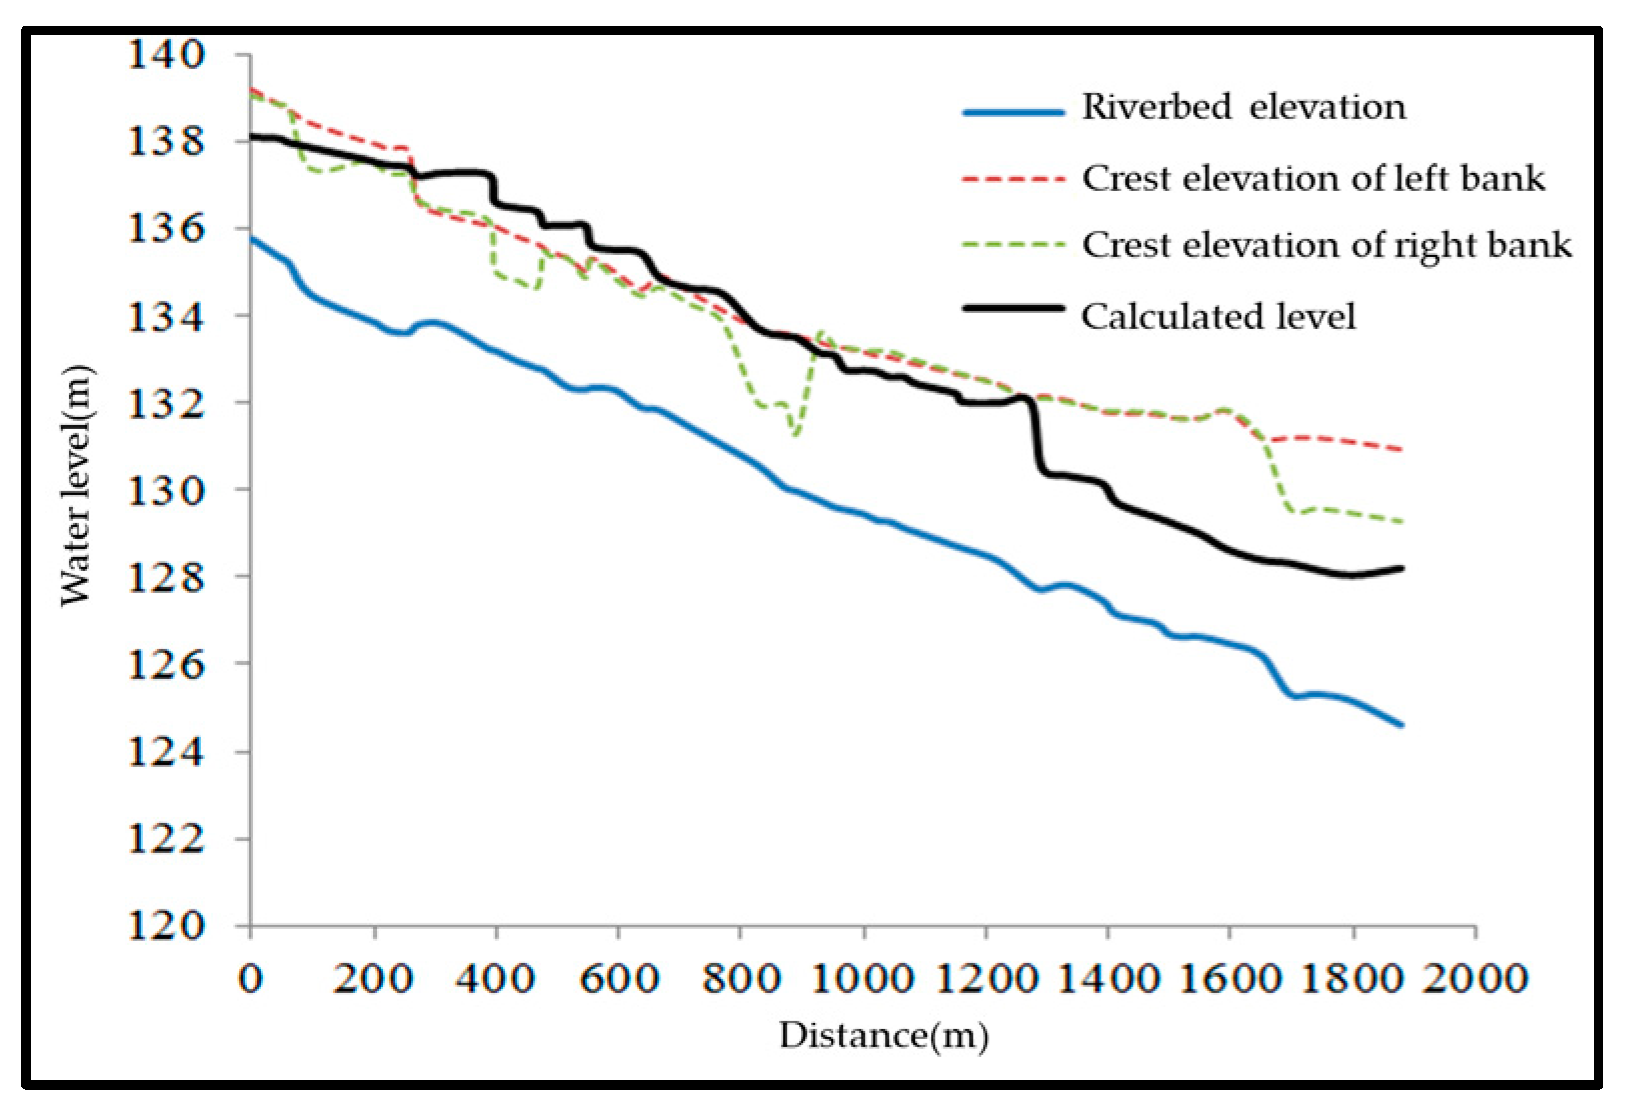
According to Huang Stream flood control standards, comparative analysis was performed considering different weir heights, and four conditions were established in the calculation. The results are listed in Table 1 and shown in Figure 6, Figure 7, Figure 8 and Figure 9. In Table 1, the last column, “Impact” refers to the effect of lowering the weir height on the overflow section.
Based on the calculation results, the following key conclusions can be drawn: the backwater range resulting from the presence of the #1 and #2 weirs is primarily observed downstream from the river reach where the water level exceeds the established standard. Furthermore, the backwater height caused by the existing weirs does not surpass the flood control standard. Upon removing the #1 weir, the backwater range can be reduced by 327.05 m, accompanied by a decrease in the maximum backwater height from 1.33 to 0.19 m. Similarly, eliminating the #2 weir results in a reduction of the backwater range by 320.01 m, with the maximum backwater height decreasing from 1.33 to 0.24 m. The influence range of the #1 weir is 391.47 m, while that of the #2 weir is 34.9 m. Notably, the weir height, maximum backwater height and backwater range are all smaller in these scenarios.

3.6. Analysis of the Influence of Bridges on the Flood Discharge Capacity

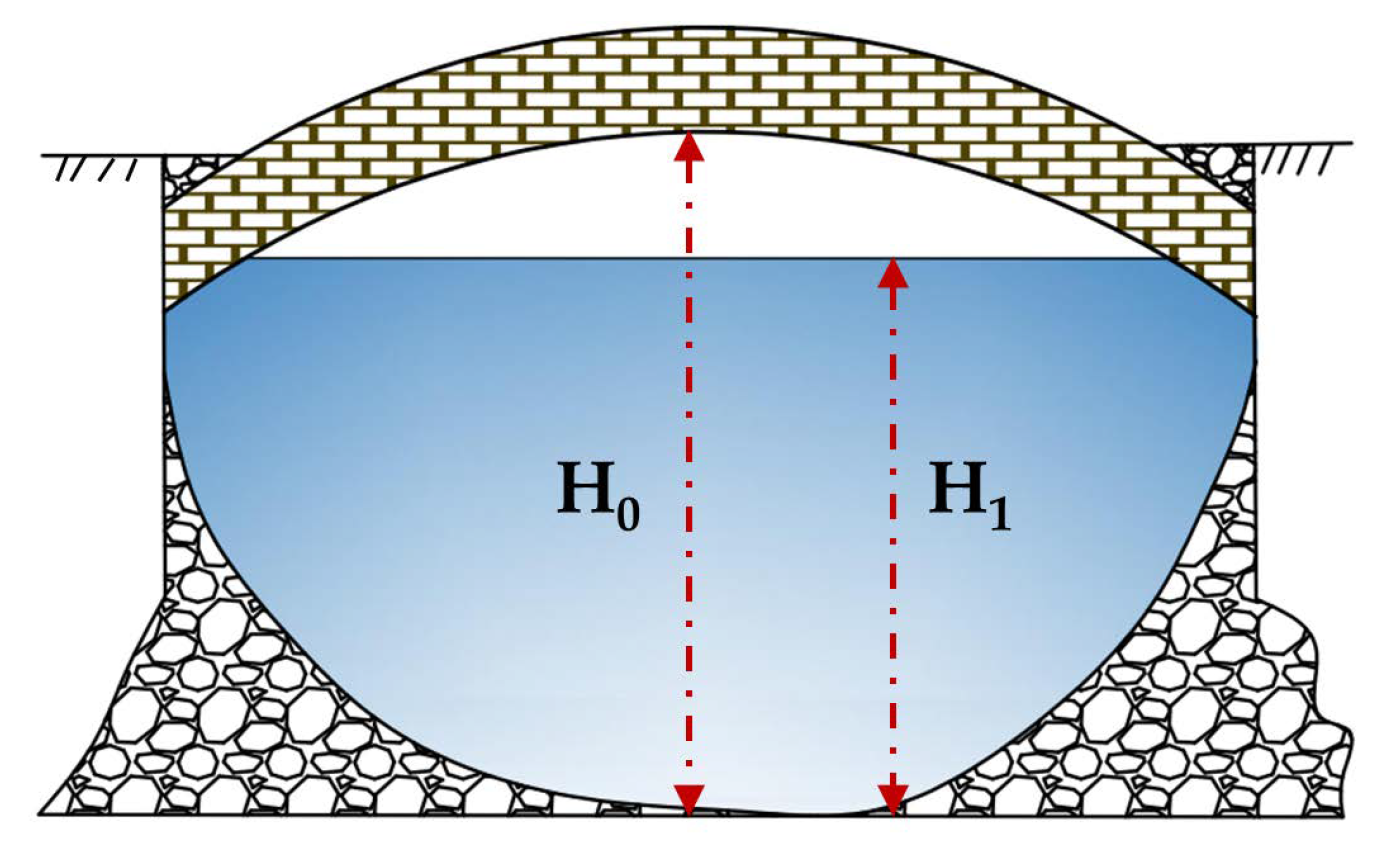
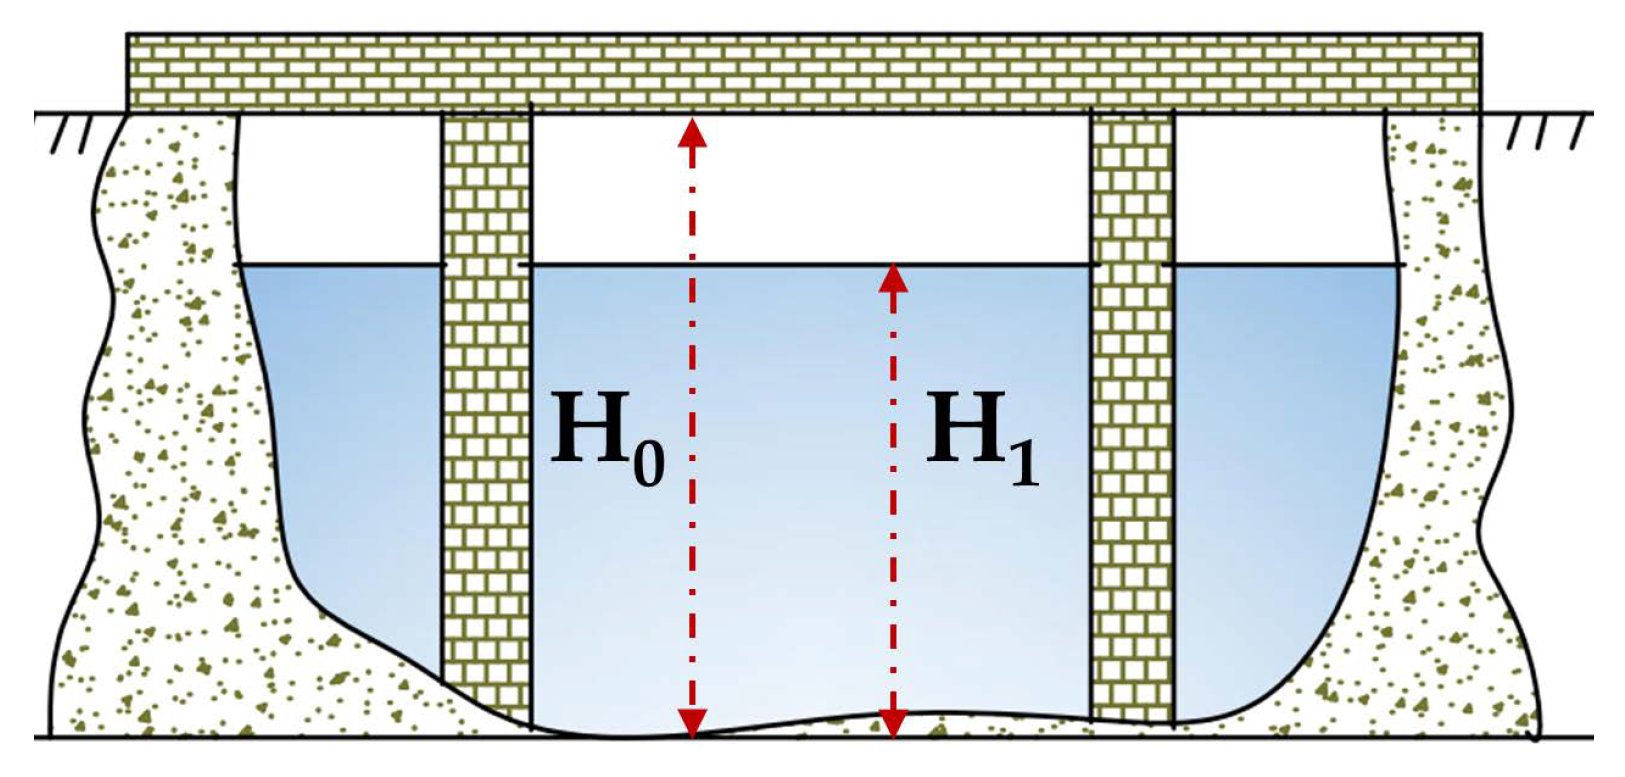
Similar to weirs, bridges also have an impact on the flood discharge capacity of the river, which is characterized by changes in the backwater height. The analysis of bridge influence focused on the assessment of backwater height. In the analysis reach of the Huang Stream, there are a total of seventeen bridges, categorized into three types: single-hole flat slab bridges, three-hole flat slab bridges and arch bridges. Arch and three-hole flat slab bridges are depicted in Figure 10 and Figure 11, respectively.
Cases without and with bridges at the same locations were compared, analyzed and recorded as “without bridge” and “with bridge” cases, respectively. The number of bridge holes was recorded as N. The beam elevation was recorded as H0, while the water level upstream of the bridge was recorded as H1. Δ H represents the change in water level before and after removing the bridge, and Δ Z represents the distance between the upstream water level and beam elevation. The findings are summarized in Table 2. A total of seventeen bridges were analyzed to assess their impact on flood discharge capacity. This analysis included flat-slab and arch bridges under different conditions, considering the presence or absence of bridges, as well as the number of bridge openings (one, two or three holes). The calculation results for each working condition are presented in Figure 12, Figure 13, Figure 14, Figure 15, Figure 16, Figure 17, Figure 18, Figure 19, Figure 20, Figure 21, Figure 22, Figure 23, Figure 24, Figure 25, Figure 26, Figure 27 and Figure 28.

4. Discussion

Based on the computational outcomes of 5% flood frequency conditions, the following fundamental conclusions can be inferred: the backwater range of the #1 and #2 weirs is situated downstream from the river reach, where the water level surpasses the standard. The backwater height attributed to the existing weirs does not breach the flood control standard. Upon the removal of the #1 weir, the backwater range can be diminished by 327.05 m, and the peak backwater height decreases from 1.33 to 0.19 m. When weir #2 is eliminated, the backwater range can be lessened by 284.01 m, and the maximum backwater height reduces from 1.33 to 0.24 m. The sphere of influence of the #1 weir is 391.47 m, and that of the #2 weir is 70.9 m. It can be discerned that the presence of the current dam does not contribute to the water level’s exceeding the standard in certain sections of the Huang Stream under the 5% flood frequency condition. Lowering the heights of weirs #1 and #2 based on the current scenario can reduce the height and extent of the backwater. However, as the impact range of backwater on the weir is generally located downstream from the river section where the water level surpasses the standard, reducing the height of the existing weir does not significant enhance the flood-carrying capacity of the Huang Stream with a frequency of 5%.
The following key conclusions can be drawn from the results: the water level on the upstream side of bridges 2 #, 3 #, 5 #, 4 #, 6 #, 7 #, 8 #, 9 #, 10 #, 12 # and 14 # is higher than the elevation of the beam bottom and is in a submerged outflow state. After the bridge is removed, the water level drops by 0.11 m, 0.30 m, 0.51 m, 0.37 m, 0.14 m, 0.17 m, 0.21 m, 0.19 m, 0.22 m, 0.17 m and 0.10 m, respectively. The submerged outflow situation has a significant impact on the flood-carrying capacity of Huang Stream. Bridge 4 #, a three-hole beam slab bridge, has the greatest impact on flood-carrying capacity. The high water level on the upstream side is caused by the obstruction of water by bridge piers, beams and slabs. Bridges 1 #, 11 #, 13 #, 15 #, 16 # and 17 # have water levels below the elevation of the beam bottom, indicating a free flow state. After the removal of each bridge, the water level drops by 0 m, 0.19 m, 0.13 m, 0 m, 0 m and 0 m, respectively. Among them, Bridge 11 #, a two-hole beam and slab bridge, significantly impacts on the flood-carrying capacity of Huang Stream. Bridges 1 #, 15 #, 16 # and 17 # have no impact on the river’s flood-carrying capacity as their removal does not alter the water level, which remains in a free-flowing state.
In summary, a single-span beam slab bridge has no impact on the flood discharge of Huang Stream in the free flow state. However, when arch bridges are submerged and experience outflow, they significantly affect the flood discharge of the Huang Stream. During free outflow, their section shrinkage and water-blocking effect are prominent, resulting in a high water level on the upstream side and impacting the river’s flood discharge. The number of holes in the beam slab bridge, the thickness of the pier and the water blocking effect are directly proportional.

5. Conclusions

The existing weirs in some sections of the Huang Stream do not cause the water level to exceed the standard under 5% flood frequency conditions. Reducing the height of the #1 and #2 weirs from the current height could potentially decrease the backwater height and backwater range. However, it should be noted that the backwater effect of weirs is primarily observed downstream from the river reach with excessive water levels. Therefore, reducing the height of the existing weirs does not noticeably improve the flood discharge capacity.
Among the selected bridges, 13 of them have an impact on the river’s flood control capacity under 5% flood frequency conditions. Bridges 2 #, 3 #, 4 #, 5 #, 6 #, 7 #, 8 #, 9 #, 10 #, 12 # and 14 # are submerged and contribute to the flood discharged. Bridges 12 # and 13 # are arch bridges, while bridges 6 #, 7 # and 8 # are single-span beam and slab bridges. Bridges 2 #, 3 #, 5 #, 9 #, 11 # and 14 # are double span beam and slab bridges, and bridges 4 # and 10 # are 3-span beam and slab bridges. Bridges 4 # has the most significant impact on the flood control capacity. It is important to note that single-span beam slab bridges have no impact on the river’s flood when free flow conditions are present.
In conclusion, increasing the height of cross structures (weirs) in mountainous rivers can expand the backwater range and improve water levels, but this measure has a minor impact on the flood discharge capacity of the river without exceeding the flood control standard. The impact of bridges, on the other hand, is more substantial. The submerged discharge condition of bridges, including porous flat slab and arch bridges, determined the backwater height on the upstream side of bridges, with flat slab bridges having a greater impact than arch bridges. Number of bridge openings and pier thickness both directly correlate to the water-blocking effect, thereby influencing flood discharge capacity.

Author Contributions

Conceptualization, J.H. and Y.Z.; methodology, J.H., H.S. and J.Z.; software, J.H., H.S. and W.H.; validation, Z.M.; formal analysis, J.H.; investigation, J.H.; resources, J.H.; data curation, J.Z.; writing—original draft, J.H. and J.Z.; writing—review and editing, J.H., H.S. and Z.M. visualization, Y.Z.; supervision, W.H.; project administration, J.H.; funding acquisition, J.H. All authors have read and agreed to the published version of the manuscript.

Funding

This work is supported by the Key Joint Funds of the Zhejiang Provincial Natural Science Foundation of China (LZJWZ22E090004).

Data Availability Statement

Not applicable.

Acknowledgments

We are very grateful to anonymous reviewers for their constructive comments and suggestions.

Conflicts of Interest

The authors declare no conflict of interest.

References

  1. Shih, D.S.; Yeh, G.T. Studying Inertia Effects in Open Channel Flow Using Saint-Venant Equations. Water 2018, 10, 1652. [Google Scholar] [CrossRef] [Green Version]
  2. Wu, G.; Yang, F.; Huang, M. Study on seasonal channel flood routing model coupled with leakage term. S-to-N Water Trfs. Water Sci. Technol. 2018, 16, 33–37. [Google Scholar]
  3. Reggiani, P.; Todini, E.; Meißner, D. On mass and momentum conservation in the variable-parameter Muskingum method. J. Hydrol. 2016, 543, 562–576. [Google Scholar] [CrossRef]
  4. Kalinin, G.P.; Milyukov, P.I. On the computation of unsteady flow in open channels. Met. Gidrol. 1957, 10, 10–18. [Google Scholar]
  5. Montes, N.; Aranda, J.Á.; García-Bartual, R. Real Time Flow Forecasting in a Mountain River Catchment Using Conceptual Models with Simple Error Correction Scheme. Water 2020, 12, 1484. [Google Scholar] [CrossRef]
  6. Lee, E.H. Development of a New 8-Parameter Muskingum Flood Routing Model with Modified Inflows. Water 2021, 13, 3170. [Google Scholar] [CrossRef]
  7. Li, Z.; He, M.; Yan, F.; Hu, Y.; Liu, Z.; Tong, B. Applications of channel flood routing methods in middle part of Huaihe River and Hutuo River. J. Hohai. Univ. Nat. Sci. 2020, 48, 95–101. [Google Scholar]
  8. Fenton, J.D. Flood routing methods. J. Hydrol. 2019, 570, 251–264. [Google Scholar] [CrossRef]
  9. Saeed, M.; Li, H.; Ullah, S.; Rahman, A.U.; Ali, A.; Khan, R.; Hassan, W.; Munir, I.; Alam, S. Flood Hazard Zonation Using an Artificial Neural Network Model: A Case Study of Kabul River Basin, Pakistan. Sustainability 2021, 13, 13953. [Google Scholar] [CrossRef]
  10. Tamiru, H.; Dinka, M.O. Application of ANN and HEC-RAS model for flood inundation mapping in lower Baro Akobo River Basin, Ethiopia. J. Hydrol. Reg. Stud. 2021, 36, 100855. [Google Scholar] [CrossRef]
  11. Liu, Z.; Feng, S.; Lan, F.; Chen, S.; Liang, H.; Fei, K. Regulation scheme of Shegong River based on watershed flood hazard analysis. Water Res. Prot. 2018, 34, 38–43+64. [Google Scholar]
  12. Bulti, A.T. The Influence of Dam Construction on the Catchment Hydrologic Behavior and its Effects on a Discharge Forecast in Hydrological Models. Water Resour. Manag. 2021, 35, 2023–2037. [Google Scholar] [CrossRef]
  13. Wang, Q.; Peng, W.; Dong, F.; Liu, X.; Ou, N. Simulating Flow of An Urban River Course with Complex Cross Sections Based on the MIKE21 FM Model. Water 2020, 12, 761. [Google Scholar] [CrossRef] [Green Version]
  14. Karymbalis, E.; Andreou, M.; Batzakis, D.V.; Tsanakas, K.; Karalis, S. Integration of GIS-Based Multicriteria Decision Analysis and Analytic Hierarchy Process for Flood-Hazard Assessment in the Megalo Rema River Catchment (East Attica, Greece). Sustainability 2021, 13, 10232. [Google Scholar] [CrossRef]
  15. Liu, Q.; Qin, Y.; Zhang, Y.; Li, Z. A coupled 1D–2D hydrodynamic model for flood simulation in flood detention basin. Nat. Hazard. 2015, 75, 1303–1325. [Google Scholar] [CrossRef]
  16. Liu, J.; Wang, J.; Xiong, J.; Cheng, W.; Cui, X.; He, W.; He, Y.; Duan, Y.; Yang, G.; Wang, N. Dynamic Assessment of the Flood Risk at Basin Scale under Simulation of Land-Use Scenarios and Spatialization Technology of Factor. Water 2021, 13, 3239. [Google Scholar] [CrossRef]
  17. He, C.; Wei, J.; Song, Y.; Luo, J.-J. Seasonal Prediction of Summer Precipitation in the Middle and Lower Reaches of the Yangtze River Valley: Comparison of Machine Learning and Climate Model Predictions. Water 2021, 13, 3294. [Google Scholar] [CrossRef]
  18. Liu, L.; Wu, Z.; Li, Q. Overtopping Risk Analysis of Earth Dams Considering Effects of Failure Duration of Release Structures. Complexity 2020, 2020, 3528350. [Google Scholar] [CrossRef]
  19. Malik, R.; Setia, B. Interference between pier models and its effects on scour depth. SN Appl. Sci. 2019, 2, 68. [Google Scholar] [CrossRef] [Green Version]
  20. Subedi, A.; Sharma, S.; Islam, A.; Lamichhane, N. Quantification of the Effect of Bridge Pier Encasement on Headwater Elevation Using HEC-RAS. Hydrology 2019, 6, 25. [Google Scholar] [CrossRef] [Green Version]
  21. Ren, M.; Xu, Z.; Su, G. Comparative analysis on bridge backwater depths estimated using 2-D hydrodynamic model and empirical formulas. J. Hydroelectr. Eng. 2017, 36, 78–87. [Google Scholar]
  22. Vaheddoost, B.; Safari, M.J.S.; Ilkhanipour, Z.R. Discharge coefficient for vertical sluice gate under submerged condition using contraction and energy loss coefficients. Flow Meas. Instrum. 2021, 80, 102007. [Google Scholar] [CrossRef]
  23. Mohamed, I.M.; Abdelhaleem, F.S. Flow Downstream Sluice Gate with Orifice. KSCE J. Civ. Eng. 2020, 24, 3692–3702. [Google Scholar] [CrossRef]
  24. Zhang, M.; Wang, L.; Zhang, F.; Zhang, C.; Wu, M.; Tang, H.; Zhu, H. Launch condition and flood diversion effect of flood diversion area named Garden Lake. J. Hohai. Univ. Nat. Sci. 2020, 48, 209–214. [Google Scholar]
  25. Baird, D.C.; Abban, B.; Scurlock, S.M.; Abt, S.B.; Thornton, C.I. Two-Dimensional Numerical Modeling of Flow in Physical Models of Rock Vane and Bendway Weir Configurations. Water 2021, 13, 458. [Google Scholar] [CrossRef]
  26. Seyedjavad, M.; Naeeni, S.O.; Saneie, M. Flow velocity pattern around trapezoidal piano key side weirs. Flow Meas. Instrum. 2020, 76, 101847. [Google Scholar] [CrossRef]
  27. Li, G.; Li, S.; Hu, Y. The effect of the inlet/outlet width ratio on the discharge of piano key weirs. J. Hydraul. Res. 2020, 58, 594–604. [Google Scholar] [CrossRef]
  28. Atashi, V.; Bejestan, M.S.; Lim, Y.H. Flow Pattern and Erosion in a 90-Degrees Sharp Bend around a W−Weir. Water 2023, 15, 11. [Google Scholar] [CrossRef]
  29. Skilodimou, H.D.; Bathrellos, G.D.; Alexakis, D.E. Flood Hazard Assessment Mapping in Burned and Urban Areas. Sustainability 2021, 13, 4455. [Google Scholar] [CrossRef]
  30. Salehi, S.; Azimi, A.H. Discharge Characteristics of Weir-Orifice and Weir-Gate Structures. J. Irrig. Drain. Eng. 2019, 145, 04019025. [Google Scholar] [CrossRef]
Figure 1. Schematic diagram of the node layout.
Water 15 02719 g001
Figure 2. Abbott six-point center format chart.
Water 15 02719 g002
Figure 3. The location map of the Huang Stream.
Water 15 02719 g003
Figure 4. Simplification of the Huang Stream.
Water 15 02719 g004
Figure 5. Floodwater level distribution along the route of 5% flood frequency.
Water 15 02719 g005
Figure 6. Floodwater level distribution along the route (With #1 and #2 Weirs).
Water 15 02719 g006
Figure 7. Floodwater level distribution along the route (Without #1 Weir).
Water 15 02719 g007
Figure 8. Floodwater level distribution along the route (Without #2 Weir).
Water 15 02719 g008
Figure 9. Floodwater level distribution along the route (Without #1 and #2 Weirs).
Water 15 02719 g009
Figure 10. Definition sketch of the relevant parameters of arch bridges.
Water 15 02719 g010
Figure 11. Definition sketch of the relevant parameters of flat slab bridges.
Water 15 02719 g011
Figure 12. Floodwater level distribution along the route (bridge 1# is removed).
Water 15 02719 g012
Figure 13. Floodwater level distribution along the route (bridge 2# is removed).
Water 15 02719 g013
Figure 14. Floodwater level distribution along the route (bridge 3# is removed).
Water 15 02719 g014
Figure 15. Floodwater level distribution along the route (bridge 4# is removed).
Water 15 02719 g015
Figure 16. Floodwater level distribution along the route (bridge 5# is removed).
Water 15 02719 g016
Figure 17. Floodwater level distribution along the route (bridge 6# is removed).
Water 15 02719 g017
Figure 18. Floodwater level distribution along the route (bridge 7# is removed).
Water 15 02719 g018
Figure 19. Floodwater level distribution along the route (bridge 8# is removed).
Water 15 02719 g019
Figure 20. Floodwater level distribution along the route (bridge 9# is removed).
Water 15 02719 g020
Figure 21. Floodwater level distribution along the route (bridge 10# is removed).
Water 15 02719 g021
Figure 22. Floodwater level distribution along the route (bridge 11# is removed).
Water 15 02719 g022
Figure 23. Floodwater level distribution along the route (bridge 12# is removed).
Water 15 02719 g023
Figure 24. Floodwater level distribution along the route (bridge 13# is removed).
Water 15 02719 g024
Figure 25. Floodwater level distribution along the route (bridge 14# is removed).
Water 15 02719 g025
Figure 26. Floodwater level distribution along the route (bridge 15# is removed).
Water 15 02719 g026
Figure 27. Floodwater level distribution along the route (bridge 16# is removed).
Water 15 02719 g027
Figure 28. Floodwater level distribution along the route (bridge 17# is removed).
Water 15 02719 g028
Table 1. Main calculation conditions for the analysis of the weir height influence (m).
Condition#1 Weir Height#2 Weir HeightBackwater RangeMaximum Backwater HeightImpact
12.000.75[928.09, 1283.00]1.33No
20.000.75[1255.14, 1283.00]0.19No
32.000.00[891.53, 962.43]0.24No
40.000.000.000.00No
Table 2. Statistics of the influence of bridges on the water level in the Huang Stream (m).
Bridge NumberLocationTypeNH0H1 Δ Z
Without BridgeWith Bridge Δ H
1#25.37Flat slab1138.80138.14138.140.00−0.66
2#195.82Flat slab2137.42137.53137.640.110.22
3#261.84Flat slab2136.41137.2137.500.301.09
4#392.89Flat slab3135.63136.7137.210.511.58
5#471.74Flat slab2135.42136.02136.390.370.97
6#550.25Flat slab1134.62135.65135.790.141.17
7#652.04Flat slab1134.83134.95135.120.170.29
8#790.29Flat slab1133.38133.88134.090.210.71
9#912.53Flat slab2132.98133.11133.30.190.32
10#955.64Flat slab3132.90132.7132.920.220.02
11#979.22Flat slab2133.06132.56132.750.19−0.31
12#1032.00Arch1132.19132.5132.670.170.48
13#1076.39Arch1133.16132.38132.510.13−0.65
14#1155.53Flat slab2131.85132.05132.150.100.30
15#1401.87Flat slab1131.31129.94129.940.00−1.37
16#1572.66Flat slab1131.03128.86128.860.00−2.17
17#1719.09Flat slab1130.50128.28128.280.00−2.22
Disclaimer/Publisher’s Note: The statements, opinions and data contained in all publications are solely those of the individual author(s) and contributor(s) and not of MDPI and/or the editor(s). MDPI and/or the editor(s) disclaim responsibility for any injury to people or property resulting from any ideas, methods, instructions or products referred to in the content.