Article

Recognition and Prediction of Collaborative Response Characteristics of Runoff and Permafrost to Climate Changes in the Headwaters of the Yellow River

1
Key Laboratory of Agricultural Soil and Water Engineering in Arid and Semiarid Areas, Ministry of Education, Northwest A&F University, Xianyang 712100, China
2
College of Water Resources and Architectural Engineering, Northwest A&F University, Xianyang 712100, China
3
Huanghe Hydropower Development Co., Ltd., Xining 810008, China
4
College of Economics and Management, Northwest A&F University, Xianyang 712100, China
*
Author to whom correspondence should be addressed.
Water 2023, 15(13), 2347; https://doi.org/10.3390/w15132347
Submission received: 31 May 2023 / Revised: 13 June 2023 / Accepted: 14 June 2023 / Published: 25 June 2023

Abstract

:
As a response to climate changes, permafrost has deteriorated and the hydrologic process has undergone significant alterations in high-cold regions. The response mechanism still remains unknown. The characteristic contribution was calculated using the random forest (RF) algorithm, AdaBoost algorithm, and gradient-boosted decision tree (GBDT) algorithm. A comprehensive evaluation model was constructed to evaluate the contribution of climate changes to the headwaters of the Yellow River and the influence of permafrost degradation as well as climate-permafrost cooperation on runoff changes. The selected characteristic vectors were chosen as datasets for the support vector machine (SVM) and RF algorithms. A model was constructed for the prediction of permafrost degradation and runoff changes based on climate data. Results demonstrated that climate variables influencing the mean depth-to-permafrost table (DPT) were ranked according to their contributions: air temperature > evapotranspiration > wind speed > relative humidity (RHU) > sunshine duration > precipitation. The descending rank of climate and permafrost variables according to their contributions to runoff was the following: precipitation > sunshine duration > permafrost coverage > evapotranspiration > relative humidity (RHU) > mean DPT > wind speed > maximum DPT > air temperature. The model demonstrated good prediction results. The outputs can provide scientific references in applications related to water resources and the protection of ecologically vulnerable areas in high-cold regions.

1. Introduction

Ecological environmental protection is closely related to permafrost distribution and runoff changes under global climate changes on the Qinghai–Tibet Plateau (QTP) [1,2]. This permafrost degradation has had a significant influence on the ecosystem’s health and hydrology [3]. Freeze-thaw cycles have caused a large number of landslides [4], failed rock masses [5], and infrastructure damages [6]. The wetlands have generally dried up and shrunk [7,8]. The grassland has converted to sand soil [9,10] enlarging the conflict between grass and grazing. The headwaters of the Yellow River (HWYR) are an important component of the ecological preservation area on the QTP. The amount of river discharge decreased to zero as a result of groundwater changes induced by permafrost degradation [11]. These not only damage the local ecological environment but also bring challenges to ecological protection and development of the whole Yellow River Basin. Therefore, research on the influence of climate changes on permafrost degradation and runoff has been increasing. It will be vital to improve the evaluation and prediction ability of permafrost and runoff’s responses to climate changes, the utilization of water resources, the protection of ecologically vulnerable areas, and economic social development in high cold regions in the future.
Studies on permafrost and runoff changes in high-cold regions have been reported. Walvood et al. studied permafrost degradation and groundwater processes in the Yukon River Basin in Alaska, USA. They revealed the influence of permafrost degradation on groundwater flow and base flow as well as its hydrological effect in high-latitude areas [8]. Yamazaki et al. studied runoff in the permafrost basin in the East Siberian Mountains. They reported the seasonal characteristics of runoff meteorology in the permafrost basin in high-latitude and high-altitude areas [12]. Zhang et al. summarized the sensitivity rank of permafrost active layers to variable climate factors in high-latitude areas in Alaska [13]. Wu et al. [14] and Zhao et al. [15] investigated the forms of permafrost degradation and the influence of permafrost degradation on hydrological processes in the QTP. Liu et al. studied spatial-temporal evolutionary laws of runoff responses to climate changes and permafrost degradation in the Lhasa River Basin and Northern China at different latitudes and altitudes [16,17]. Li Daofeng et al. carried out hydrological simulations under different environments and underlying surfaces in the HWYR [18]. Wang Xueliang et al. reported that permafrost degradation was the major cause of an increase in the gentle runoff hydrograph and winter runoffs in the study area [19]. Wang et al. found a good exponential functional relationship between runoff and temperature in 90 cm deep soils based on an analysis of measured data from small watersheds of the wind volcano in the headwaters of the Yangtze River [20]. Song et al. analyzed measured data from the pan-arctic region and discovered a good positive correlation between the maximum–minimum runoff ratio and permafrost coverage [21]. Using a hydro-thermal coupling model, Sun et al. quantified runoff’s responses to permafrost degradation in sub-basin controls of hydrological stations located in the HWYR. They found a good parabolic relationship between response amplitude and permafrost coverage in the sub-basin [22]. Existing studies have mainly focused on the influence of climate changes on permafrost and runoff. Measurement data analyses have been mainly related to climate and runoff remote sensing. Based on the transmission perspective of “climate changes-permafrost degradation-hydrologic process response”, it is still vital to strengthen our understanding of the contributions of climate changes and permafrost degradation to runoff changes as well as practical prediction models.
This study focused on the contribution degree of climate and permafrost on runoff in the HWYR. The objectives of this study were to (a) analyze and identify the contribution of climate factors to permafrost degradation using three machine learning algorithms; (b) analyze and identify the contribution of climate and permafrost factors to runoff changes using three machine learning algorithms; and (c) establish a prediction model for permafrost and runoff changes using two other machine learning algorithms.

2. Materials and Methods

The HWYR is located on the eastern side of the QTP. It has an average elevation of 2647–6070 m, an annual average air temperature of −2.32 °C, and an annual average precipitation of 697.70 mm. The proportion of the area covered in permafrost is about 34% [23]. There are 12 hydrologic stations in the study area (Figure 1), including TNH, SHC, BAT, DMT, JNG, MAQ, DAS, MNT, TNK, JIM, HUH, and HHY. A total of 12 sub-basins were identified for the study according to the distribution of the hydrologic stations in the basin.
Annual scale sequences of climate, permafrost, and runoff during the time period of 1980~2014 were chosen for study. The climate data include air temperature (AT), evapotranspiration (ERT), wind speed, relative humidity (RHU), sunshine duration (SSD), and precipitation (Precip). The climate data of the basin were obtained through a spatial interpolation of data from stations run by the State Meteorological Administration. The Chinese Hydrological Yearbook provided the measured runoff data from hydrologic stations. Annual permafrost data at the sub-basin scale and their spatial distribution were generated using a coupled hydro-thermal dynamics model and were validated based on field observations [24]. The permafrost indices were permafrost coverage (the ratio of permafrost area to the sub-basin area, RPSA) and the mean/maximum depth-to-permafrost table (DPT).

2.1. Evaluation Model for Importance of Features

The influence of meteorology and permafrost changes on runoff in the high-cold region is extremely complicated and uncertain. To acquire a practical prediction model, the screening of relevant characteristics and ranking is significant [25,26,27]. At present, the filtering method, wrapper method, embedding method, and hybrid method are common methods for selecting characteristics [28,29]. Among them, the machine learning method, based on a tree model, achieved the best effects. Optimal feature screening results were obtained to increase the credibility of the feature screening and importance-based ranking of features as well as to weaken and overcome defects and overfitting conditions of the different model algorithms. Results of the Random Forest (RF) algorithm, AdaBoost algorithm, and gradient-boosted decision tree (GBDT) algorithm were compared and calculated comprehensively to obtain representative characteristics with explicit ranking.

2.1.1. RF Algorithm for Feature Selection

The Random Forest (RF) algorithm is one of the typical representatives of an integrated learning algorithm based on a tree model. It is capable of high-dimensional data characteristic measurement and regression prediction [30,31]. The algorithm builds several decision tree models according to sample sets, which are selected randomly from the training sample, and finally, combines the completion results of all decision trees. The RF algorithm mainly selects feature vectors according to their importance through out-of-pocket error and calculation of the Gini coefficient. For a dataset (D) with d features and T decision trees, E i is the number of error samples in out-of-pocket data of the ith decision tree and E i j is the number of error samples in out-of-pocket data of the randomly replaced the jth feature of the ith decision tree. This can be expressed as Equation (1) according to the importance of features (IRFj) obtained from out-of-pocket error.
I R F j = 1 T i = 1 T E i j E i

2.1.2. AdaBoost Algorithm for Feature Selection

The AdaBoost algorithm is a typical integrated learning method based on boosting ideas [32]. The training process of the algorithm is based on several iterations of weak classifiers. To identify errors of weak classifiers, a group of weak classifiers were acquired by providing more weight to difficult-to-classify data and decreasing the weight of easy-to-classify data. This group of weak classifiers was combined into a strong classifier through the weighting method. Since the weight of each classifier can be completely considered and weak classifiers are not limited within the machine learning model of weak classifiers, the final importance-based ranking of features can be acquired according to the weight of weak learners after iteration. Considering Dp(i) as the weight of weak learners of the ith data sample of the d features after the pth iteration, m is the number of weak learners, ya(i), is the output value predicted model and yr(i) is the real value. The output error predicted at the pth iteration, Ep, and sequence weight (ap) can be expressed as the following:
E p = i = 1 d D p i
a p = 0.5 ln 1 E p E p
The normalized factor after iteration is the sample weight (Dp+1) of Bp:
D p + 1 i = D p i B p exp a p y r i y a i
The final strong classification function can be synthesized to obtain the importance and ranking of features when the error Ep meets the above conditions.

2.1.3. GBDT Algorithm for Feature Selection

The GBDT algorithm is considered a boosting algorithm that uses a decision tree as the basic learner. Considering the gradient descending idea, decision trees were established according to the decline in residual gradients. Meanwhile, the decision trees were iterated continuously to obtain the optimal calculation results [33]. For the given training set T, the first weak learner (F0(x)) was built as the following:
F 0 x = a r g   min c i = 1 N L y i , c
For M regression trees with a sample size of I, the mth regression tree was obtained through the CART regression tree by calculating the residual errors. The optimal fitting value was calculated according to leaf nodes. Moreover, the strong learners Fm(x) were iterated.
F m x = F m 1 x + j = 1 J m c m , j I
The final, strongest learner was calculated as follows:
F M x = F 0 x + m = 1 M j = 1 J m c m , j I

2.1.4. Comprehensive Evaluation Indices

The comprehensive importance of features in the same dataset was calculated based on the RF algorithm, Adaboost algorithm, and GBDT algorithm. The acquired weights varied. Therefore, the model and its features may have influenced the measurement based on a single index or training result. In addition, the calculated importance of features in datasets from different sub-basins is influenced by randomness, and the feature contribution also varies in different sub-basins. Therefore, training results of the model from different sub-basins of the study area were combined based on the results of three machine learning algorithms while providing mean importance values of different features in the different sub-basins. Such mean importance values were used as the feature contribution ratios of the method. The cumulative importance values of features in the three methods were used as the comprehensive contribution coefficient. Features that were significantly less important than other features were eliminated, and the feature screening was completed.

2.2. Prediction Models

In developing practical prediction models for permafrost and runoff under climate change, we utilized machine learning methods known for their ability to handle complex problems. Given the short sequence data used in this study, the computational load was not significant. Compared to other machine learning methods, the RF and support vector machine (SVM) algorithms have a lower risk of overfitting when processing short sequence data. Additionally, the RF algorithm is robust to outliers, while the SVM algorithm is advantageous in addressing non-linear problems. Therefore, the RF and SVM algorithms are well-suited for establishing prediction models in this study.

2.2.1. RF Regression Algorithm

Regression prediction was mostly accomplished using the RF algorithm, which is based on decision trees. A total of n sample sets were effectively selected from the original dataset using the Bootstrap method, and n decision trees were built to allow for the growth of each decision tree to the maximum extent. All decision trees were summarized and combined into a random forest. The final results were calculated using the mean of the multiple trees’ prediction values [31].

2.2.2. SVM Algorithm

The SVM is a machine learning algorithm based on the statistical learning theory. It has certain advantages in solving small-sized, nonlinear, and high-dimensional problems [34]. The SVM has both a nonlinear and linear method. The linear method seeks the hyperplane of the original space in the sample set. It provides a nonlinear mapping of data in the sample set, which cannot pass through the original space of the hyperplane’s linear separation into the high-dimensional feature space using the kernel function. Then, it returns the data to the original space after linear regression in the high-dimensional feature space, thus realizing nonlinear regression [35].

2.2.3. Validation of the Prediction Model

The mean absolute error (MAE), root-mean-square error (RMSE), and goodness of fit (R2) were chosen as evaluation indices in this study. The calculation formulas are the following:
R 2 = 1 i = 1 n y i y ^ i 2 i = 1 n y i y i 2
R M S E = i = 1 n y i y ^ i 2 n
M A E = i = 1 n y i y ^ i 2 n
where y i represents the actual observation value, y i denotes the mean of the actual observation value, and y ^ i refers to the prediction value. If RMSE and MAE are closer to 0, the error between the prediction value and actual value is small. If R2 is closer to 1, the prediction model’s goodness of fit is small.

3. Results

3.1. Impact of Climate Changes on Permafrost Degradation

Original datasets from different regions in the study area during the time period of 1980–2014 were screened using the RF algorithm, Adaboost algorithm, and GBDT algorithm as feature extractors. Specifically, precipitation, air temperature, wind speed, sunshine duration, relative humidity (RHU), and evapotranspiration were chosen as the initial feature vectors that influence the mean DPT. The feature vectors and DPT were input into three machine learning algorithms to determine the importance of precipitation, air temperature, wind speed, sunshine duration, RHU, and evapotranspiration to changes in mean DPT in 12 sub-basins (Figure 2).
All three algorithms exhibited significant variation in how climate features affected mean DPT. Air temperature was the primary influencing factor of permafrost changes, followed by evapotranspiration and wind speed. On the contrary, sunshine duration and precipitation had a limited influence on permafrost changes. As a direct representation of heat conduction, air temperature influences the freezing-thawing process of permafrost to a large extent. Some studies have used air temperature as the direct index of permafrost occurrence. Although evapotranspiration and wind speed do not influence heat conduction directly, they can influence heat conduction significantly as a result of the latent heat of phase changes and the promotion effect of evapotranspiration. According to the results of the GBDT method, wind speed is less important than evapotranspiration. The GBDT method highlights the importance of air temperature and evapotranspiration. Although distribution ranges of the importance of features in different regions vary among methods based on different feature extractors, the importance-based ranking of features of different methods is relatively uniform.
The evaluation indices of the comprehensive contribution coefficients of influencing factors on permafrost are listed in Table 1. The comprehensive contribution coefficients of influencing factors on permafrost degradation have no significant low values (Table 1). Hence, the primitive characters are the obtained optimal features according to the evaluation indices of importance. The importance ranking of climatic variables to mean values of DPT is the following: air temperature > evapotranspiration > wind speed > RHU > sunshine duration > precipitation.

3.2. Impact of Climate Changes and Permafrost Degradation on Runoff

An importance-based screening of runoff features under climate and permafrost changes was carried out based on the original datasets of different sub-regions in the study area during the time period of 1980–2014. The feature contributions are shown in Figure 3.
The influence of climate changes and permafrost distribution characteristics on runoff depth varied to some extent in the study area. Specifically, precipitation had the most significant influence on runoff. The level of precipitation differed significantly with sub-significant features, such as permafrost coverage and sunshine duration. Features such as air temperature and maximum DPT had a relatively small influence on runoff. Additionally, the three methods achieved relatively consistent rankings of important features but had slight differences in rankings of less important features. The rankings of wind speed and maximum DPT in the Adaboost algorithm were different from those in the other two algorithms to some extent. The rankings of evapotranspiration, RHU, maximum DPT, and air temperature in the GBDT algorithm were different from those in other algorithms. This indicates that the influences of evapotranspiration and maximum DPT on runoff were weaker than those of RHU and temperature.
The evaluation indices of the comprehensive contribution coefficients of influencing factors on runoff is listed in Table 2. The contribution coefficients of climate and permafrost on runoff present a consistent ranking with the importance-based ranking of features gained from the RF algorithm. However, these were slightly different from the rankings in the Adaboost algorithm and GBDT algorithm. According to the comprehensive feature contribution coefficients, two significantly low values of maximum DPT and air temperature were used as the feature set of the combined algorithm. The Adaboost algorithm alone had one significantly low value of air temperature, which formed a feature set comprising a single algorithm. Generally, the importance ranking of climatic and permafrost variables to runoff was the following: precipitation > sunshine duration > permafrost coverage > evapotranspiration > relative humidity (RHU) > mean DPT > wind speed > maximum DPT > air temperature.

3.3. Validation of Impact Pattern of Climate Changes and Permafrost Degradation to Runoff

For feature sets screened according to the evaluation indices of the importance of comprehensive features, combined prediction models of mean DPT were constructed using the RF algorithm and SVM algorithm. The training process is shown in Figure 4.
Both the combined prediction model based on the RF algorithm and that based on the SVM algorithm could predict the distribution of the mean DPT under climate changes after training. However, the model based on the SVM algorithm had a poor fitting effect when the mean DPT was extremely high or extremely low, showing significant errors in numerous places. The combined prediction model based on the RF algorithm had good fitting results, which were consistent with the original sequence. This proved that the combined prediction model based on the RF algorithm was superior to the combined prediction model based on the SVM algorithm in predicting the mean DPT.
To verify the prediction accuracy of the two models, the feature sets involved in the combined models were used as the original feature set. Two control feature sets were, therefore, established. To verify the prediction accuracy of the two models, the control feature sets, Feature 1 and Feature 2, were created by eliminating the precipitation with the minimum contribution coefficient and both the precipitation and sunshine duration with the minimum contribution coefficients. The evaluation indices of prediction performances are listed in Table 3.
Table 3 shows that both the RF regression algorithm and SVM regression algorithm used the optimal feature set as optional features. In other words, the optimal goodness of fit and the minimum error were acquired using the combined model schemes. Moreover, the R2 values of the model based on the RF algorithm using three feature sets were all higher than 0.8. The goodness of fit and error were superior to those of the model based on the SVM algorithm. With changes in the feature set selection, the degree of fitting of the model based on the RF algorithm changed less than that of the model based on the SVM algorithm when the selected features were decreasing gradually relative to the optimal features. This proves indirectly that the model based on the RF algorithm has a better prediction effect in terms of the mean DPT.
Combined runoff prediction models based on the RF and SVM algorithms were constructed using datasets screened according to the contribution coefficients of comprehensive features. Results are shown in Figure 5.
Both the combined prediction model based on the RF algorithm and that based on the SVM algorithm could well predict runoff responses under climate changes and permafrost degradation conditions after training. This shows a high goodness of fit. The fitting details of the two models were compared. The model based on the SVM algorithm had good fitting at extreme points, and it could obtain more accurate numerical values. However, it had slight errors in most of the runoff-depth fitting processes. The prediction model based on the RF algorithm generally had small fitting errors of runoff depth, while having slightly poor fitting performances of extremums.
To verify the prediction accuracy of the two models, the MAE, RMSE, and R2 of the prediction models using the original feature set, the feature set of the AdaBoost algorithm (denoted as AB feature set), and the optimal feature set were calculated. The obtained verification results are presented in Table 4.
Although the feature set obtained using the single Adaboost algorithm fit well with the optimal feature set, the MAE and RMSE of the combined prediction model using the optimal feature set were smaller than the prediction model based on a single algorithm (Table 4). Both the RF regression algorithm and SVM regression algorithm used the optimal feature set as optional features. In other words, they identified the optimal goodness of fit and minimum error by using the combined model schemes. The degrees of fitting of the two regression algorithms under three feature sets could exceed 0.7, but the SVM algorithm was obviously superior to the RF algorithm under the optimal features and original features. With changes in feature set selection, the degree of fitting of the model based on the SVM algorithm changed less than that of the model based on the RF algorithm when the selected features were decreasing gradually relative to the optimal features.
The applicability of the models to the study area was verified in 12 sub-basins. The results are shown in Figure 6. The combined model had good representativeness in predicting permafrost and runoff in the sub-basins (Figure 6). The goodness of fit of the two combined models in predicting runoff depth in the study area was higher than 0.6. Specifically, the goodness of fit of the combined model based on the SVM algorithm was higher than 0.8 around the study area, which proved its stability and practicability. The predicted mean DPT in all sub-basins except the BAT can provide some references for similar projects in future. The goodness of fit of the combined model based on the RF algorithm stayed higher than 0.7.

4. Discussion

The response of permafrost to climate change in the HWYR was similar to the permafrost and the seasonally frozen ground (SFG) of other high-altitude permafrost regions and cold regions [36,37]. In this study, the permafrost degradation in the HWYR was closely related to climate changes. Air temperature was the dominant influencing factor. The predicted average DPT under climate change in this study was closely related to air temperature, evapotranspiration, wind speed, and other factors. However, it was not significantly related to precipitation in the basin, which is consistent with previous studies on DPT changes in the HWYR [38,39]. This is because the average DPT generally represents the characteristics of permafrost in the summer, and the influence of temperature is more significant than that of precipitation. Precipitation can significantly affect the freezing time of permafrost in the autumn and winter [37,40].
Among the climate indicators, except for temperature and evapotranspiration, the difference in the other influencing factors was less than 5%. This may be due to a close relationship between the different elevations, land cover, vegetation properties, or the feedback of permafrost on climate and vegetation in the different sub-basins [36,41]. The prediction model obtained poor results in the BAT sub-basin, which may have been due to its downstream location in the basin, lower elevation, relatively flat terrain, lower permafrost coverage, and higher local vegetation coverage [42]. These were different from the overall characteristics of the study area. In addition, except for the influence of temperature in each sub-basin, the median value of the influencing factors was relatively lower than the mean. The outliers were mostly distributed above the extreme values. This indicates that there were individual basins that were more sensitive to other influencing factors besides air temperature.
A rank list of the comprehensive contribution of climate and permafrost indices to runoff showed that permafrost coverage and average DPT had a significant impact on runoff, which is consistent with existing research [43]. However, the impact of maximum DPT was relatively insignificant. This may have been due to the impact of permafrost on runoff being mainly reflected in the recession processes of winter runoff [43,44]. The runoff in summer is far larger than that in winter. Therefore, the significant impact in winter could be weakened by the insignificant impact in summer, resulting in a relatively weak contribution on the annual scale. The ranking list differs in different sub-basins. The comprehensive contribution of climate and permafrost indices to runoff from all algorithms and sub-basins may weaken that from a specific algorithm and sub-basin. Additionally, there were outliers in the prediction model. These may have been due to the land surface features of sub-basins, such as land cover properties, soil features, elevation, slope, aspects and other influencing factors in the high-cold regions [45].

5. Conclusions

In this study, the contributions of six climate factors on permafrost and of three additional permafrost factors on runoff were recognized and ranked using three machine learning algorithms, including the random forest (RF), AdaBoost, and gradient-boosted decision tree (GBDT). A prediction model for permafrost degradation and runoff was constructed using the support vector machine (SVM) and RF algorithms.
(1)
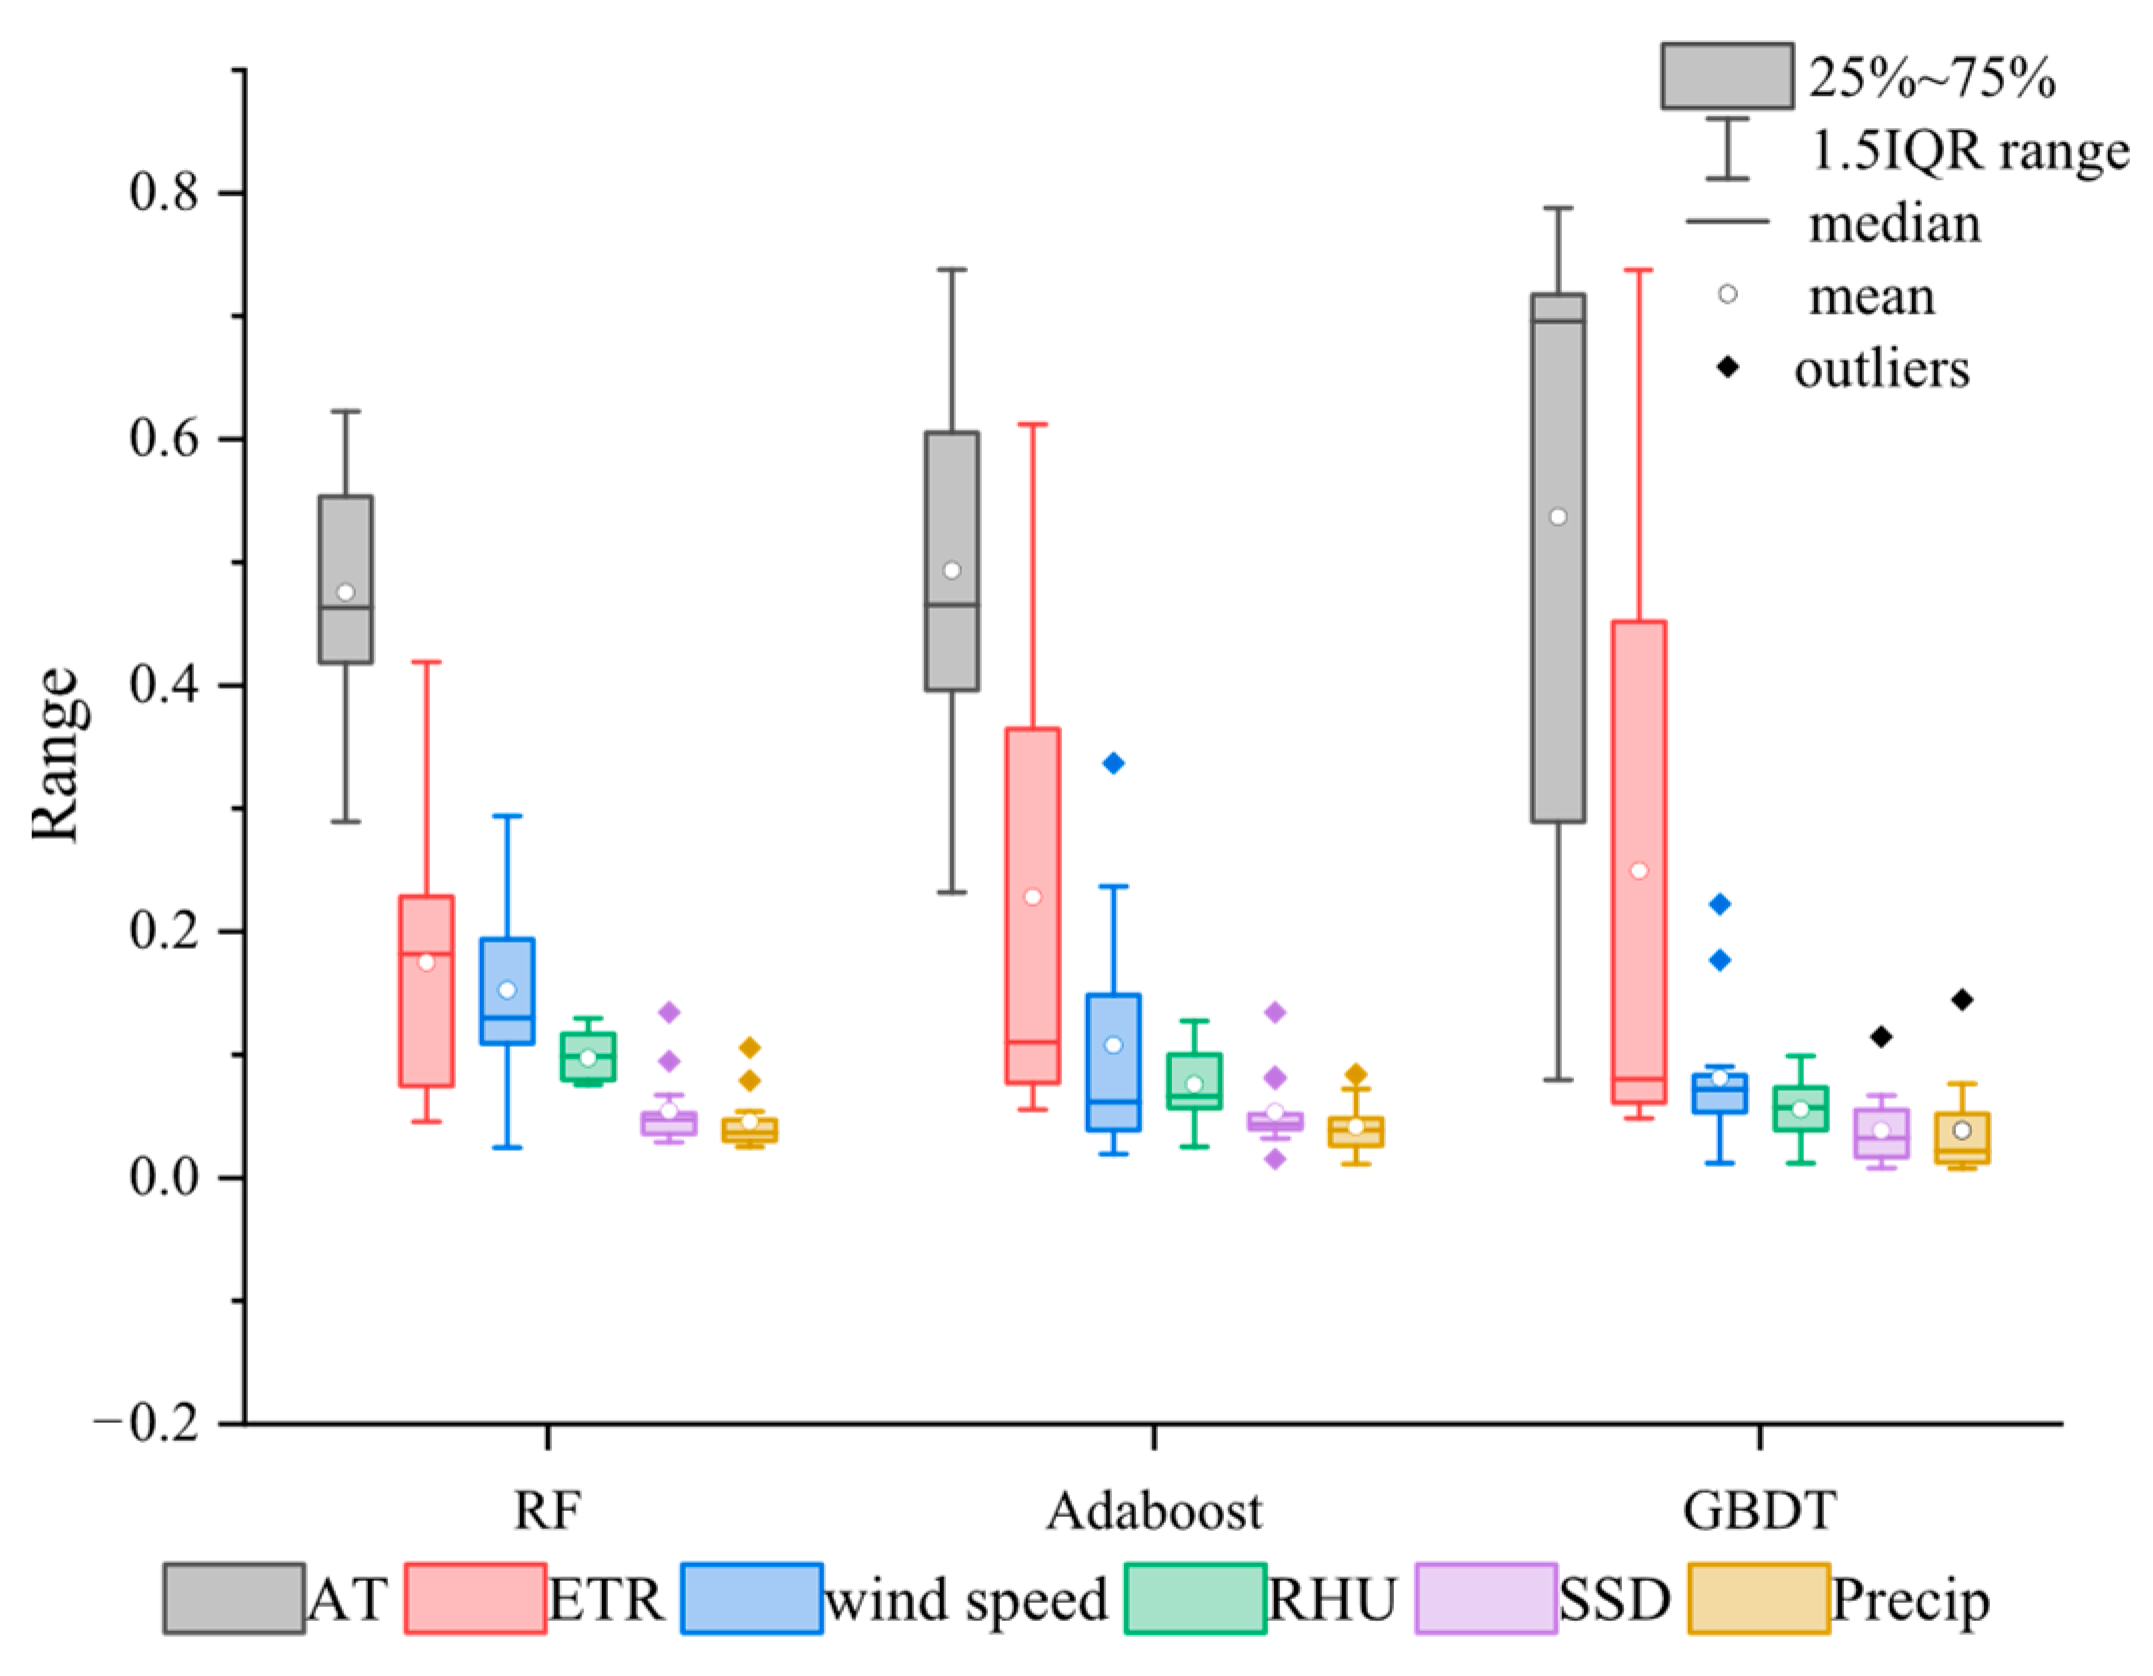
All of the chosen climate factors were significant influencing factors. Air temperature was the primary climate factor that influenced the mean DPT in the study area. The importance ranking of climatic variables to mean values of DPT was as follows: air temperature > evapotranspiration > wind speed > RHU > sunshine duration > precipitation.
(2)
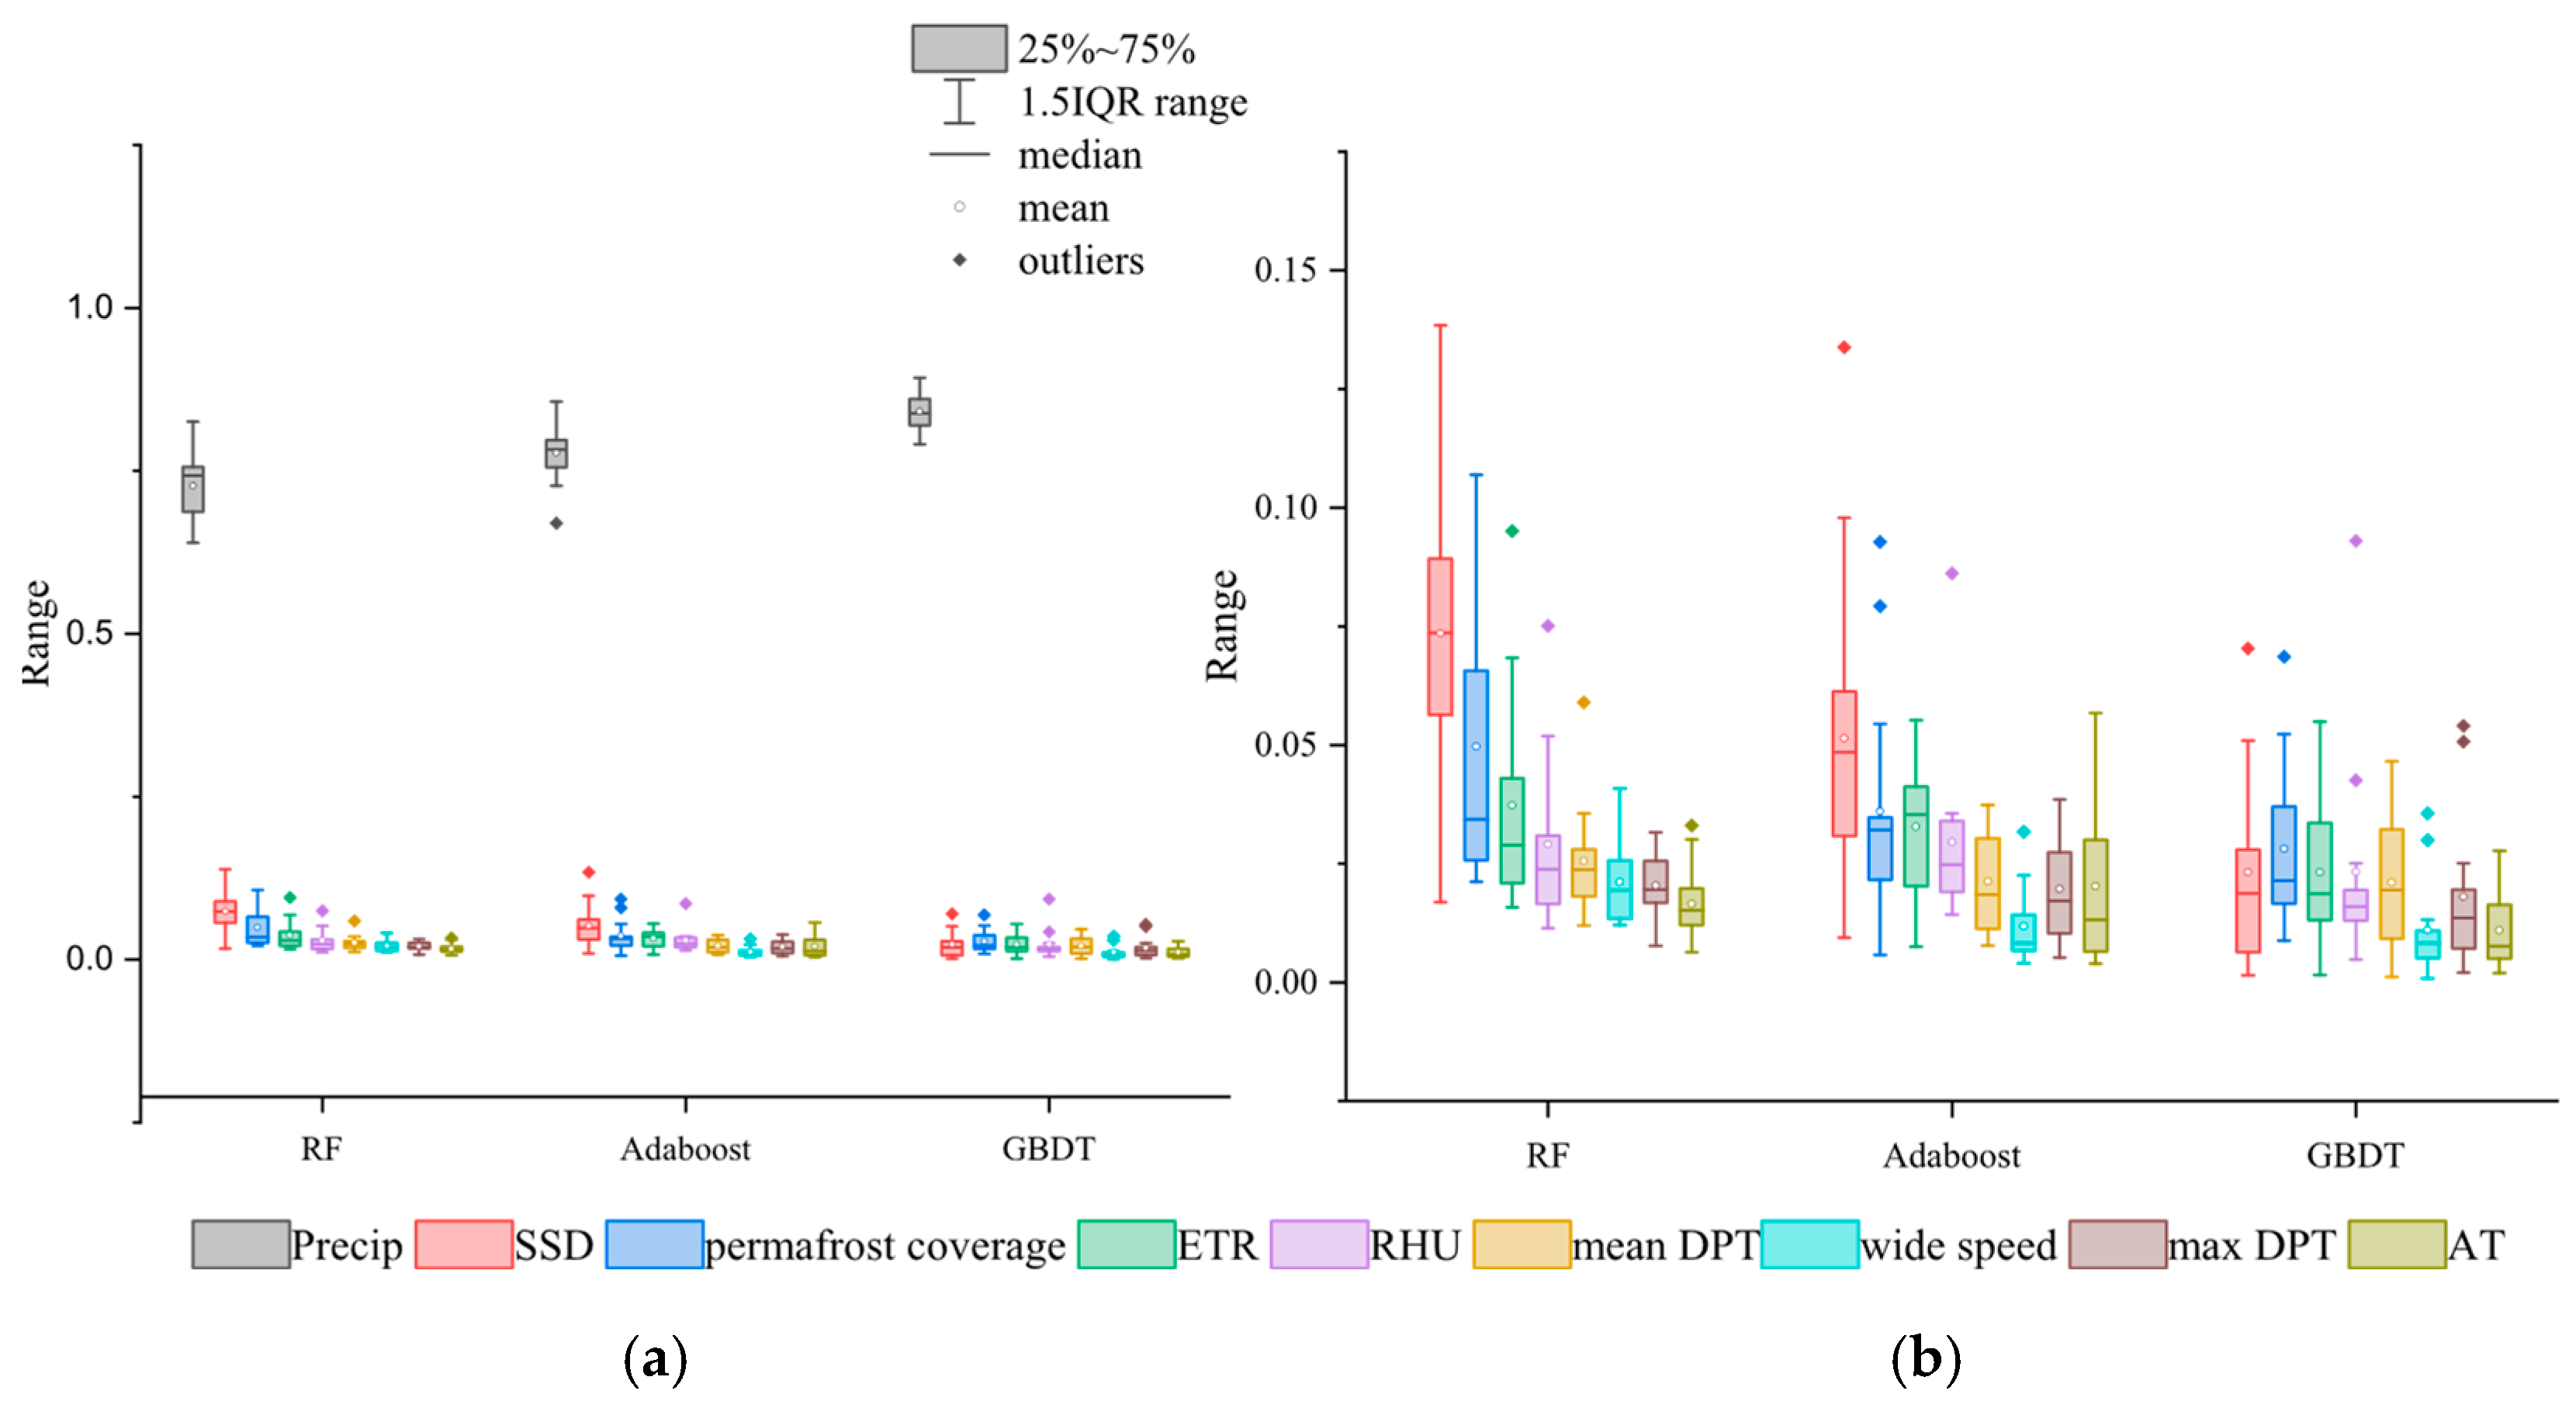
Precipitation had the most significant influence on runoff. Air temperature and maximum DPT had a relatively small but significant influence on runoff. The contribution ranking of climatic and permafrost variables to runoff was as follows: precipitation > sunshine duration > permafrost coverage > evapotranspiration > relative humidity (RHU) > mean DPT > wind speed > maximum DPT > air temperature.
(3)
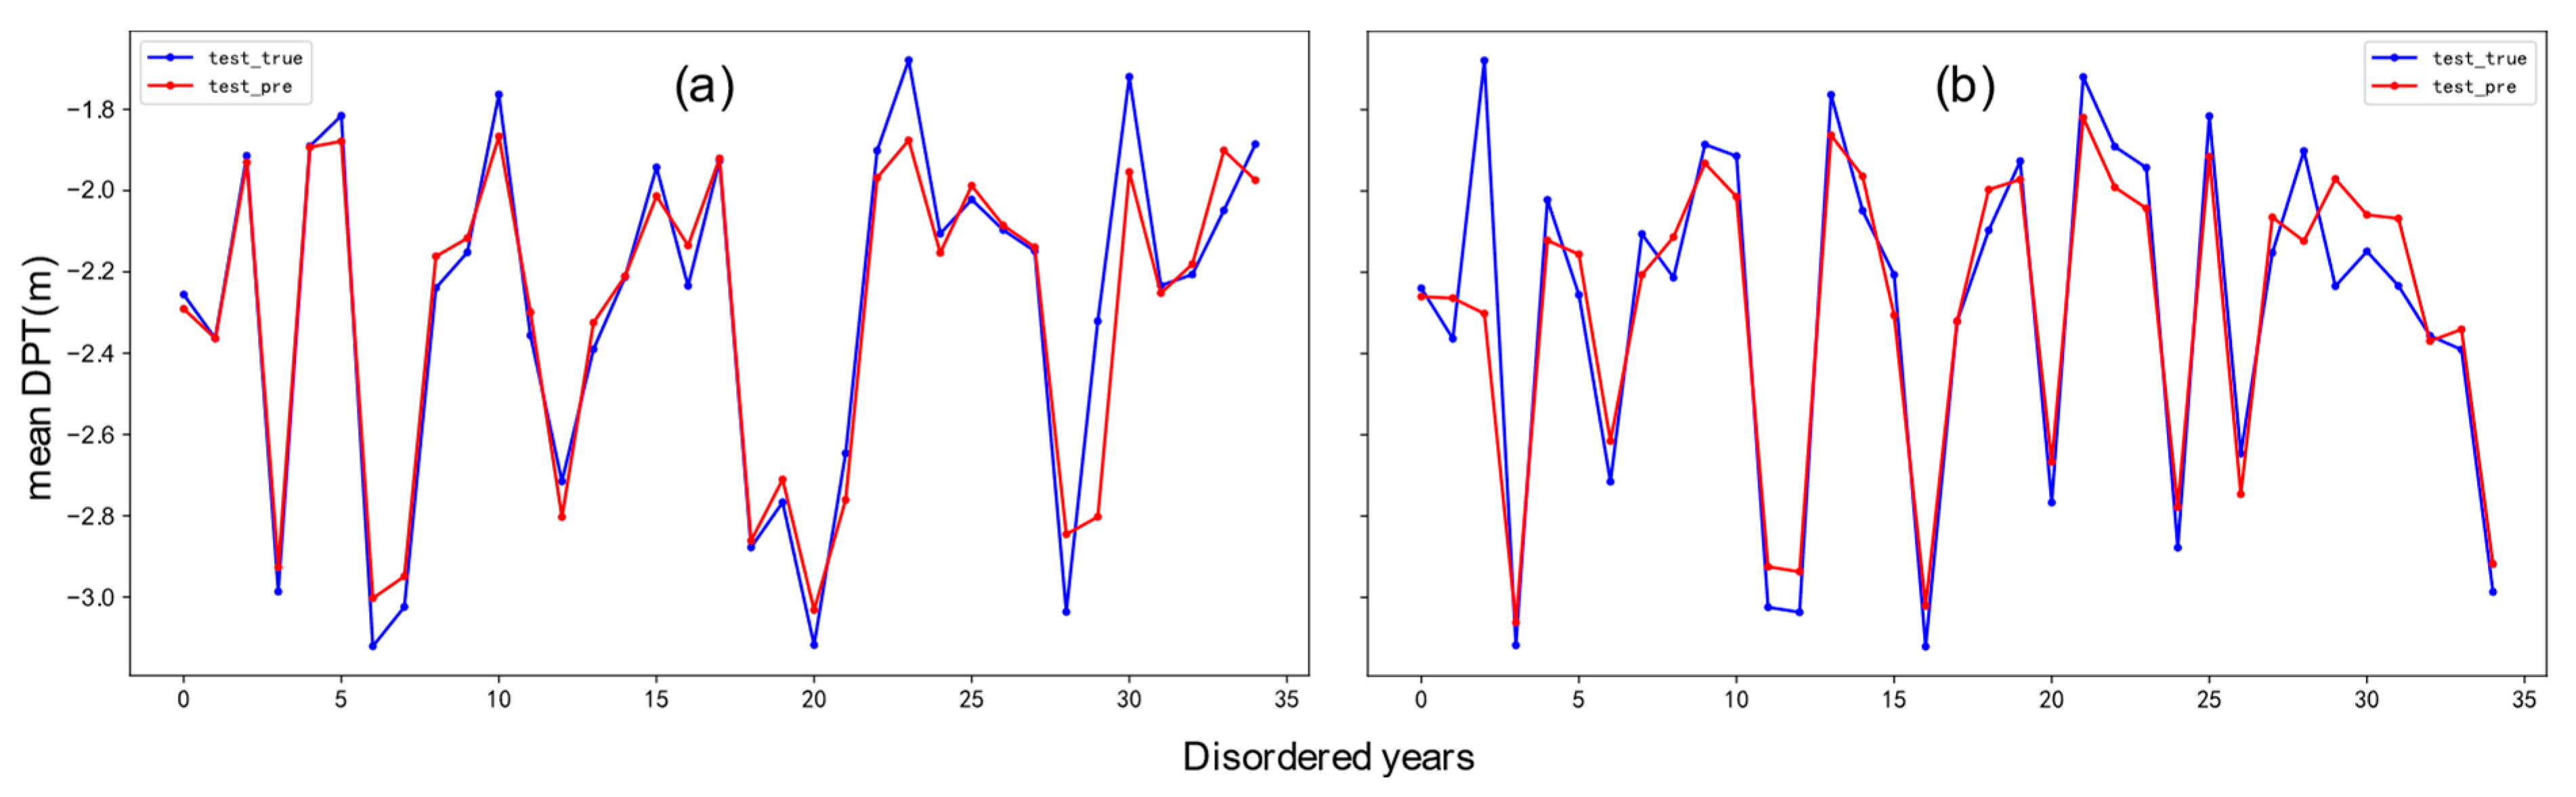
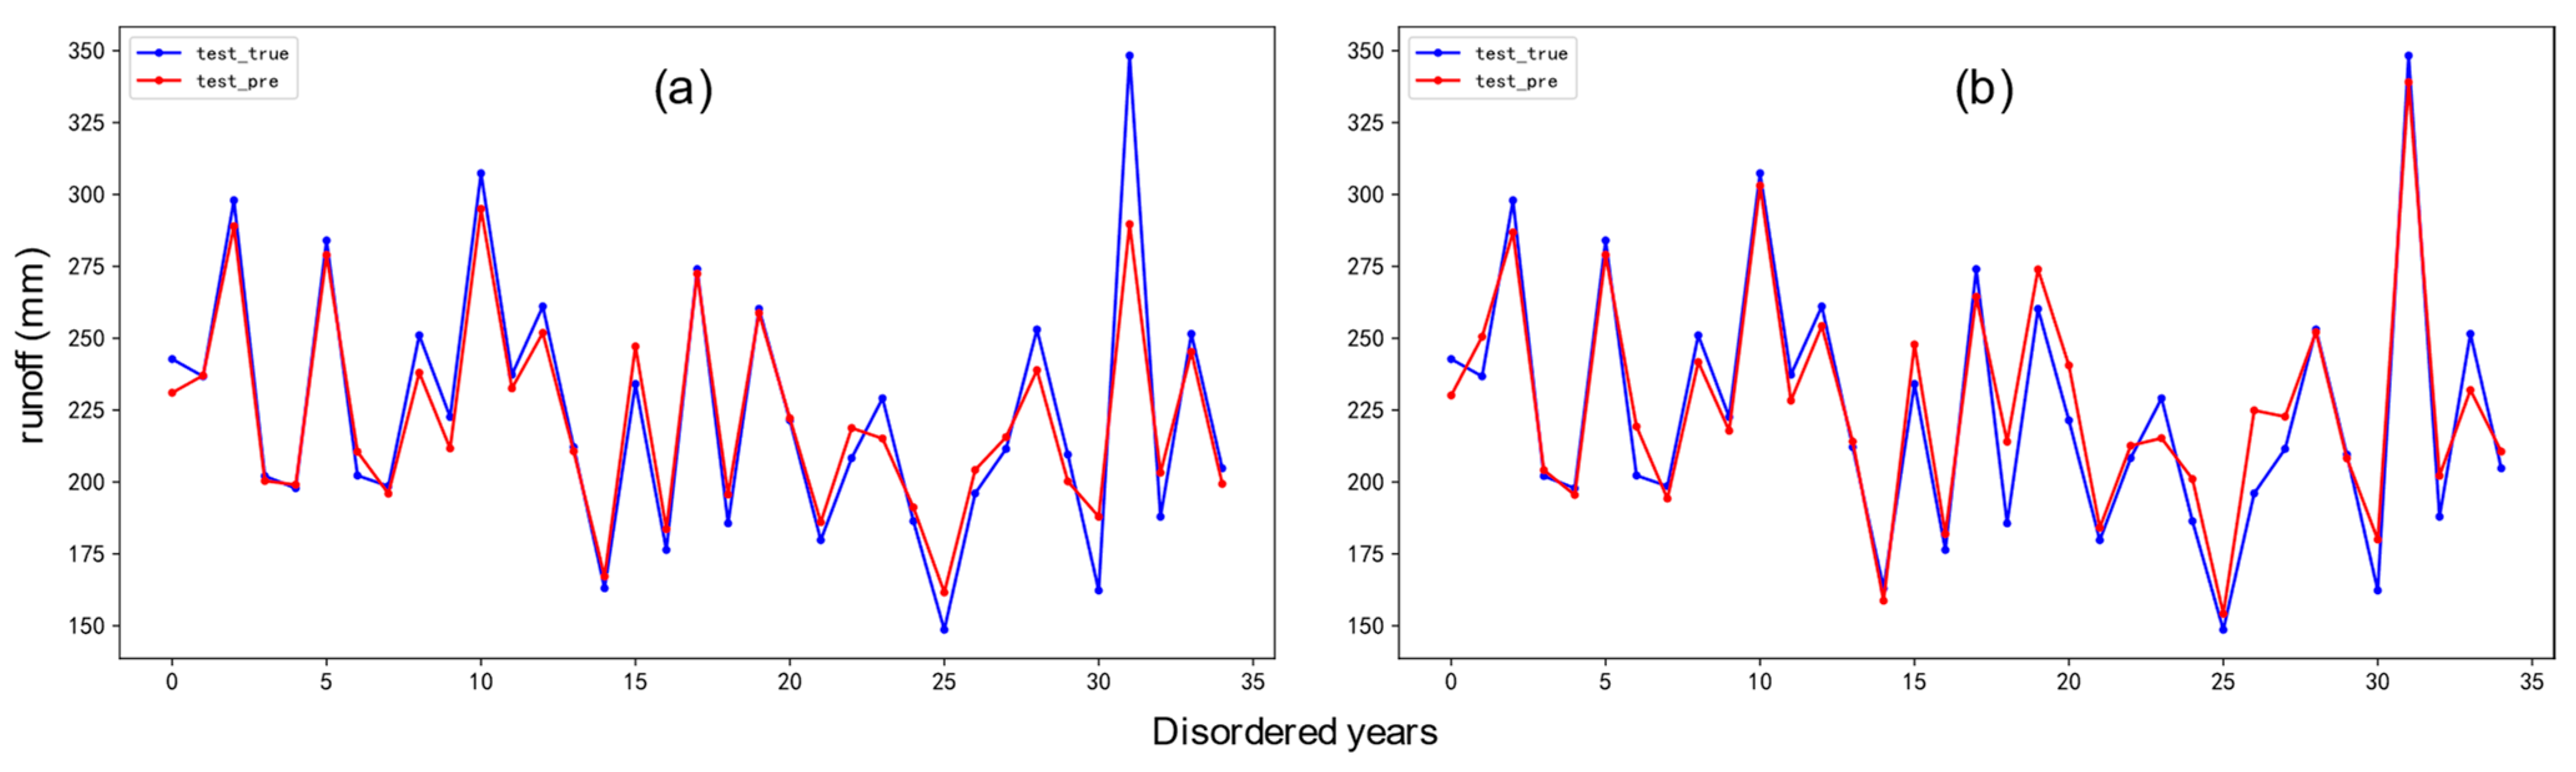
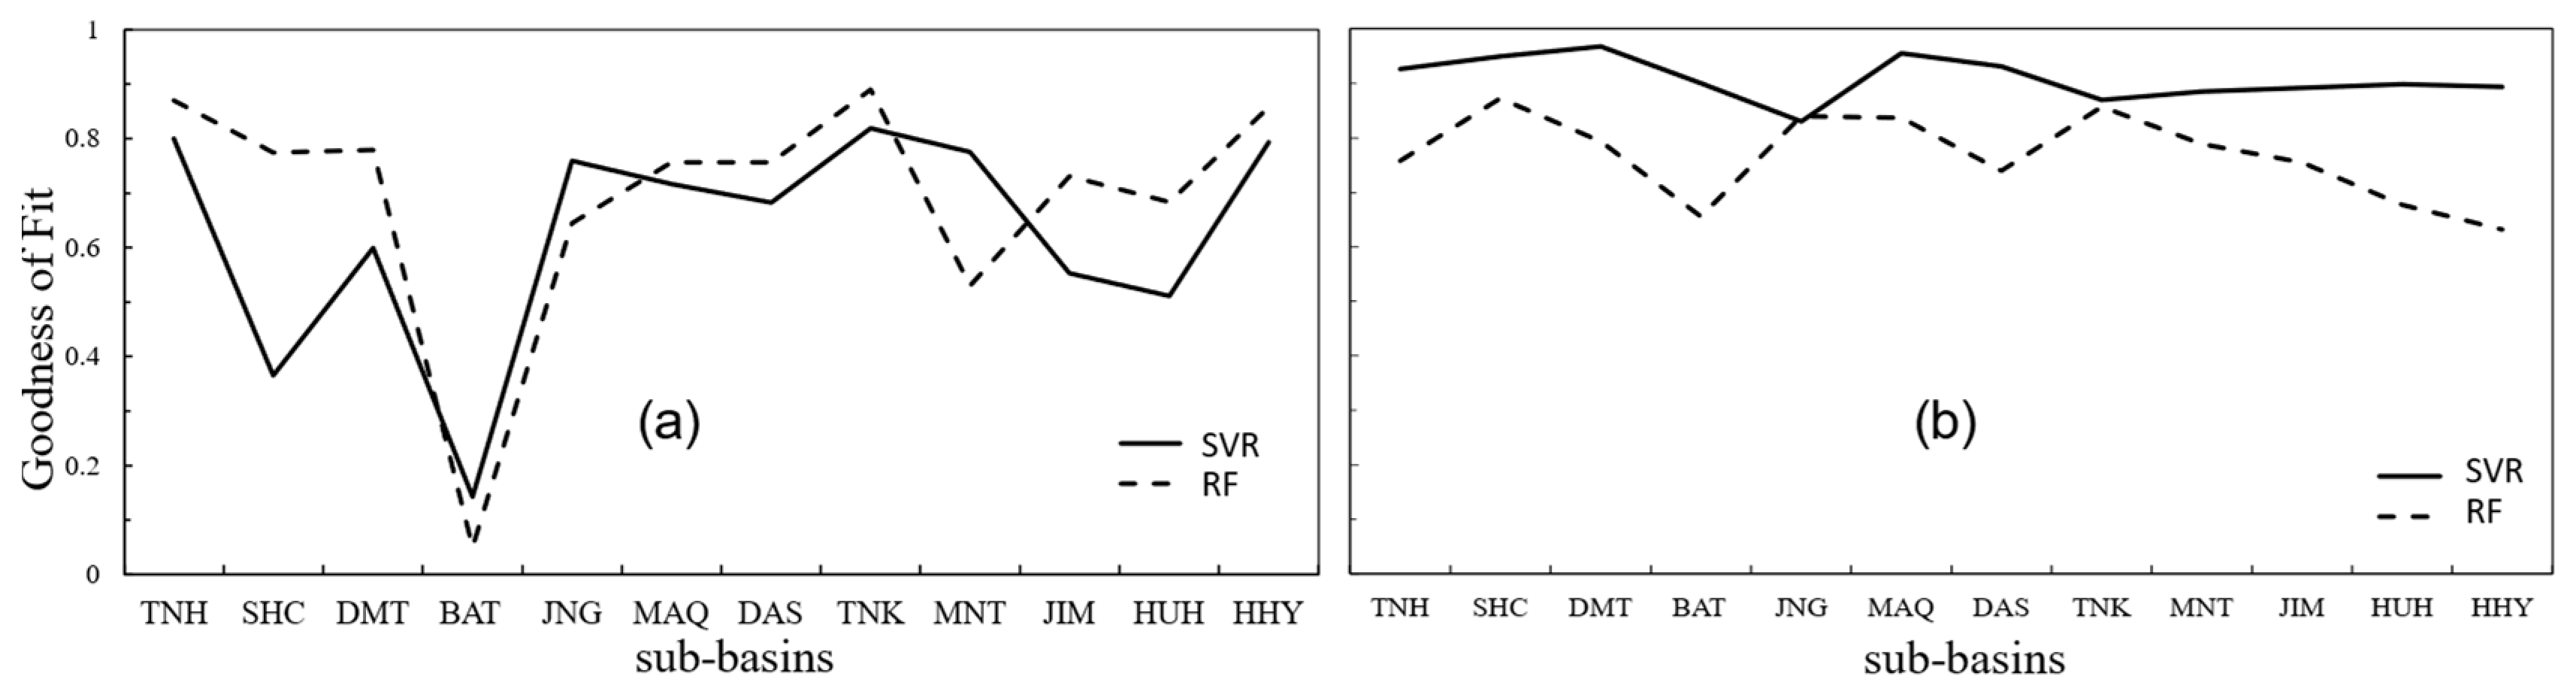
High-accuracy prediction models of the mean DPT and runoff depth were successfully obtained using RF and SVM algorithms. The combined prediction model based on the RF algorithm was superior and had a better prediction effect than the one based on the SVM algorithm in predicting the mean DPT. However, in predicting runoff, the SVM algorithm outperformed the RF algorithm and had a significantly better prediction effect.

Author Contributions

Conceptualization, A.S.; data curation, X.M., Y.S. and Y.B.; formal analysis, A.S.; funding acquisition, A.S.; investigation, A.S. and X.M.; methodology, X.H. and B.W.; project administration, R.H.; resources, A.S., Y.S. and Y.B.; software, X.H., X.M., Y.L., B.W. and H.M.; supervision, A.S.; validation, X.H.; visualization, X.M., Y.L. and H.M.; writing—original draft, X.H. and R.H.; writing—review and editing, A.S. All authors have read and agreed to the published version of the manuscript.

Funding

This research was funded by the “strategic priority research program” of the Chinese Academy of Sciences (Grant No. XDA19070302), the National Natural Science Foundation of China (Grant No. 52109033), the Belt and Road Special Foundation of the State Key Laboratory of Hydrology-Water Resources and Hydraulic Engineering (Grant No. 2020490611), the Foundation of the State Key Laboratory of Frozen Soil Engineering, Northwest Institute of Eco-Environment and Resources, Chinese Academy of Sciences (Grant No. SKLFSE202020), the Fundamental Research Funds for Central Universities (Grant No. 2452020038), the Undergraduate Innovative Experimental Program at Northwest A&F University.

Data Availability Statement

Restrictions apply to the availability of these data.

Acknowledgments

Thanks for the funding of the Undergraduate Innovative Experimental Program at Northwest A&F University, the support from the HPC of NWAFU, and the data support from the “National Earth System Science Data Sharing Infrastructure, National Science & Technology Infrastructure of China (http://www.geodata.cn, accessed on 15 March 2023)”. We are very grateful to anonymous reviewers whose comments helped improve the paper considerably.

Conflicts of Interest

The funders had no role in the design of the study; in the collection, analyses, or interpretation of data; in the writing of the manuscript; or in the decision to publish the results.

References

  1. Luo, S.Q.; Wang, J.Y.; Pomeroy, J.W.; Lyu, S.H. Freeze-Thaw Changes of Seasonally Frozen Ground on the Tibetan Plateau from 1960 to 2014. J. Clim. 2020, 33, 9427–9446. [Google Scholar] [CrossRef]
  2. Wang, G.; Wang, Y. Sensitivity Analysis About Runoff of Unper and Middle of the Yellow River to Climate Change. Water Resour. Water Eng. 2000, 11, 1–5. [Google Scholar]
  3. Walvoord, M.A.; Kurylyk, B.L. Hydrologic Impacts of Thawing Permafrost—A Review. Vadose Zone J. 2016, 15, 1–20. [Google Scholar] [CrossRef] [Green Version]
  4. Yuan, G.; Wu, Z.; Che, A.; Zhou, H. Damage Evolution Mechanism of Loess Slope under the Combination of Freeze-Thaw Cycles and Earthquake. Soil Dyn. Earthq. Eng. 2023, 166, 107778. [Google Scholar] [CrossRef]
  5. Shugar, D.H.; Jacquemart, M.; Shean, D.; Bhushan, S.; Upadhyay, K.; Sattar, A.; Schwanghart, W.; McBride, S.; de Vries, M.V.W.; Mergili, M.; et al. A Massive Rock and Ice Avalanche Caused the 2021 Disaster at Chamoli, Indian Himalaya. Science 2021, 373, 300–306. [Google Scholar] [CrossRef] [PubMed]
  6. Streletskiy, D.A.; Clemens, S.; Lanckman, J.-P.; Shiklomanov, N. The Costs of Arctic Infrastructure Damages Due to Permafrost Degradation. Environ. Res. Lett. 2023, 18, 015006. [Google Scholar] [CrossRef]
  7. Zhang, Y.; Liu, L.; Bai, W.; Shen, Z.; Yan, J.; Ding, M.; Li, S.; Zheng, D. Grassland Degradation in the Source Region of the Yellow River. Acta Geogr. Sin. 2006, 61, 3–14. [Google Scholar]
  8. Walvoord, M.A.; Voss, C.I.; Wellman, T.P. Influence of Permafrost Distribution on Groundwater Flow in the Context of Climate-Driven Permafrost Thaw: Example from Yukon Flats Basin, Alaska, United States. Water Resour. Res. 2012, 48, W07524. [Google Scholar] [CrossRef]
  9. Jin, H.J.; He, R.X.; Cheng, G.D.; Wu, Q.B.; Wang, S.L.; Chang, X.L. Changes in Frozen Ground in the Source Area of the Yellow River on the Qinghai-Tibet Plateau, China, and Their Eco-Environmental Impacts. Environ. Res. Lett. 2009, 4, 045206. [Google Scholar] [CrossRef]
  10. Zhang, S.; Wang, Y.; Zhao, Y.; Huang, Y.; Li, Y.; Shi, W.; Shang, X. Permafrost Degradation and Its Environmental Sequent in the Source Regions of the Yellow River. J. Glaciolgy Geocryol. 2004, 26, 10025829438. [Google Scholar]
  11. Cheng, G.; Jin, H. Groundwater in the permafrost regions on the Qinghai-Tibet Plateau and it changes. Hydrogeol. Eng. Geol. 2013, 40, 1–11. [Google Scholar]
  12. Yamazaki, Y.; Kubota, J.; Ohata, T.; Vuglinsky, V.; Mizuyama, T. Seasonal Changes in Runoff Characteristics on a Permafrost Watershed in the Southern Mountainous Region of Eastern Siberia. Hydrol. Process. 2006, 20, 453–467. [Google Scholar] [CrossRef]
  13. Zhang, T.; Stamnes, K. Impact of Climatic Factors on the Active Layer and Permafrost at Barrow, Alaska. Permafr. Periglac. Process. 1998, 9, 229–246. [Google Scholar] [CrossRef]
  14. Wu, J.; Sheng, Y.; Wu, Q.; Wen, Z. The Permafrost Degradation Pattern on Qinghai-Tibet Plateau. Sci. China (D Earth Sci.) 2009, 39, 1570–1578. [Google Scholar] [CrossRef]
  15. Zhao, L.; Hu, G.; Zou, D.; Wu, X.; Ma, L.; Sun, Z.; Yuan, L.; Zhou, H.; Liu, S. Permafrost Changes and Its Effects on Hydrological Processes on Qinghai-Tibet Plateau. Bull. Chin. Acad. Sci. 2019, 34, 1233–1246. [Google Scholar] [CrossRef]
  16. Liu, J.; Xie, J.; Hong, W.; Wang, H.; Xie, Y. Impacts of Winter Warming and Permafrost Degradation on Water Variability, Upper Lhasa River, Tibet. Quat. Int. 2011, 244, 178–184. [Google Scholar] [CrossRef]
  17. Liu, J.; Hayakawa, N.; Lu, M.; Dong, S.; Yuan, J. Hydrological and Geocryological Response of Winter Streamflow to Climate Warming in Northeast China. Cold Reg. Sci. Technol. 2003, 37, 15–24. [Google Scholar] [CrossRef]
  18. Li, D.; Tian, Y.; Liu, C. Distributed Hydrological Simulation of the Source Regions of the Yellow River under Environmental Changes. Acta Geogr. Sin. 2004, 59, 565–573. [Google Scholar]
  19. Wang, X.; Li, H.; Chen, R.; Liu, J.; Liu, G.; Han, C. Runoff Evolution Characteristics and Driving Factors of Yellow River Above Lanzhou Station from 1956 to 2020 Under Changing Environment. Adv. Earth Sci. 2022, 37, 726–741. [Google Scholar]
  20. Wang, G.; Mao, T.; Chang, J.; Song, C.; Huang, K. Processes of Runoff Generation Operating during the Spring and Autumn Seasons in a Permafrost Catchment on Semi-Arid Plateaus. J. Hydrol. 2017, 550, 307–317. [Google Scholar] [CrossRef]
  21. Song, C.; Wang, G.; Mao, T.; Dai, J.; Yang, D. Linkage between Permafrost Distribution and River Runoff Changes across the Arctic and the Tibetan Plateau. Sci. China-Earth Sci. 2020, 63, 292–302. [Google Scholar] [CrossRef]
  22. Sun, A.; Yu, Z.; Zhou, J.; Acharya, K.; Ju, Q.; Xing, R.; Huang, D.; Wen, L. Quantified Hydrological Responses to Permafrost Degradation in the Headwaters of the Yellow River (HWYR) in High Asia. Sci. Total Environ. 2020, 712, 135632. [Google Scholar] [CrossRef]
  23. Sun, A.; Zhou, J.; Yu, Z.; Jin, H.; Sheng, Y.; Yang, C. Three-Dimensional Distribution of Permafrost and Responses to Increasing Air Temperatures in the Head Waters of the Yellow River in High Asia. Sci. Total Environ. 2019, 666, 321–336. [Google Scholar] [CrossRef] [PubMed]
  24. Sun, A.; Zhou, J.; Yu, Z.; Su, X.; Song, S.; Wu, Q.; Schulla, J. Quantified Spatial-Temporal Variation of the Fine-Scale Frozen Soils during 1980-2014 in the Headwaters of the Yellow River (HWYR) in High Mountain Asia. Catena 2023, 222, 106836. [Google Scholar] [CrossRef]
  25. Li, Q.; Zhao, D.; Yin, J.; Zhou, X.; Li, Y.; Chi, P.; Han, Y.; Ansari, U.; Cheng, Y. Sediment Instability Caused by Gas Production from Hydrate-Bearing Sediment in Northern South China Sea by Horizontal Wellbore: Evolution and Mechanism. Nat. Resour. Res. 2023, 1–26. [Google Scholar] [CrossRef]
  26. Li, Q.; Zhang, C.; Yang, Y.; Ansari, U.; Han, Y.; Li, X.; Cheng, Y. Preliminary Experimental Investigation on Long-Term Fracture Conductivity for Evaluating the Feasibility and Efficiency of Fracturing Operation in Offshore Hydrate-Bearing Sediments. Ocean Eng. 2023, 281, 114949. [Google Scholar] [CrossRef]
  27. Wang, F.; Liu, X.; Jiang, B.; Zhuo, H.; Chen, W.; Chen, Y.; Li, X. Low-Loading Pt Nanoparticles Combined with the Atomically Dispersed FeN4 Sites Supported by FeSA-N-C for Improved Activity and Stability towards Oxygen Reduction Reaction/Hydrogen Evolution Reaction in Acid and Alkaline Media. J. Colloid Interface Sci. 2023, 635, 514–523. [Google Scholar] [CrossRef]
  28. Stańczyk, U. Ranking of Characteristic Features in Combined Wrapper Approaches to Selection. Neural Comput. Appl. 2015, 26, 329–344. [Google Scholar] [CrossRef] [Green Version]
  29. Liu, X.-Y.; Liang, Y.; Wang, S.; Yang, Z.-Y.; Ye, H.-S. A Hybrid Genetic Algorithm With Wrapper-Embedded Approaches for Feature Selection. IEEE Access 2018, 6, 22863–22874. [Google Scholar] [CrossRef]
  30. Peng, Z.; Liu, Q.; Zhang, Y. Short Term Load Forecasting Based on Multi-Model Comprehensive FeatureSelection and LSTM-Attention. Distrib. Energy 2022, 7, 11–20. [Google Scholar]
  31. Wang, B.; Zhuang, J.; Xiong, J.; Luo, X. HDFC-RF Algorithm Based on High-Dimensional Feature Clusting Optimization. J. Jinggangshan Univ. (Nat. Sci.) 2022, 43, 52–56. [Google Scholar]
  32. Jia, K.; Xuan, Z.; Lin, Y.; Wei, H.; Li, G. An Islanding Detection Method for Grid-Connected Photovoltaic Power System Based on Adaboost Algorithm. Trans. China Electrotech. Soc. 2018, 33, 1106–1113. [Google Scholar]
  33. Meng, R.; Shen, W.; Luan, K.; Ji, Q.; Rao, Y. Water Depth Retrieval Based on Gradient Boosting Decision Tree Algorithm. Trans. Oceanol. Limnol. 2023, 45, 45–50. [Google Scholar]
  34. Yan, B.; Wang, X.; Jiang, Z. Study on the Gaze Estimation Algorithm Based on Support Vector Regression Model. Chin. J. Sci. Instrum. 2014, 35, 2299–2305. [Google Scholar]
  35. Li, S.; Liu, L.; Rong, J.; Zhou, W.; Liu, L. Atmospheric Weighted Mean Temperature Based on Support Vector Regression. J. Guilin Univ. Technol. 2019, 39, 656–660. [Google Scholar]
  36. Peng, X.; Mu, C. Changes of Soil Thermal and Hydraulic Regimes in the Heihe River Basin. Environ. Monit. Assess. 2017, 189, 483. [Google Scholar] [CrossRef]
  37. Henry, H.A.L. Climate Change and Soil Freezing Dynamics: Historical Trends and Projected Changes. Clim. Chang. 2008, 87, 421–434. [Google Scholar] [CrossRef]
  38. Wang, R.; Dong, Z.B.; Zhou, Z.C. Effect of Decreasing Soil Frozen Depth on Vegetation Growth in the Source Region of the Yellow River for 1982–2015. Theor. Appl. Climatol. 2020, 140, 1185–1197. [Google Scholar] [CrossRef]
  39. Peng, X.Q.; Zhang, T.J.; Frauenfeld, O.W.; Wang, K.; Cao, B.; Zhong, X.Y.; Su, H.; Mu, C.C. Response of Seasonal Soil Freeze Depth to Climate Change across China. Cryosphere 2017, 11, 1059–1073. [Google Scholar] [CrossRef] [Green Version]
  40. Kane, D.L.; Hinzman, L.D.; Zarling, J.P. Thermal Response of the Active Layer to Climatic Warming in a Permafrost Environment. Cold Reg. Sci. Technol. 1991, 19, 111–122. [Google Scholar] [CrossRef]
  41. Gao, B.; Li, J.; Wang, X.S. Impact of Frozen Soil Changes on Vegetation Phenology in the Source Region of the Yellow River from 2003 to 2015. Theor. Appl. Climatol. 2020, 141, 1219–1234. [Google Scholar] [CrossRef]
  42. Ding, M.; Zhang, Y.; Liu, L.; Zhang, W.; Wang, Z.; Bai, W. The Relationship between NDVI and Precipitation on the Tibetan Plateau. J. Geogr. Sci. 2007, 17, 259–268. [Google Scholar] [CrossRef]
  43. Kalyuzhnyi, I.L.; Lavrov, S.A. Mechanism of the Influence of Soil Freezing Depth on Winter Runoff. Water Resour. 2017, 44, 604–613. [Google Scholar] [CrossRef]
  44. Niu, L.; Ye, B.; Li, J.; Sheng, Y. Effect of Permafrost Degradation on Hydrological Processes in Typical Basins with Various Permafrost Coverage in Western China. Sci. China Earth Sci. 2011, 41, 85–92. [Google Scholar] [CrossRef]
  45. Kalyuzhnyi, I.L.; Lavrov, S.A. Basic Physical Processes and Regularities of Winter and Spring River Runoff Formation under Climate Warming Conditions. Russ. Meteorol. Hydrol. 2012, 37, 47–56. [Google Scholar] [CrossRef]
Figure 1. Distribution of hydrologic and meteorological stations, elevations, rivers, and sub-basins in the study area.
Water 15 02347 g001
Figure 2. Contributions of climate features to permafrost degradation in 12 sub-basins using 3 algorithms, including Random Forest (RF), AdaBoost, and the gradient-boosted decision tree (GBDT). The climate features are AT (air temperature), ERT (evapotranspiration), wind speed, RHU (relative humidity), SSD (sunshine duration), and Precip (precipitation).
Water 15 02347 g002
Figure 3. Contributions of climate and permafrost features to runoff changes under fitting of three algorithms. Contributions to runoff changes from (a) impact factors including AT (air temperature), ERT (evapotranspiration), wind speed, RHU (relative humidity), SSD (sunshine duration), Precip (precipitation), permafrost coverage (RPSA), and mean/maximum DPT and from (b) impact factors without precipitation.
Water 15 02347 g003
Figure 4. Training process of combined prediction models for mean DPT based on (a) RF algorithm and (b) SVM algorithm. The red and blue lines are the prediction and original data, respectively.
Water 15 02347 g004
Figure 5. Training process of combined prediction models for runoff based on (a) RF algorithm and (b) SVM algorithm. The red and blue lines are the prediction and original data, respectively.
Water 15 02347 g005
Figure 6. Fitting results of (a) mean DPT in sub-basins and (b) runoff in 12 sub-basins using combined prediction models including SVR (black solid lines) and RF (black dashed lines).
Water 15 02347 g006
Table 1. Comprehensive contribution coefficients of climatic indices to permafrost degradation after fitting using different algorithms.
FeaturesRFAdaboostGBDTComprehensive Contribution Coefficient
Air temperature0.4820.5150.5751.573
Evapotranspiration0.1610.1960.2090.566
Wind speed0.1540.1110.0820.348
RHU0.0990.0800.0570.236
Sunshine duration0.0560.0550.0400.151
Precipitation0.0470.0420.0370.126
Table 2. Comprehensive contribution coefficients of climatic indices to runoff changes after fitting using different algorithms.
FeaturesRFAdaboostGBDTComprehensive Contribution Coefficient
Precipitation0.72680.77720.84122.3452
Sunshine duration0.07350.05150.02320.1482
Permafrost coverage0.04970.03600.02810.1138
Evapotranspiration0.03730.03280.02320.0932
RHU0.02910.02960.02320.0819
Mean DPT0.02560.02130.02110.0679
wind speed0.02040.01970.01800.0581
Maximum DPT0.01650.02020.01100.0477
air temperature0.02110.01180.01100.0439
Table 3. Prediction accuracy of combined models for permafrost degradation.
ModelsRFSVM
Feature SetOptimal FeaturesFeature 1Feature 2Optimal FeaturesFeature 1Feature 2
RMSE0.110.190.190.330.410.48
MAE0.080.150.160.280.320.31
R20.890.810.840.860.790.75
Table 4. Prediction accuracy of the combined models for runoff changes.
ModelsRFSVM
Feature SetsOptimal FeaturesAB FeaturesOriginal FeaturesOptimal FeaturesAB FeaturesOriginal Features
RMSE24.6624.8026.577.697.938.04
MAE18.5518.7120.555.946.336.54
R20.810.800.780.950.950.94
Disclaimer/Publisher’s Note: The statements, opinions and data contained in all publications are solely those of the individual author(s) and contributor(s) and not of MDPI and/or the editor(s). MDPI and/or the editor(s) disclaim responsibility for any injury to people or property resulting from any ideas, methods, instructions or products referred to in the content.

