Article

Selective Speciation of Inorganic Selenium [Se(IV)] in Water Samples by Inductively Coupled Plasma Mass Spectrometry after Solid Phase Extraction: Blood and Mokolo Rivers, South Africa

by
Mmakoena Meldred Matjena
1,*,
Richard M. Mampa
1,* and
Abayneh Ataro Ambushe
2,*
1
Department of Chemistry, University of Limpopo, Private Bag X 1106, Sovenga 0727, South Africa
2
Department of Chemical Sciences, University of Johannesburg, P.O. Box 524, Auckland Park 2006, South Africa
*
Authors to whom correspondence should be addressed.
Water 2023, 15(15), 2679; https://doi.org/10.3390/w15152679
Submission received: 9 May 2023 / Revised: 5 July 2023 / Accepted: 21 July 2023 / Published: 25 July 2023
(This article belongs to the Special Issue Studies on Soil and Water Contamination)

Abstract

:
Selenium can either be essential or toxic depending on the concentration and oxidation state. In this study, the concentrations of inorganic selenium [Se(IV)] in water samples were determined in the presence of hexavalent selenium [Se(VI)} in water. Water samples were collected from ten different sampling sites in Blood and Mokolo Rivers in Limpopo Province, South Africa. A solid phase extraction (SPE) method with Dowex 1 × 2 resin (chloride form) as an adsorbent material was used to preconcentrate and separate Se(IV) selectively in the presence of Se(VI) in water samples. Concentrations of Se(IV) were quantified by inductively coupled plasma-mass spectrometry (ICP-MS) and ranged from 0.0411 to 0.820 µg/L and 0.135 to 2.79 µg/L in Blood and Mokolo Rivers, respectively. The presence of Se(IV) in water samples collected from Blood and Mokolo Rivers suggests that industrial and agricultural activities around these rivers have an impact on water quality.

1. Introduction

Surface water plays an important role in water supply around the world [1]. In South Africa, a number of rivers provide water for many purposes including drinking, irrigation and animal farming. It is also used as a source of water for recreation and for hydropower generating schemes [2]. However, South Africa is an extremely water scarce country [3]. Whilst the majority of the people rely on water from the streams and rivers, it has been reported that almost 30% of the population in South Africa do not have access to potable water. As a result, they rely solely on surface/ground water for their day-to-day activities [4].
A 19% of South Africa’s surface water is unfit for human consumption because of industrial, human, and animal waste [5]. Water contamination in South Africa is a problem due to an increase in pollution of river catchments by urbanization, industrial, mining, agriculture, energy use and improper waste management. Similarly, the quality of surface water is deteriorating due to several natural and anthropogenic activities. Potentially toxic elements (PTEs) are amongst those water pollutants [6].
The PTE of concern in this study is selenium (Se). Contamination of water bodies by Se is becoming worldwide challenge. The excessive exposure to Se may be fatal to human health due to its toxicity [7]. Naturally, Se is present in earth’s crust in low amounts (<0.05 µg·g−1). However, its components are widely spread throughout the environment from combustion of fossil fuels, improper wastes disposal from activities such as mining, uses in the production of glass, electronic industries as well as agriculture [8].
Selenium exists naturally in several chemical forms such as organic, inorganic and methylated derivatives. The inorganic species most frequently found in water and soils are selenite (SeO32−) and selenate (SeO42−) [9]. It has been reported that the inorganic forms of selenium are more toxic than the organic forms [selenocysteine (C3H7NO2Se)] and [selenomethionine (C5H11NO2Se)] [10].
Selenium has become one of the major contaminants of concern in irrigation water and aquatic ecosystems since the 1980s [11]. It is an essential element that is required in trace amount for normal health due to its antioxidant activity [12]. Selenium becomes toxic at higher concentration of more than 400 µg/day [13,14]. The interval between the concentration in which Se is essential, and toxic is rather narrow [15]. A concentration of 3 to 5 times higher than the essential concentration is considered to be toxic [16]. When this tolerable daily intake limit is exceeded, a disease called Selenosis may occur [17].
The essentiality and toxicity of Se depends not only on the concentration but also on the oxidation state. The toxicity of Se(IV) is more severe than that of Se(VI) [18]. The determination of total Se content in water is not enough since total concentration alone cannot provide information regarding the toxicity of the element. Thus, identification and determination of Se species by speciation is important since its toxicity, mobility and bioavailability depends on chemical forms the element in the environmental matrices [19]. Considering these facts, it is very important to determine the levels of inorganic Se(IV) in water bodies as its concentration may have adverse effect on the environment.
Blood and Mokolo Rivers, like most rivers in South Africa, are also facing challenges of water pollution. Blood River (situated in the Capricorn District of the Limpopo province) serves as a source of water for agricultural activities and livestock farming in the nearby communities. Proper waste management system around Blood River (communal area) is non-existent. There were visible dumping sites, sand mining and direct flow of leaking sewage pipes into the river, which observed during sample collection. These anthropogenic activities may elevate the levels of PTEs in the river water. Mokolo River (situated in the Waterberg district of the Limpopo province), also serves as a source of water for farming and communal use. In this study, a solid phase extraction (SPE) method with Dowex 1 × 2 resin (chloride form) as an adsorbent material was optimised and applied to preconcentrate and separate Se(IV) selectively in the presence of Se(VI) in water samples. Concentrations of Se(IV) in water samples collected from Blood and Mokolo Rivers were determined using inductively coupled plasma-mass spectrometry (ICP-MS).

2. Experimental

2.1. Reagents, Standard Solutions and Standard Reference Materials

High purity chemical reagents were used throughout this work. Solutions were prepared with de-ionised water from Milli-Q water system purification with a specific resistance of 18.3 MΩ cm. All glassware used were cleaned by soaking in 10% HNO3 and rinsed 3 times with de-ionised water prior to use. Standards stock solution (1000 mg/L) of Se(IV) and 1000 mg/L of Se(VI) were obtained from Sigma Aldrich. Working standards were prepared daily by appropriate dilutions of stock standards in 1% HNO3. Dowex 1 × 2 (chloride form, 50–100 mesh) obtained from Sigma Aldrich was used as a sorbent material for the speciation of inorganic selenium. Standard reference materials (SRMs) used for validation of the analytical methods for water samples was SRM 1643f (Trace elements in water (NIST, Gaithersburg, MD, USA).

2.2. Apparatus and Instrumentation

The following instruments were used to carry out analysis on this study:
  • pH measurement
A Thermo Scientific 520 A pH/mV/SE bench top Meter (USA) was used to measure the pH of water samples.
  • Separation and preconcentration of inorganic selenium
A (SPE apparatus equipped with SPE tube filled with Dowex 1 × 2 resin as a sorbent material was used to preconcentrate and separate Se(IV).
  • Analysis of total selenium concentration and speciation of inorganic selenium
An ICP-MS (Sciex Elan 6100, Perkin Elmer, Rodgau, Germany) was used to measure the total concentration of selenium and concentration of inorganic selenium specie. A summary of the optimum conditions for all necessary parameters for ICP-MS measurements are shown in Table 1.

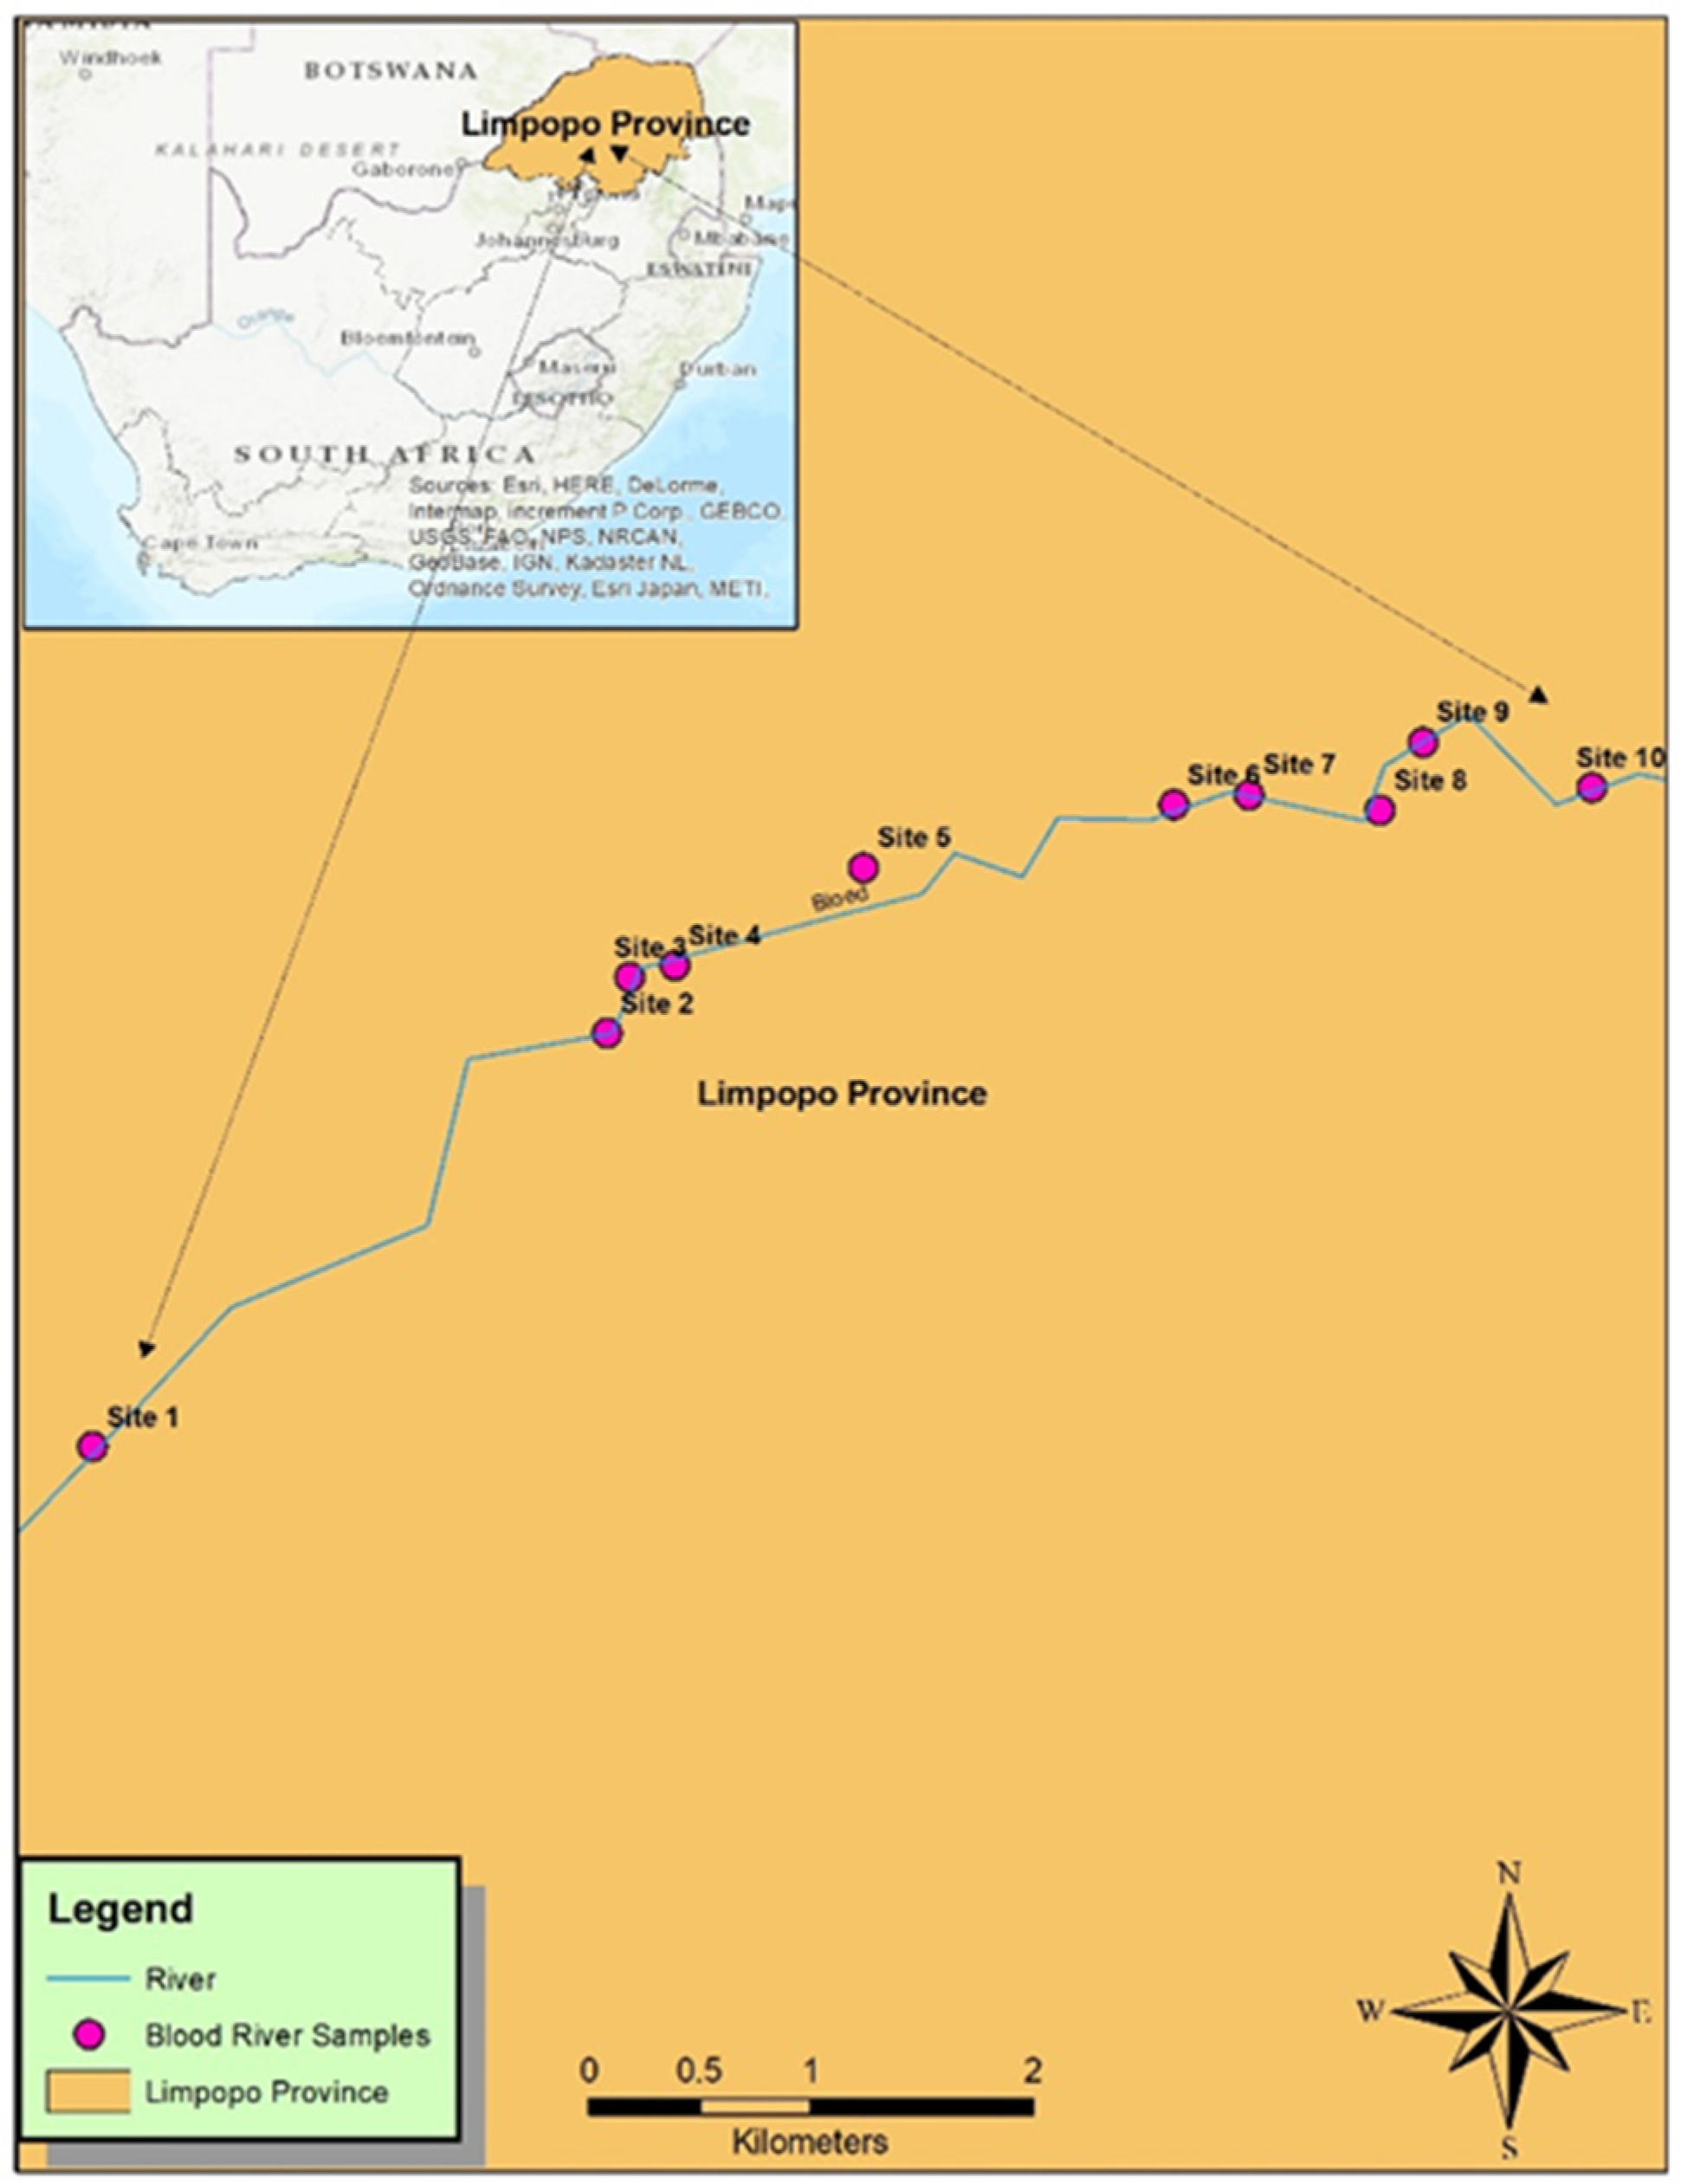
2.3. Sample Collection and Preservation

Water samples were collected from Blood and Mokolo Rivers, Limpopo Province, South Africa. Global Positioning System (GPS) coordinates in Table 2 were used at each sampling site to record the exact sample collection location as shown in Figure 1 and Figure 2, respectively. The sampling sites were chosen at points on the rivers that were close to anthropogenic activities, so that the impacts of these activities on the two rivers could be assessed. Clean polypropylene bottles were used to collect and store water samples. Water samples for speciation analysis were filtered and stored in the refrigerator at 4 °C. Certain portions of filtered water samples from each site were acidified with 1% (v/v) Suprapur HNO3 for total concentration determination and kept in the refrigerator until analysis.

2.4. Determination of Limit of Detection and Limit of Quantification

Blank reagents were prepared by following similar procedure for total concentration determination of Se and speciation analysis of inorganic Se(IV) in water samples. Blank reagents were analysed by ICP-MS using similar ICP-MS conditions of experiment stated in Table 1. Standard deviations were calculated from the concentration of blank reagents. The limit of detections (LODs) were calculated as three (3) times the standard deviation of the mean of the eight (8) blank reagents and limit of quantifications (LOQs) as ten (10) times the standard deviation of the mean of the eight (8) blank reagents.

2.5. Validation of Methods for the Determination of Total Selenium and Se(IV)

Accuracy for the procedure of the total concentration of Se in water samples was verified using SRM 1643f. The SRMs were prepared the same way as the sample preparation procedures for water samples. The obtained results of the SRMs were compared with the certified values to assess percentage recoveries.
The SPE procedure accuracy was confirmed by using the solution of known concentration of selenium species followed by the percentage recovery studies in triplicate. The mixed standard solutions of 5 µg/L of Se(IV) and Se(VI) were prepared in 100 mL volumetric flask and adjusted with 0.5 M HNO3 and 0.5 M NH4NO3 to a pH 6. The mixed solution of Se(IV) and Se(VI) was then passed through the conditioned column. The Se(IV) was eluted using 15 mL of 0.1 M HNO3 and analysed using the ICP-MS. The percentage recoveries were assessed to confirm the accuracy.

2.6. Total Concentration of Selenium in Water Samples

Acidified water samples were analysed using ICP-MS. The optimum conditions of the experiment for ICP-MS are detailed in Table 1.

2.7. Speciation of Inorganic Selenium

A SPE procedure was achieved using Dowex 1 × 2 resin (chloride form). A 100 mL of water sample with a pH of 6 was passed through conditioned SPE column at a flow rate of 4 mL/min. The inorganic selenium, Se(IV) was retained on the column and eluted with 15 mL of 0.1 M HNO3 at a flow rate of 2 mL/min. The eluted solutions were then analysed by ICP-MS.

3. Results and Discussion

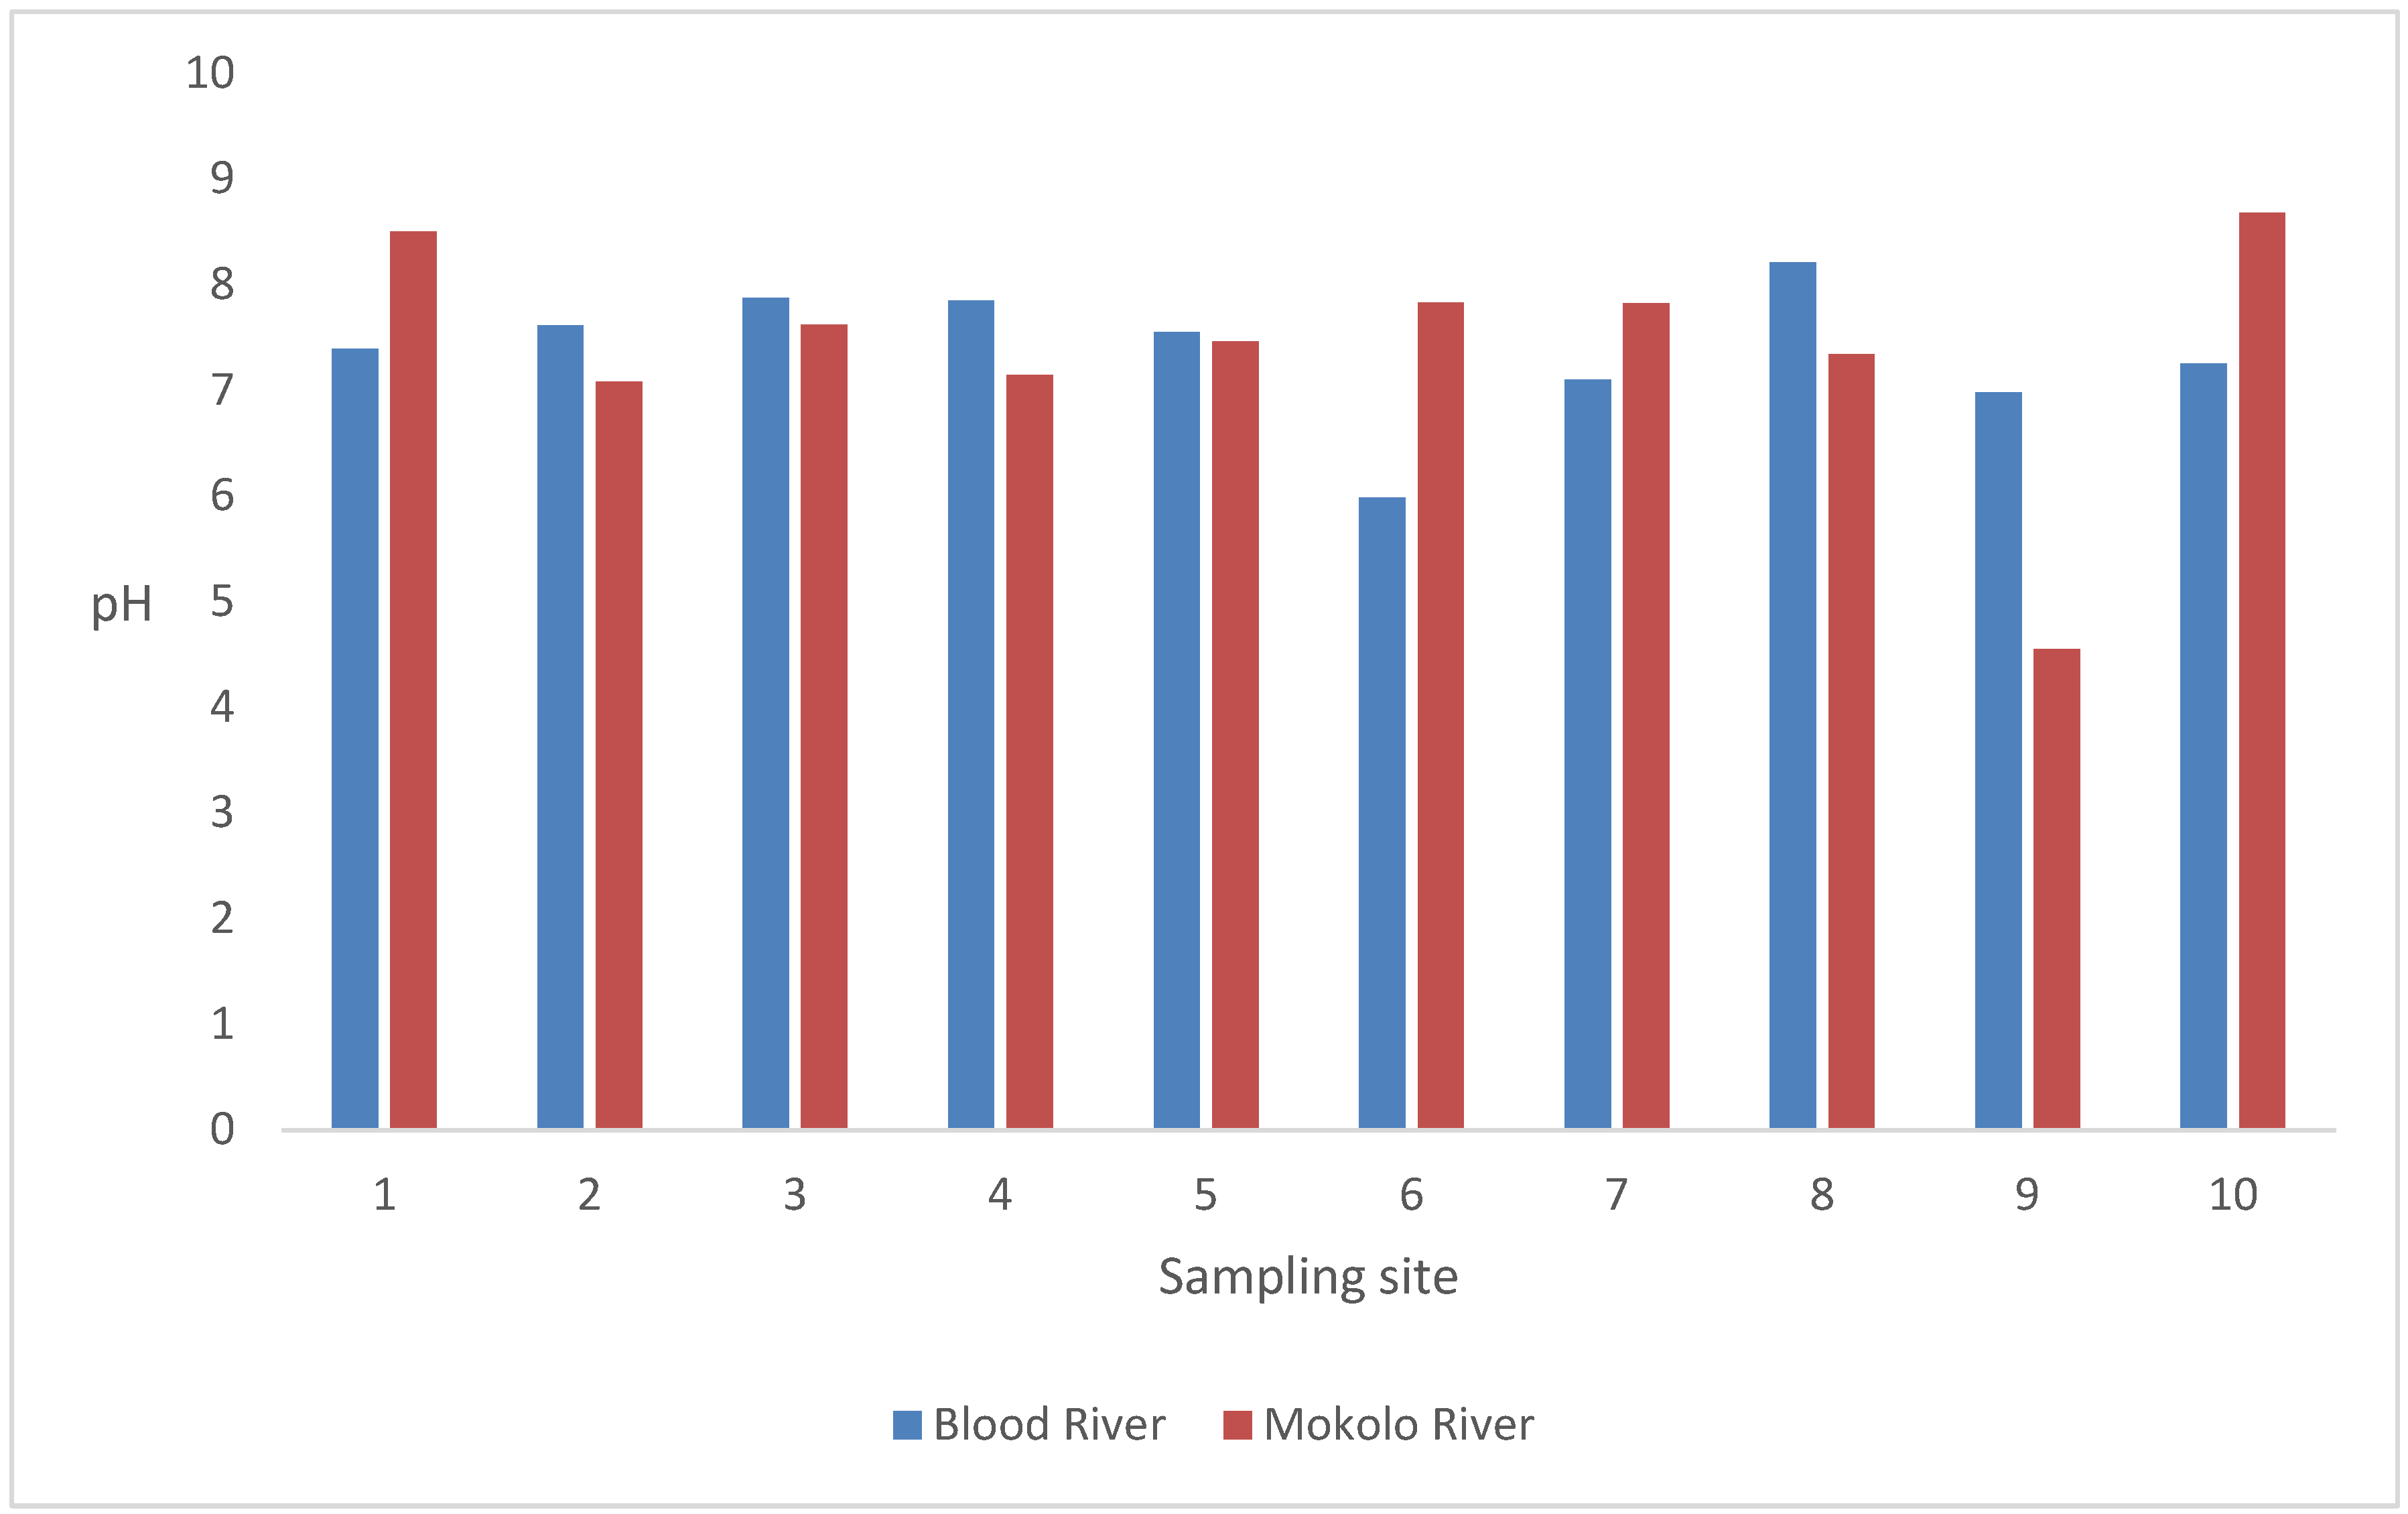
3.1. The pH of Water Samples

Generally, rivers are regarded as open systems where the pH of the water changes regularly. The organisms that depend on river water require adaptive ability or reasonable tolerance to the water pH. Several indicators, including pH measure the quality of river water [20]. The pH level plays an important role in metal toxicity and existence. Solubility of toxic metals increases with the decrease in pH (from surface to depth, from alkaline to acid) [21]. In general, surface water can be acidic or basic depending on the environment. The acceptable pH of surface water ranges from 6.5 to 8.5 [22]. The highest desirable pH level according to Pakistan Council of Research in Water Resources (PCRWR) is 7 to 8.5. The pH of river water may be changed by anthropogenic activities such as acid-mine drainage (AMD), agricultural run-off, fossil fuel emissions, industrial effluent discharge and improper waste management. The lower pH levels can cause water-based organisms like fish to be more vulnerable to diseases [23]. The generally accepted water pH for irrigation is between the range of 6.5 and 8.4 according to the Department of Water Affairs and Forestry (DWAF), South Africa [24].
The low pH value of 5.98 was recorded during this investigation in water sample from Blood River site 6. The low pH value is attributed to stagnant water and possible rock formation. The value is below the normal pH range of the surface water but is acceptable for irrigation water. The measured pH value of 4.55 in water sample from Mokolo River site 9 is below the permitted pH range of 6.5 to 8.4. The low pH is presumably attributed to the river passing through the vicinity of the Grootegeluk Coal Mine. The water from the coal mine is known to be very acidic and it decreases the pH of the river water [25].
The highest pH is observed at site 8 of the Blood River with a pH of 8.21. This may be attributed to a pipe leakage of effluents from Seshego wastewater treatment plant. The pH observed at site 10 of the Mokolo River is 8.68 which is higher than the recommended acceptable limits by DWAF. The water from this site is not recommended for irrigation purposes and not good for consumption. All the other sites were found to exhibit acceptable pH values of between 6.5 and 8.5. Figure 3 shows measured pH values in water samples from Blood and Mokolo Rivers.

3.2. Temperature of Water Samples

The temperature readings were taken from morning to afternoon, from site 1 to site 10. The highest water temperature measured is 28.4 °C from Blood River and the lowest being 19.3 °C from Mokolo River as presented in Table 3. The temperatures of inland waters in South Africa range from 5 to 30 °C [26] and all the recorded water temperatures fall within recommended ranges during the study.
The temperature of water varies from site to site in both rivers. Thus, the temperature is constantly changing sometimes depending on the time of the day. A higher temperature affects a lot of processes like the amount of dissolved oxygen and toxicity of certain elements. Higher temperatures decrease the solubility of dissolved oxygen in water, decreases the concentration of nutrients and its availability to aquatic organisms as it affects the plant’s ability to grow [26].

3.3. Analytical Performance of the Method

Analytical figures of merit such as LODs, LOQs, accuracy, precision and linearity of calibration curves are useful in method validation. These analytical figures of merit show performance characteristics of the speciation of inorganic selenium species and for the determination of total concentration of selenium.

3.3.1. The LODs and LOQs for the Total Determination of Selenium and Speciation of Inorganic Selenium

The LOD and LOQ were obtained from the analysis of the blank reagents prepared similar to the water samples for the determination of total concentration. The blank solution of 1% (v/v) ultra-pure HNO3 solution pure water was prepared. The LOD and LOQ for the determination of total concentration of selenium in water are reported at 0.008 and 0.027 µg/L, respectively. The LOD and LOQ for the speciation analysis of Se(IV) are 0.192 and 0.641 µg/L, respectively. Jitmanee et al. [27] reported LOD of 0.080 µg/L for water samples using ICP-MS. The LOD and LOQ for the total concentration of selenium in water analysis for this study is lower than those reported which may be attributed to different conditions of the experiment.
Lin [28] used the same sorbent material on SPE procedure as in the current study and reported LOD of 0.0056 µg/L for Se(IV). The LOD of Se(IV) for this study is the highest as compared to the reported LOD based on the same method. The higher values might be attributed to the different conditions of the experiment.

3.3.2. Linearity of Calibration Curves for the Total Concentration of Selenium

To determine the relationship between an instrument response and known concentration of the analyte (standards), the simplest regression model (linearity) is used. The linearity is tested using the calibration curve. To obtain a good calibration curve, a series of replicates of the expected range of concentration value for each standard are used including the blank. The coefficient of determination (R2) should be closer to 1 [29] where a minimum of 5 standards are recommended for evaluating the linearity [30].
The linear standard calibration curve used for the determination of the total concentration of selenium is indicated in Figure 4. The calibration curve was obtained using ICP-MS and it is linear with R2 of 0.9999.

3.3.3. Accuracy and Precision of the Analytical Method

The accuracy of the method for the quantification of total concentration of selenium and Se(IV) in water samples were confirmed using SRM for water (SRM 1643f). The accuracy of the method used for the determination of Se(IV) was also evaluated using the solution of known concentration. These method validation solutions were treated the same way as samples to ensure reliability and accuracy of the analytical procedure. The results for the method validation are outlined in Table 4. The precision of the method was assessed by calculating the percentage relative standard deviation (%RSD) of the triplicate run of each sample.
The results showed quantitative percentage recoveries and are consistent with the recommendations of United States Environmental Protection Agency (US EPA) guidelines for method development and validation [31]. The good precision of these procedures was demonstrated by %RSDs of less than 10%, which is within the acceptable range of US EPA suggested %RSDs of less than or equal to 15% for each target analyte to confirm the repeatability of the proposed methods [31].

3.4. Influence of pH on the SPE Procedure for the Determination of Se(IV)

Influence of pH and the percentage recovery studies on SPE method was investigated using 5 µg/L of Se(IV) within the range of 1.0 to 9.0. The 5 µg/L of Se(IV) was loaded on to SPE column containing 3 g of conditioned Dowex 1 × 2 (chloride form) sorbent material. The elution was performed with 0.1 M HNO3. The results are shown in Figure 5. Acceptable percentage recovery was obtained at pH greater than 5 ranging from 87% to 114%. The pH of 6 was selected as optimum pH as it yields an excellent percentage recovery (104%) which is much closer to 100% than other percentage recoveries.

3.5. Determination of Total Selenium in River Water Samples

The total concentrations of Se in the water samples from Blood and Mokolo Rivers are presented in Table 5. Total concentrations of Se in water samples were determined using the validated analytical procedures. The water samples from each site were analysed in triplicates.

3.5.1. Comparison with Maximum Permissible Levels in Drinking and Irrigation Water

Total concentrations of Se detected in water samples collected from Blood and Mokolo Rivers were assessed for safe drinking and irrigation with comparison to the standard guidelines established around the World and within South Africa. The levels of Se in groundwater and surface water range from 0.06 to 400 µg/L [14].
The level of Se in drinking water from the taps for public water supplies around the world are usually much less than 10 µg/L. High concentration of Se was reported in China where the concentration ranges from 50–160 µg/L. This concentration was high due to the soil with high Se concentration [14].
The World Health Organisation (WHO) set a guideline value for Se in drinking water at 0.04 mg/L. The Maximum Contaminant Level Goal and Maximum Contaminant Level for water by EPA 2001c was set at 0.05 mg/L. South African drinking water guidelines has set its water quality range of selenium for domestic use at a range of 0.00–0.02 mg/L. The Target Water Quality Range (TWQR) for aquatic ecosystems in SA is 2 µg/L and while for drinking water is 20 µg/L [32].
All the samples from S1-S10 from both Blood and Mokolo Rivers, indicate concentrations below the MPLs set by WHO which is 40 µg/L [14]. For irrigation water, Se is toxic to plants at a concentration as low as 25 µg/L but the maximum concentrations recommended for Se in irrigation water is 20 µg/L [33]. River water from both rivers is regarded as safe for irrigation and drinking purposes in terms of Se, with the exception of Mokolo River site 9. The concentration of Se at Mokolo River site 9 is 25 g/L, which is more than the recommended value for Se in irrigation water. The higher concentration might be related to sand mining activity at that site. As a result, water at site 9 is not recommended for irrigation. However, the concentrations in most sites were found to be in acceptable range.

3.5.2. Comparison of Selenium Levels in Water from Different Rivers

The concentration of Se in Blood River site 8 was higher than in any other sites in the river. Leaking sewage pipe and illegal dumping of domestic wastes were among the activities observed at site 8 of Blood River, which could be the reason for the highest concentration of Se at this site. The water sample from Mokolo River has a high concentration of Se at site 9 as compared to all other sites within the river. Site 9 of Mokolo River is where sand mining activity is taking place, presumably the reason for the highest concentration detected at this site. Levels of Se in Blood River are slightly higher on average as compared to the sites in Mokolo River. Blood River has many anthropogenic activities taking place compared to Mokolo River, which could contain Se. Blood River has several illegal dumping sites as compared to Mokolo River. Waste material such as broken glasses, building materials, etc. some of which are made from materials containing Se may lead to elevated level of Se concentration when in contact with the river water. A pipe leakage of waste effluent directly run into the Blood River which is expected to cause the concentration of Se to increase. Selenium concentrations at Mokolo River are on average below 1 µg/L except site 9.
The presence of Se may have come from the use of pesticides during agricultural activities taking place around the river. Figure 6 represents graphical total Se concentrations in water from Blood and Mokolo Rivers.
The highest total Se concentration of 2.72 µg/L and 25.4 µg/L were detected at Site 8 and Site 9 of Blood and Mokolo Rivers, respectively. The total concentrations of Se differ from site to site due to variety of factors. The total concentrations of Se in water on this study as compared to other studies done in South Africa are indicated in Table 6.

3.6. Determination of Se(IV) in Water Samples from Blood and Mokolo River

Selenium in water occurs in higher concentration mainly from anthropogenic activities. The Se(IV) occurs naturally in a trace amount but its concentration can increase due to anthropogenic activities. The concentrations of Se(IV) in Blood and Mokolo Rivers are detailed in Table 7. Lin [28] reported low concentration of 0.0168 µg/L when using the same SPE method and GF-AAS for quantification. The difference in Se(IV) concentrations might be due to different environmental conditions. The highest Se(IV) concentration was detected in water samples from site 10 and site 9 from Blood and Mokolo Rivers, respectively. This could be due to illegal dumping sites and sand mining operations around the rivers.
The proportion of Se(IV) to total concentration of Se ranges from 10 to 39% and 15 to 67% in Blood and Mokolo Rivers, respectively. This indicates the presence of low concentrations of Se(IV) in water with reference to total Se concentration. Lin [28] reported a higher percentage of 38 to 52% of Se(IV) as compared to the percentage reported in this study. The highest concentration of Se(IV) was reported by Nyaba et al. [16] in the surface water collected around Soweto area. The concentrations were ranging from 0.631 to 84.0 µg/L. High percentage of Se(IV) as reference to the total concentration of Se was also reported. These percentages are higher than the results of this study. The highest concentration of Se(IV) is obtained at Mokolo River site 9, which is 2.79 µg/L. This concentration could be high due to sand mining around the river. This concentration is relatively higher than the set limit of 2 µg/L inorganic selenium in water [33]. Currently, site 9 of the Mokolo River needs a special attention as far as toxic levels of Se is concerned.

3.7. Comparison of Se(IV) in Water Samples with Maximum Permissible Levels in Drinking and Irrigation Water

Toxic effect thresholds for inorganic Se in water, food-chain organisms, fish and aquatic bird tissues is 2 µg/L. Concentrations of Se(IV) above 2 µg/L has an effect on food-chain bioaccumulation and reproductive failure in fish and wildlife [36,37]. Levels of Se(IV) at all sites in both Blood and Mokolo Rivers fall below 2µg/L except site 9 of Mokolo River. Water sample from site 9 of Mokolo River indicated high potential of Se toxicity and reproductive effects. The water poses a threat to aquatic ecosystem, and it is not fit for irrigation purpose.

4. Conclusions

Pollution has been a great concern in the river systems globally over the years. The state of the rivers deteriorates due to various man-made activities. Blood and Mokolo Rivers are facing challenges of water pollution due to various anthropogenic activities including sand mining, improper waste disposal, direct flow of sewage effluent into the rivers, etc.
In the present study, the pH of the water and levels of total selenium and inorganic selenium, Se(IV) in water were assessed. The measured pH values were within the target water quality range for aquatic ecosystems suggested by the DWAF guidelines [26] with the exception of water sample from site 9 of Mokolo River. The pH of the Mokolo River at site 9 is 4.55, indicating that the water is contaminated and not suitable for drinking and irrigation purposes. The pH range of 4.6 to 8.5 of Mokolo River as compared to the pH range of 6.0 to 8.2 of Blood River indicates that the Mokolo River is more polluted than Blood River. The low pH of the Mokolo River water samples is attributed to sand mining activity and that the river is passing near the Grootegeluk Mine, Matimba and Medupi power stations. It is generally known that mining activities contribute to the water acidity.
Total concentration of selenium and SPE methods were optimised, validated and applied for quantitative analysis of Se and Se(IV) in water. Total concentrations of Se in water were quantified successfully using ICP-MS. The accuracy of the method was confirmed using SRM 1643f. It was found that the levels of selenium were above the recommended MPLs for drinking and irrigation water at Mokolo River site 9. However, total concentration of Se from other sampling sites is less affected by the contaminants flowing into both river systems.
Selective retention and separation of inorganic selenium, Se(IV) in the presence of Se(VI) was achieved successfully by SPE using Dowex 1 × 2 resin (chloride form). The SPE method was also used as a pre-concentration method due to low levels of Se present in water. The findings indicate that Se(IV) was fully separated from Se(VI) using SPE method. A requirement of 2 µg/L has been set by TWQR as toxic effect thresholds for inorganic Se in water, food-chain organisms, fish and aquatic bird tissues. According to the results of this study, the levels of inorganic selenium specie [Se(IV)] in Blood River are relatively low, indicating that the river is not severely contaminated by pollutants from anthropogenic and natural activities. Site 9 of the Mokolo River contains Se(IV) specie levels that are higher than recommended and so not suitable for irrigation or drinking.

Author Contributions

Conceptualization, A.A.A.; Data curation, M.M.M. and A.A.A.; Funding acquisition, A.A.A.; Investigation, M.M.M. and A.A.A.; Project administration, R.M.M. and A.A.A.; Resources, A.A.A.; Supervision, R.M.M. and A.A.A.; Writing—original draft, M.M.M.; Writing—review & editing, R.M.M. and A.A.A. All authors have read and agreed to the published version of the manuscript.

Funding

This work is based on research supported by the Water Research Commission (WRC) of South Africa Project Number [K5/2515//1].

Data Availability Statement

All the data used in this study have been reported in the manuscript.

Acknowledgments

The authors acknowledge the support from Department of Chemistry, University of Limpopo and the University of Johannesburg Department of Chemical Sciences, Research Centre for Synthesis and Catalysis and Spectrum for the facility.

Conflicts of Interest

The authors declare no conflict of interest.

References

  1. Simonovic, S.P.; Breach, P.A. The role of water supply development in the earth system. Water 2020, 12, 3349. [Google Scholar] [CrossRef]
  2. Chigor, V.N.; Sibanda, T.; Okoh, A.I. Studies on the bacteriological qualities of the Buffalo River and three source water dams along its course in the Eastern Cape Province of South Africa. Environ. Sci. Pollut. Res. 2013, 20, 4125–4136. [Google Scholar] [CrossRef] [PubMed] [Green Version]
  3. Gemmell, M.E.; Schmidt, S. Microbiological assessment of river water used for the irrigation of fresh produce in a sub-urban community in Sobantu, South Africa. Food Res. Int. 2012, 47, 300–305. [Google Scholar] [CrossRef]
  4. Momba, M.N.; Kaleni, P. Regrowth and survival of indicator microorganisms on the surfaces of household containers used for the storage of drinking water in rural communities of South Africa. Water Res. 2002, 36, 3023–3028. [Google Scholar] [CrossRef] [PubMed]
  5. UN Water. Water a Shared Responsibility. 2006. Available online: http://unesdoc.unesco.org/images/0014/001454/145405e.pdf#page=519 (accessed on 5 November 2022).
  6. Musingafi, M.C.C. Fresh water sources pollution: A human related threat to fresh water security in South Africa. J. Public Policy Gov. 2014, 1, 72–81. [Google Scholar]
  7. He, Y.; Xiang, Y.; Zhou, Y.; Yang, Y.; Zhang, J.; Huang, H.; Shang, C.; Luo, L.; Gao, J.; Tang, L. Selenium contamination, consequences and remediation techniques in water and soils: A review. Environ. Res. 2018, 164, 288–301. [Google Scholar] [CrossRef]
  8. Camara, C.; Cobo, M.G.; Palacios, M.A.; Mu, R.; Donard, O.F.X. 10. Selenium speciation analyses in water and sediment matrices. In Techniques and Instrumentation in Analytical Chemistry; Elsevier: Amsterdam, The Netherlands, 1995; Volume 17, pp. 235–262. [Google Scholar]
  9. Pyrzyńska, K. Speciation of selenium compounds. Anal. Sci. 1998, 14, 479–483. [Google Scholar] [CrossRef] [Green Version]
  10. Zhang, Y.; Chen, B.; Wu, S.; He, M.; Hu, B. Graphene oxide—TiO2 composite solid phase extraction combined with graphite furnace atomic absorption spectrometry for the speciation of inorganic selenium in water samples. Talanta 2016, 154, 474–480. [Google Scholar] [CrossRef] [PubMed] [Green Version]
  11. Zhang, H.; Feng, X.; Larssen, T. Selenium speciation, distribution, and transport in a river catchment affected by mercury mining and smelting in Wanshan, China. Appl. Geochem. 2014, 40, 1–10. [Google Scholar] [CrossRef]
  12. Latorre, C.H.; García, J.B.; Martín, S.G.; Crecente, R.P. Solid phase extraction for the speciation and preconcentration of inorganic selenium in water samples: A review. Anal. Chim. Acta 2013, 804, 37–49. [Google Scholar] [CrossRef] [PubMed]
  13. Najafi, N.M.; Seidi, S.; Alizadeh, R.; Tavakoli, H. Inorganic selenium speciation in environmental samples using selective electrodeposition coupled with electrothermal atomic absorption spectrometry. Spectrochim. Acta Part B At. Spectrosc. 2010, 65, 334–339. [Google Scholar] [CrossRef]
  14. World Health Organization. Selenium in Drinking-Water; WHO Guidelines for Drinking-Water Quality, WHO/HSE/WSH/10.01/14; World Health Organization: Geneva, Switzerland, 2011. [Google Scholar]
  15. Torres, J.; Pintos, V.; Gonzatto, L.; Domínguez, S.; Kremer, C.; Kremer, E. Selenium chemical speciation in natural waters: Protonation and complexation behavior of selenite and selenate in the presence of environmentally relevant cations. Chem. Geol. 2011, 288, 32–38. [Google Scholar] [CrossRef]
  16. Nyaba, L.; Matong, J.M.; Dimpe, K.M.; Nomngongo, P.N. Speciation of inorganic selenium in environmental samples after suspended dispersive solid phase microextraction combined with inductively coupled plasma spectrometric determination. Talanta 2016, 159, 174–180. [Google Scholar] [CrossRef]
  17. Valencia, M.C.; Nicolas, E.A.; Capitan-Vallvey, L.F. Speciation of selenium (IV) in natural waters by solid phase spectrophotometry. Talanta 1999, 49, 915–921. [Google Scholar] [CrossRef] [Green Version]
  18. Tadayon, F.; Mehrandoost, S. Taguchi method approach on preconcentration and speciation of trace amounts of inorganic and organic selenium in mushroom samples with cloud point extraction and UV-Vis spectrophotomety. Acad. Res. Int. 2014, 5, 15. [Google Scholar]
  19. B’hymer, C.; Caruso, J.A. Selenium speciation analysis using inductively coupled plasma-mass spectrometry. J. Chromatogr. A 2006, 1114, 1–20. [Google Scholar] [CrossRef]
  20. Radulescu, C.; Dulama, I.D.; Stihi, C.; Ionita, I.; Chilian, A.; Necula, C.; Chelarescu, E.D. Determination of heavy metal levels in water and therapeutic mud by atomic absorption spectrometry. J. Phys. 2014, 59, 1057. [Google Scholar]
  21. Saalidong, B.M.; Aram, S.A.; Out, S.; Lartey, P.O. Examining the dynamics of the relationship between water pH and water quality parameters in ground and surface water systems. PLoS ONE 2022, 17, e0262117. [Google Scholar] [CrossRef]
  22. Water Research Center. 2015–2021. Available online: https://www.knowyourh2o.com/indoor-4/the-ph-of-water (accessed on 5 November 2022).
  23. Pansu, M.; Gautheyrou, J. pH measurement; Springer: Berlin/Heidelberg, Germany, 2006; pp. 551–579. [Google Scholar]
  24. Department of Water Affairs and Forestry (DWAF). Agricultural Water Use, Irrigation. In South African Water Quality Guidelines, 2nd ed.; CSIR Environmental Services: Pretoria, South Africa, 1996; Volume 4. [Google Scholar]
  25. Chen, A.; Lin, C.; Lu, W.; Wu, Y.; Ma, Y.; Li, J.; Zhu, L. Well water contaminated by acidic mine water from Dabaoshan Mine, South China: Chemistry and toxicity. Chemosphere 2007, 70, 248–255. [Google Scholar] [CrossRef] [PubMed] [Green Version]
  26. Department of Water Affairs and Forestry (DWAF). Aquatic Ecosystems. In South African Water Quality Guidelines, 2nd ed.; CSIR Environmental Services: Pretoria, South Africa, 1996; Volume 7. [Google Scholar]
  27. Jitmanee, K.; Teshima, N.; Sakai, T.; Grudpan, K. DRC™ ICP-MS coupled with automated flow injection system with anion exchange minicolumns for determination of selenium compounds in water samples. Talanta 2007, 73, 352–357. [Google Scholar] [CrossRef]
  28. Lin, T.S. Inorganic selenium speciation in groundwaters by solid phase extraction on Dowex 1X2. J. Hazard. Mater. 2007, 149, 80–85. [Google Scholar] [CrossRef]
  29. Moosavi, S.M.; Ghassabian, S. Linearity of calibration curves for analytical methods: A review of criteria for assessment of method reliability. In Calibration and Validation of Analytical Methods: A Sampling of Current Approaches; IntechOpen: London, UK, 2018; pp. 109–127. [Google Scholar]
  30. Chandran, S.; Singh, R.S.P. Comparison of various international guidelines for analytical method validation. Die Pharm.-Int. J. Pharm. Sci. 2007, 62, 4–14. [Google Scholar]
  31. US EPA. Contract Laboratory Program for National Functional Guidelines for Inorganic Data Review; National Service Center for Environmental Publications (NSCEP): Washington, DC, USA, 2010. [Google Scholar]
  32. Mathebula, B. Assessment of the Surface Water Quality of the Main Rivers Feeding at Katse Dam Lesotho. Ph.D. Thesis, University of Pretoria, Pretoria, South Africa, 2016. [Google Scholar]
  33. Gupta, M.; Gupta, S. An overview of selenium uptake, metabolism, and toxicity in plants. Front. Plant Sci. 2017, 7, 2074. [Google Scholar] [CrossRef] [Green Version]
  34. Gilbert, B.M.; Avenant-Oldewage, A. Arsenic, chromium, copper, iron, manganese, lead, selenium and zinc in the tissues of the largemouth yellowish, Labeobarbuskimberleyensis (Gilchrist and Thompson, 1913), from the Vaal Dam, South Africa, and associated consumption risks. Water SA 2014, 40, 739–748. [Google Scholar] [CrossRef] [Green Version]
  35. Greenfield, R.; Van Vuren, J.H.J.; Wepener, V. Heavy metal concentrations in the water of the Nyl River system, South Africa. Afr. J. Aquat. Sci. 2012, 37, 219–224. [Google Scholar] [CrossRef]
  36. Parkman, H.; Hultberg, H. Occurrence and Effects of Selenium in the Environment-A Literature Review; IVL Report B 1486; Swedish Environmental Research Institute: Stockholm, Sweden, 2002. [Google Scholar]
  37. Lemly, A.D. Guidelines for evaluating selenium data from aquatic monitoring and assessment studies. Environ. Monit. Assess. 1993, 28, 83–100. [Google Scholar] [CrossRef]
Figure 1. The Map showing Blood River sampling sites.
Water 15 02679 g001
Figure 2. The Map showing Mokolo River sampling sites.
Water 15 02679 g002
Figure 3. pH of water samples from the two rivers.
Water 15 02679 g003
Figure 4. Calibration curve used for the determination of the total concentration of selenium.
Water 15 02679 g004
Figure 5. Effect of sample pH on the percentage recovery of Se(IV) using the Dowex 1 × 2 (Chloride form) in SPE.
Water 15 02679 g005
Figure 6. Graphical representation of selenium levels in the two rivers.
Water 15 02679 g006
Table 1. The ICP-MS operating conditions.
ParametersSettings
Nebulizer gas flow1.0 L/min
Auxiliary gas flow1.2 L/min
Plasma gas flow14 L/min
ICP RF Power1400 V
Lens voltage10 V
Analogue Stage Voltage−2550 V
Pulse Stage Voltage1050 V
Torch box temperature30 °C
Cooling system
1 Main water temperature18.0 °C
2 Interface water temperature32.6 °C
Table 2. GPS coordinates for Blood and Mokolo Rivers.
SitesBlood RiverMokolo River
LatitudesLongitudesLatitudesLongitudes
1−23.85138429.357036−23.64820627.762074
2−23.83466729.377833−23.65011927.760373
3−23.83239329.37875−23.65238027.759355
4−23.83192829.380566−23.65640527.757581
5−23.82795829.388218−23.68457627.748081
6−23.82543429.400748−23.68841727.745652
7−23.82500029.403803−23.69137827.744676
8−23.8256329.40909423.69707427.742127
9−23.82288529.4108323.70190727.742141
10−23.82472429.41766323.70789327.743858
Table 3. Water samples temperatures from Blood and Mokolo Rivers.
Temperature (°C)Site1Site 2Site 3Site 4Site 5Site 6Site 7Site 8Site9 Site 10
Blood River21.921.523.923.923.924.424.927.227.628.4
Mokolo River23.921.921.322.622.819.324.725.823.122.9
Table 4. Validation of analytical procedures for total concentration of selenium and Se(IV) in water samples.
Using SRM 1643fUsing a Solution of Known Concentration
AnalyteSeSe(IV)Se(IV)
Measured value10.39.045.18
Certified value11.711.75.00
Percentage recovery88.177104
Table 5. Total concentrations of selenium (µg/L) in water samples from Blood and Mokolo Rivers.
Mean Se Concentration (µg/L)
Sampling SiteBlood RiverMokolo RiverStandard Guidelines Se (µg/L)
11.14 ± 0.0700.309 ± 0.012
21.03 ± 0.1400.159 ± 0.0090
30.629 ± 0.0610.297 ± 0.0030
40.678 ± 0.0311.02 ± 0.031
50.563 ± 0.0300.115 ± 0.0030
60.0682 ± 0.0200.109 ± 0.0070
71.77 ± 0.0500.085 ± 0.003040 (World Health Organization) [32]
82.72 ± 0.0200.113 ± 0.01250 (Environmental Protection Agency) [32]
91.48 ± 0.05025.4 ± 0.312 (South African Target Water Quality
100.135 ± 0.0500.275 ± 0.021Range) [32]
Table 6. Comparison of selenium levels in water of some rivers in South Africa.
RiverSe (µg/L)References
Vaal Dam<0.253[34]
Nyl River(2.00–6.17)[35]
Blood River(0.068–2.724)(Current study)
Mokolo River(0.085–25.405)(Current study)
Table 7. The concentrations (µg/L) of total selenium, Se(IV) and %Se(IV) in water samples from Blood and Mokolo Rivers.
Blood River Mokolo River
SiteSe(IV)
(µg/L)
Total Se
(µg/L)
%Se(IV)Se(IV)
(µg/L)
Total Se
(µg/L)
%Se(IV)Standard Guideline
Se(IV), µg/L
10.323 ± 0.00911.29 ± 0.070250.157 ± 0.0181.02 ± 0.01215
20.434 ± 0.00711.39 ± 0.014310.280 ± 0.0100.974 ± 0.009029
30.193 ± 0.0170.717 ± 0.061270.619 ± 0.0151.72 ± 0.005036
40.0512 ± 0.0100.526 ± 0.031100.590 ± 0.0272.93 ± 0.03120
50.163 ± 0.0120.664 ± 0.030240.174 ± 0.0130.523 ± 0.003033
60.0411 ± 0.00120.122 ± 0.020340.216 ± 0.00410.488 ± 0.007044
70.385 ± 0.0101.73 ± 0.050220.135 ± 0.0120.302 ± 0.003045
80.333 ± 0.00712.09 ± 0.020150.178 ± 0.00710.699 ± 0.012252 (South African
Target Water
Quality Range) [32]
90.358 ± 0.0201.57 ± 0.020232.79 ± 0.01317.6 ± 0.3116
100.820 ± 0.0502.11 ± 0.050390.196 ± 0.00120.292 ± 0.02167
Disclaimer/Publisher’s Note: The statements, opinions and data contained in all publications are solely those of the individual author(s) and contributor(s) and not of MDPI and/or the editor(s). MDPI and/or the editor(s) disclaim responsibility for any injury to people or property resulting from any ideas, methods, instructions or products referred to in the content.

