Article

Identification of Sedimentary Environments through Dynamic Image Analysis of the Particle Morphology of Beach Sediments on the East and West Coasts of Hainan Island in South China

1
State Key Laboratory of Estuarine and Coastal Research, East China Normal University, Shanghai 200241, China
2
College of Harbour and Coastal Engineering, Jimei University, Xiamen 361021, China
3
Laboratory of Ocean and Coast Geology, Third Institute of Oceanography, Ministry of Natural Resources, Xiamen 361021, China
*
Author to whom correspondence should be addressed.
Water 2023, 15(15), 2680; https://doi.org/10.3390/w15152680
Submission received: 6 June 2023 / Revised: 21 July 2023 / Accepted: 22 July 2023 / Published: 25 July 2023

Abstract

:
Particle morphology is an important feature of sediments that reflects their transport history and depositional environment. In this study, we used dynamic image analysis (DIA) to measure the size and shape of beach sediments on the east and west coasts of Hainan Island in South China Sea. DIA is a fast and accurate method that can capture and analyze a large number of sediment particles in real-time. We extracted morphological descriptors of each particle, such as equivalent diameter, sphericity, aspect ratio and symmetry, and their distributions based on volume and number. We performed multivariate analysis on the particle morphological data, including alpha diversity, statistical analysis and fingerprint techniques. We found that the Shannon index, calculated by the number distribution of sediment particle morphology, can effectively discriminate between the two sites, reflecting different sediment sources, transport processes and depositional conditions. We also established a composite fingerprint based on seven morphological parameters and diversity indices, which can accurately distinguish between aeolian and hydraulic sedimentary environments. Our study demonstrates the potential application of DIA in identifying sedimentary environments and establishing sediment fingerprints. This can help us understand the sediment transport processes and depositional mechanisms in coastal areas.

1. Introduction

Particle morphology is an essential feature of solid particles, determining most of their properties [1,2] and can provide information regarding sediment transport history and sedimentary environment [3]. Particle size, as one of the basic properties of sediment particles, has been widely used to describe sedimentary environments and sediment transportation [4,5,6,7]. Particle shape is an important variable of sediment transport mechanics [8], representing fluid medium and distance and intensity of movement. As transport distance increases, collision frequency among particles and between particles and bed increases, causing sediment particles to become more rounded. Field observations and laboratory experiments have confirmed that particles gradually become rounded with increasing transport distance [9,10,11]. The shape of particles in natural sediments as an important characteristic has been widely used in powder mechanics [12], soils [13,14], geology [15,16], volcanology [17,18] and sedimentology [19]. In geomorphology, studying particle shape, especially sandy particle shape, can help identify sediment source, transport processes and sedimentary environment [20]. Different transport media have varying sorting and abrasion effects on sediment particle morphology, resulting in macroscopic and microscopic differences in sediment particle morphology [21]. Studies on sediment particle shape of beaches, rivers, aeolian dunes and glaciers have shown that intensity and efficiency of selective sorting vary greatly in these environments with some particle shape parameters being important for identifying different sedimentary environments [22,23,24]. Sediment particle morphology changes in various ways through different transport processes. These sediment particle size and shape characteristics can be used alone or in combination to distinguish sedimentary facies, provide evidence about the history of sediment transport, and describe the sedimentary environment [25,26]. Therefore, comprehensive analysis of large datasets of sediment particle size and shape parameters, as well as characterization and quantification, provides a research method for better identification of sedimentary environments and recognizes the importance of particle morphology. Measurement methods of sediment particle shape include traditional manual counting method, scanning electron microscopy (SEM) [27,28], and X-ray [29]. However, these methods are often tedious, time consuming, and operator-dependent [30], and limited in the number of particles. In recent years, with advancement in computing power and image analysis technology, shape analysis has received new emphasis [31]. Sediment particle morphology measurement technology has developed into an imaging method that can be divided into static image analysis (SIA) [32] and dynamic image analysis (DIA) [7,33]. DIA enables rapid characterization of the particle morphology of silt and sand-sized clastic sediments. High-speed image sensors enable acquisition of a large number of images and analysis of a large number of sedimentary particles within a few minutes. DIA has significant advantages in terms of measurement speed, accuracy, and quantity [34].
The characterization and quantification of particle morphology are crucial steps in determining the physical properties of particles. Many quantitative methods have been proposed to obtain two-dimensional or three-dimensional images based on image method. The Fourier method analyzes particle images to quantify shape, surface texture, angularity parameters, and Fourier shape coefficient with some research results obtained [28,35,36]. Although Tunwal et al. [37] developed an image analysis software tool aimed at sedimentology where fine details of particle boundaries are required, the Fourier series method is very cumbersome because it requires analysis of a large number of particle image data. However, this method is generally based on high-resolution pictures from the static image method and analyzes a limited number of samples. DIA can quickly capture and analyze particles in real-time and obtain abundant particle morphology within a few minutes.
In this study, the morphology of 34 samples from two beaches on the east and west coasts of Hainan Island (China) was analyzed using the automatic particle DIA method. The purposes of our study are (1) to test the applicability of the new instrument for sedimentary environment interpretation using sediment samples; (2) to evaluate difference in volume and number distributions of sediment particle morphology and analyze diversity of particle morphology to identify sedimentary environments; and (3) to establish a fingerprint for beach sediments according to the quantitative sediment particle morphology parameters.

2. Materials and Methods
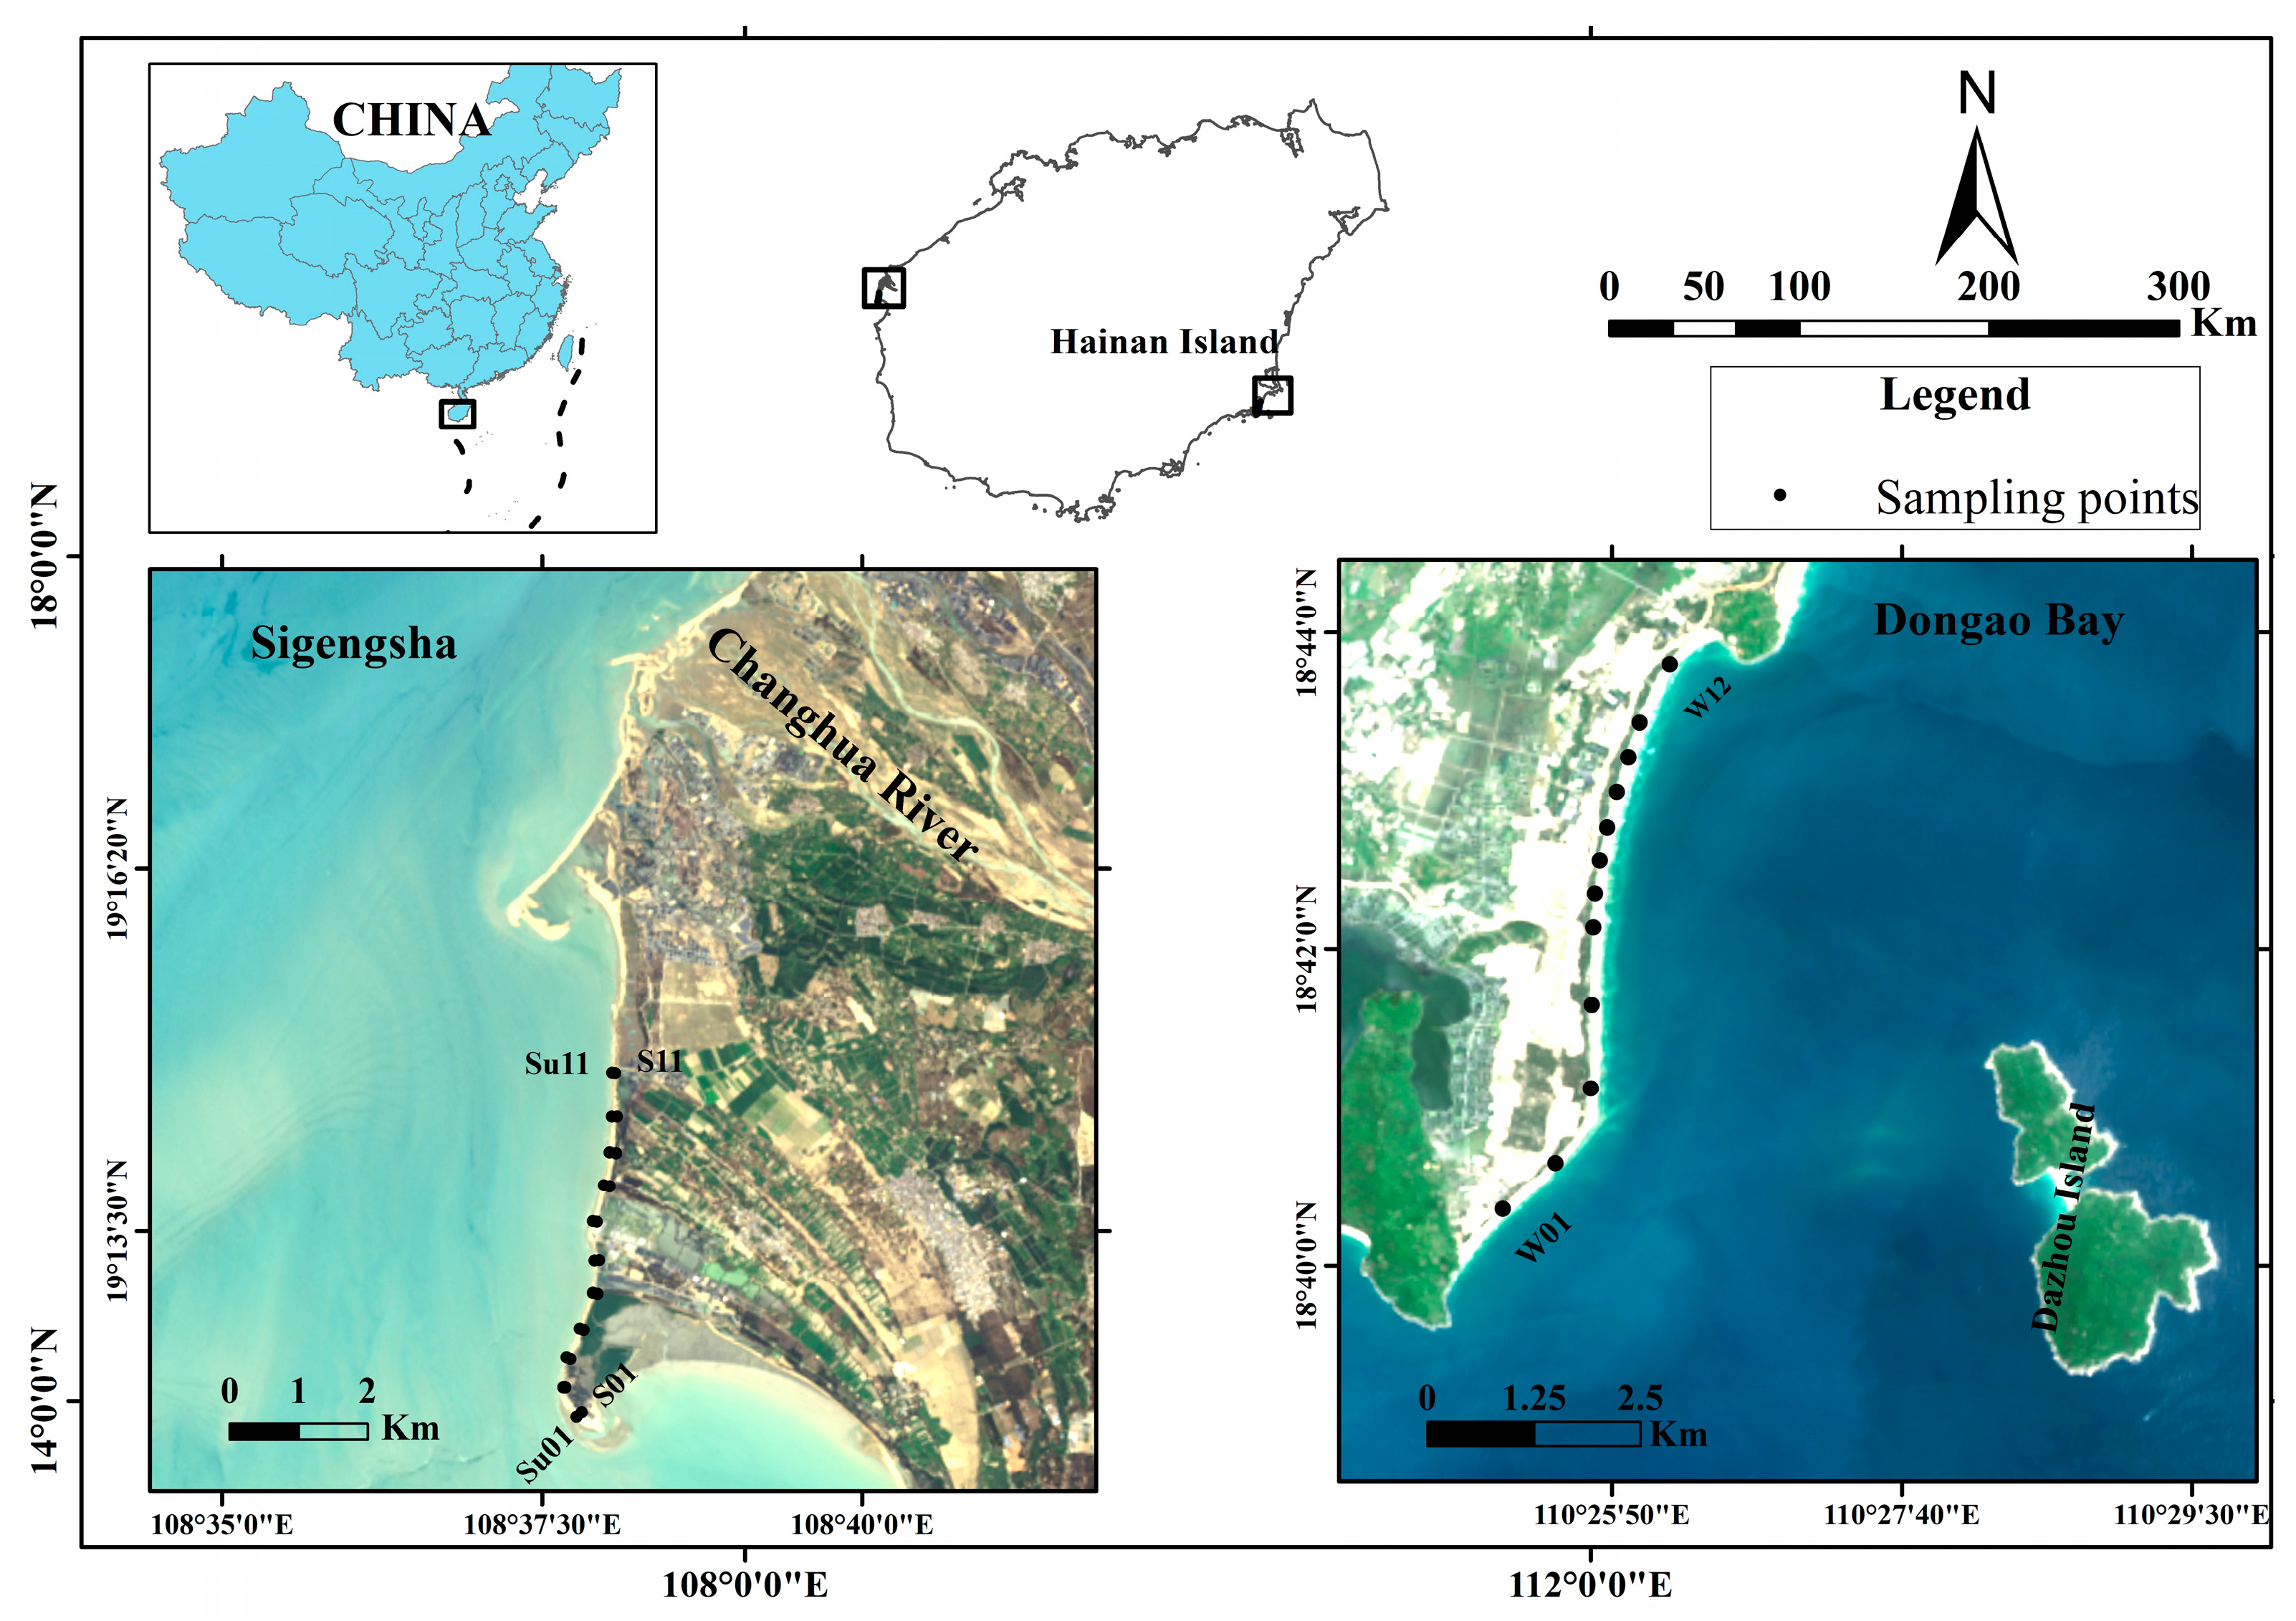
2.1. Study Area

Dong’ao Bay, located east of Hainan Island in the South China Sea, is between 110.415°–110.445° E and 18.666°–18.731° N. Offshore, Dazhou Island leads to a unique shape of the Dong’ao Bay shoreline (Figure 1). The entire Dong’ao Bay is covered by Dazhou Island and the northern headland [38]. Superposition of wind waves and swells is the main form of waves throughout the year accounting for 78%. The annual average wave height is 0.9 m with a maximum wave height of 5.2 m. The average annual tide amplitude is 0.92 m, representing a wave-controlled microtidal coast. In summer, it is humid and rainy. The average wind speed is 3.4 m/s [39].
Sigengsha is located west of Hainan Island, on the southern side of the Changhua River Delta between 108.633°–108.635° E and 19.199°–19.246° N (Figure 1). There is a spit in the southern part of Sigengsha with its primary material source being sediments brought into the sea by the Changhua River, the second largest river in Hainan. The vast majority of Changhua River sediments entering the sea are continuously transported southwestward by NW-directed waves forming a spit. In addition, due to jacking effects of SW-directed wind waves, the spit appears to be curved (Figure 1). Under the combined effects of abundant sediment supply, special terrain conditions, and dynamic marine conditions, the peculiar landform of Sigengsha recurve spit formed. According to the observation data of Dongfang Oceano station, the annual average wave height (H1/10) is 0.6 m and the annual average tidal range is 1.48 m, and the maximum tidal range can reach 3.40 m. This area is the dry climate zone of Hainan Island, with a maximum wind speed up to 16 m/s, and a dry hot wind in the SW direction prevails in summer [35]. Under this dry environment, beach sediments along the coast are susceptible to wind erosion with sediments continuously migrating to backshore. According to field investigation, the beach length exceeds 100 m.

2.2. Sediment Sampling

A total of 12 sampling transects of beach sediments were arranged from south to north along Dong’ao Bay and 11 transactions were arranged from south to north in Sigengsha. Surface sediment samples were collected at the backshore of each transect in August 2015 and are marked as W01–W12 and S01–S11. Additionally, to compare sediment particle morphology of aeolian and underwater environments, surface sediments were collected underwater in each transect of Sigengsha and marked as Su01–Su11 (Figure 1). All samples were packed in ziplock bags. In the laboratory, sediment samples were pretreated with 5 mL 30% H2O2 to remove organics and 5 mL 0.5 mol/L HCL (10 mL if shell fragments were abundant) to remove carbonates. After soaking samples in pure water and allowing them to stand for 12 h, the supernatant was extracted and samples were placed in an oven at 105 °C for 24 h. Finally, samples were analyzed using dynamic imaging technology.

2.3. Dynamic Image Analysis (DIA)

Camsizer-XT (Retsch Technology GmBH, Germany) is a particle size and shape analyzer developed using dynamic digital imaging technology with unique dual lens (CCD) patent technology. The resolution is 1 μm with a measurement range from 10 μm to 8 mm [40]. The two cameras can be used separately or simultaneously to obtain reproducible data results within a wide range of particle sizes. By one-time injection, comprehensive information on particles can be measured simultaneously including particle size, particle number, particle morphology distribution (volume and number based), sphericity, symmetry, aspect ratio, and so on. The measurement processes for Camsizer-XT are as follows: (1) the sample funnel and feeder disperse processed sample and vibrate sample into test chamber; (2) CCD camera captures particles in real-time; (3) dynamic image information captured by complex conversion process is computed; and (4) particle size and shape distribution curves (including volume and number distribution) defined by various particle size diameters are obtained. Calculation results mainly include maximum chord XC perpendicular to measurement direction, equivalent diameter of area equivalent circle of particle projection (Xarea), distance between two tangents placed perpendicular to measurement direction (Feret diameter XFe, the maximum value is XFemax), and length of diameter through center of area in measurement direction (Martin diameter XMa). XCmin refers to particle diameter determined from the smallest of all maximum chords of particle projection, and the value of XCmin is close to the sieve results [41]. Four basic parameters for particle size (M (mean size), stander deviation (SD), skewness (Sk) and kurtosis (Ku)) were calculated according to the moment method of McManus [42] based on particle size volume distribution and number distribution, respectively.
Sphericity is a shape characteristic that can serve as a measurement of particle sphericity. Circumference and area are calculated for each particle with sphericity expressed by the following formula (Equation (1)), where A is the measured area of a particle projection, and U is the measured circumference of a particle projection.
Sphericity = 4 π A U 2
Sphericity values range from 0 to near 1. For a sphere or a circle particle, the sphericity value is 1, in all other cases sphericity is less than 1. This formula is the same as that defined as high sensitivity circularity (HSC) [26] and is one of the most widely used formulas in particle morphology; the formula is also widely used in description sand and gravel morphology in sedimentology [22,43,44].
The aspect ratio is the ratio of the projection width to projection length for particles, ranging from 0 to 1 (Equation (2)). This parameter is a measure of the elongation of the particles [45]. In all other cases, the aspect ratio is ≤1.
Aspect   ratio = X cmin X Femax
Symmetry indicates the symmetry of particles on two-dimensional projection (Equation (3)).
Symm = 1 2 1 + min r 1 r 2
where r1 and r2 are distances from the center of the area to borders in the set measuring direction. “Symm” is the minimum value of symmetry values in all measured directions. Mathematical information: XMa = r1 + r2. For asymmetrical particles, Symm < 1. If the center of the area is outside the particle Symm < 0. The moment method of McManus [42] was used to calculate four basic parameters based on volume and number distribution of particle shape as for particle size. Due to the different sizes of each sample particle, it is difficult to unify the number of each sample. According to instrument standards, it has good representative statistical significance when the number exceeds 0.2 million. The number of sample particles in this experiment was between 1–2.5 million.

2.4. Morphological Diversity Index and Statistical Analysis

Each sediment sample is composed of various particles of different sizes and shapes with different percentages, analogous to a biological community. The species diversity index, with the ability to evaluate the environmental quality, can be applied to indicate the depositional environments for different sediments. Among various indices, Shannon and Simpson indices, also called within-habitat diversity [46], refers to the number of species in a local uniform habitat and can be used here to refer to diversity of the particle morphology in a sample. The Shannon index can measure a variety of particle morphologies with its theoretical basis in communication theory where the main measurement object is order or disorder content of a system [47]. The Simpson index represents the probability that two random individuals sampled from a community belong to different categories and is a dominance index giving more weight to common or dominant classes [48]. The following equations were used to calculate the Shannon and Simpson indices, H and D, respectively.
H = p i × l n ( p i )
D = 1 p i × p i
where p i (%) is the percentage of volume or number in total sample when the morphological descriptor size is i. The Shannon index was used here to refer to diversity of particle morphology in a sample and can reflect the sedimentary environment, material source contribution, transport process, and so on, to a certain extent.
For each of the 34 sediment samples collected, 32 shape and size parameters were calculated for a total of 736 data points. Using statistical methods to understand these data, Pearson correlation coefficient was computed to study correlations among morphology parameters. The Mantel test examines correlations within dissimilarity matrices of two different datasets [49]. Here we use Mantel test to analyze relations among each morphological descriptor (size, sphericity, aspect ratio, and symmetry) distribution parameter and correlation with diversity index. Redundancy analysis (RDA) is a sorting method of regression analysis combined with the principal component analysis, and it is also an extension of the multiresponse regression analysis. RDA is a direct gradient analysis method that can evaluate relationships between one variable or set of variables and another set of multivariate data from a statistical perspective [50]. RDA method was used to understand the relationships between each diversity index and each distribution parameter.
Principal coordinates analysis (PCoA) and cluster analysis were carried out using R software (www.R-project.org, accessed on 5 may 2021) with vegan package [51]. These analyses were performed using volume and number abundance for each morphological descriptor class. PCoA is a visual coordinate that can show similarity or difference in research data. PCoA is a nonconstrained data dimensionality reduction analysis method that can be used to study the similarity or dissimilarity of sample composition. Clustering of samples was achieved using the distance-based modeling based on Bray–Curtis similarity (using the particle size or shape distributions, respectively), estimating similarity between samples and summarizing the main characteristic of datasets [52].

3. Results

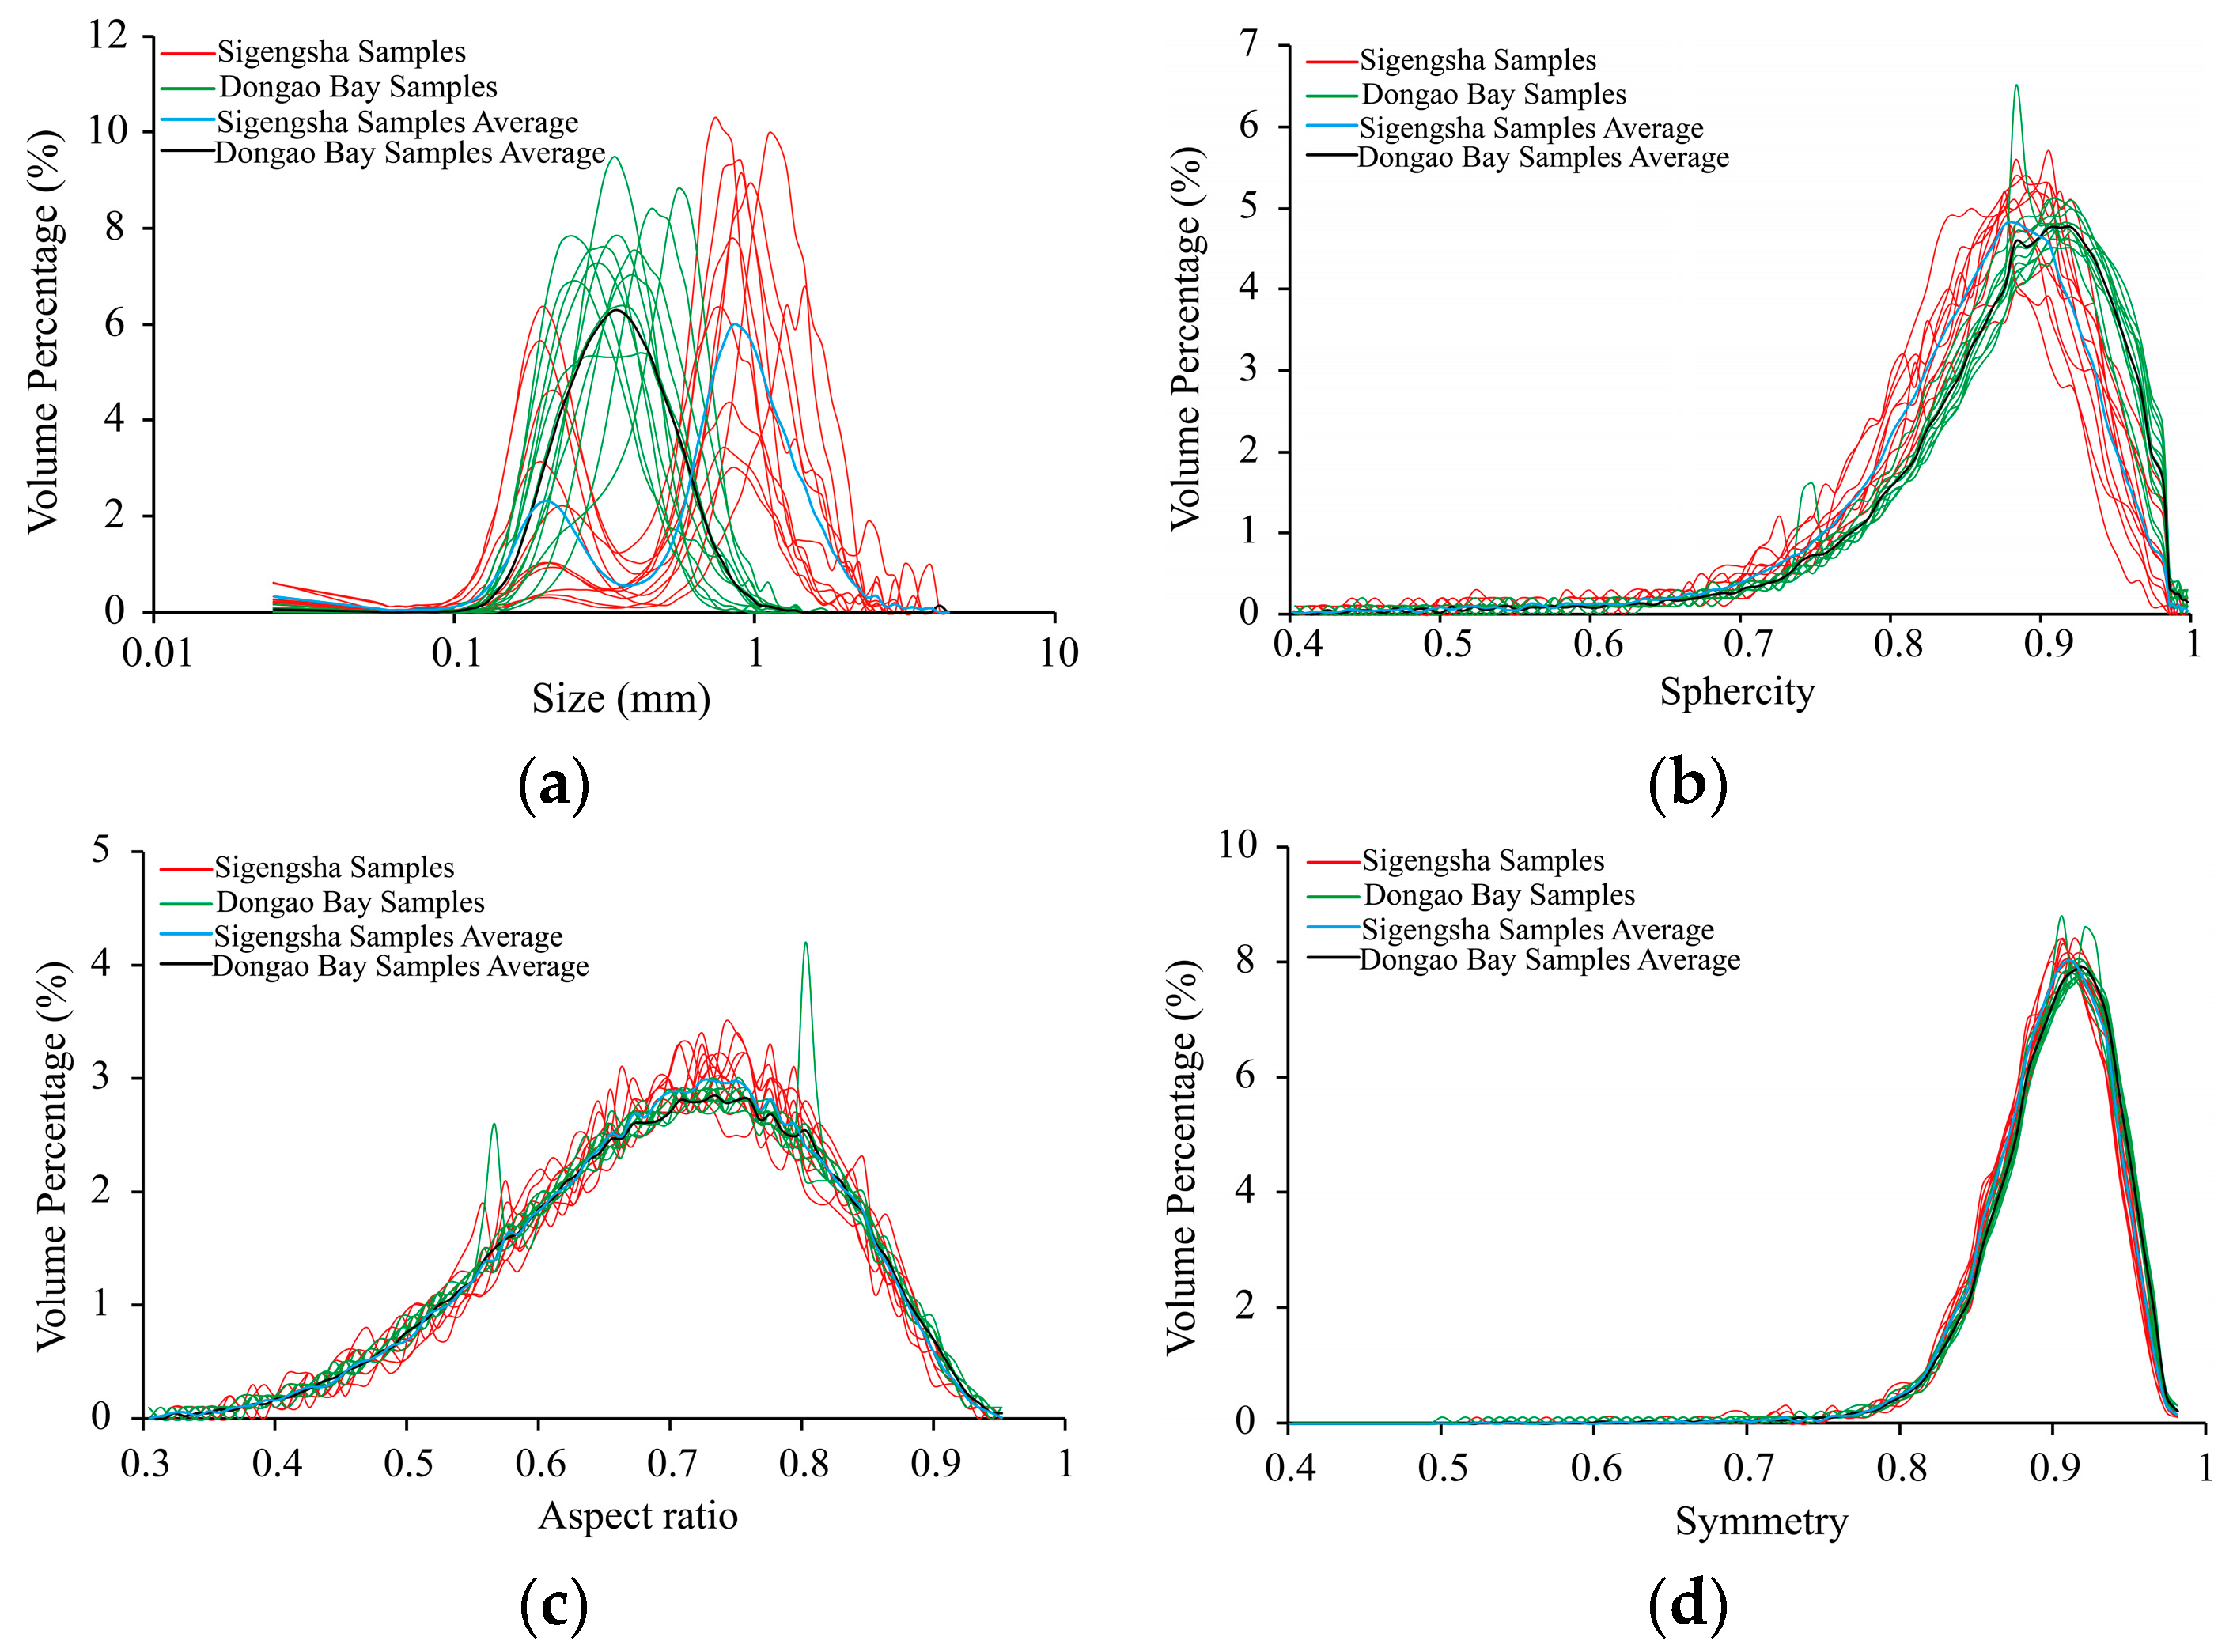
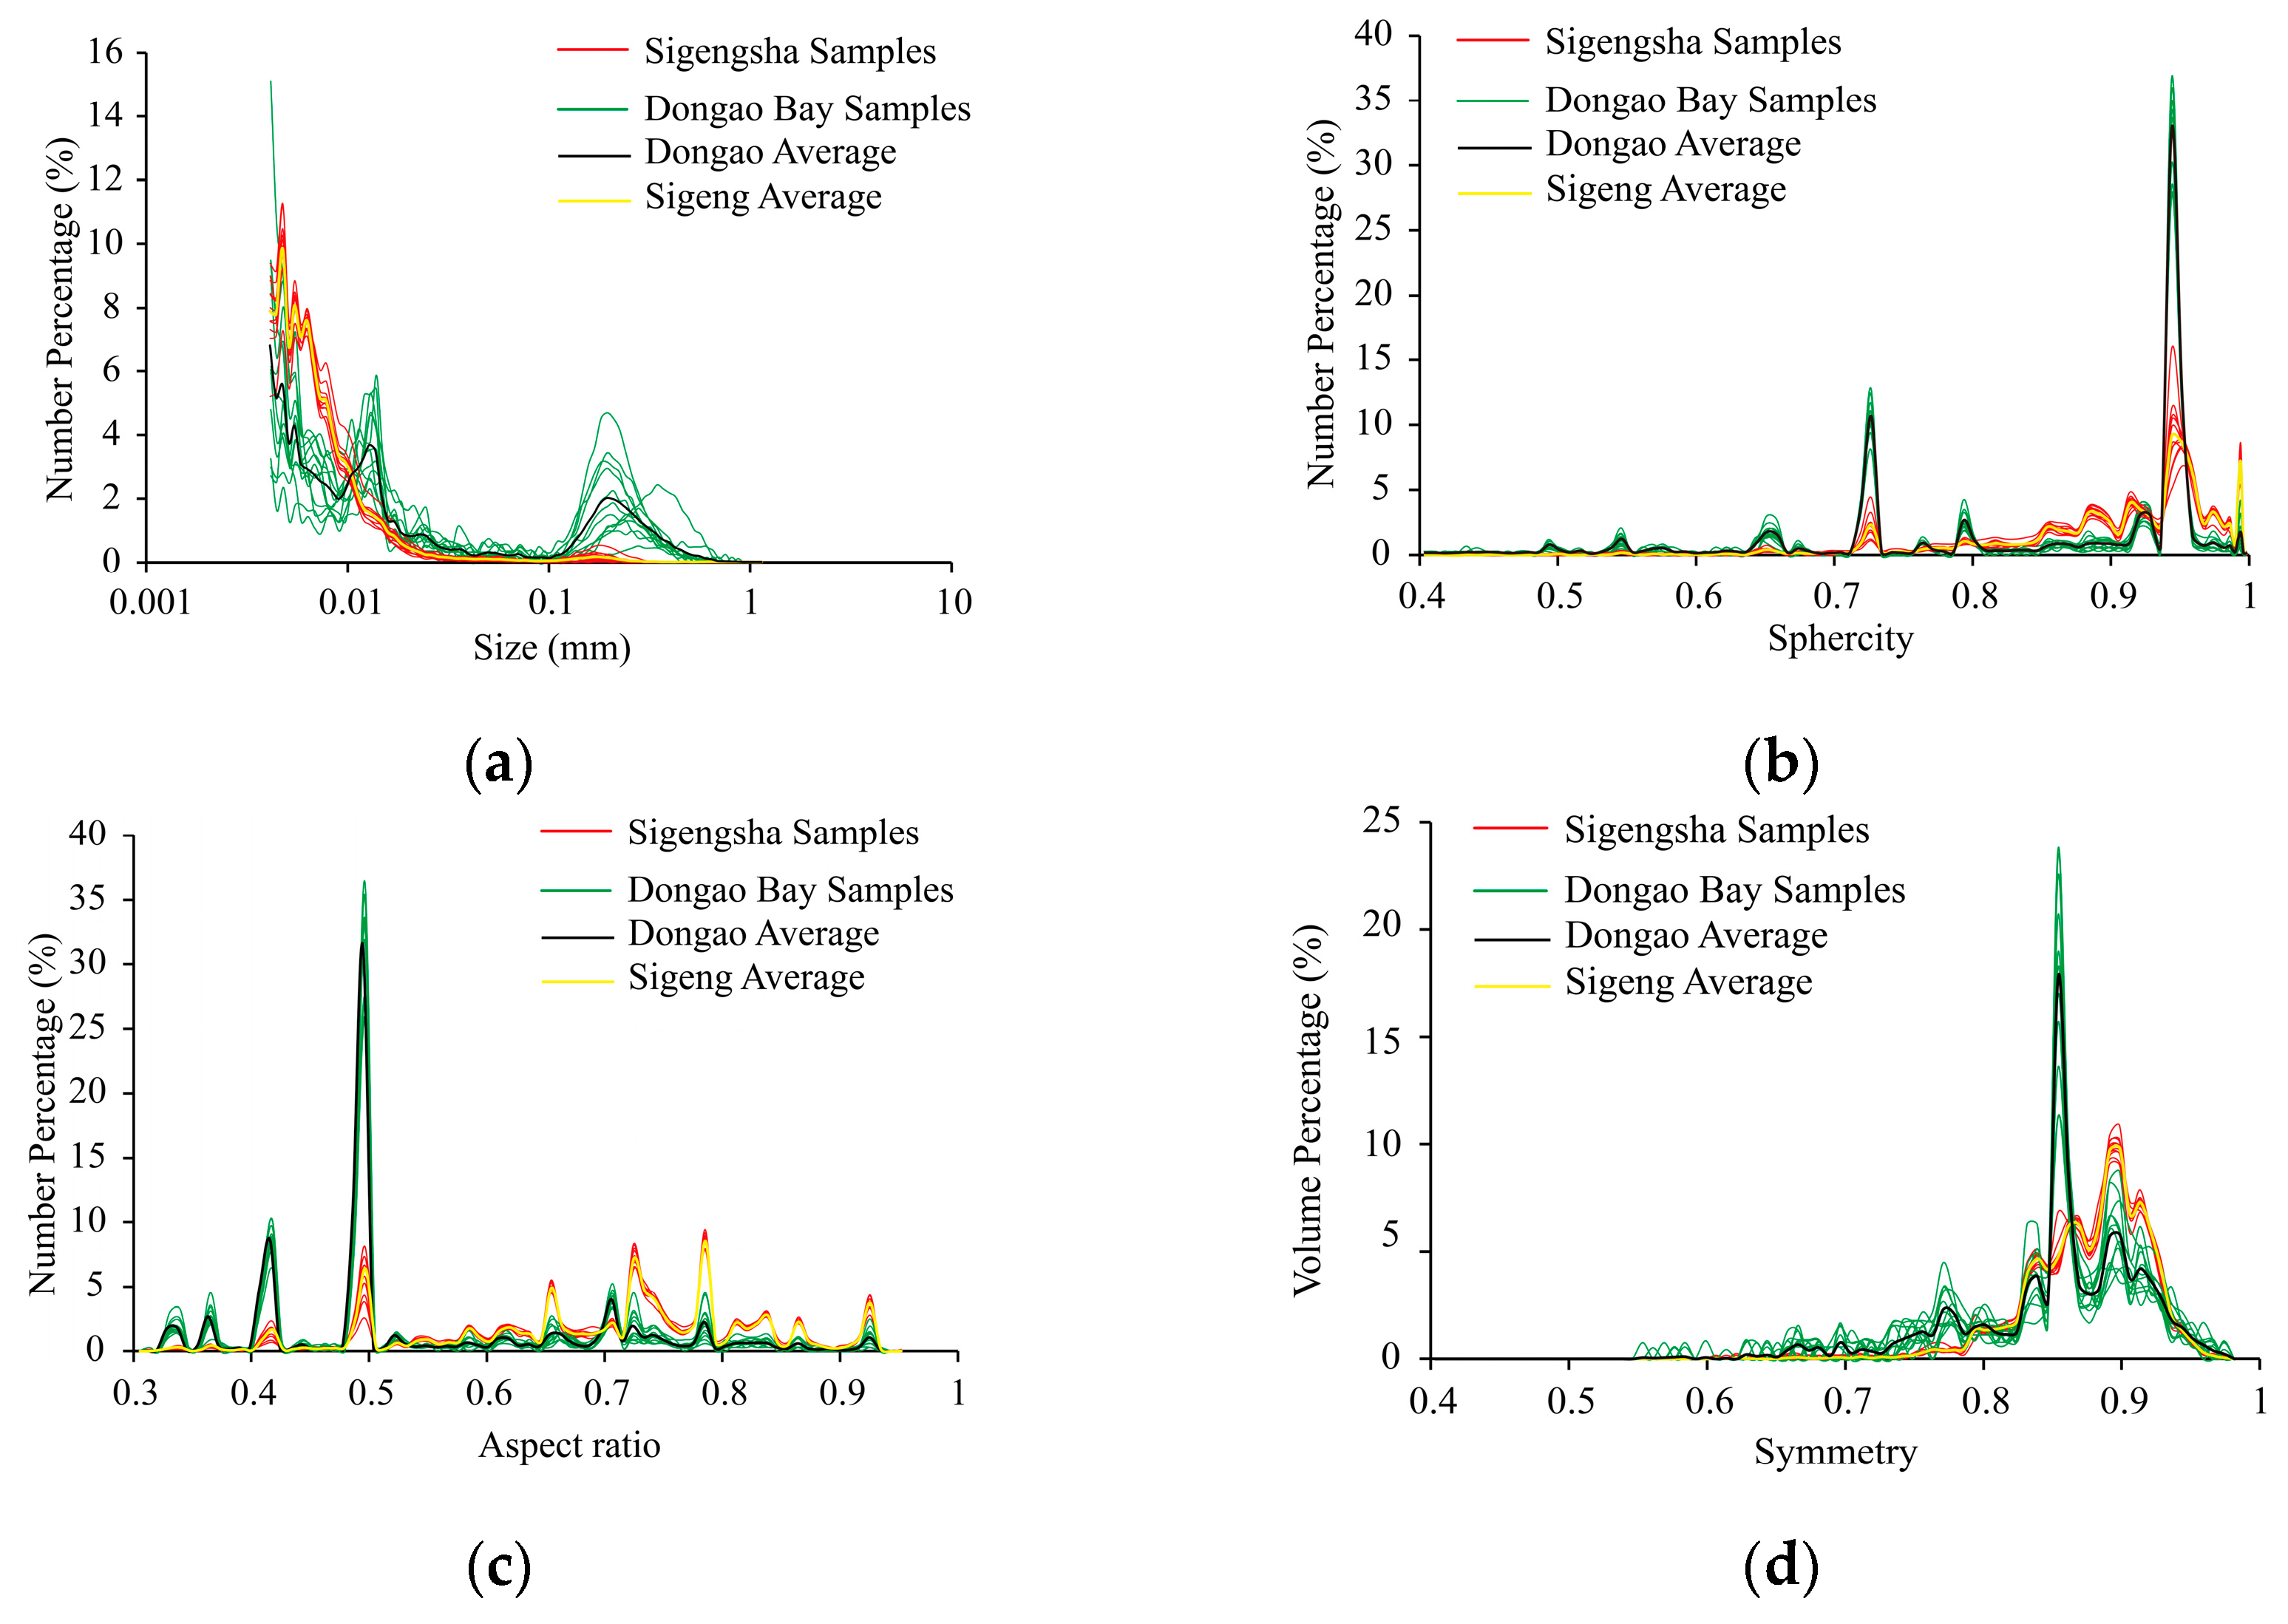
3.1. Morphology Distribution Parameter and Diversity

Figure 2 summarizes the morphology volume distribution characteristics of sediment samples, indicating that the shape factor distribution curves consist of many small peaks while the particle size distribution curves are relatively smooth with one or two main peaks. Particle size distributions (PSDs) were significantly different, with bimodal distribution in Sigengsha and unimodal distribution in Dong’ao Bay samples. Shape factor distribution curves for the two sites were similar, especially the aspect ratio and the symmetry.
Figure 3 provides key information on the location and dispersion of particle morphology parameters and diversity index data. Sample size parameters for Dong’ao Bay were smaller than those for Sigengsha samples. In comparison, the distribution of sediment size parameter data for Sigengsha was more dispersed, consistent with the bimodal character of the distribution curve for the Sigengsha samples (Figure 2). For the sample shape parameters, Dong’ao Bay and Sigengsha samples were similar, with more dispersed parameter distribution for Sigengsha samples. For the diversity index, the size Shannon and Simpson indices based on volume distribution were less than those calculated by number distribution. However, shape Shannon and Simpson indices were the opposite, especially for aspect ratio. The diversity index based on number distribution was more scattered.
Most morphology distribution parameters and diversity indices were interconnected, as inferred from the Pearson correlation analysis (Figure 4). Correlations between the distribution parameters of different morphological descriptors and their diversity indices varied greatly. Additionally, there was a difference in correlation between diversity indices based on number distribution and those calculated based on volume distribution and morphological distribution parameters. For example, particle size Simpson-Num and symmetry Shannon-Num were only relevant to VMD and sphericity kurtosis while the particle size Simpson-Vol and the symmetry Shannon-Vol were related to most morphological distribution parameters (Figure 4). The Mantel test showed that particle size, sphericity and aspect ratio were associated with each other, and the aspect ratio was strongly correlated (p < 0.01) with sphericity (r = 0.924), while symmetry exhibited a relatively independent character (Figure 5). Similarly, the Mantel test indicated that size diversity indices were significantly correlated with the morphology distribution parameters, especially the size parameters (r = 0.883) (Table 1). In contrast, particle shape diversity indices had poor correlation with the morphology distribution parameters, especially symmetry diversity indices which were only related to the particle size distribution parameters (r = 0.126) (Table 1), exhibiting a strong independence characteristic.
RDA showed that eigenvalues for the first axis and the second axis were 0.864 and 0.070, respectively, and correlations between morphology parameters and diversity indices were 0.987 and 0.958, respectively, which accumulatively explained 97.4% of all information (Table 2). The first two axes effectively reflect the relationship between morphology parameters and diversity indices, and were mainly determined by the first axis. Dong’ao Bay and Sigengsha samples were well differentiated in the RDA triplot diagram, showing that Dong’ao Bay samples were distributed in second and third quadrants while Sigengsha samples were distributed in first and fourth quadrants (Figure 6). RDA results showed that sphericity skewness was the most important variable revealing morphological diversity (60.7% explained) (Figure 6).

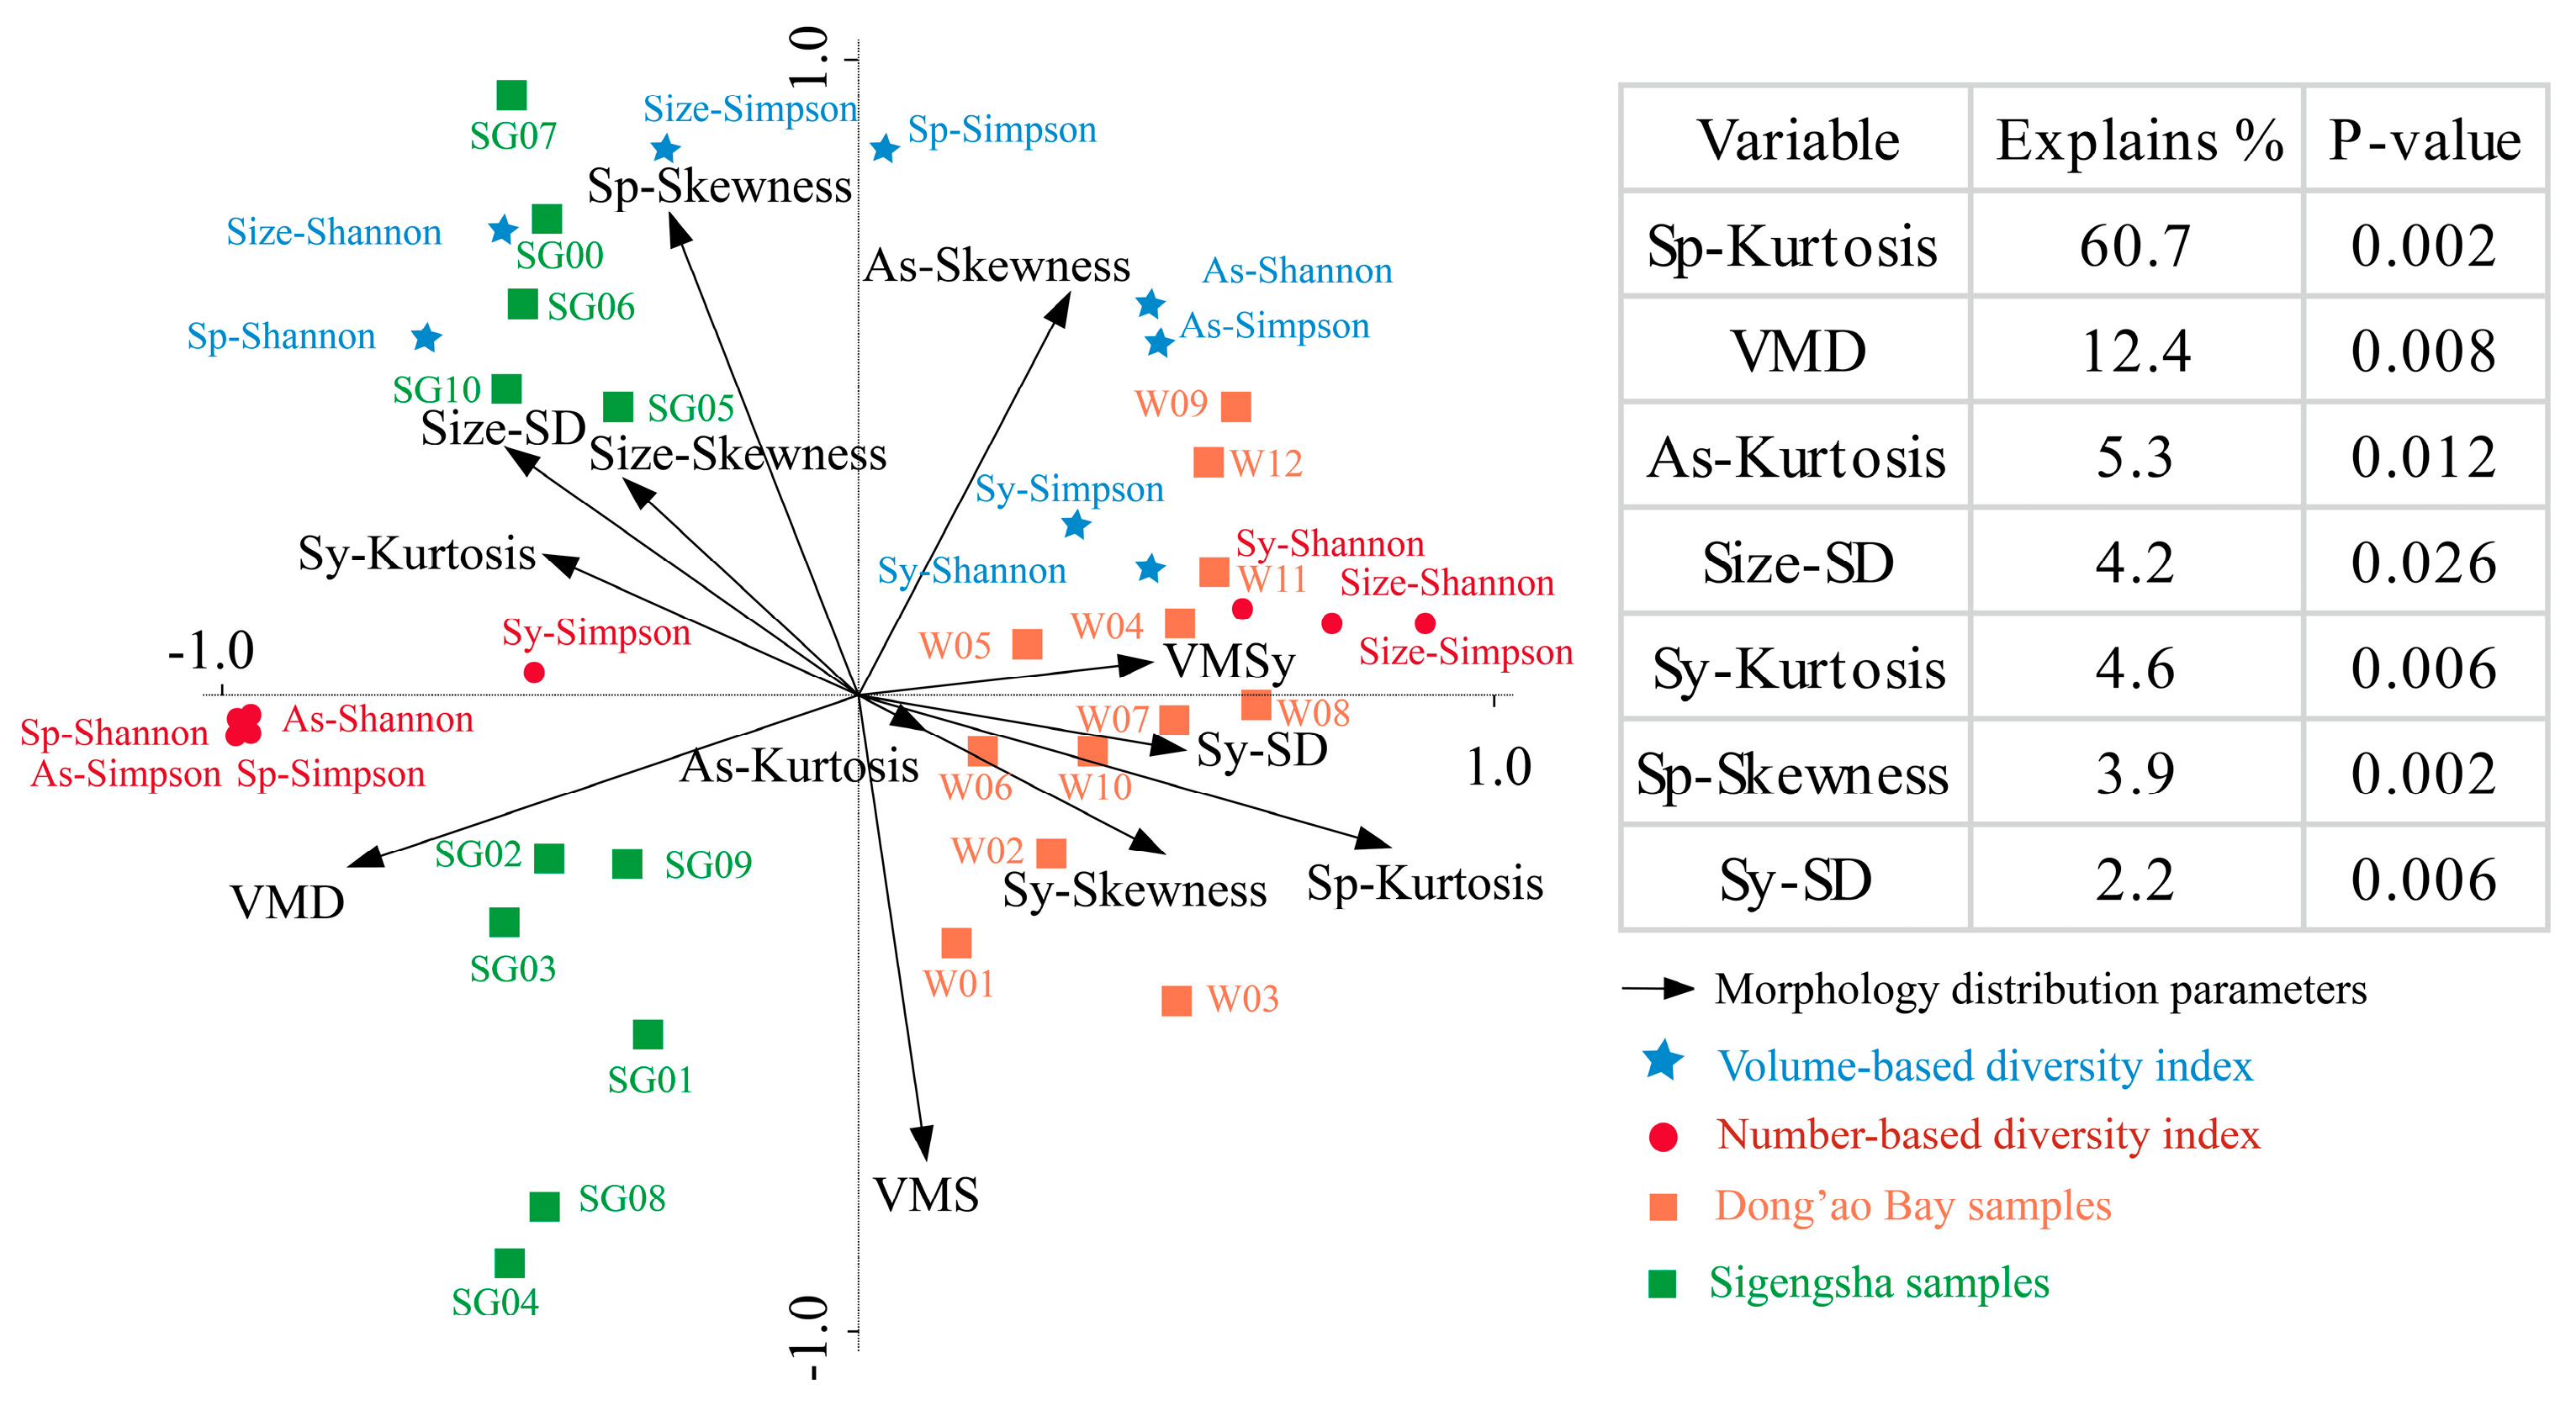
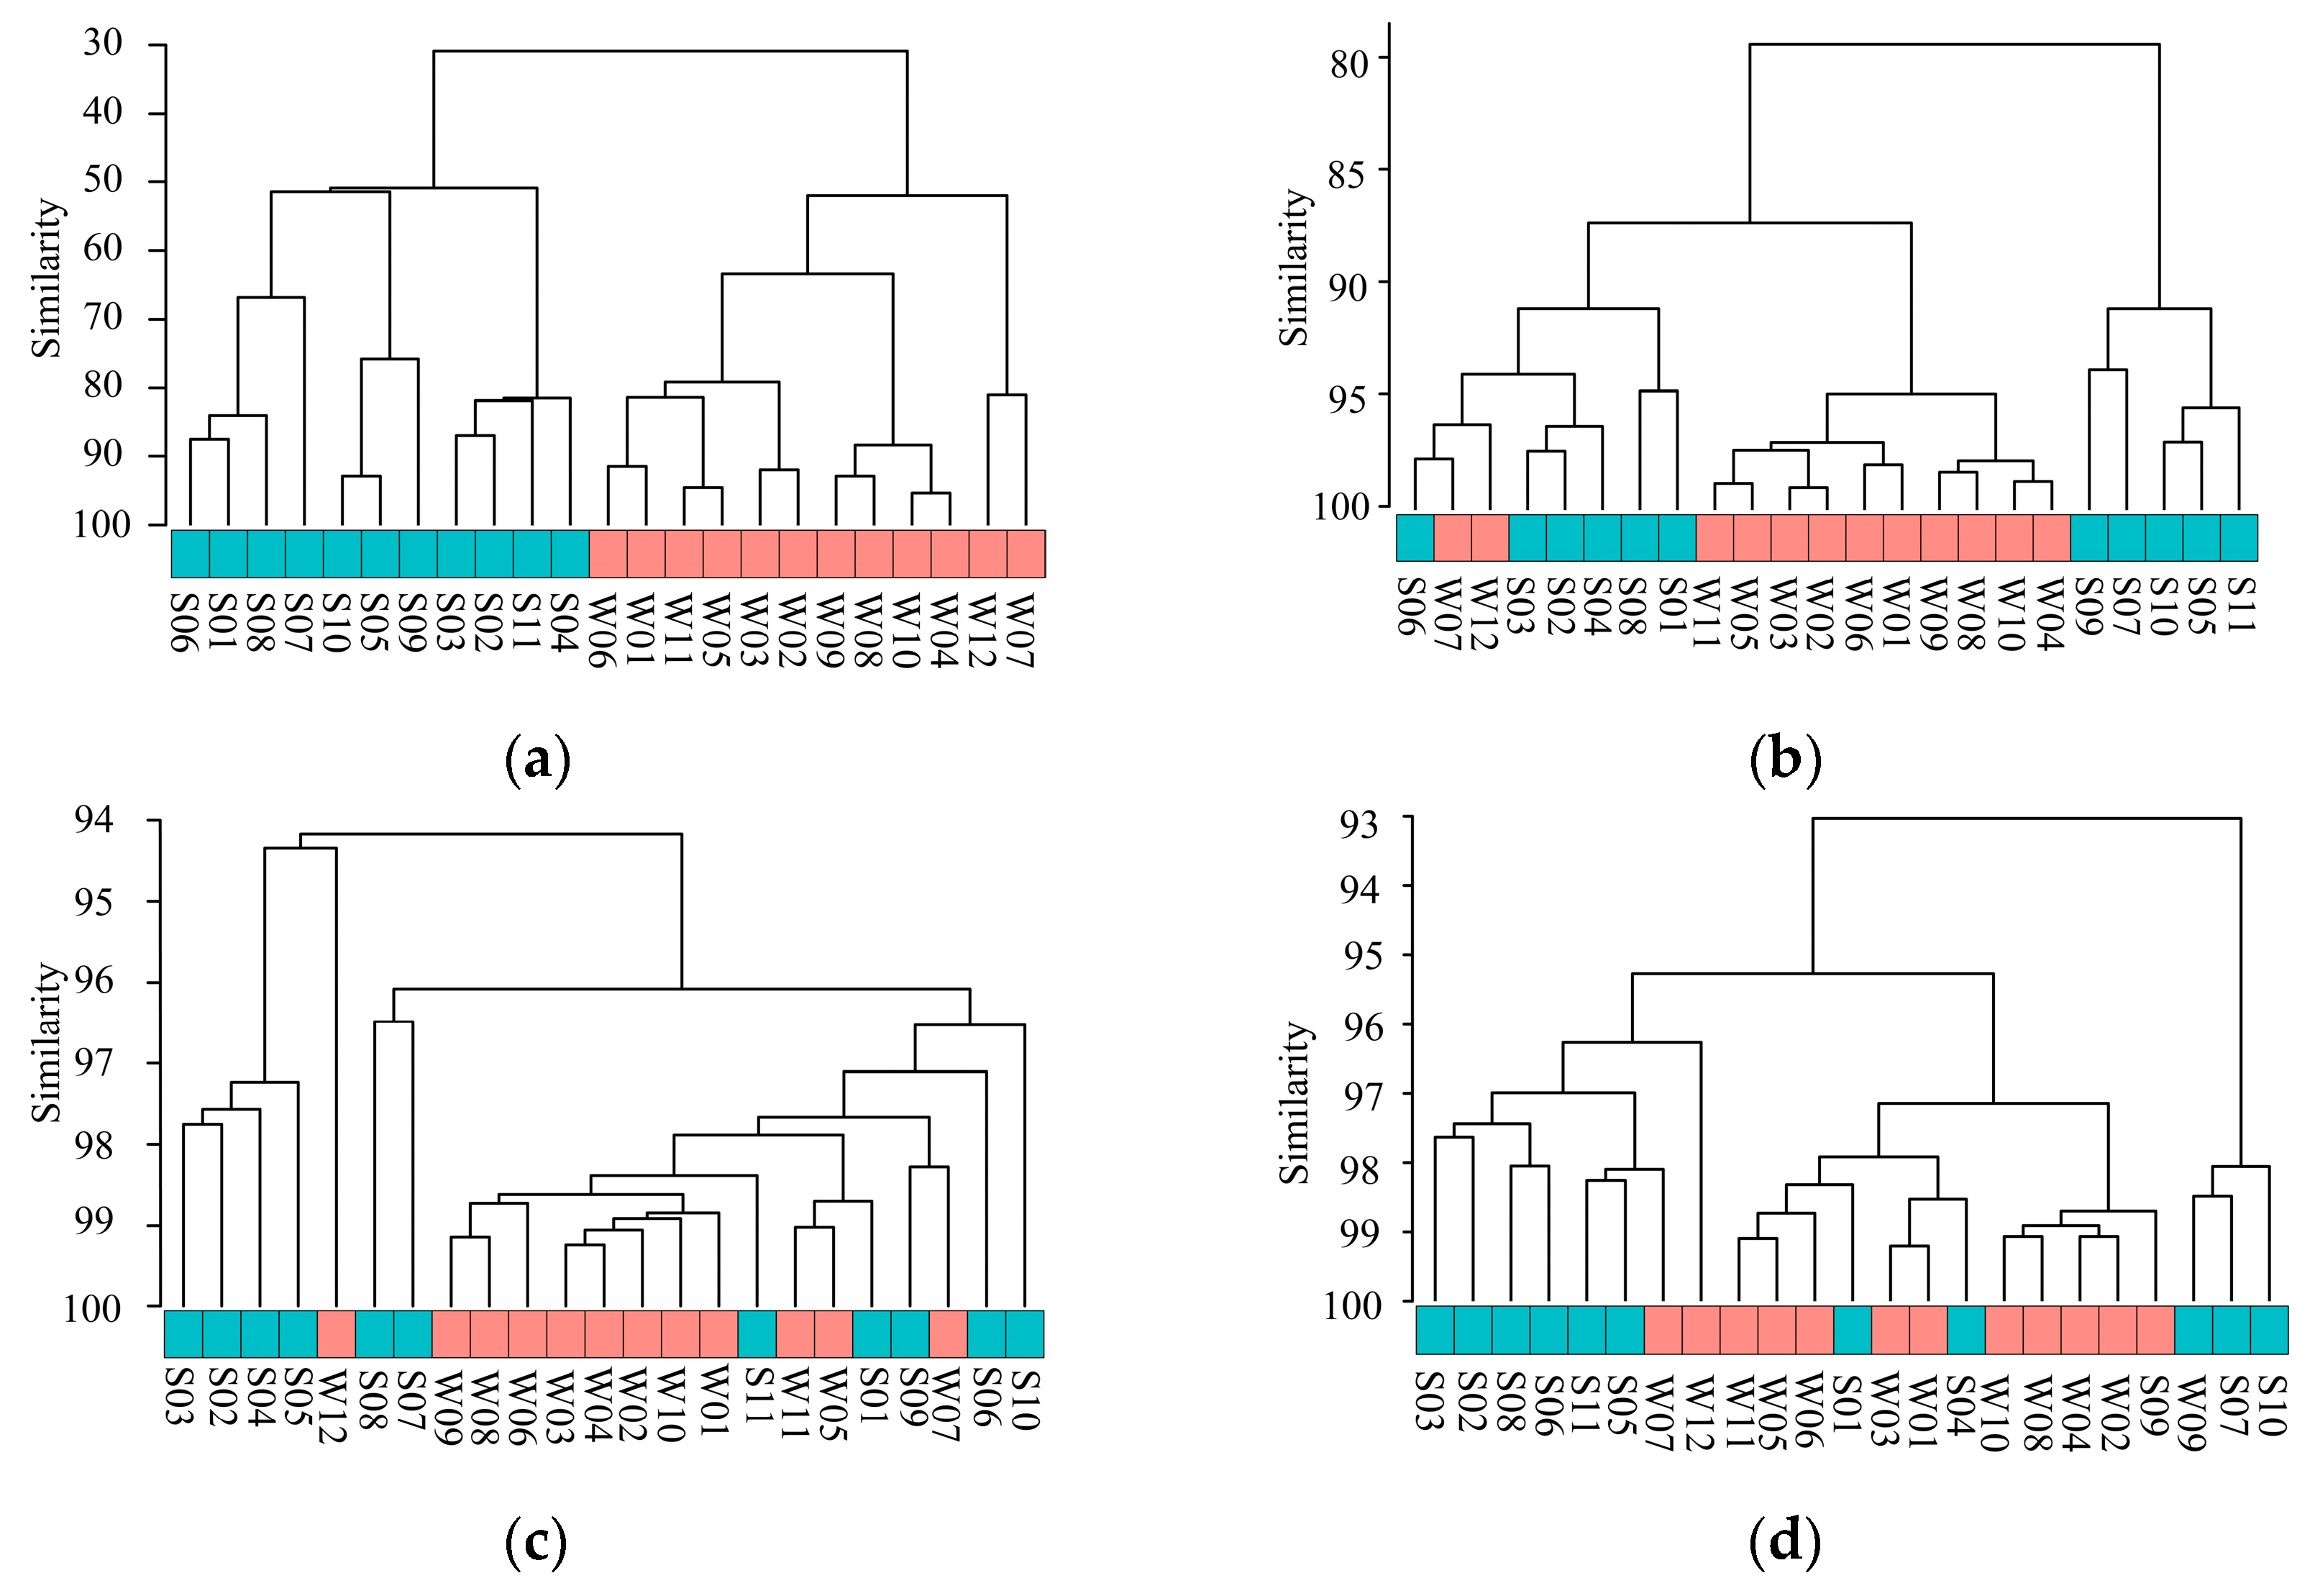
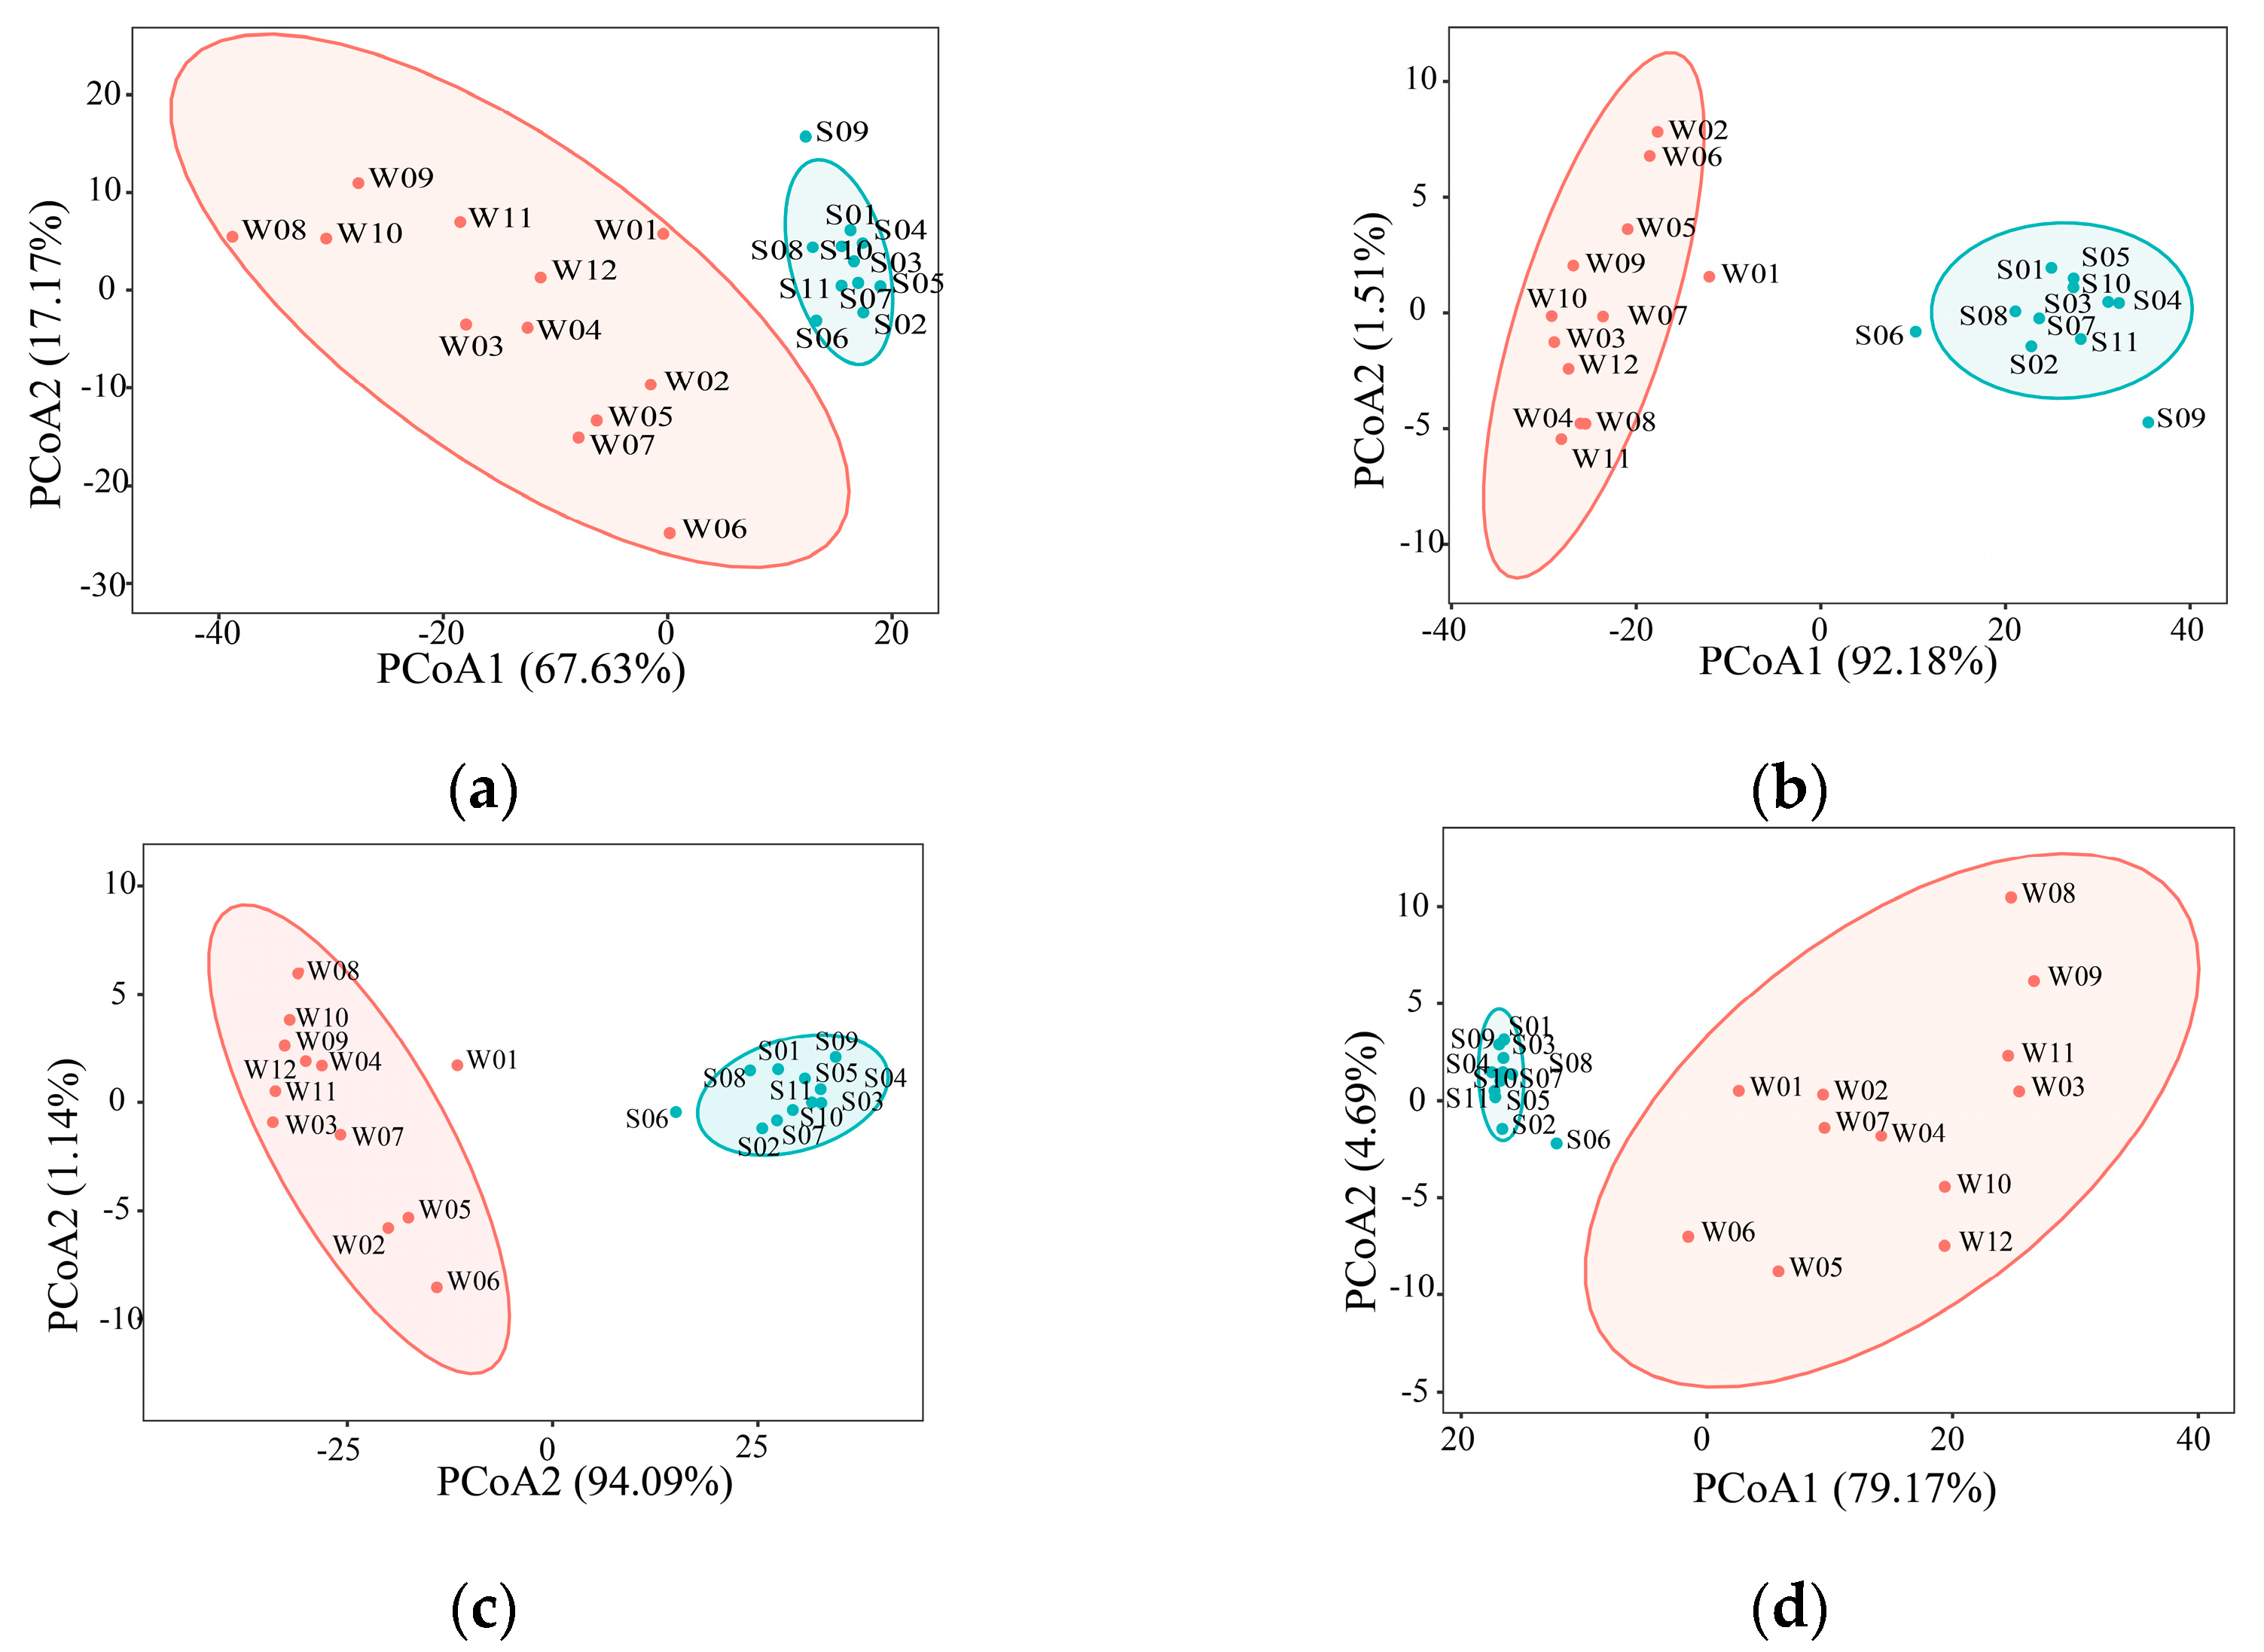
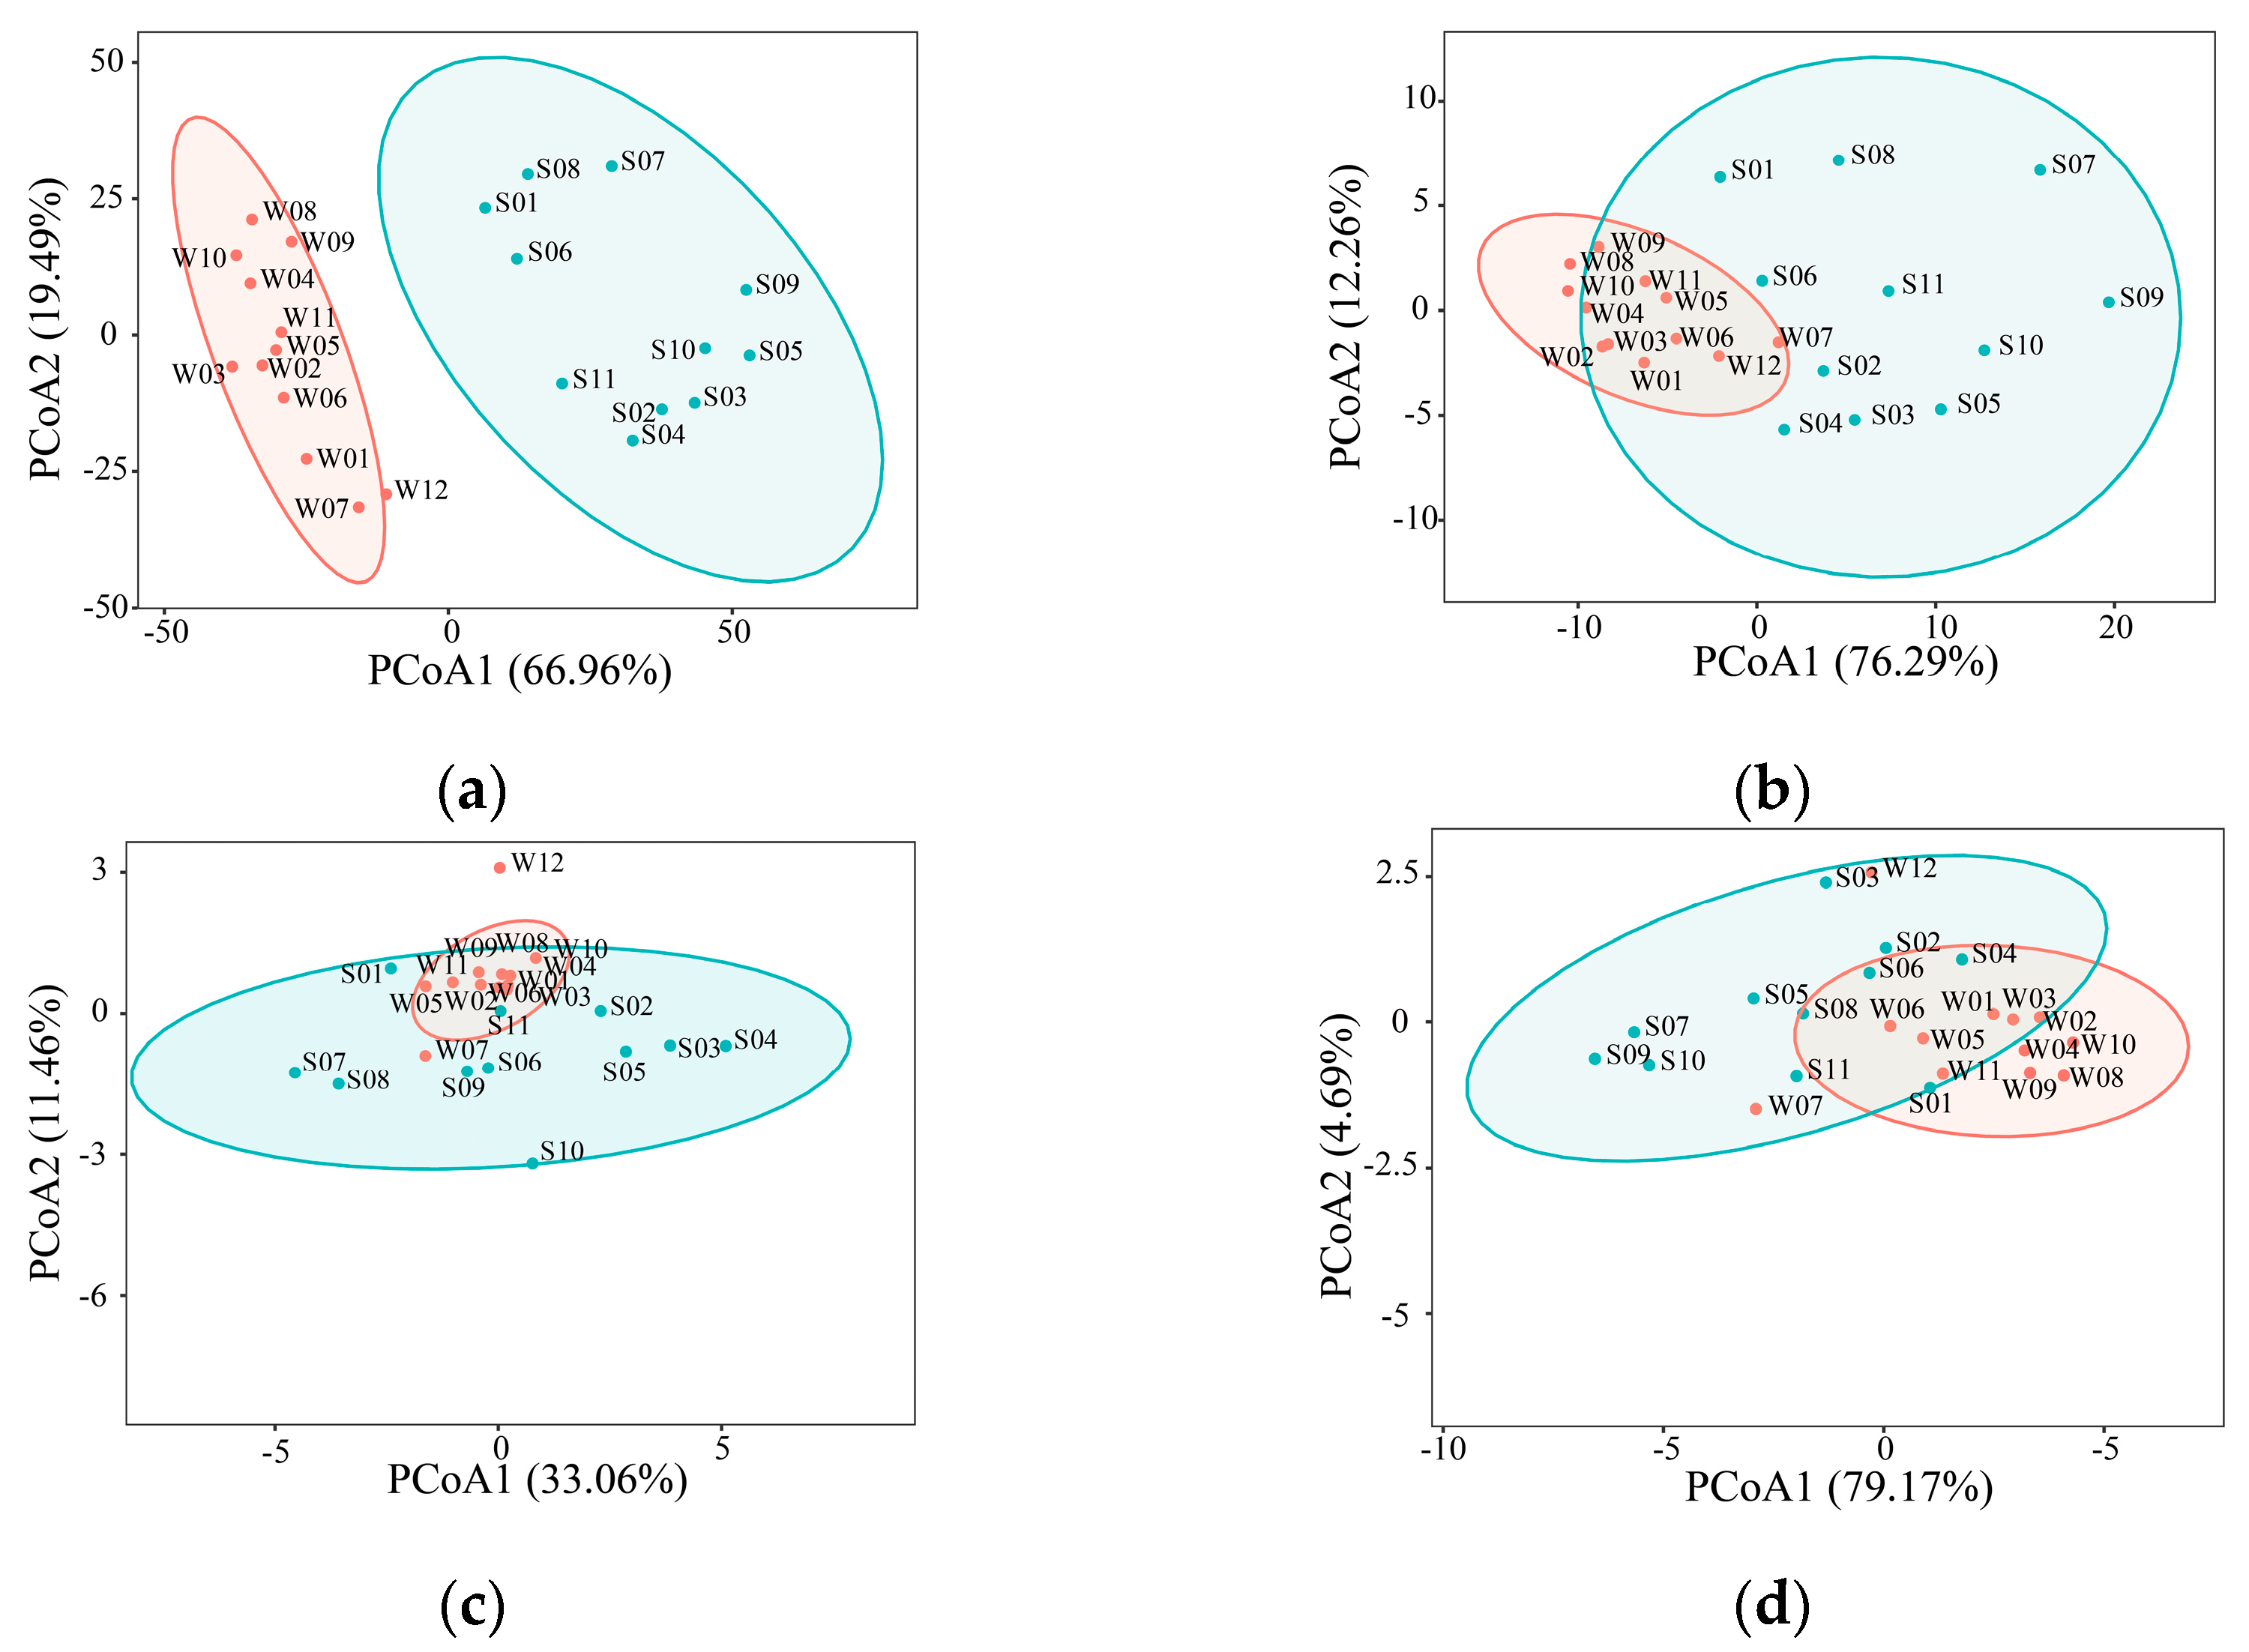
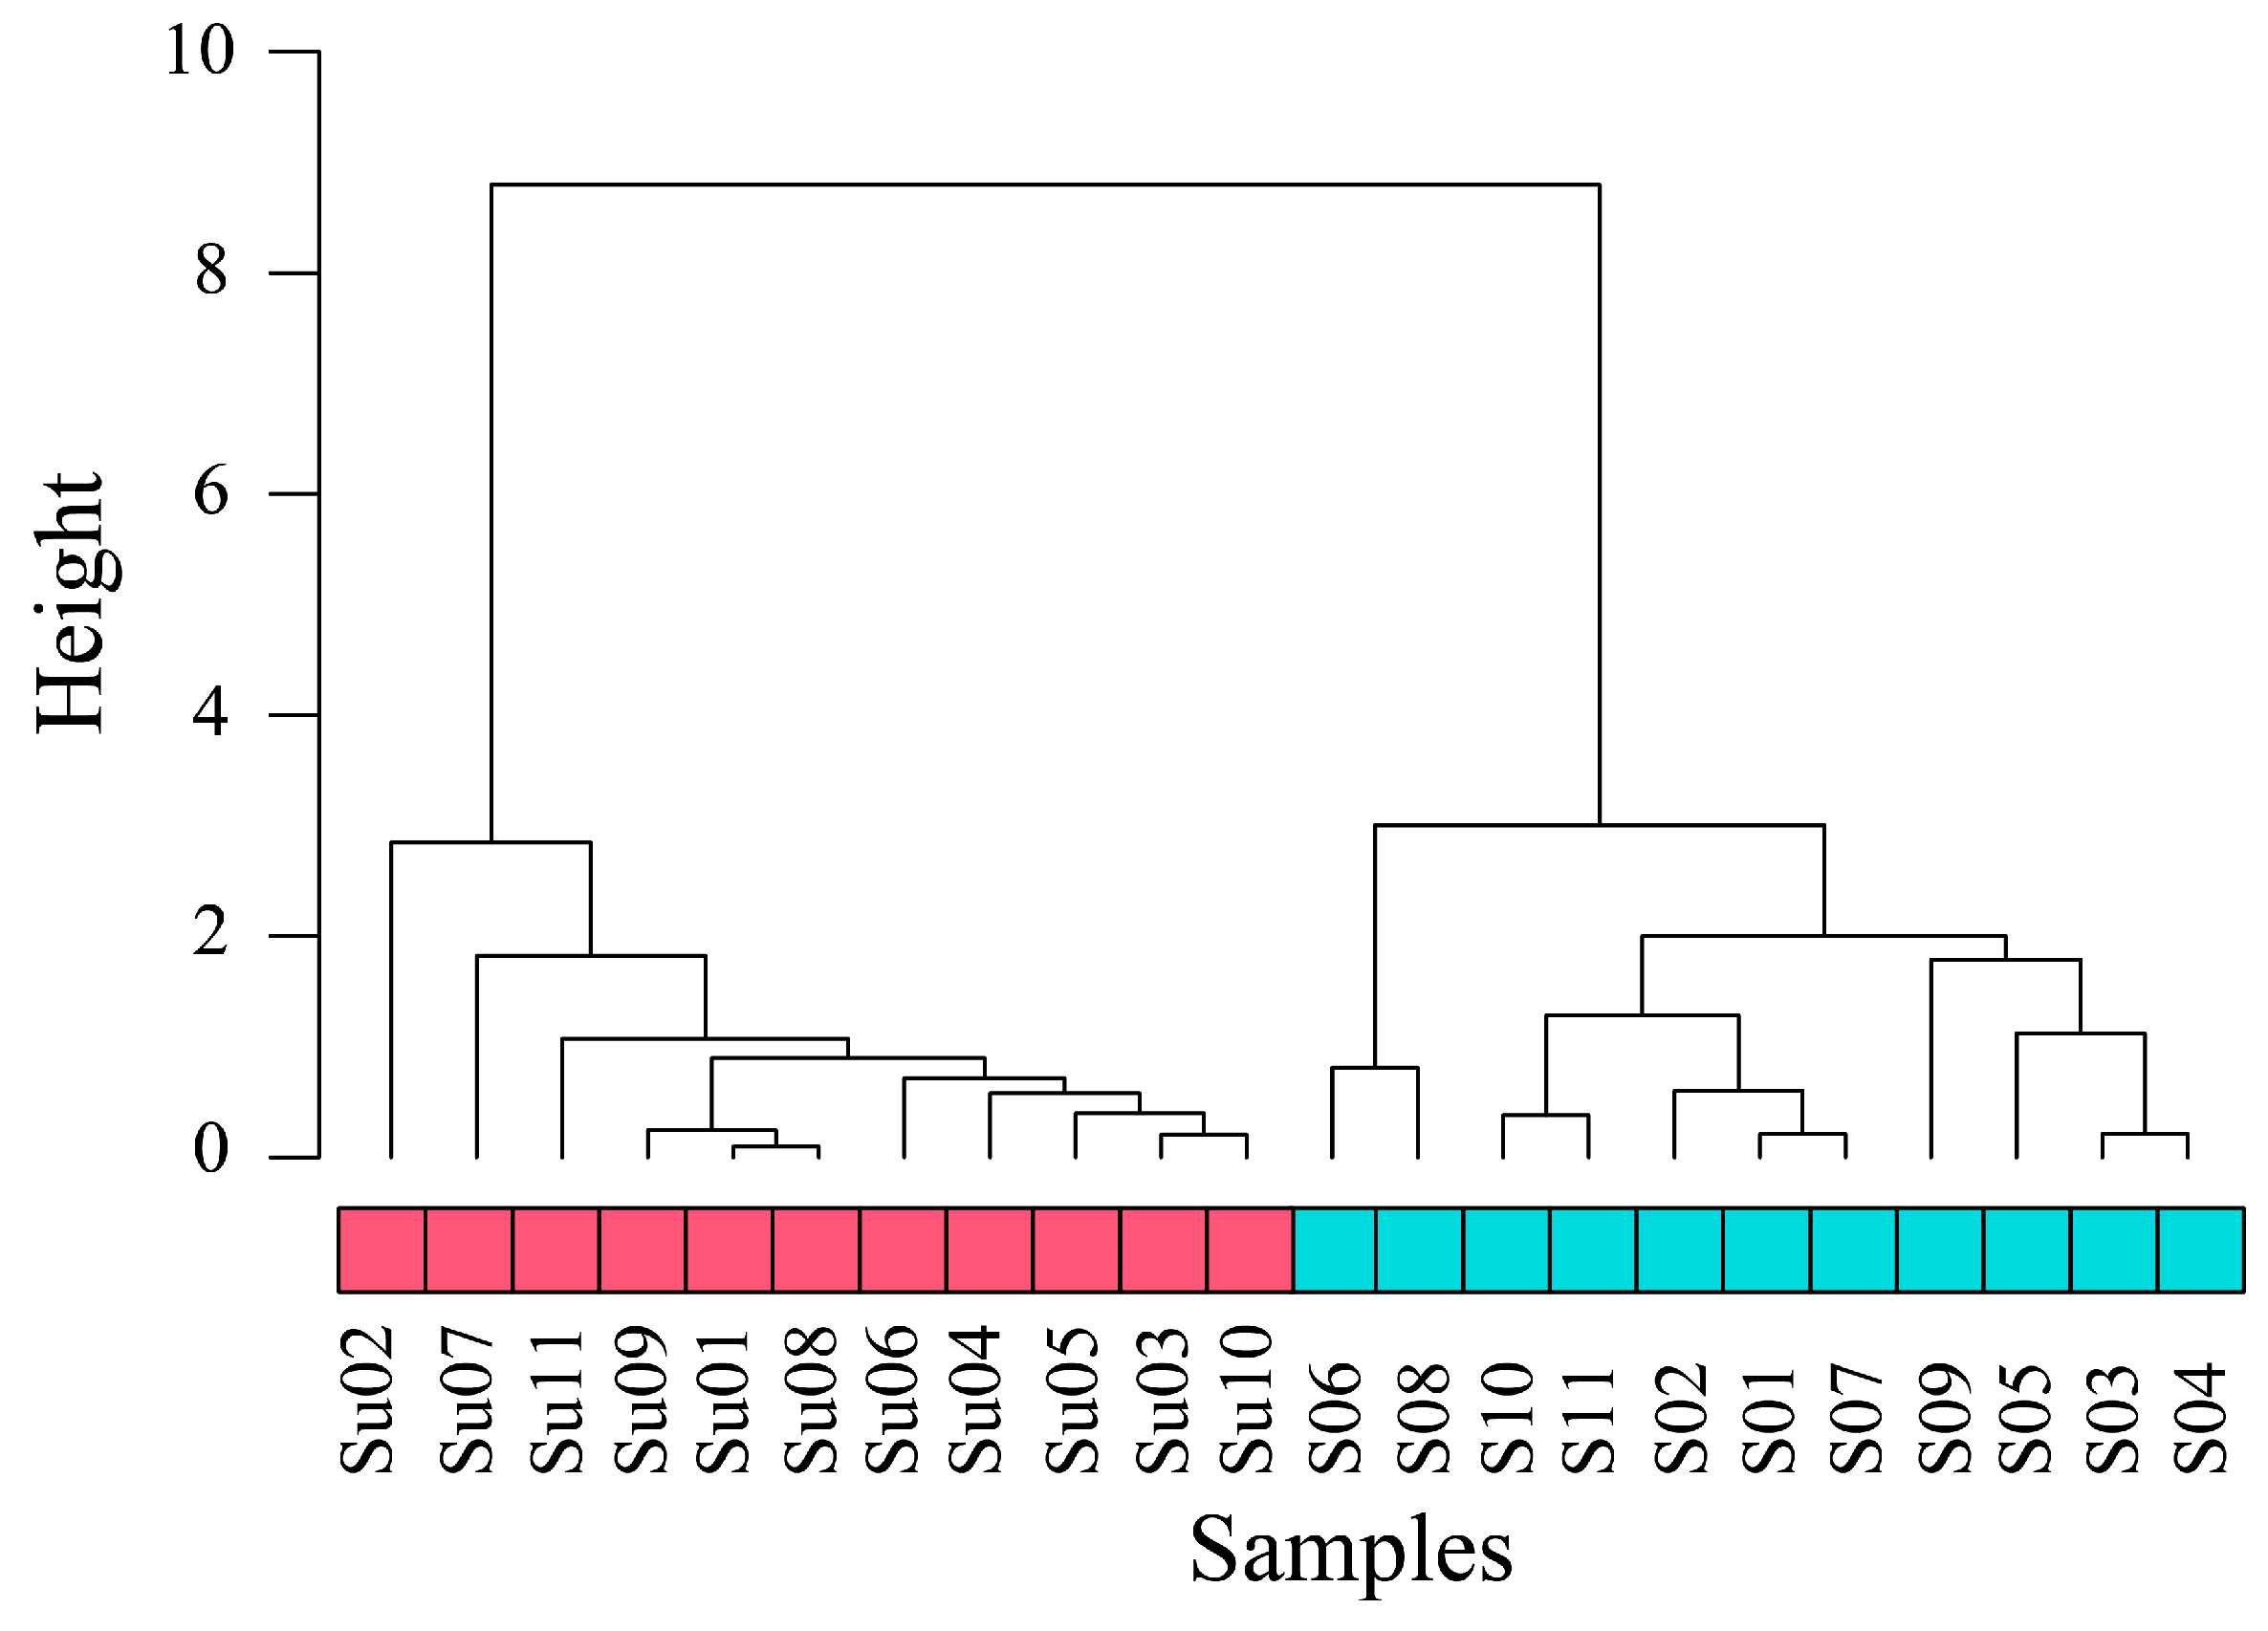
3.2. Statistical Analyses

Figure 7 and Figure 8 illustrate the similarity and clustering of the particle morphology distribution. Among the 23 samples, similarity showed a high value for particle aspect ratio volume distribution (94.12%), and a low value for size volume distribution (31.09%). Most morphologically described number distribution clustering results were effective in distinguishing between Dong’ao Bay and Sigengsha samples. Figure 9 shows number distribution curves for particle morphology, which are visually distinguishable between Dong’ao Bay and Sigengsha samples.
PCoA1 acts as the horizontal coordinate and represents the principal coordinate component that explains data change as much as possible, and PCoA2 explains the principal coordinate component that accounts for the largest proportion of the remaining change degrees in the PCoA diagram. The scale of horizontal and vertical coordinates in PCoA represents the distance between samples. Therefore, the larger the scale of the coordinate axis, the greater the diversity. The PCoA results showed that the scale of the horizontal coordinate axis for particle size (based on number) and aspect ratio (based on volume) was greater than that for the other morphologies (Figure 10 and Figure 11). The greater the difference in the morphological distribution of samples, the greater the distance between them, and the samples with similar morphological distributions will be clustered into several clusters. The Dong’ao Bay samples approached each other while Sigengsha samples were dispersed in the PCoA diagram of particle morphology based on volume. However, the form of the PCoA diagram of particle morphology based on number was the opposite Dong’ao Bay and Sigengsha samples formed two clusters in the PCoA diagram of particle size based on both volume and number distribution with a greater distance between Dong’ao Bay and Sigengsha samples in terms of particle size based on the number in the PCoA diagram. Moreover, sediment samples from Dong’ao Bay and Sigengsha formed two clusters in the PCoA diagram of particle shape based on the number distribution. In comparison, the distance between Dong’ao Bay and Sigengsha samples’ particle shapes based on number distribution was greater than the particle size in the PCoA diagram, indicating that the particle shape number distribution can better distinguish among the samples.

3.3. Shannon Index Difference

By comparing Shannon index based on volume and number, it was found that Shannon index based on number effectively distinguishes the samples from two sites (Figure 12). From sample particle morphology distribution, Shannon index, and statistical analysis results, samples from eastern and western parts of Hainan Island had better clustering based on different parameters. The Shannon index of size based on number showed that Shannon indices for Dong’ao Bay samples were greater than those from Sigengsha samples while sphericity and aspect ratio Shannon index were small. Shannon values for the sample morphology based on volume were similar. These results also coincide with the PCoA analysis results where coordinate axis scale was small.

4. Discussion

4.1. Identifying the Depositional Environment

Particle morphology parameters and the Shannon index of sediments based on number have the potential to identify different depositional environments. The wave–tide action index K is a common indicator for discriminating the dynamic environment of coastal evolution, which reflects the concentration of wave action and the relative strength of tidal and current action at a macro level [53].
K = 2.5 × ( H 1 / 10 / R )
where H 1 / 10 is the average wave height of 1/10 large waves, and R is the average tidal range. When K > 1, the beach is mainly influenced by wave action; when K < 1, the beach is mainly influenced by tidal action; when K is close to 1, the beach is in a transitional dynamic environment. Dong’ao Bay beach is dominated by waves (K = 2.45) [38], and the grain size distribution is unimodal (Figure 2a). This reflects the effective selection and uniform transport of sediments by waves, forming a mature single grain size component. In contrast, the Sigengsha beach is subject to strong tidal action (K = 1.01) and significant wind influence during the dry summer, with a bimodal grain size distribution (Figure 2a). This may be due to the different selection and transport efficiencies of tidal and wind action on sediments of different grain sizes, resulting in multiple peaks in the grain size distribution, indicating complex hydrodynamic conditions and unstable sedimentary environments. In this study, the PCoA results and particle size distribution effectively divided the sediments of Dong’ao Bay and Sigengsha into two groups, reflecting their distinct sedimentary environments (Figure 2a and Figure 11a). This is consistent with previous research [54,55], which found that the grain size distribution of sediments can reflect different sedimentary environments.
Particles undergo continuous abrasion during movement, resulting in changes in particle mass and shape over distance and time [56]. More mature particles typically exhibit a positive correlation between shape and size [11]. When calculating shape distribution based on particle volume proportion, the shape of large particles dominates the distribution curves. A comparison of the sedimentary environments of the two beaches found that the transport of large particles is affected by hydrodynamics, resulting in small differences between them. Therefore, the volume distribution curve and PCoA of particle shape for the two beaches do not effectively distinguish them.
The particle morphology number distribution can more comprehensively display sediment particle data. Small particles in sediment have a small volume ratio but a large number, greatly influencing particle morphology number distribution. The content of small, regular-shaped particles is higher in Sigengsha beach, which is consistent with the corresponding sedimentary environment mechanism. Studies have shown that wind has a selective transport effect on sediments and can preferentially transport small, regular particles [57,58]. The sediments in Dong’ao Bay are mainly subject to wave re-washing, and small regular particles are easily re-suspended from the source, while Sigengsha Beach is subject to wind erosion during the dry season, and small regular particles are easily transported by wind. The particle morphology number distribution and PCoA diagram distinguish well between the sediment in Dong’ao Bay and that in Sigengsha. Therefore, under different sedimentary force conditions, the shape parameters of fine particles are of great significance for identifying sedimentary environments.
Particles with small and regular shapes are more sensitive to environmental changes. Small particles fill gaps between large particles, affecting many physical properties of beaches, such as beach porosity, angle of internal friction, permeability, and shear strength [34,59,60,61]. These physical characteristics also often affect beach stability in a stable depositional environment. Small and regularly shaped particles are more easily carried away, so small environmental differences tend to have a greater impact on them. Sediment maturity depends on fine particle content and shape [62]. When sediment particles are subject to abrasion to a certain extent, their morphology will not change. Under different sedimentary environments, the size and content of fine particles can often represent sediment environment maturity. After a long period of physical, chemical and biological erosion of sediments in different sedimentary environments, the size and shape of fine particles will reach a balance and remain almost unchanged. Therefore, analyzing sediment particle morphology information, especially small particle morphology, provides a good indication for the sedimentary environment and historical sedimentary environment. Moreover, it represents a favorable tool for the interpretation of sedimentary environments and processes of different sedimentary facies.
The particle morphology number distribution can distinguish sediments in different sedimentary environments. According to the Shannon index biological definition, using particle number to calculate sample diversity is more consistent with its original meaning. The Shannon-Num index of samples effectively distinguishes between Dong’ao Bay and Sigengsha samples (Figure 12). The index also shows that particle number distribution is more sensitive to sedimentary behavior. Small environment differences are more directly reflected in changes in particle number distribution. The Shannon index reflects sediment particle diversity under certain hydrodynamic, biological and human activities. Different sedimentary environments also lead to different particle diversity. Therefore, Shannon index analysis provides a useful tool for the sedimentary geomorphology, sedimentary environment and sedimentary process.

4.2. Morphological Fingerprints of Particle Samples

The fingerprint based on particle morphology number parameters and the Shannon index is a potentially useful tool for identifying different depositional environments. The number distribution of morphology can distinguish among sediments in different depositional environments using number distribution parameters (i.e., Xi, and mean value, sorting, skewness and kurtosis) and the Shannon-Num diversity index as fingerprint factors to establish fingerprints. Xi is the value of the morphological descriptor at the cumulative distribution of percentage i (%) (i = 5, 16, 25, 50, 84, 75 and 95). Xi (X denotes particle size) was used to calculate particle size parameters [63], to select several representative points on the cumulative distribution curve. These measured sample shape distributions were similar to normal distribution, so representative points were also used as curve distribution representative. To verify similarity within the same sedimentary environment and differences between different sedimentary environments, Dong’ao Bay and Sigengsha sediments were divided into four groups (W01–W06, W07–W12, S01–S05 and S06–S11 were named the A, B, C and D groups, respectively). Fingerprint factors were screened via the nonparametric Kruskal–Wallis H-test (KWH test), followed by stepwise discriminant function analysis (DFA) to identify the optimal composite fingerprint combination [64]. The null hypothesis of this test is that all sediments have a unified sedimentary environment. The KWH test was used to test fingerprints and retain the factors with significant differences (p < 0.05). After testing, only sphericity95 and size16 of these two factors ingroups A–D were not significantly different (p > 0.05), so they were removed and moved into the next stage of DFA. Remaining fingerprint factors were used as a preliminary screening of fingerprint factors in the next stage of DFA. DFA screens out variables to provide more information and establishes discriminant functions to minimize error rate when using derived discriminant function to determine observation category. The main discriminant basis is Wilks’ lambda value; smaller the values indicate greater difference between individual sample groups. The group fingerprint factor with the smallest Wilks’ lambda value in the multivariate discriminant analysis is the composite fingerprint factor with best discriminant ability. Finally, seven fingerprints of size-Shannon, size75, sphericity-Sk, aspect ratio5, aspect ratio75, symmetry25 and symmetry-SD were determined to form a composite fingerprint. On average, 95.7% of the sediments were correctly classified, indicating that selected fingerprints strongly discriminated among Dong’ao Bay and Signegsha sediments. DFA results were visualized by canonical discriminant function; separation among sediments (Dong’ao Bay and Sigengsha) was pronounced and same beach sediments clustered together (Figure 13). The optimum combination of fingerprints was used by a two-stage statistical procedure (KWH test and DFA), effectively distinguishing sediments from different beaches while ensuring similarity among same beach sediments. The procedure also showed that composite fingerprints can effectively distinguish sediment environments.
In the traditional fingerprint technique, the geochemical element composite fingerprint has become the most commonly used identification technique. Fingerprint factors (including Fe, Zn, 137Cs and 226Ra) are combined to form a composite fingerprint factor combination including multiple fingerprint factors [65]. This combination provides a broader perspective for studying erosion sources and offers effective technical support for harnessing regional soil erosion and restoring the ecological environment from the source [66,67,68,69]. This technique provides a simple method for measuring particle shape to analyze structural maturity and depositional behavior, with great application prospects. Sediment transport processes involve the sorting of particle sizes and shapes. The physical (wave, tide, wind, runoff, etc.), chemical and biological environment of the sediment also affects sediment particle morphology distribution. Therefore, fingerprints calculated by particle morphology combined with external factors play an important role in earth science such as beach process and depositional behavior.

4.3. Particle Morphology in Hydraulic and Aeolian Environments

The optimum fingerprints were obtained by the two-stage statistical procedure (KWH test and DFA) to identify aeolian hydrodynamic environment. Field observations revealed apparent sand blown by wind at the backshore. However, underwater sediments are not exposed and are sorted and transported by tides and waves over a long period of time. The difference in sand transport processes between backshore and underwater sediments is remarkable, largely due to the transport medium. Compared to wind, water provides more buoyancy for particles while reducing falling gravity and momentum. Particle movement in water reduces collision between particles and bed surface as well as between particles. Simultaneously, particle shape affects flow around it, changing sediment morphology sorting [70,71], leading to detectable differences in both size distribution and shape of sand grains contained in respective deposits. Backshore and underwater sediments of Sigengsha beach provide the possibility to identify aeolian and hydrodynamic environments. Surface sediment samples were collected at backshore and underwater of each section of Sigengsha in August 2015, marked as S01–S11 and Su01–Su11, respectively. Optimum fingerprints effectively distinguished different sedimentary environments. We analyzed backshore and underwater sediments to identify aeolian and hydrodynamic sedimentary environment. Figure 14 shows the PCoA diagram of backshore and underwater sediments of Sigengsha section under different dominant forces; there is a clear distinction between backshore and underwater sediments.
Simultaneously, cluster analysis revealed that backshore sediments were grouped into one cluster distinct from underwater sediments (Figure 15), with cluster analysis results similar to PCoA. Therefore, different sedimentary environments result in different particle morphology distributions, especially based on particle number distribution. According to motion state, sediments can be divided into suspended load, bed load and saltation load. Through different sediment migration processes, particle morphological characteristics can change in various ways. These attributes can be used individually or in combination to distinguish sedimentary facies, provide evidence of sediment transport history, and describe sedimentary environments [25]. Simultaneously, analysis of the sediment particle morphology at different beach positions explores beach sediment movement process providing new inspiration for the studying beach dynamic geomorphology. The combined use of particle shape and size distribution of the sediment particles provides scientific parameters for sediment transport models and better understanding of beach dynamic geomorphology processes. Although sediment particle morphology parameters and diversity index provide convenient potential fingerprint factors, it should be noted that composite fingerprint factor calculated in different regions vary.
Mature sediment particles, especially fine particles, do not readily change in size and shape again. Although various biological, chemical, magnetic minerals and fallout radionuclides of sediment serve as tracers to trace the source, few parameters such as particle morphology as tracers. Sediment parameters are closely related to sedimentary environment and sediment transport history. Sediment morphological parameters can provide more provenance information and improve the accuracy of provenance tracing. Sediment particles diversity and morphological distribution parameters often adapt to their sedimentary environment. Changes in sedimentary environment or sediment also lead to changes in the original sedimentary landform until a new stable sedimentary landform is formed, adapting the sedimentary environment to sediment particle parameters. Analyzing the relationship between beach sediment diversity index and particle morphology parameters with the sedimentary environment (hydrodynamic and human activities) has guiding significance for studying beach stability and the selection sand sources for beach nourishment.

5. Conclusions

In this paper, we apply the Camsizer-XT for rapid and large-scale image analysis of beach sediments, and reveal the internal relationship between morphological diversity and descriptors based on the number and volume distribution of sediment particle morphology. Furthermore, we develop a novel method to discriminate sedimentary environments and processes using the number-based particle morphology parameters and Shannon index as fingerprint factors. This method can effectively separate different sediment groups in the PCoA plot and distinguish between backshore sediments and underwater sediments under different dynamic conditions. This paper demonstrates that Dynamic Image Analysis (DIA) of particle size and shape is a valuable tool for identifying different sedimentary environments and establishing sediment fingerprints.

Author Contributions

Conceptualization, W.C. and S.C.; methodology, W.C. and X.Z.; formal analysis, S.Z.; investigation, W.C., S.C. and X.Z.; resources, S.C. and X.Z.; data curation, W.C.; writing—original draft preparation, W.C.; writing—review and editing, W.C., S.C., X.Z. and S.Z.; visualization, W.C.; supervision, W.C. and S.C.; project administration, S.C.; funding acquisition, S.C. and S.Z. All authors have read and agreed to the published version of the manuscript.

Funding

This research was funded by the National Natural Science Foundation of China (grant number 41906184), the China Postdoctoral Science Foundation (grant number 2019M652248), and the National Natural Science Foundation of Fujian Province (2022J05156).

Data Availability Statement

Not applicable.

Acknowledgments

This work was supported by the Science and Technology Basic Resources Investigation Program of China (Grant No. 2022FY202404).

Conflicts of Interest

The authors declare no conflict of interest.

References

  1. Petrak, D.; Dietrich, S.; Eckardt, G.; Köhler, M. Two-dimensional particle shape analysis from chord measurements to increase accuracy of particle shape determination. Powder Technol. 2015, 284, 25–31. [Google Scholar] [CrossRef]
  2. Sun, Y.; Cai, Z.; Fu, J. Particle morphomics by high-throughput dynamic image analysis. Sci. Rep. 2019, 9, 1–11. [Google Scholar] [CrossRef] [PubMed] [Green Version]
  3. Pettijohn, F.J.; Potter, P.; Siever, R. Sand and Sandstone, 2nd ed.; Springer: New York, NY, USA, 1972; pp. 97–135. [Google Scholar]
  4. Gao, S.; Collins, M. Analysis of grain size trends, for defining sediment transport pathways in marine environments. J. Coast. Res. 1994, 10, 70–78. [Google Scholar]
  5. Cheng, P.; Gao, S.; Bokuniewicz, H. Net sediment transport patterns over the Bohai Strait based on grain size trend analysis. Estuar. Coast. Shelf Sci. 2004, 60, 203–212. [Google Scholar] [CrossRef]
  6. Ma, L.; Wu, J.; Abuduwaili, J. Variation in aeolian environments recorded by the particle size distribution of lacustrine sediments in Ebinur Lake, Northwest China. SpringerPlus 2016, 5, 481. [Google Scholar] [CrossRef] [Green Version]
  7. Liang, A.; Dong, Z.; Qu, J.; Su, Z.; Zhang, Z.; Qian, G.; Gao, J.; Pang, Y.; Yang, Z. Using spetial variations of grain size to reveal sediment transport in Kumtagh Sand Sea, Northwest China. Aeolian Res. 2020, 46, 100559. [Google Scholar] [CrossRef]
  8. Shang, Y.; Kaakinen, A.; Beers, C.; Prins, M. Aeolian silt transport processes as fingerprinted by dynamic image analysis of the grain size and shape characteristics of Chinese loess and Red Clay deposits. Sediment Geol. 2018, 375, 36–48. [Google Scholar] [CrossRef]
  9. Domokos, G.; Jerolmack, D.; Sipos, A.; Török, Á. How river rocks round: Resolving the shape-size paradox. PLoS ONE 2014, 9, e88657. [Google Scholar] [CrossRef] [Green Version]
  10. Miller, K.; Szabó, T.; Jerolmack, G.; Gábor, D. Quantifying the significance of abrasion and selective transport for downstream fluvial grain size evolution. J. Geophys. Rese. Earth Sur. 2014, 119, 2412–2429. [Google Scholar] [CrossRef] [Green Version]
  11. Novák-Szabó, T.; Sipos, A.; Shaw, S.; Bertoni, D.; Pozzebon, A.; Grottoli, E.; Sarti, G.; Ciavola, P.; Domokos, G.; Jerolmack, D. Universal characteristics of particle shape evolution by bed-load chipping. Sci. Adv. 2018, 4, eaao4946. [Google Scholar] [CrossRef] [Green Version]
  12. Xiu, H.; Ma, F.; Li, J.; Zhao, X.; Liu, L.; Feng, P.; Yang, X.; Zhang, X.; Kozliak, E.; Ji, Y. Using fractal dimension and shape factors to characterize the microcrystalline cellulose (MCC) particle morphology and powder flowability. Powder Technol. 2020, 364, 241–250. [Google Scholar] [CrossRef]
  13. Wang, J.; Li, Z.; Cai, C.; Ma, R. Particle size and shape variation of Ultisol aggregates affected by abrasion under different transport distances in overland flow. Catena 2014, 123, 153–162. [Google Scholar] [CrossRef]
  14. Polakowski, C.; Sochan, A.; Bieganowski, A.; Ryzak, M.; Földényi, R.; Tóth, J. Influence of the sand particle shape on particle size distribution measured by laser diffraction method. Int. Agrophys. 2014, 28, 195–200. [Google Scholar] [CrossRef]
  15. Guan, R.; Guang, L.; Di, H.; Zhou, C. Effect of particle shape on mechanical behaviors of rocks: A numerical study using clumped particle model. Sci. World J. 2013, 2013, 589215. [Google Scholar]
  16. Mulchrone, K.; McCarthy, D.; Meere, P. Mathematica code for image analysis, semi-automatic parameter extraction and strain analysis. Comput. Geosci. 2013, 61, 64–70. [Google Scholar] [CrossRef]
  17. Sarocchi, D.; Sulpizio, R.; Macías, J.; Saucedo, R. The 17 July 1999 block-and-ash flow (BAF) at Colima Volcano: New insights on volcanic granular flows from textural analysis. J. Volcanol. Geotherm. Res. 2011, 204, 40–56. [Google Scholar] [CrossRef]
  18. Charpentier, I.; Sarocchi, D.; Sedano, L.A.R. Particle shape analysis of volcanic clast samples with the Matlab tool MORPHEO. Comput. Geosci. 2013, 51, 172–181. [Google Scholar] [CrossRef]
  19. Polo-Díaz, A.; Benito-Calvo, A.; Martínez-Moreno, J.; Mora, T.R. Formation processes and stratigraphic integrity of the Middle-to-Upper Palaeolithic sequence at Cova Gran de Santa Linya (Southeastern Prepyrenees of Lleida, Iberian Peninsula). Quat. Int. 2016, 417, 16–38. [Google Scholar] [CrossRef]
  20. Sokołowski, T.; Wacnik, A.; Woronko, B.; Madeja, J. Eemian-Weichselian Pleniglacial fluvial deposits in southern Poland (an example of the Vistula River valley in Kraków). Geol. Q. 2014, 58, 71–84. [Google Scholar]
  21. Suzuki, K.; Fujiwara, H.; Ohta, T. The evaluation of macroscopic and microscopic textures of sand grains using elliptic Fourier and principal component analysis: Implications for the discrimination of sedimentary environments. Sedimentology 2015, 62, 1184–1197. [Google Scholar] [CrossRef]
  22. Joo, Y.J.; Soreghan, A.M.; Madden, M.E.E.; Soreghan, G.S. Quantification of particle shape by an automated image analysis system: A case study in natural sediment samples from extreme climates. Geosci. J. 2018, 22, 525–532. [Google Scholar] [CrossRef]
  23. Patro, B.; Sahu, B. Discriminant analysis of sphericity and roundness data of clastic quartz grains in rivers, beaches and dunes. Sediment. Geol. 1977, 19, 301–311. [Google Scholar] [CrossRef]
  24. Eamer, J.B.R.; Shugar, D.H.; Walker, I.J.; Lian, O.B.; Neudorf, C.M. Distinguishing depositional setting for sandy deposits in coastal landscapes using grain shape. J. Sediment. Res. 2017, 87, 1–11. [Google Scholar] [CrossRef]
  25. Evans, D.J.A.; Benn, D.I. Clast shap. In A Practical Guide to the Study of Glacial Sediments, 1st ed.; Benn, D.I., Lukas, S., Eds.; Edward Arnold: London, UK, 2004; pp. 98–105. [Google Scholar]
  26. Campaña, I.; Benito-Calvo, A.; Pérez-González, A.; Bermúdez de Castro, J.M.; Carbonell, E. Assessing automated image analysis of sand grain shape to identify sedimentary facies, Gran Dolina archaeological site (Burgos, Spain). Sediment. Geol. 2016, 346, 72–83. [Google Scholar] [CrossRef]
  27. Vos, K.; Vandenberghe, N.; Elsen, J. Surface textural analysis of quartz grains by scanning electron microscopy (SEM): From sample preparation to environmental interpretation. Earth Sci. Rev. 2014, 128, 93–104. [Google Scholar] [CrossRef]
  28. Li, D.; Li, Y.; Wang, Z.; Wang, X.; Li, Y. Quantitative, SEM-based shape analysis of sediment particles in the Yellow River. Int. J. Sediment. Res. 2016, 31, 341–350. [Google Scholar] [CrossRef]
  29. Dioguardi, F.; Mele, D.; Dellino, P.; Dürig, T. The terminal velocity of volcanic particles with shape obtained from 3D X-ray microtomography. J. Volcanol. Geotherm. Res. 2017, 329, 41–53. [Google Scholar] [CrossRef] [Green Version]
  30. Tafesse, S.; Robison Fernlund, J.; Sun, W.; Bergholm, F. Evaluation of image analysis methods used for quantification of particle angularity. Sedimentology 2013, 60, 1100–1110. [Google Scholar] [CrossRef]
  31. Moreno, C.G.; Castillo, R.F.; Sarocchi, D.; Borselli, L.; Rodríguez-Sedano, L.A. FabricS: A user-friendly, complete and robust software for particle shape-fabric analysis. Comput. Geosci. 2018, 115, 20–30. [Google Scholar] [CrossRef]
  32. Clarke, J.; Gamble, J.; Jones, J.; Tobyn, M.; Greenwood, R.; Ingram, A. Alternative approach for defining the particle population requirements for static image analysis based particle characterization methods. Adv. Powder Technol. 2019, 30, 920–929. [Google Scholar] [CrossRef] [Green Version]
  33. Ulusoy, U. Quantifying of particle shape differences of differently milled barite using a novel technique: Dynamic image analysis. Materialia 2019, 8, 100434. [Google Scholar] [CrossRef]
  34. Wei, H.; Tang, X.; Ge, Y.; Li, M.; Saxén, H.; Yu, Y. Numerical and experimental studies of the effect of iron ore particle shape on repose angle and porosity of a heap. Powder Technol. 2019, 353, 526–534. [Google Scholar] [CrossRef]
  35. Wang, L.; Wang, X.; Mohammad, L.; Abadie, C. Unified method to quantify aggregate shape angularity and texture using Fourier analysis. J. Mater. Civ. Eng. 2005, 17, 498–504. [Google Scholar] [CrossRef]
  36. Fang, H.; Chen, M.; Chen, Z. Surface Morphology and Simulation for Environmental Sediment; China Science Press: Beijing, China, 2009; pp. 44–80. (In Chinese) [Google Scholar]
  37. Tunwal, M.; Mulchrone, K.F.; Meere, P.A. Image based particle shape analysis toolbox (IPSAT). Comput. Geosci. 2020, 135, 104391. [Google Scholar] [CrossRef]
  38. Cheng, W.; Chen, S.; Hu, J. Stability of headland bay beaches on the east coast of Hainan Island. Ocean Eng. 2017, 35, 121–128. (In Chinese) [Google Scholar]
  39. Wang, B.; Chen, S.; Gong, W. Formation and Evolution of Hainan Island Harbor Coast; China Ocean Press: Beijing, China, 2006; pp. 75–188. (In Chinese) [Google Scholar]
  40. Plate, M.; Pankratz, J. Apparatus for Determining the Particle Size Distribution of a Mixture. U.S. Patent 6,061,130, 5 September 2000. [Google Scholar]
  41. Luo, Z.; Cai, B.; Chen, S. Grain size and shape analysis of beach sediment using dynamic image analysis and comparison with sieving method. Acta Sedimentol. Sin. 2016, 34, 881–898. (In Chinese) [Google Scholar]
  42. McManus, J. Grain size determination and interpretation. In Techniques in Sedimentology, 1st ed.; Miller, J., Ed.; Blackwell Scientific Publications: Oxford, UK, 1988; pp. 63–85. [Google Scholar]
  43. Dadd, K.; Foley, K. A shape and compositional analysis of ice-rafted debris in cores from IODP Expedition 323 in the Bering Sea. Deep Sea Res. Part II Top. Stud. Oceanogr. 2016, 125–126, 191–201. [Google Scholar] [CrossRef]
  44. Szabó, T.; Domokos, G.; Grotzinger, J.; Jerolmack, D. Reconstructing the transport history of pebbles on Mars. Nat. Commun. 2015, 6, 8366. [Google Scholar] [CrossRef] [Green Version]
  45. Benito-Calvo, A.; de la Torre, I. Analysis of orientation patterns in Olduvai Bed I assemblages using GIS techniques: Implications for site formation processes. J. Hum. Evol. 2011, 61, 50–60. [Google Scholar] [CrossRef] [PubMed]
  46. Whittaker, R.H. Vegetation of the Siskiyou Mountains Oregon and California. Ecol. Monogr. 1960, 30, 79–338. [Google Scholar] [CrossRef]
  47. Shannon, C.E. A mathematical theory of communication. Bell. Syst. Tech. J. 1948, 27, 623–656. [Google Scholar] [CrossRef]
  48. Simpson, E.H. Measurement of diversity. Nature 1949, 163, 688. [Google Scholar] [CrossRef]
  49. Mantel, N. The detection of disease clustering and a generalized regression approach. Cancer Res. 1967, 27, 209–220. [Google Scholar] [PubMed]
  50. Borcard, D.; Legendre, P.; Drapeau, P. Partialling out the spatial component of ecological variation. Ecology 1992, 73, 1045–1055. [Google Scholar] [CrossRef] [Green Version]
  51. Dixon, P. Vegan a package of R functions for community ecology. J. Veg. Sci. 2003, 14, 927–930. [Google Scholar] [CrossRef]
  52. Bray, J.R.; Curtis, J.T. An ordination of the upland forest communities of southern Wisconsin. Ecol. Monogr. 1957, 27, 325–349. [Google Scholar] [CrossRef]
  53. Pál, G.; Domokos, G.; Kun, F. Curvature flows: Scaling laws and the geometry of attrition under impacts. Sci. Rep. 2021, 11, 20661. [Google Scholar] [CrossRef] [PubMed]
  54. Zhang, Y.; Chun, X.; Zhou, H.; Zhang, Y.; Huang, S.; Wang, X. Particle size characteristics of surface sediments and their environmental significance: A comparative study of deserts in arid western Inner Mongolia, China. Environ. Earth Sci. 2002, 79, 203. [Google Scholar] [CrossRef]
  55. Wang, S.; Pan, C.; Xie, D.; Xu, M.; Yan, Y.; Li, X. Grain size characteristics of surface sediment and its response to the dynamic sedimentary environment in Qiantang Estuary, China. J. Sediment. Res. 2022, 37, 457–468. [Google Scholar] [CrossRef]
  56. Cui, R.; Xia, D. The relationship between costal morphology and the characteristics of waves and tides of Shandong Peninsula. J. Oceanogr. Huanghai Bohai Seas. 1992, 010, 20–25. [Google Scholar]
  57. Mazzullo, J.M.; Alexander, A.; Tieh, T.T.; Menglin, D. The effects of wind transport on the shapes of quartz silt grains. J. Sediment. Res. 1992, 62, 961–971. [Google Scholar]
  58. Mazzullo, J.M.; Sims, D.; Cunningham, D. The effects of eolian sorting and abrasion upon the shapes of fine quartz sand grains. J. Sediment. Petrol 1986, 56, 45–56. [Google Scholar]
  59. Xu, Z.; Xu, N.; Wang, H. Effect of particle shapes and sizes on the minimum void ratios of sand. Adv. Civ. Eng. 2019, 2019, 5732656. [Google Scholar] [CrossRef]
  60. Sarkar, D.; Goudarzy, M.; König, D.; Wichtmann, T. Influence of particle shape and size on the threshold fines content and the limit index void ratios of sands containing non-plastic fines. Soils Found. 2020, 60, 621–633. [Google Scholar] [CrossRef]
  61. de Bono, J.; McDowell, G. The effects of particle shape on the yielding behaviour of crushable sand. Soils Found. 2020, 60, 520–532. [Google Scholar] [CrossRef]
  62. Folk, R.L. Stages of textural maturity in sedimentary rocks. J. Sediment. Res. 1951, 21, 127–130. [Google Scholar] [CrossRef]
  63. Folk, R.L.; Ward, W.C. Brazos River bar: A study in the significance of grain size parameters. J. Sediment. Petrol 1957, 27, 3–26. [Google Scholar] [CrossRef]
  64. Walling, D.E. Tracing suspended sediment sources in catchments and river systems. Sci. Total Environ. 2005, 334, 159–184. [Google Scholar] [CrossRef] [PubMed]
  65. Walling, D.E.; Woodware, J.C. Tracing sources of suspended sediment in river basins: A case study of the River Culm Devon UK. Mar. Freshwater Res. 1995, 46, 327–336. [Google Scholar] [CrossRef]
  66. Li, Z.; Xu, X.; Zhang, Y.; Wang, K. Fingerprinting sediment sources in a typical karst catchment of southwest China. Int. Soil Water Conserv. Res. 2020, 8, 277–285. [Google Scholar] [CrossRef]
  67. Patault, E.; Alary, C.; Franke, C.; Abriak, N. Quantification of tributaries contributions using a confluence-based sediment fingerprinting approach in the Canche river watershed (France). Sci. Total Environ. 2019, 668, 457–469. [Google Scholar] [CrossRef] [PubMed]
  68. Manjoro, M.; Rowntree, K.; Kakembo, V.; Foster, I.; Collins, A. Use of sediment source fingerprinting to assess the role of subsurface erosion in the supply of sine sediment in a degraded catchment in the Eastern Cape, South Africa. J. Environ. Manag. 2017, 194, 27–41. [Google Scholar] [CrossRef] [PubMed]
  69. Kaal, J.; Cortizas, A.; Mateo, M.; Serrano, O. Deciphering organic matter sources and ecological shifts in blue carbon ecosystems based on molecular fingerprinting. Sci. Total Environ. 2020, 742, 140554. [Google Scholar] [CrossRef]
  70. Santarelli, C.; Fröhlich, J. Direct numerical simulations of spherical bubbles in vertical turbulent channel flow.Influence of bubble size and bidispersity. Int. J. Multiphase Flow 2016, 81, 27–45. [Google Scholar] [CrossRef]
  71. Shenoy, A.R.; Kleinstreuer, C. Flow over a thin circular disk at low to moderate Reynolds numbers. J. Fluid Mech. 2008, 605, 253–262. [Google Scholar] [CrossRef]
Figure 1. Location map of sediment sampling. W01–W12 and S01–S11 are the surface sediment samples at the backshore of each transection in Dong’ao Bay and Sigengsha; Su01–Su11 are the surface sediment samples at underwater in each transection of Sigengsha.
Water 15 02680 g001
Figure 2. The samples morphology volume distribution curves: (a) size, (b) sphericity, (c) aspect ratio and (d) symmetry.
Water 15 02680 g002
Figure 3. Box-and-whisker plots for all parameters of particle size (a), particle shape (bd) and diversity indices (ef).
Water 15 02680 g003
Figure 4. Heatmap of Pearson correlation coefficient of particle morphology distribution parameters and diversity indices. The correlation coefficient of p > 0.05 is hidden. Abbreviation: VMD, volume mean diameter; VMS, volume mean sphericity; VMA volume mean aspect ratio; VMSy, volume mean symmetry; SD, standard deviation; Sp, sphericity; As, aspect ratio; Sy, Symmetry; −Vol, based on volume; −Num, based on number.
Water 15 02680 g004
Figure 5. Correlation diagram for significant relations among distribution parameters and diversity indices of particle size, sphericity, aspect ratio and symmetry.
Water 15 02680 g005
Figure 6. RDA triplots of morphology parameters, diversity indexes and sediment samples.
Water 15 02680 g006
Figure 7. The cluster of particles morphology volume distribution for the measured samples: (a) size, (b) sphericity, (c) aspect ratio and (d) symmetry.
Water 15 02680 g007
Figure 8. The cluster of particle morphology number distribution for the measured samples: (a) size, (b) sphericity, (c) aspect ratio and (d) symmetry.
Water 15 02680 g008
Figure 9. The samples morphology number distribution curves: (a) size, (b) sphericity, (c) aspect ratio and (d) symmetry.
Water 15 02680 g009
Figure 10. Principal coordinate analysis (PCoA) of the particle morphology distribution (based on number): (a) size, (b) sphericity, (c) aspect ratio and (d) symmetry.
Water 15 02680 g010
Figure 11. Principal coordinate analysis (PCoA) of the particle morphology distribution (based on volume): (a) size, (b) sphericity, (c) aspect ratio and (d) symmetry.
Water 15 02680 g011
Figure 12. The differences in Shannon indices of morphology. (a) Shannon indices based on particle morphology number distribution; (b) Shannon indices based on particle morphology volume distribution.
Water 15 02680 g012
Figure 13. Scatter plots constructed from the first and second discriminate functions calculated using stepwise discriminant function analysis (DFA).
Water 15 02680 g013
Figure 14. Principal coordinate analysis (PCoA) of the Sigengsha samples based on the composite fingerprint.
Water 15 02680 g014
Figure 15. The cluster of particles composite fingerprint for the backshore and underwater samples.
Water 15 02680 g015
Table 1. Morphology distribution parameters and alpha diversity indices of the measured 23 particle samples. Abbreviation: M, mean value; SD, standard deviation; Ku, kurtosis; Sk, Skewness; Shannon-Vol is the volume based on volume abundance; Shannon-Num is the number based on number abundance, as well as the Simpson index.
Diversity Index
SizeSphericityAspect RatioSymmetry
Distribution parametersSize0.883 **0.414 **0.387 **0.126 **
Sphericity0.081 *0.072 **0.033 *0.003
Aspect ratio0.0140.016 *0.0090.000
Symmetry0.0450.068 **0.064 **0.010
All morphology0.935 **0.246 **0.226 **0.139 **
Note: Pearson’s coefficients were calculated and their significances were tested based on 999 permutations. * p < 0.05 and ** p < 0.01.
Table 2. Eigenvalues for RDA axis and morphology parameters–diversity indexes correlation.
StatisticAxis 1Axis 2Axis 3Axis 4
Eigenvalues0.8640.0700.0150.006
Explained (cumulative)90.0797.4098.9399.54
Morphology parameters–diversity indexes correlation0.9870.9580.8400.749
Disclaimer/Publisher’s Note: The statements, opinions and data contained in all publications are solely those of the individual author(s) and contributor(s) and not of MDPI and/or the editor(s). MDPI and/or the editor(s) disclaim responsibility for any injury to people or property resulting from any ideas, methods, instructions or products referred to in the content.

