Article

An Event-Based Resilience Index to Assess the Impacts of Land Imperviousness and Climate Changes on Flooding Risks in Urban Drainage Systems

1
Department of Civil and Environmental Engineering, Colorado State University, Fort Collins, CO 80521, USA
2
Department of Atmospheric Sciences, University of Utah, Salt Lake City, UT 84112, USA
3
School of Civil Engineering, Shandong University, Jinan 250061, China
4
Department of Civil, Construction and Environmental Engineering, University of Alabama, Tuscaloosa, AL 35487, USA
*
Author to whom correspondence should be addressed.
Water 2023, 15(14), 2663; https://doi.org/10.3390/w15142663
Submission received: 8 May 2023 / Revised: 17 July 2023 / Accepted: 17 July 2023 / Published: 23 July 2023
(This article belongs to the Special Issue Urban Stormwater Control, Utilization, and Treatment)

Abstract

:
Assessing the resilience of urban drainage systems requires the consideration of future disturbances that will disrupt the system’s performance and trigger urban flooding failures. However, most existing resilience assessments of urban drainage systems rarely consider the uncertain threats from future urban redevelopment and climate change, which leads to the underestimation of future disturbances toward system performance. This paper fills in the gap of assessing the combined and relative impacts of future impervious land cover and rainfall changes on flooding resilience in the context of a densely infilled urban catchment served by an urban drainage system in Salt Lake City, Utah, USA. An event-based resilience index is proposed to measure climate change and urbanization impacts on urban floods. Compared with the traditional resilience metric, the event-based resilience index can consider climatic and urbanized impacts on each urban flooding event; the new resilience index assist engineers in harvesting high-resolution infrastructure adaptation strategies at vulnerable spots from the system level to the junction level. Impact comparison for the case study shows that impervious urban surface changes induce greater effects on the system performance curves by magnifying the maximum failure level, lengthening the recovery duration, and aggravating the flooding severity than rainfall intensity changes. A nonlinear logarithmic resilience correlation is found; this finding shows that flooding resilience is more sensitive to the land imperviousness change due to urban redevelopment than rainfall intensity changes in the case study. This research work predicts the system response to the disturbances induced by climate change and urban redevelopment, improving the understanding of impact analysis, and contributes to the advancement of resilient urban drainage systems in changing environments.

1. Introduction

Urban drainage systems (UDSs) are vital stormwater infrastructures to discharge surface runoff into receiving water bodies to prevent urban sewer overflow and street inundation and secure public safety [1]. However, most of the existing UDSs are designed on the basis of historical climate statistics and maintained by the assumption of the constant urban land surfaces [2]. These conventional designs will be likely to over-estimate the reliability of UDSs that consequently become vulnerable to future external or internal failures or disturbances, such as extreme rainfall, urban impervious cover changes, sewer sedimentation, equipment malfunction, manhole collapse, and pipe blockage [3,4,5]. The concerns for performance deterioration in traditional UDSs are rising in metropolitan areas since the severity of flooding is predicted to continue or be aggravated due to future climate and land cover change [6,7,8].
Resilience, as an emerging concept, was first proposed in the ecology field [9] and entered into the engineering field as a way to improve system performance [10]. Ecological resilience is defined as a system’s ability to maintain basic performance by absorbing shocks or disturbances when dealing with ecosystem dynamics [11]. In contrast, engineering resilience is defined as the capacity to reduce the magnitude and duration of intentional disruptive events by proceeding through 4 phases, namely the preparation phase, withstanding phase, restoration phase, and adaptation phase [12,13,14]. As such, the resilience applied in stormwater engineering can be interpreted as designing an urban drainage infrastructure from ‘fail-safe’ (minimizing failure probability) to ‘safe-to-fail’ (minimizing the failure consequences), which embraces the inevitability of unforeseen threats [15,16,17,18].
Incorporating resilience into UDSs is of great importance to mitigate flooding threats or disturbances, recover from system failure due to unexcepted increases in flooding volume, avoid system operational service outages, and minimize costs and damages to the cities that they serve. Ref. [19] quantified the UDSs resilience to attenuate the nodal flooding volume by 6% to 10% and flooding duration by 18% to 38%, finally to improve the system resilience by 9.5% for residential cases in the United Kingdom. Nodal flooding refers to the overflow volume from each node in the SWMM model. The mean nodal flooding volume equals the sum of all nodes’ overflow volume divided by the number of flooded nodes in the drainage system. In a case study in Kampala City, Uganda, the resilience assessment was employed to explore the functional and structural functionality loss for failure modes [20]. Ref. [21] investigated the possibility of increasing the system resilience in the Daerim sewer network in Seoul City, South Korea. They found that the new operating method can enhance resilience by 200%, measured by the newly developed resilience index. Ref. [22] articulated that the resilience-based UDSs rehabilitation approach is able to reduce flooding volume by nearly 100% with a 23% reduction in investment costs compared with the conventional design of the Tehran City UDSs in Iran. Ref. [23] proposed a grid cell-based resilience metric to evaluate the two-dimensional surface flooding resilience at the catchments of Dalian City, China. Although their resilience assessment approach facilitates developing climatic adaptation strategies under a 100-year return period rainfall event, the assumption of landscape features, on the one hand, diminishes urbanization impacts on the accuracy of simulating runoff-routing processes. On the other hand, their work omits the future climate influences on pipe flow dynamics in UDSs.
It has been documented that flooding failure in UDSs is exacerbated by climatic uncertainty in rapidly growing and highly infilled circumstances [24,25]. Climate change is the forcing factor on shifting hydrometeorological patterns, intensifying rainfall, and increasing the size of storm event volume, which exposes UDSs to increased flooding volume and duration [2,26]. It is impossible to overcome flooding failure without considering the effects of ongoing rainfall changes [27]. Even if the low-developed or non-developed areas have high previous land coverage, they still have limited capabilities for completely intercepting the extreme rainfall volume. The flooding failure scenario is further augmented by the land cover changes due to urban redevelopment, which amplifies the runoff volume and discharges burdens on UDSs. The human-induced urban redevelopment (urban infill or redeveloping infill), as a form of urbanization, transforms single-family housing into multi-family housing and taller apartments, and such that the lower density land cover is redeveloped into higher density with a greater fraction of impervious land surfaces [28]. During the urban redeveloping process, urban runoff is less likely to be infiltrated and absorbed by the soil and runs into UDSs and overtops system conveyance and storage capacity [29,30,31,32].
To maintain the system services and prevent drainage system failures, it is critically important to minimize flooding consequences affected by climate change and land cover change due to urban redevelopment [33,34,35,36,37,38,39]. Only a few case studies have conducted flooding resilience analysis considering the climate or land cover changes. For instance, [40] revealed that the climatic impacts reduced system resilience from 18.4% to 33.1% more than ‘business-as-usual scenarios’ in Shanghai City, China. Ref. [41] compared variations in flooding resilience under a range of land cover change and climate change scenarios in Kunming City, China. However, their work is based on empirical interpolation, and no quantitative projections are explicitly introduced into designing future scenarios, which might bring more uncertainty to future flooding resilience assessment. Similar methods are also applied in prior studies, which estimate impacts on urban flooding by using hypothetical increments of future precipitation or by empirical estimation of imperviousness trends in Europe [42,43]. We summarized that effects induced by climate change and urban redevelopment on system failure are merely reflected in an unreliable way. The methodological gap in quantifying the impacts of impervious surfaces due to urban infill and climate change on future flooding resilience still exists.
To that end, this study aims to develop an approach to comprehensively assess the combined and relative effects of future urban redevelopment (urban infill or infill development) and climate change on flooding resilience by the quantitative computation of future rainfall intensity and urban imperviousness percentage at different projected stages. Considering the climate change factor in the proposed resilience index incorporates the intensity and frequency (return period) of rainfall events, the resultant resilience computation in this study thus reflects the effects of flood frequency. An urban drainage model based on the real-world UDS located in Salt Lake City, Utah, USA, is used to simulate the future impacts on flooding resilience. The results of this study are discussed to improve the understanding of climate and land cover changes upon urban flooding and are expected to help stakeholders and decision-makers to plan for altered system performance from future threats.

2. Methodology

Future scenario analysis using a rainfall-runoff model is useful and favorable for evaluating the impacts upon watershed flooding across a range of combinations of urban surface and rainfall changes at different temporal stages [44]. This study adopts the SWMM (Storm Water Management Model) model [45] to simulate the catchment-scale urban flooding events that will occur under an ensemble of future rainfall events and urban infill scenarios within one historical period, 2001–2015 and one future period, 2085–2099. The event-based simulation outcome obtained from SWMM is then further analyzed to quantify the resilience index using the equations proposed in this study. The consequent flooding resilience under different designed future scenarios is computed to characterize the impacts of land imperviousness and climate changes upon the system performance.

2.1. The Study Area

The case study catchment for this study has an area of 0.8 km2 and is located in the Sugar House neighborhoods, Salt Lake City, Utah, USA, shown in Figure 1. The region has a semi-arid climate with an average annual rainfall depth of 412 mm in the past 30 years [46]. Summers are hot and dry, while winters are cold and wet. More than 85% of the yearly rain falls from December to May, and less than 10% of rain occurs from June to September. The seasonality of rainfall events makes the local hydrological regimes uncertain.
The studied area is a typical example of rapid urban redevelopment due to economic boom and population growth, which has altered the land-use land-cover features. The urban redeveloping projects are accelerating urban landscapes from less impervious to highly impervious surfaces. Currently, Sugar House is expected to be redeveloped for commercial or mixed-residential/commercial districts, including middle-rise multi-family housing, high-rise apartment buildings, and middle-rise shopping stores [31,47]. Urban redevelopment, in general, increases the percentage of impervious areas, which constitute relatively poorly draining surfaces [48]. Due to the low infiltration capacity of impervious land, the amount of rainfall entering groundwater is reduced, and the amount entering the stormwater collection system is increased, resulting in increased frequency and magnitude of flow over-loading in the drainage pipes.
The existing drainage infrastructure is a mixture of closed circular or rectangular corrugated metal and reinforced concrete pipes with a length of approximately 5.6 km and ages varying from 20 to 70 years old. Most of these pipes are old segments, which should be considered for rehabilitation or replacement. A SWMM model to represent the physical drainage system in the study area is developed (Figure 1). This model is composed of 28 sub-catchments, 184 conduits, 181 junctions, and six outfalls and is driven by one rainfall gauge. Additional detailed information on the SWMM model is listed in Table 1.

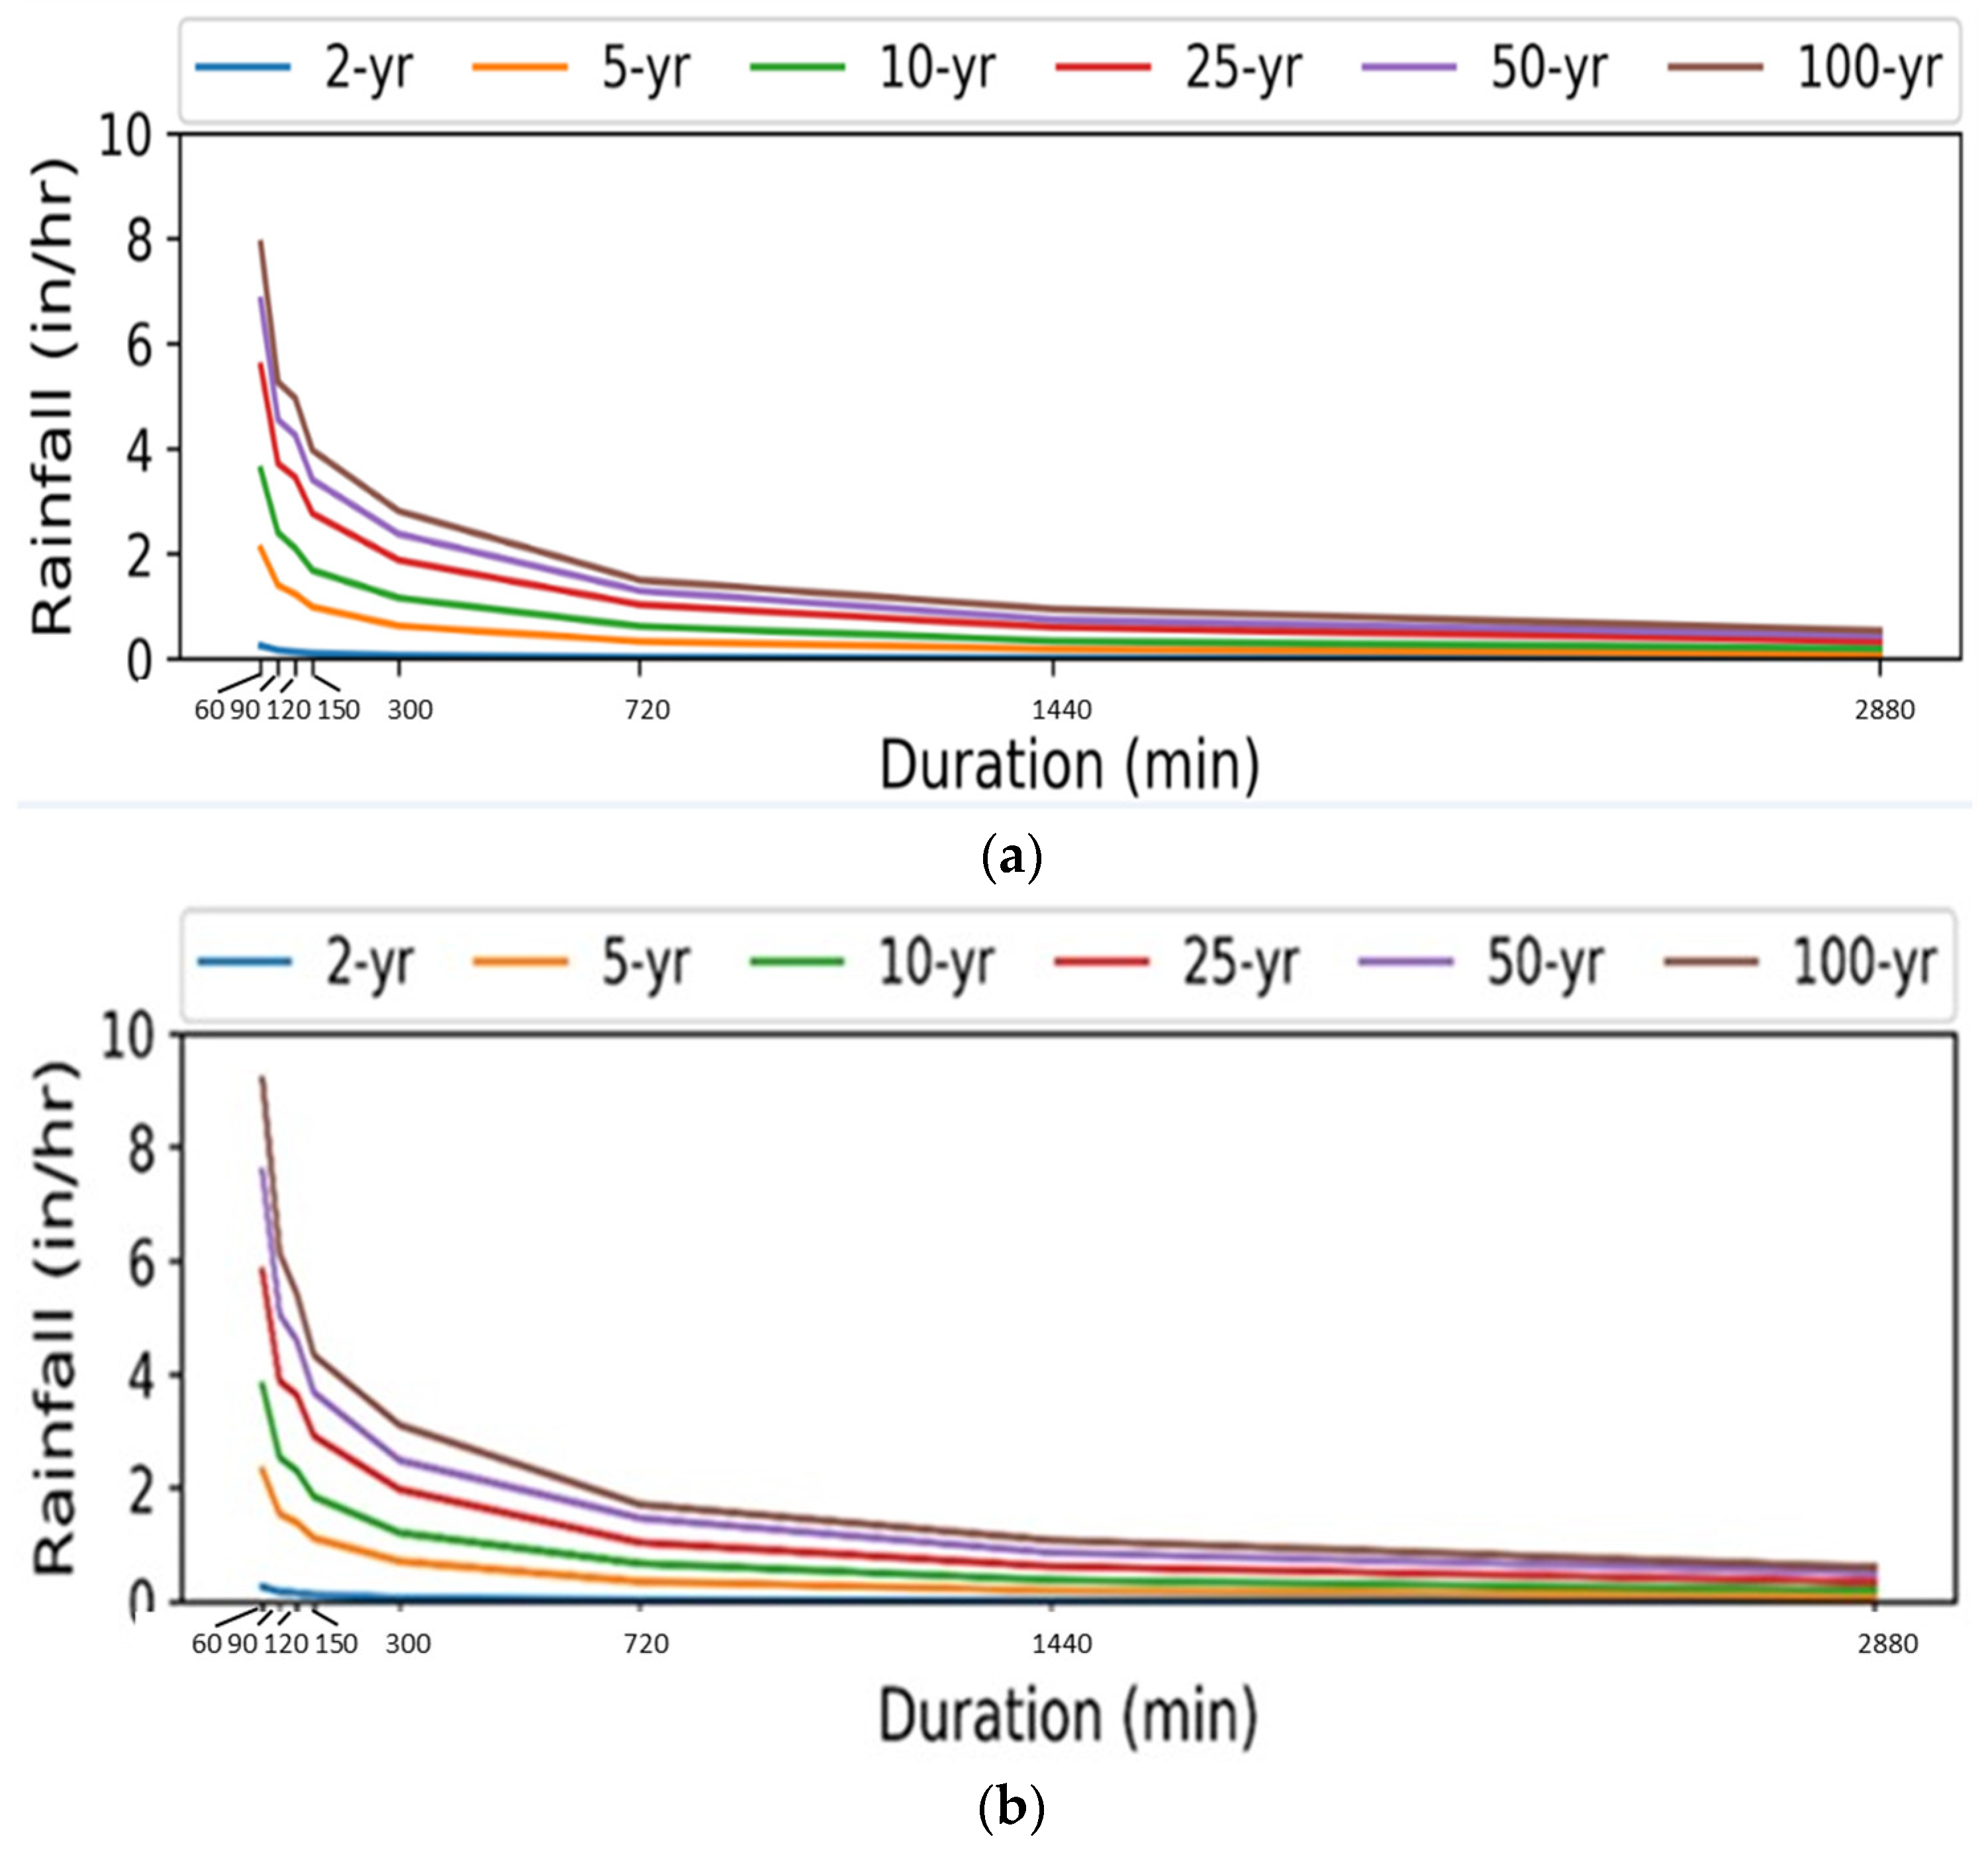
2.2. Baseline and Future Rainfalls

2.2.1. Observed Rainfall Data

Rainfall was acquired for the weather station located at the Salt Lake City international airport (gauge operated by the National Center for Environmental Information of the U.S. NOAA (National Oceanic and Atmospheric Administration). This station has a precipitation gauge, which is equipped with three load cell sensors to provide three independent measurements of depth change (in millimeters) at 5-min intervals. The three series of 5-min values are then used to derive the official hourly precipitation value from 1941 to 2020, with 92% data coverage [49]. The station is about 10 km away from the study area, and data from this station is considered representative because it has similar patterns to the average annual rainfall at other nearby stations. Precipitation observations from 2001 to 2015 are used as the reference period (baseline scenario) in this study. We do not use precipitation from the cold months (October to April) when it may be in the form of snow. The remaining rains are separated by a 6-h minimum inter-event time (MIET) by exploratory trials of the coefficient of variation, which is the ratio of rain measurements standard deviation to mean [50,51].

2.2.2. Climate Change and Downscaling Methods

The Global Circulation Model (GCM) from the fifth phase of the Coupled Model Intercomparison Project (CMIP5) is a common data source for projected future climate conditions in response to Greenhouse Gas (GHG) emission forcing [52,53]. The GCM future projections are under the radiative forcing level of the climate systems for RCP (Representative Concentration Pathway). These future precipitations have a temporal resolution of 1 day and a spatial resolution of approximately 12 km grids. This study focuses on two GHG forcing scenarios (RCP 4.5 and 8.5) for addressing the anthropogenic climate impacts on the Sugar House neighborhood, which is in line with future flooding mitigation studies [6,54]. It should be noted that this study is not a comprehensive climate change study, so other RCP scenarios are not considered. Some GCMs are unable to simulate the regional scale and long-term climate variabilities, which are important drivers to reflect the realistic projection under GHG forcing; poorly performed GCMs may contain large GCM errors and uncertainties. Based on the study of Smith et al. [55] of 33 GCMs, this study uses the CCSM 4.1 model because it is identified as one of the best for representing precipitation in this area. The selection of the GCM model depends on (i) the limited temporal length of the simulation period (not all models provide projections until 2099); (ii) the restricted temporal resolution (not all models have daily or hourly precipitation); (iii) the constrained connection between local climatic variability and precipitations (strong connection reflect the regional climates more realistically). The CCSM 4.1 model is used to extract the daily precipitation projections herein.

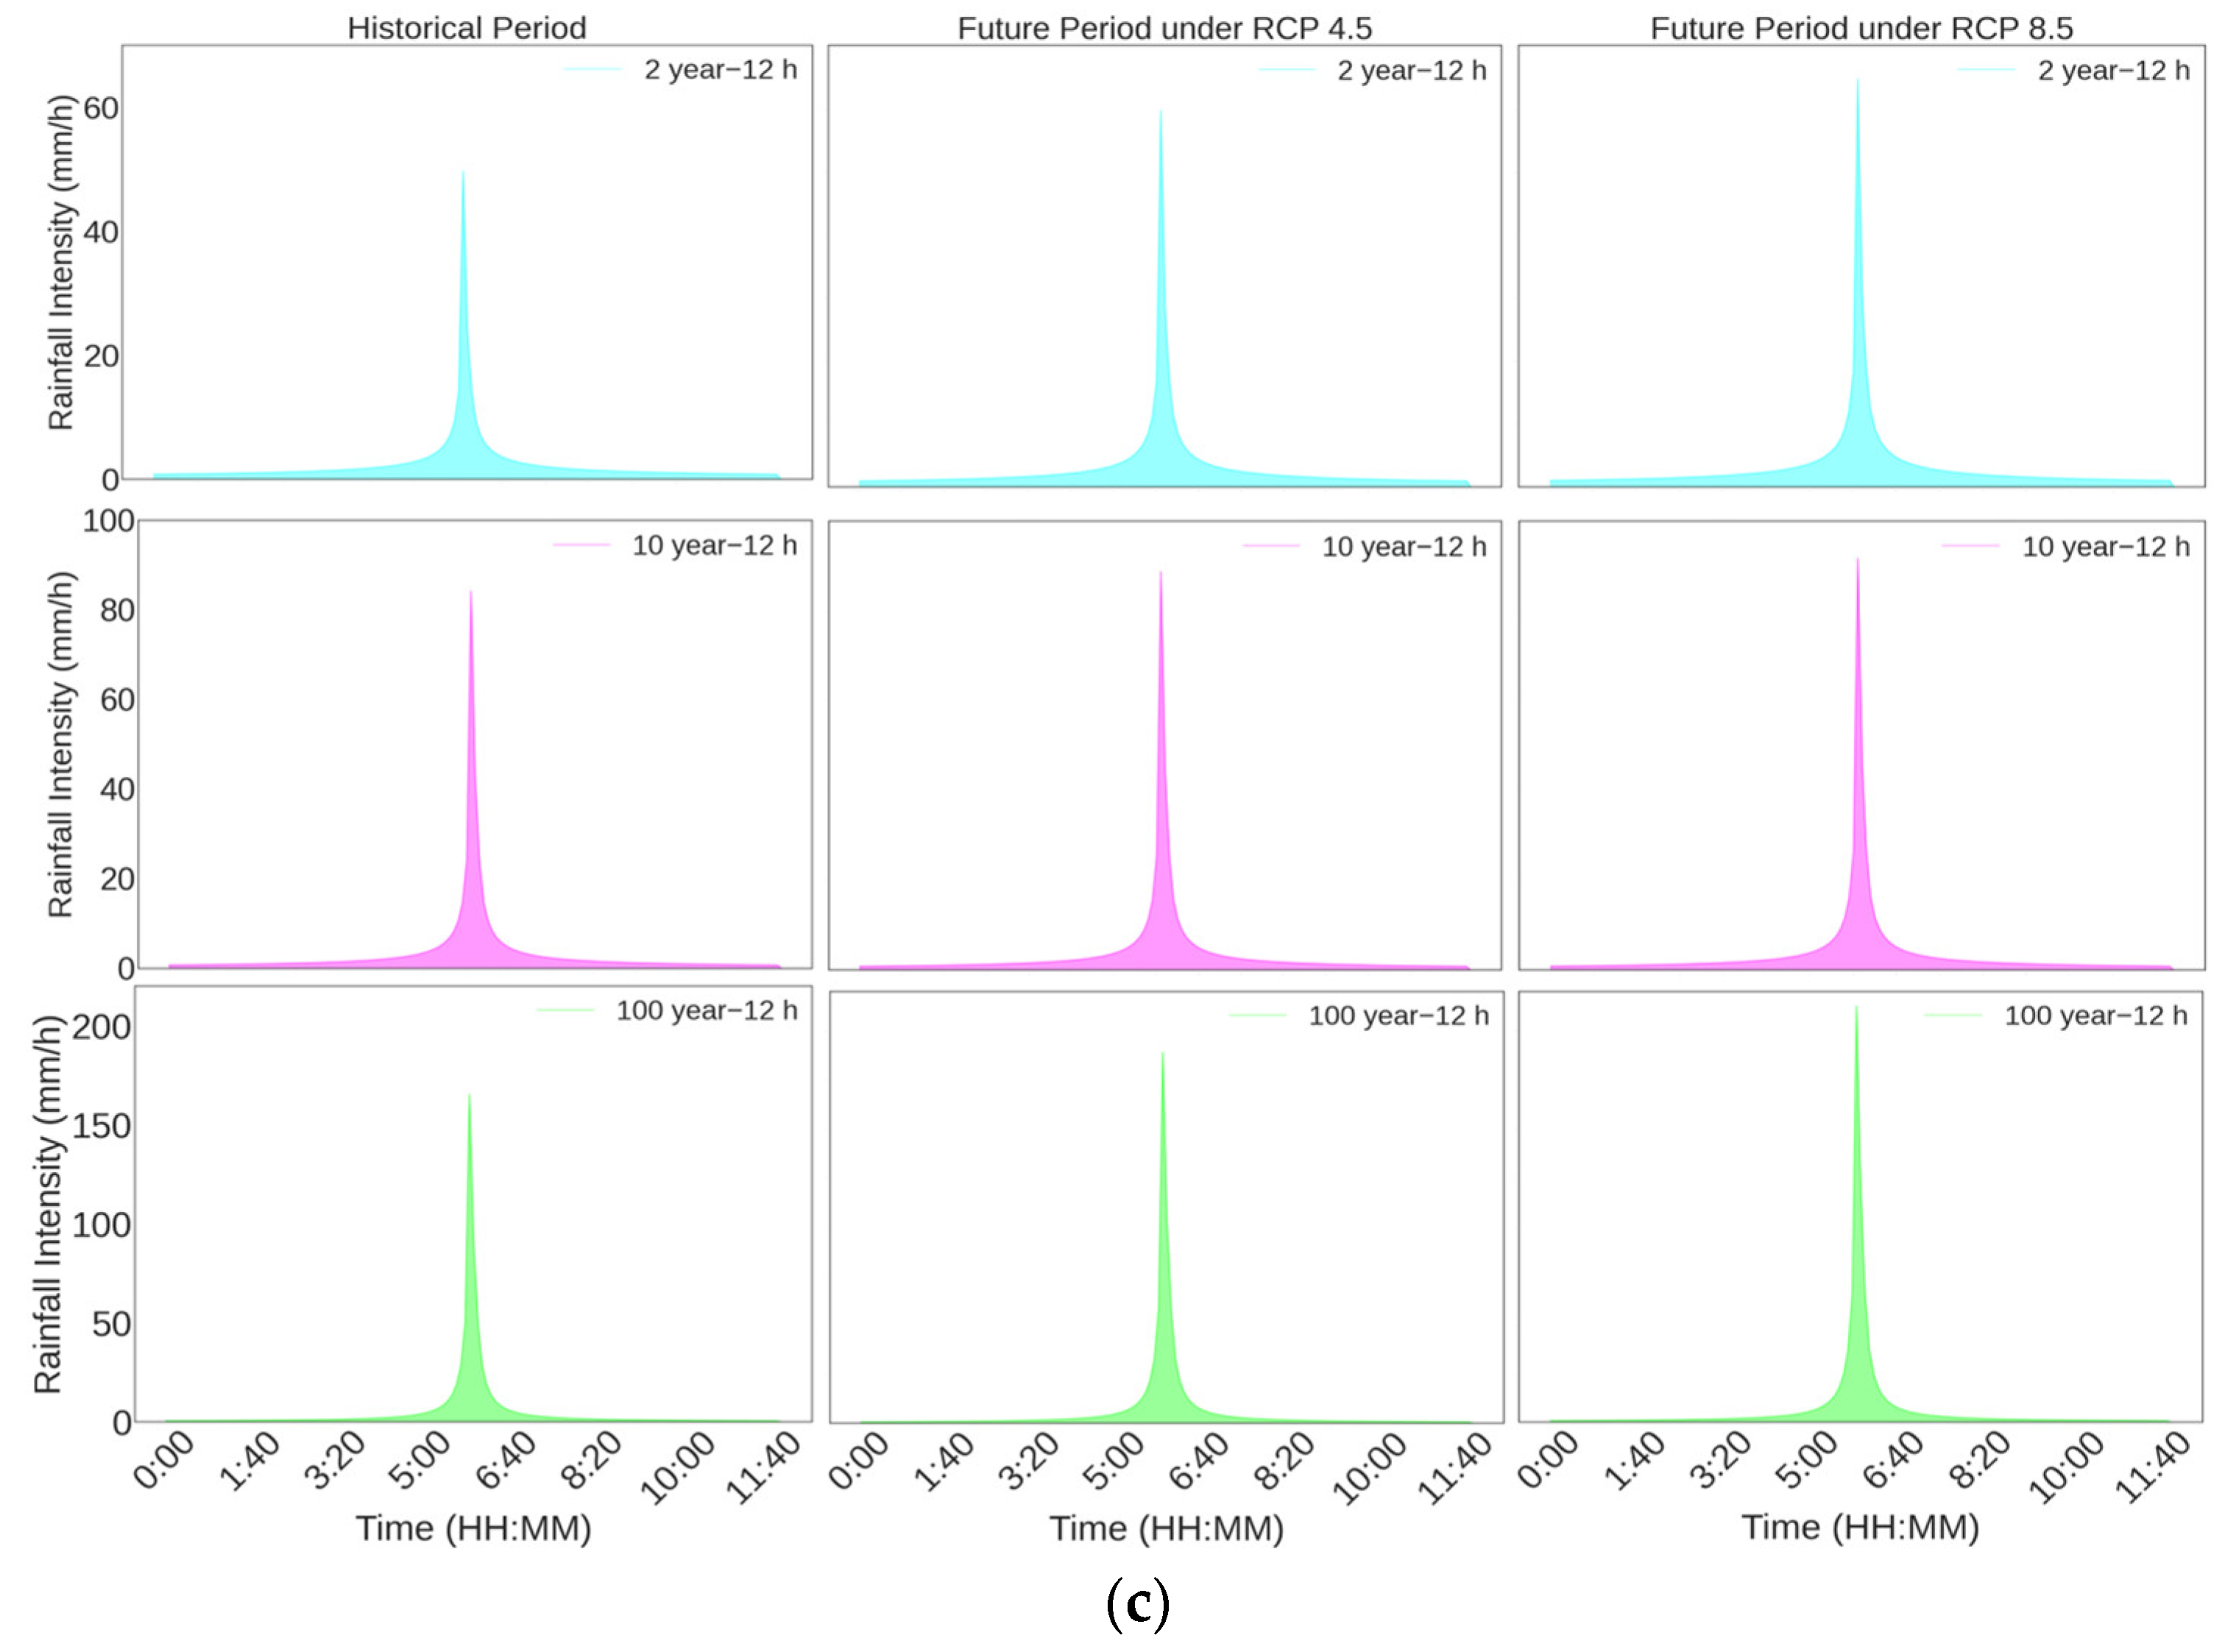
2.2.3. Future Rainfalls

Those post-processed future rainfall projections are used in a change factor approach to estimate the future rainfall intensity with a duration of 12 h and return periods ranging from 1 to 200 years. The simple Delta Change approach, which has been widely used in climate change impacts studies [56,57,58], is applied to generate future climatic factors. The resultant change factors, which are the percentage change between the future rain values ( R a i n t f , T ) and the baseline rains ( R a i n b a s e l i n e , T ), are used to speculate future rainfall frequency information in Equation (1) [59,60,61]. By multiplying this transition factor ( F t f , T ) with the rainfall intensity–duration–frequency (IDF) curves derived from the historical rain measurements ( I B a s e l i n e , T ), the climate change scenarios ( I t f , T ), for different return periods (T) are obtained in Equation (2). The consequential future rainfall IDF curves information are visualized in Figure 2a for RCP 4.5 and Figure 2b for RCP 8.5. The largest rainfall transition ratio is from the RCP 4.5 to the RCP 8.5 during the future period 2085–2099. RCP 4.5 and 8.5 are representative timelines for the early and late ages of the 21st century. These future IDF curves are used to generate the future artificially designed rainfalls. In Figure 2c, the rainfall events with 12-h duration and 2-, 10-, and 100- return periods are selected, since these periods are representative as they include various rainfall characteristics ranging from small (annual precipitation exceedance probability of 50%), medium (annual precipitation exceedance probability of 10%), and large (annual precipitation exceedance probability of 1%) storm events for baseline and future periods. Taking the 100-year return period as an example, the peak intensities are 165 mm/h, 198 mm/h, and 228 mm/h for the historical period, the future period under RCP 4.5, and the future period under RCP 8.5, respectively. These rainfall intensities are significantly higher than expectation, probably due to the erroneous uncertainties from the climate model. Future work should address this issue raised from data and model uncertainty. Nevertheless, given the same return period, the peak rainfall intensity, which is projected to increase by 29% from 2001 to 2099, is still reasonable.
F t f , T = 1 + R a i n t f , T R a i n b a s e l i n e , T R a i n b a s e l i n e , T  
I t f , T = I B a s e l i n e , T × F t f , T

2.3. Urban Redevelopment and Future Imperviousness

Historical land cover aerial images from the U.S. Geological Survey’s Earth Explorer and the Utah Geological Survey Aerial Imagery are collected and classified by using the object-based analyst tool PCI Geomatica [47]. The classified images show the past 81-year (1931–2018) changes in land imperviousness percentages, which are regressed by three functions, including linear, two-order polynomial, and logarithmic functions. These three mathematical equations are widely used to predict imperviousness percentages and are also useful to develop future urban redevelopment scenarios in prior studies [29,37,62,63,64]. In Figure 3, The two-order polynomial function has the best regressing performance with a coefficient of determination (R2) of 0.84, but the classification accuracy is the lowest of all. Although linear regression has acceptable regression outcomes with the highest coefficient of determination (R2) over 0.75, 100% over-fitting issues might occur in projecting years. Therefore, we adopted the logarithmic regression curve with an R-square value of 0.79 to quantify the future imperviousness changes. With this logarithmic function, the average imperviousness percentage for the future period is estimated to be 91%, respectively. The average imperviousness percentage in the baseline period (2001–2015) is extrapolated to be 71%. These predicted imperviousness values generally coincide with findings that urbanization will trigger about 20% land cover imperviousness change by the end of the 21st century [65,66]. The boxplots in Figure 4 show the statistical changes in subcatchment imperviousness percentages, such as the mean, median, minimum, and maximum values, and the sub-catchment imperviousness is calculated by using DCIA (Directly Connected Imperviousness Area—a percentage value) equation from the U.S. Environmental Protection Agency (EPA) [67].

2.4. Future Scenarios

With the projected climate and urbanization impacts, we simulate future urban flooding by running SWMM with a range of imperviousness and rainfall inputs. The simulations are categorized into three sections: one baseline (2001–2015) and two future (2085–2099 RCP 4.5 and 8.5) scenarios. Given the same urban redeveloping scenario, nine future rainfalls with 2-, 10-, and 100-year returns consist of climatic changes. In sum, there are 27 modeling experiments to represent the individual and combined impacts under different rainfall events, shown in Table 2. In Table 2, simulations along the column represent the climatic impacts on urban flooding, while groups along the row represent the urban redeveloping influences on urban flooding. The modeling experiments under 100-year rainfall events are selected to demonstrate the impacts upon flooding resilience, while other modeling scenarios are used to compare the traditional resilience index with the proposed resilience metric.

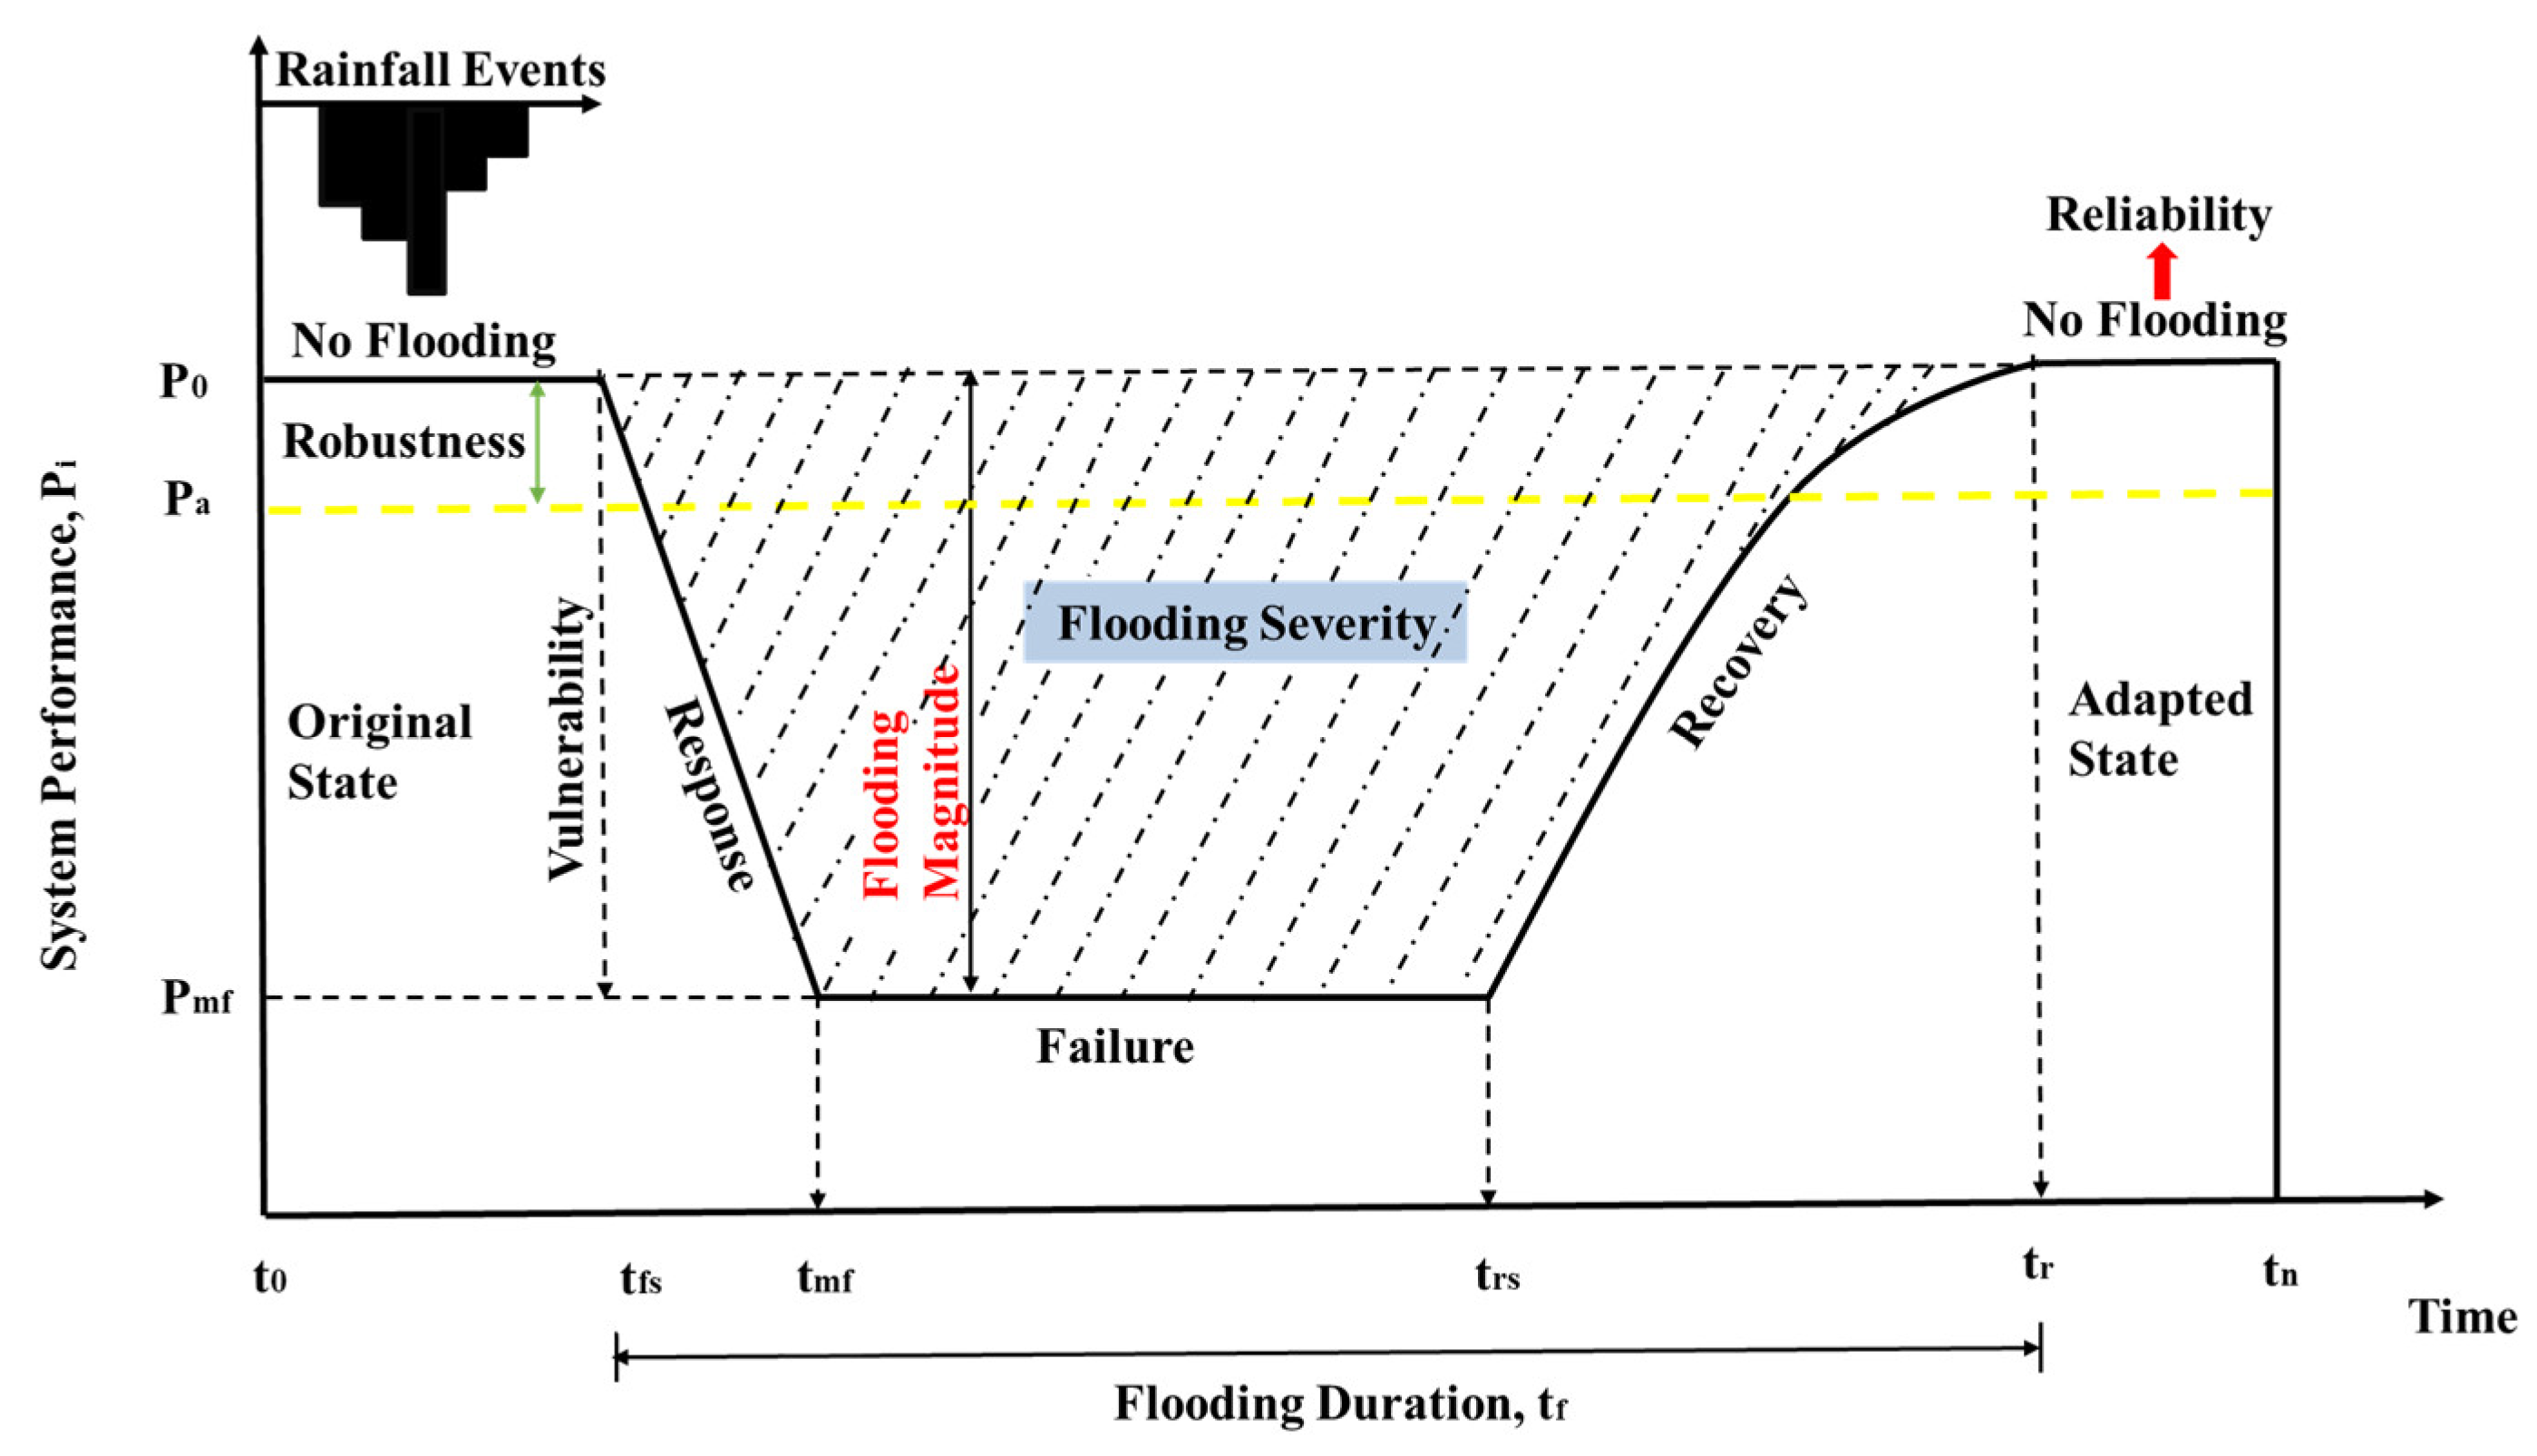
2.5. Flooding Resilience Index

Prior studies compute flooding resilience by using a concept of flooding severity as a function of both the flooding magnitude (total flood volume) and duration (mean nodal flood duration) [68,69]. The flooding severity is quantitatively represented as the shaded trapezoidal area (Figure 5) between the original system performance level, P o and the actual system performance curve, P i ( t ) , at any time t after the occurrence of a given threat (extreme storm) that leads to system failure. The shaded rectangular area in Figure 5 can be calculated by Equation (3), which has been simplified to Equation (4) to approximate the flooding severity. Figure 5, the black solid horizontal line, P o represents the original (design) performance level of service. The yellow dotted line, P a stands for a lower but acceptable level of service. Pmf means the maximum system failure level resulting from the considered threat. t 0 is the time of occurrence of the threat, and t n is the total simulated elapsed time. The system response is featured as the falling limb of the performance curve, and the flooding magnitude is quantified as the distance from the original system performance level, P o   to the worst performance level (the maximum system failure level or lowest system performance level), Pmf the slope from the maximum system failure level to the original performance level is defined as the recovery rate.
S e v i = f S e v p ,   t f = 1 P 0 t 0 t n ( P 0 P i ( t ) ) d t
where t f is the failure duration; t 0 is the time of occurrence of the threat; and t n is the total modeling time.
S e v i = V T F V T 1 × t r   t f s t n t o = V T F V T 1 × t f t n
R e s 0 = 1 S e v i = 1 V T F V T 1 × t f t n
where V T F is the total flood volume; V T 1 is the total inflow into the system; t f is the mean duration of nodal flooding, and t n is the total simulation time.
Traditionally, the flooding resilience index R e s 0 is estimated as one minus the computed volumetric flooding severity, shown in Equation (5). However, the traditional flooding resilience R e s 0 has limitations in adopting mean nodal flooding duration to represent the system flooding duration. Firstly, the mean nodal flooding duration is an empirical flooding duration computation. When the nodal flooding duration is not statistically uniform, a mean value might not be representative of all nodes’ flooding duration. Secondly, complicated drainage networks have floods not only in nodes but also in other elements, such as outfalls and storage tanks. The ignorance of flooding duration in other structures would lead to the underestimation of the flooding duration. Thirdly, although traditional flooding resilience has wide applications in an individual flooding event, few studies are computing the R e s 0 under future urban and climate scenarios. To address these concerns, this study explores the potential of using the system average event flooding duration to replace the mean nodal flooding duration for computing the new flooding resilience. In this way, the t f in Equations (4) and (5) would be the mean duration of a series of flooding events to derive Equations (6) and (7) from calculating the event flooding severity S e v e f s and event flooding resilience R e s e f r , respectively. The R e s e f r ranges from 0 to 1. A zero R e s e f r indicates the lowest level of resilience, while one is the highest-level resilience to the considered flooding failure scenarios.
S e v e f s = V T F V T 1 × t r t f s t n t o = V T F V T 1 × t F t n
R e s e f r = 1 S e v i = 1 V T F V T 1 × t F t n
where V T F is the total flood volume; V T 1 is the total inflow into the system; t F is the mean duration of the event flooding, and t n is the total simulation time.

3. Results

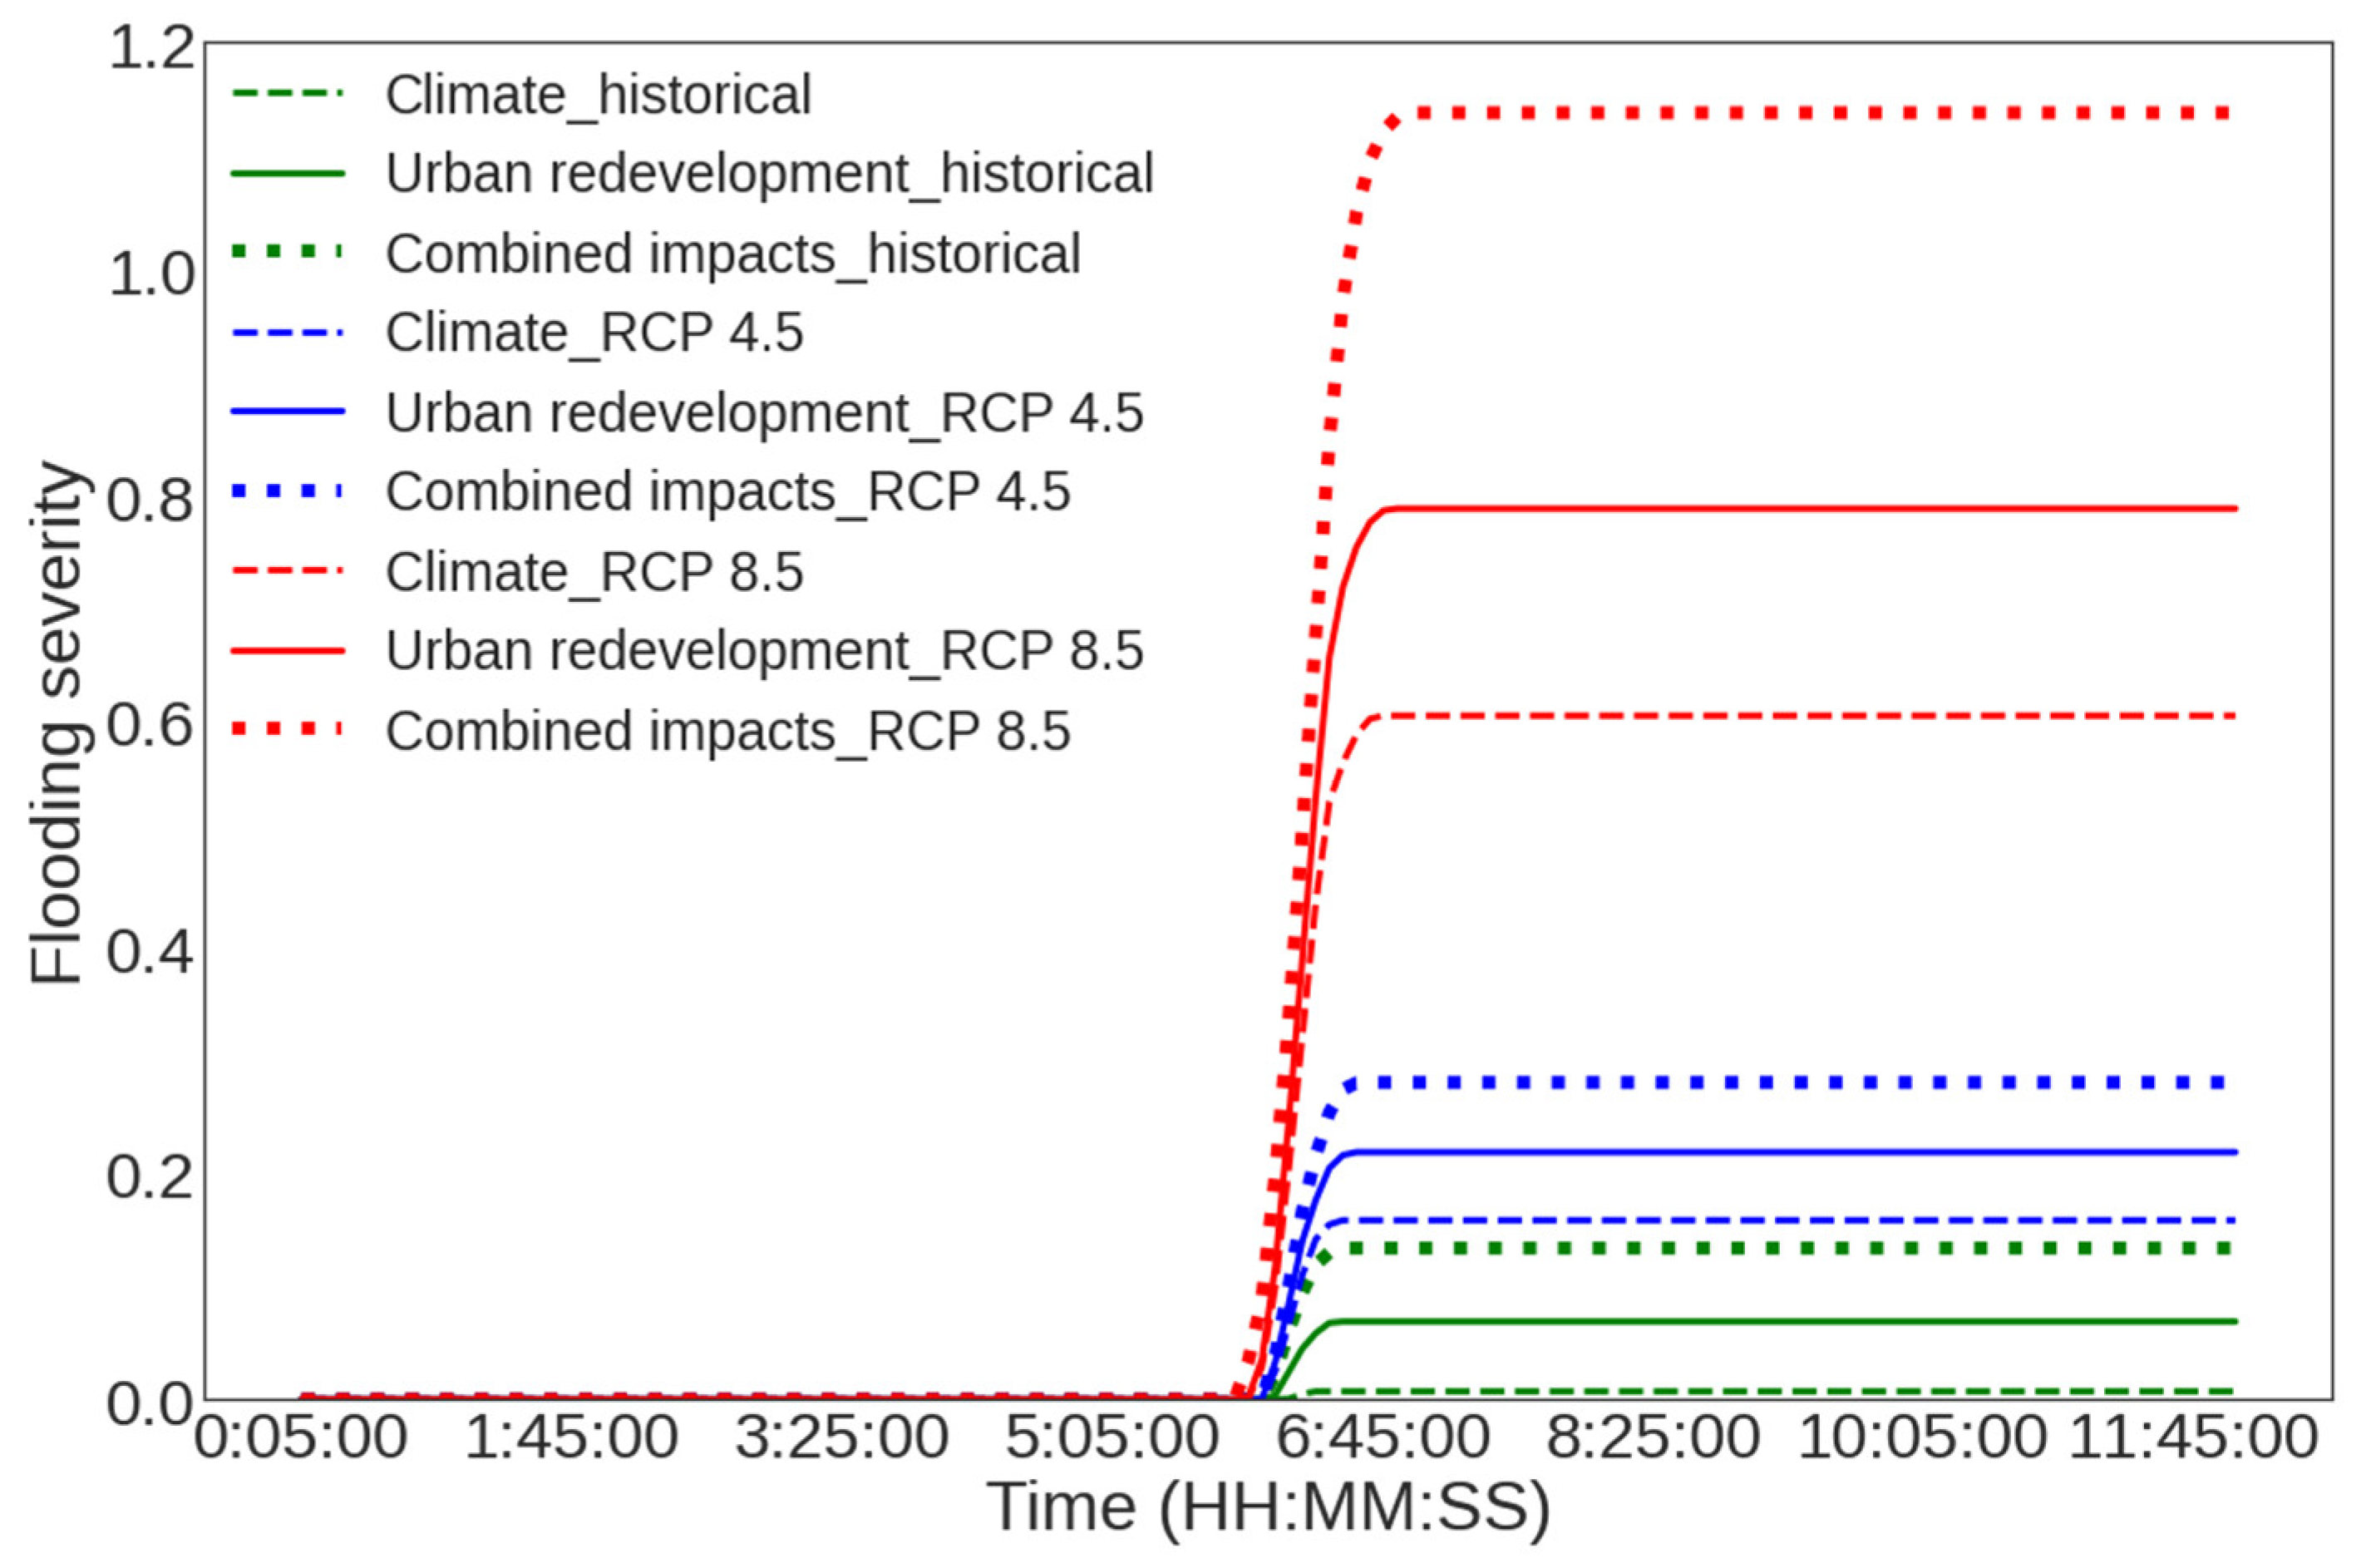
3.1. Impacts on System Performance

The system performance curves corresponding to the 100-year 12-h rainfall scenario of Figure 5 are shown in Figure 6. Note that for clarity, Figure 6 details only the middle/peak 5 h of the full 12-h storms to demonstrate the system performance variations. These performance curves are used to define the new resilience metric decline from 1 to the lowest performance level and then recover from the bottom to 1 as the rainfall stops at a certain point. Notably, the performance curves (green dashed line and green solid line) under individual historical impacts (baseline scenarios) have the maximum failure levels higher than 0.97, while other curves have the worst performance level under 0.97, which is an acceptable service level in previous studies [70,71]. This finding highlights the trend that future climate change and urbanization will increase the system failure level. The gaps between the maximum failure level and acceptable service level become more significant as the climatic and urbanized effects increase from the future period 1 (blue lines) to period 2 (red lines). The deterioration of system performance means that the UDS is less capable of handling large storm events.
Although the general changing tendency of performance curves is similar to what is previously introduced in Figure 5, these curves show different characteristics under climate and land cover impacts. In comparison with the performance curves of the baseline period, curves of future periods have larger flooding magnitude, shorter response time, and longer recovery duration (Figure 6). Given the same period, the landscape imperviousness changes create a larger maximum failure level and longer system recovery time than rainfall intensity changes. For example, the recovery duration is 15 min (green dashed curve) and 25 min (green dotted curve) for baseline climate and urban scenarios, respectively. The recovery duration under urbanized impacts is approximately 15 (comparing the blue dashed curve with the blue dotted one) and 20 min (comparing the blue dashed curve with the blue dotted one) longer for the future period one and future period two, respectively, than the duration under climatic impacts. Within each period, the urbanized impacts seem more severe than the climatic effects on flooding failure recovery.
In Figure 7, we also find the temporal changes in flooding severity during 100-year 12-h rainfall under baseline and future scenarios. The flooding severity increase from below 0.2 under the baseline scenario to over 1.0 under the combined impacts of future period two, implying that future uncertainty will trigger more flooding consequences, such as economic loss, disruptions in transportation, and threats to public property and life. Flooding severity is minor in the initial 6-h stage and then rapidly rises to the peak in the next 30-min duration, which indicates that the peak flooding rate is the major contributor to the recession of the system performance. Flooding severity ends up with stabilization about 30 min after rainfall peaking time, at which point the system’s worst performance level is also reached. During this dynamic change, flooding severity tops the combined changes, followed by the individual urban imperviousness change, and climate change has the least flooding severity. The changing climates and impervious surfaces, together and alone, reshape the system performance curves and consequently elevate the flooding severity to a different extent. The urbanized imperviousness changes have a larger impact on flooding severity than rainfall intensity variations for the case study from 2001 to 2099.

3.2. Impacts on Flooding Resilience

Figure 8 shows that both the intensified rainfall due to climate change and the densified impervious surfaces undermine flooding resilience. The baseline scenario has a resilience of 0.99, which is very close to the original system performance level. However, the different degrees of climate change and urban redevelopment have caused different system responses and subsequent flooding resilience changes. Given the same land imperviousness, the increase in rainfall intensity reduces the flooding resilience by 6% from 0.99 to 0.93 and by 7% from 0.93 to 0.87 for the future period #1 and period #2, respectively. In terms of urban redevelopment, the growing impervious surfaces result in a 15% reduction in flooding resilience from 0.99 to 0.84 for future period #1 and a 45% decrease from 0.84 to 0.4 for future period #2. It can be found that there is a larger system performance deterioration from future period #1 to period #2 than that from the referencing period to future period #1. The comparison of resilience changes shows that the individual impacts of urban redevelopment seem to be more significant to disturb the system performance, which agrees with the findings from [72] but is opposite to outcomes of [73], who summarized that impervious urban change is a less important factor than climate change. Refs. [74,75] explained that the magnitude of individual effects depends on the existing catchment topological conditions and climates. In our case study, the fast population growth is projected to accelerate urban redeveloping projects in this catchment-scale area. The combined impacts amplify the drop in flooding resilience by 21% from 0.99 to 0.78 for the first-period transition and by 89% from 0.78 to −0.14 for the second-period transition (along with the yellow arrow in Figure 8). Clearly, the integrated impacts of climate change and urban redevelopment are greater than any individual effects on flooding resilience.

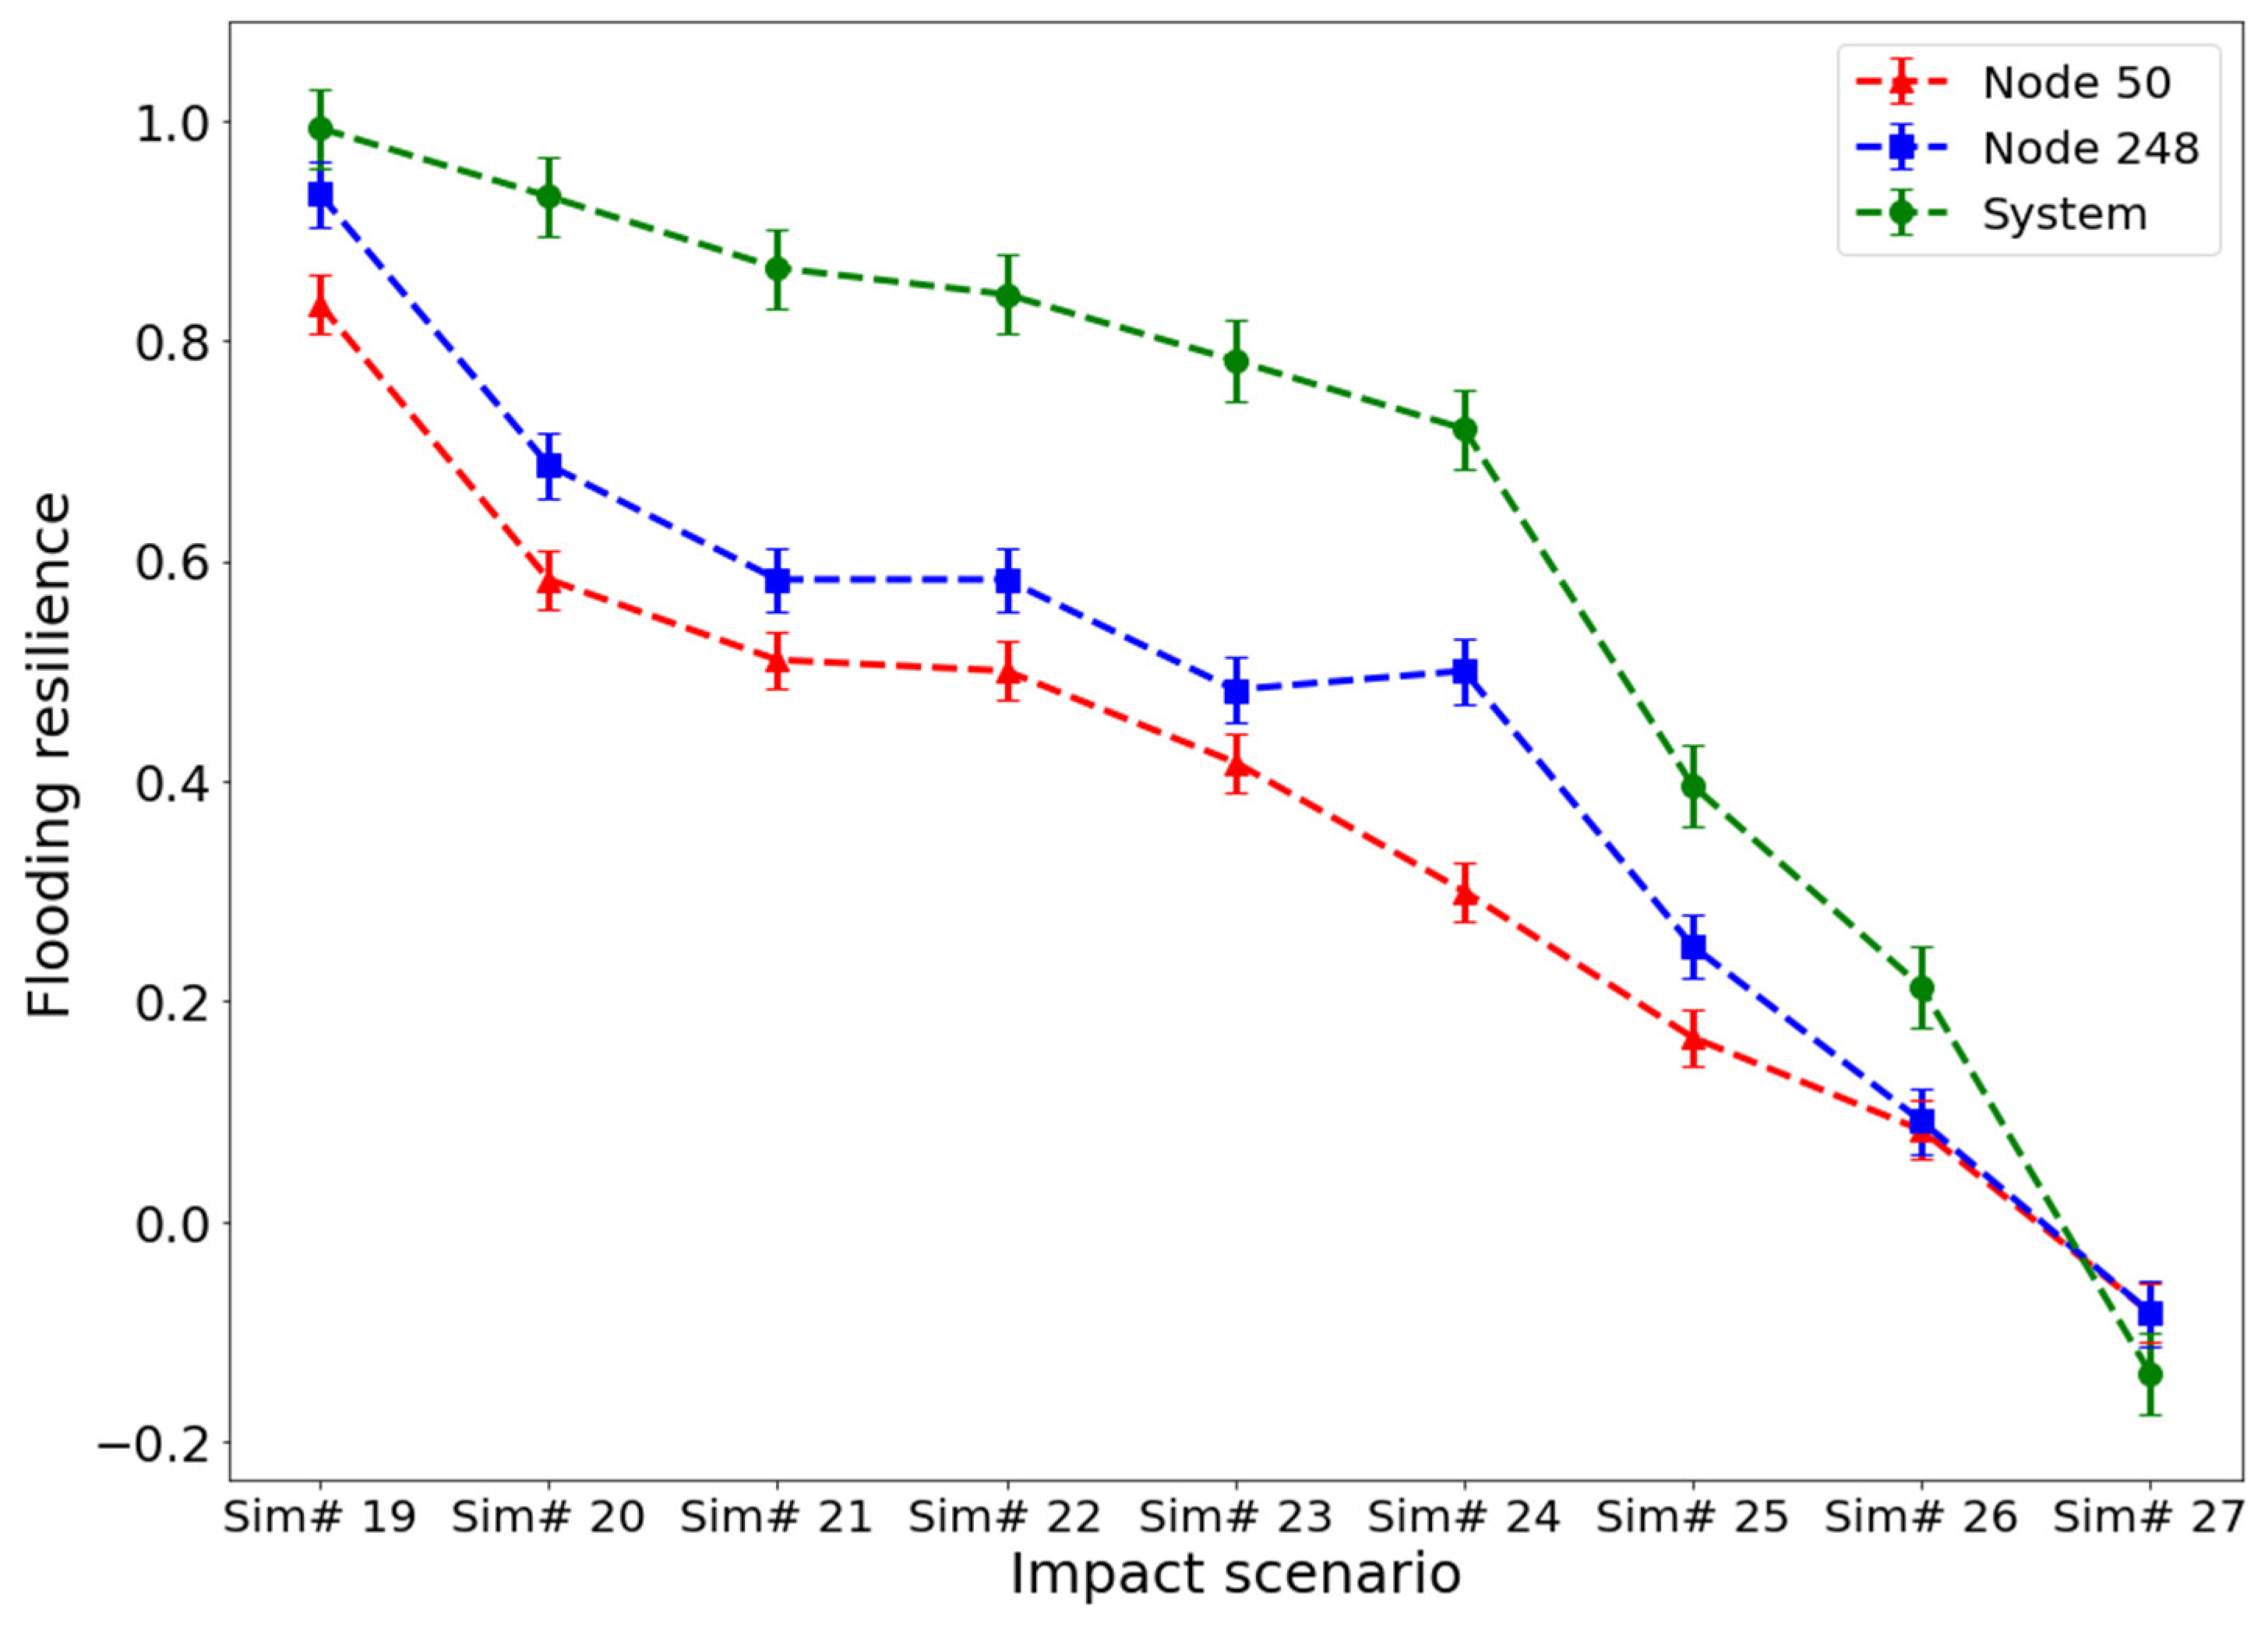
3.3. Impacts on Nodal Resilience

The flooding resilience at the junction level and system level are plotted against impact scenarios under 12-h 100-year return period design rainfall, shown in Figure 9. Junctions 50 and 248 are selected because of their high resilience contribution to the system, which means that the performance of these nodes is more related to the deterioration of the system resilience [41]. The nodal resilience decreases from scenario Sim #19 to #27, the same as system resilience. This finding illustrates that the impacts of climate change and urban infill on flooding resilience can be consistently represented from the system level to the junction level by using the proposed new resilience metric. Although [23] used the traditional cell-based index to quantify the system-level and catchment-level flooding resilience, the impacts of impervious land covers on flood resilience are not investigated, which might underestimate the dynamic performance of UDSs. Ref. [61] proposed a scalable flood-resilience metric, which can be downscaled to measure the climatic impacts on building-level resilience in Munich City, Germany. However, they ignore the stormwater infrastructure resilience, which could be more holistic for impact study herein.
Different from these two recent studies above, this work considers measuring not only the climatic impacts but also the urbanized effects to zoom in from system-level to junction-level resilience. Such a spatial transition in resilience assessment harvests high-resolution infrastructure adaptation strategies at vulnerable sites. For instance, we discovered that the resilience of node 50 is smaller than node 248. This discovery shows that node 50 is more vulnerable to future threats than node 248, and stormwater infrastructures and public properties around node 50 are more likely to be affected by rainfall changes or impervious surface changes. An initial adaptation measure is recommended to take at node 50. The difference in nodal resilience can be attributed to the different locations of junctions and characteristics of the connected pipes. Node 50 is downstream of node 248, but the slope of node 50 is smaller than nodal 248, so the flow would quickly reach node 50 but be slowly discharged into the downstream nodes. Ref. [23] claimed that flooding resilience is also related to the catchment characteristics, such as catchment slope. However, our study is based on a drainage network that makes the impacts of the catchment slope be limited. Nevertheless, these resilience values can help decision-makers prioritize adaptation measures for climate change and urban redeveloping impacts on system-level and junction-level failures or service outages for different purposes.

3.4. Resilience Sensitivity Analysis

Figure 10 depicts a nonlinear sensitivity correlation between flooding resilience and imperviousness percentage or rainfall intensity from 2001 to 2099. In Figure 10a, a 20% increase in impervious area results in 24.2%, 13.4%, and 29.8% declines in flooding resilience for baseline, future period #1, and future period #2 scenarios, respectively. Figure 10b shows that a 20% increase in rainfall intensity produces 16.5%, 16.8%, and 16.1% decreases in flooding resilience for baseline, future period #1, and future period #2 scenarios, respectively. The flooding resilience is more sensitive to impervious changes than rainfall intensity changes for this study. Ref. [41] also found a similar nonlinear correlation. Still, the decaying resilience percentages of this work are relatively larger than those of [41], who conducted impacts analysis and obtained the resilience reduction with about 13% and 16% for urbanized and climatic scenarios, respectively. Ref. [64] revealed that the correlation between flooding and urbanization depends on the size of the catchment. As our study area is about 9.6 km2 smaller than the area of [41], the difference in catchment size might be the reason leading to a higher sensitivity in the case study. Nevertheless, the nonlinear formulation derived from this study provides the potential to normalize our findings to develop effective urban planning and land management policy for future impacts adaptation and flooding mitigation. For instance, if the impervious surfaces increase with the same growth rate, the ability of the UDS to resist disturbance will decrease by about 73% by 2100. Ref. [43] concluded that a decrease of 15% in impervious surfaces could be sufficient to prevent the negative impacts of climate change in the Lambro watershed of Italy by 2100. Our study shows better results that a decrease of 9.4% in impervious areas from future period #2 to the baseline scenario can minimize the resilience reduction to 47%, which is enough to offset the 10% resilience reduction caused by climatic rainfall changes before 2100. Although this study does not discuss which adaptation strategy and how to use the adaptive measures to mitigate the impacts, the nonlinear sensitivity correlations can be extended to predict future uncertainty and improve the performance of adaptive practices.

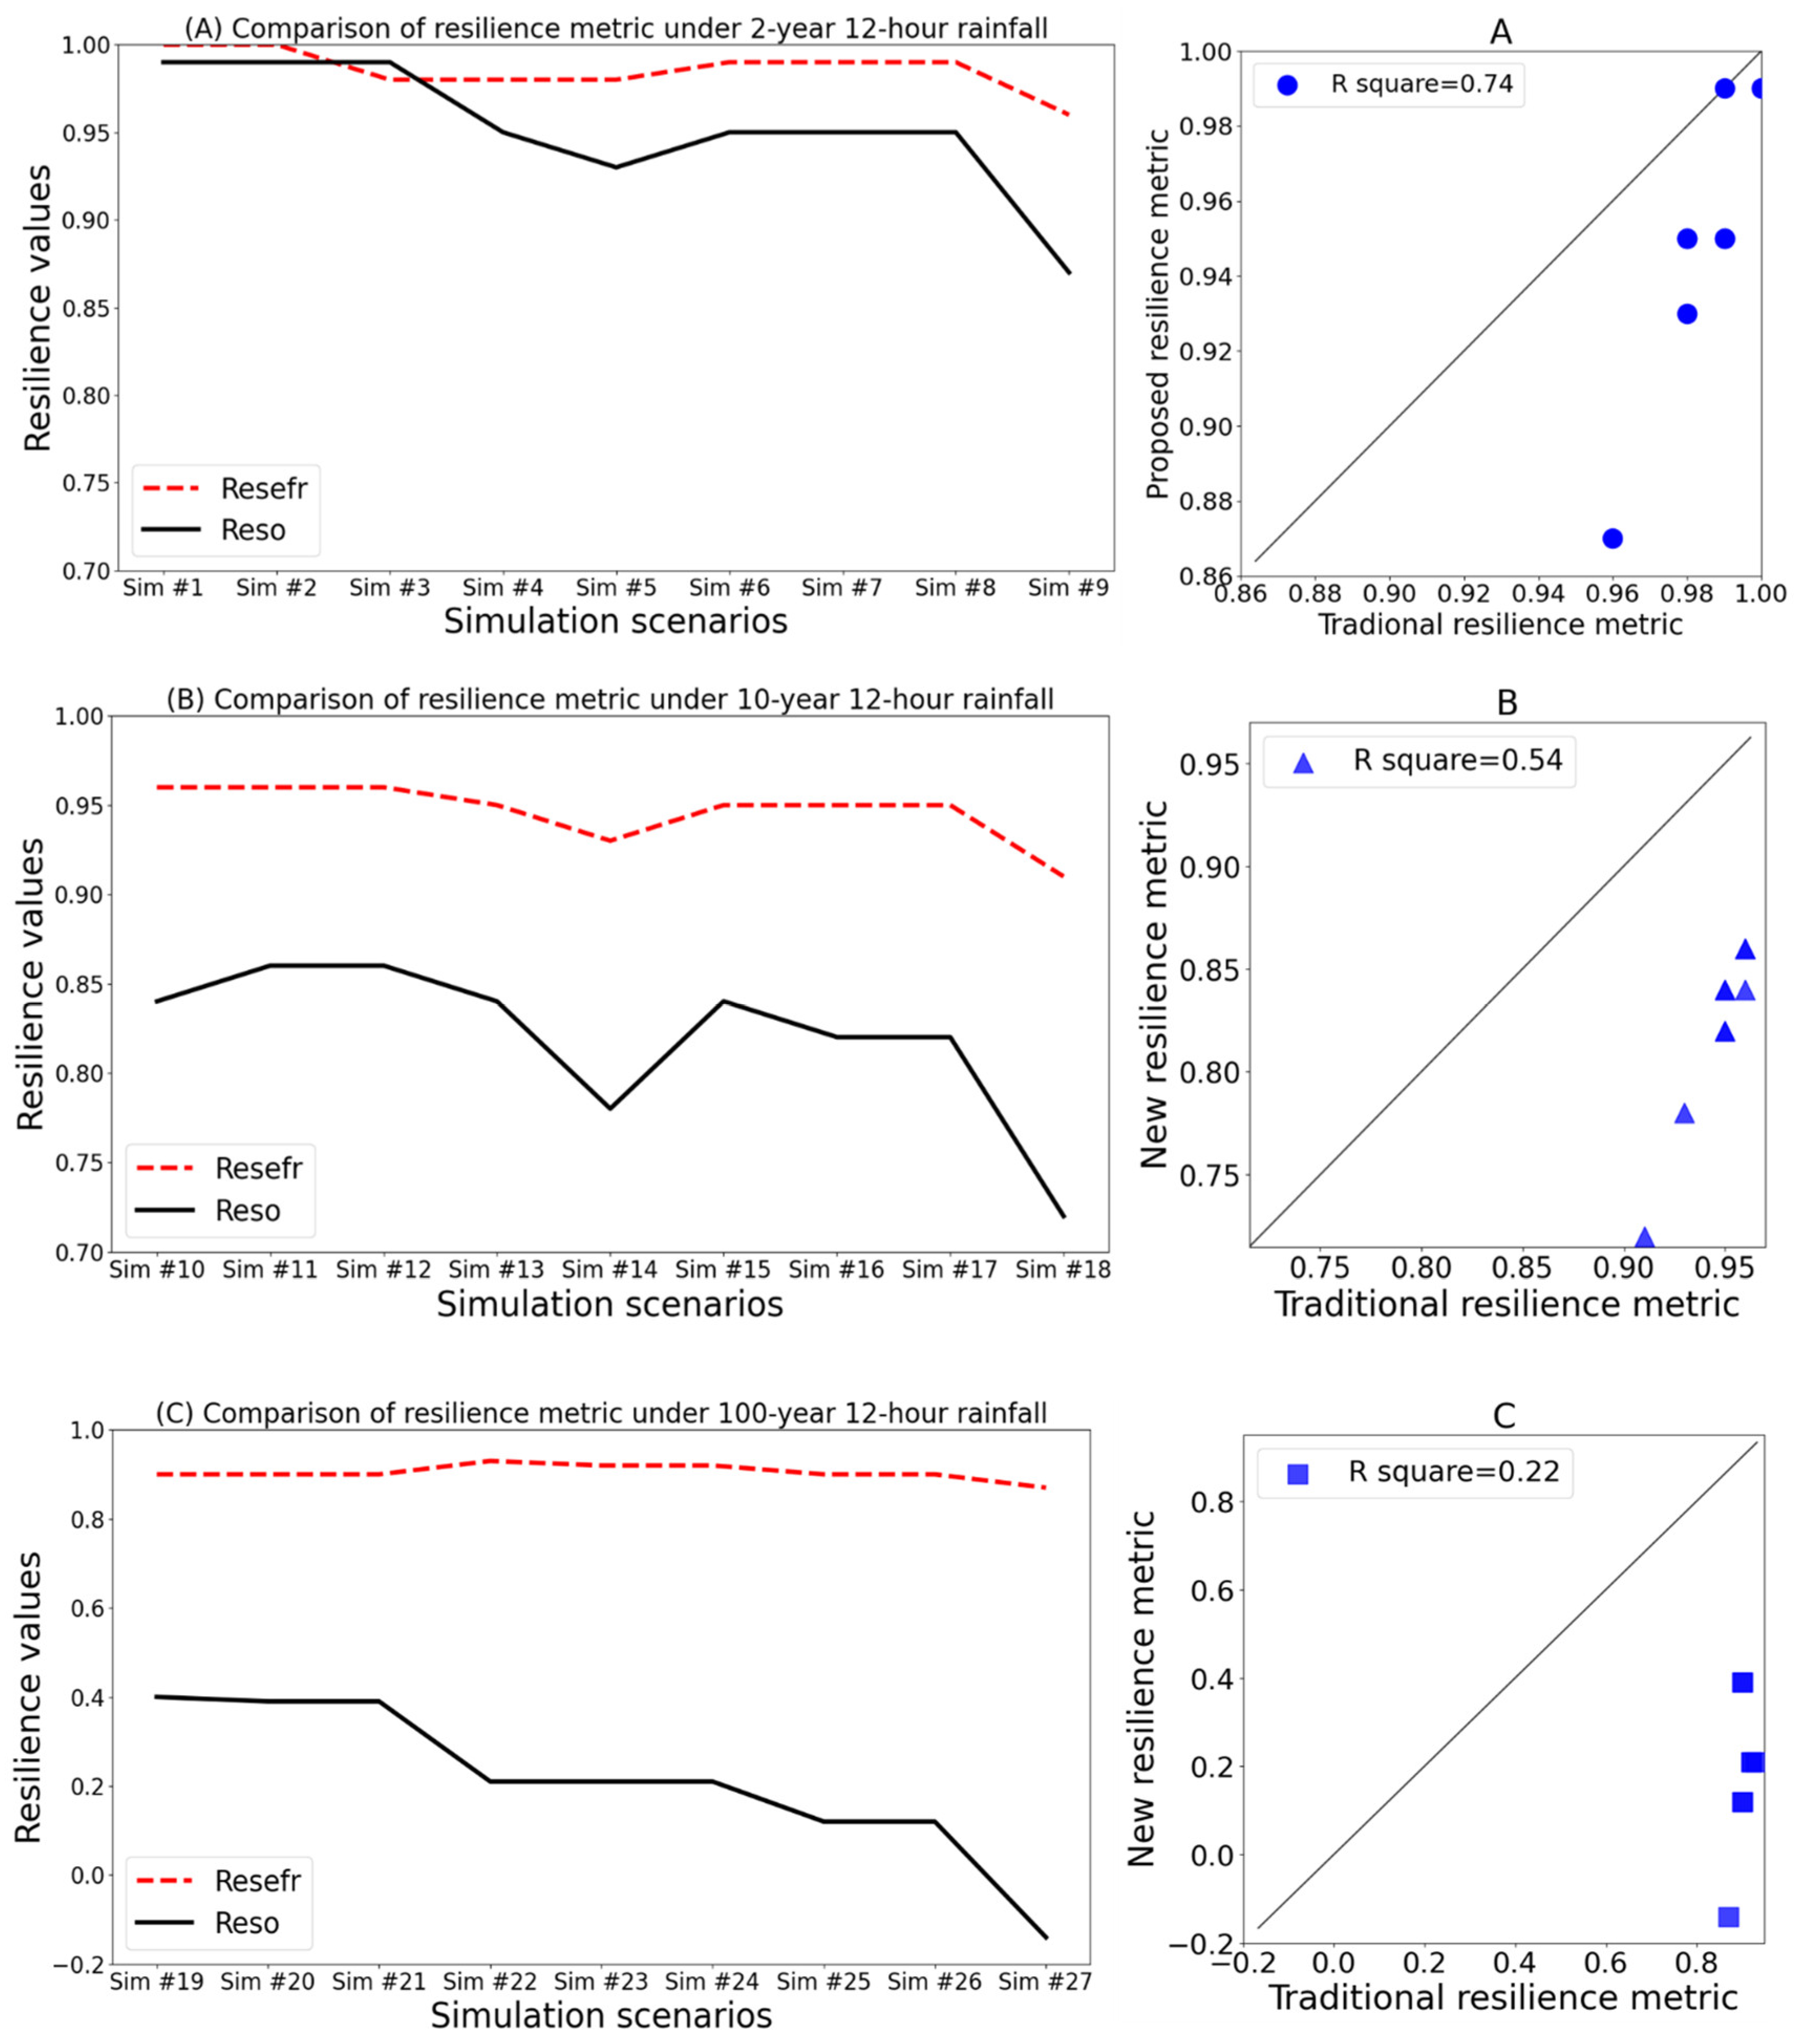
3.5. Flooding Resilience Comparison

The event-based flooding resilience index proposed in this study (Resefr in Equation (5)) is compared with the traditional resilience metric (Reso in Equation (3)). The comparing results for the overall system resilience under 12-hour design rainfalls of 2-, 10-, and 100-year return period are shown in Figure 11. Within each rainfall event, there are nine scenarios for demonstrating climate and urban infill impacts upon flooding resilience metrics. In each subplot of Figure 11, resilience is declining as effects are magnified. However, the conventional resilience is generally lower than the proposed flooding resilience under impacts. The resilience difference between the new and old metrics is getting bigger as the return period grows. Particularly, Figure 11 shows that the coefficient of determination values (R2) significantly drops from 0.74 to 0.54 and to 0.22 for 10-year and 100-year rainfall scenarios, respectively. It seems that the proposed flooding resilience index is more sensitive to the impacts since the changes in conventional flooding resilience do not coincide with the increase in the rainfall intensity and urban imperviousness. This finding indicates that the traditional resilience index has limited ability to quantify the climatic and urbanized impacts. The system performance under future climate and urban infill uncertainty might be underestimated by the traditional resilience metric. One reason is that the traditional resilience metric only considers the average nodal flooding, which is not representative of the system flooding in a structurally complicated network. Another explanation for this case is because the impacts on flooding resilience might deteriorate when simplifying the system failure and recovery curve as a rectangular.

4. Discussions

Urban flooding is influenced by a multitude of factors, encompassing changes in rainfall patterns, modifications in land cover, the aging state of stormwater infrastructure, drainage congestion, and riverine overflow. It is noted that the impact of river overbank flow is not considered in this study as the study area is relatively small, where large rivers, such as the Jordan River, are located far away from the catchment. The specific elements contributing to urban flooding can vary on a case-by-case basis. In our previous study, we conducted modeling experiments and performed a sensitivity analysis to investigate the relationship between these factors and urban flooding in the same location [46]. Our findings unveiled that climate change and land cover changes emerged as the dominant contributors to local urban floods, surpassing factors such as drainage pipe features, elevation, or distance. Given the global scale of urbanization and climate change, our research holds broader applicability to other regions grappling with similar flooding issues. To address specific concerns like settlement patterns, drainage congestion in conjunction with solid waste, or other regional or local factors, additional studies would be necessary in the future.
For the modeling purpose of this study, we assume that the aging condition of the drainage network remains constant, as our primary focus revolves around land cover and climate changes. However, it is worth noting that the aging issue could be a relevant factor and merits attention in subsequent studies. From a methodological perspective, our study presents an approach to modeling and assessing the resilience of a drainage system. If a drainage system requires renovation or replacement after its service lifespan, the impact of climate change and urbanization can be easily reassessed using the same methodology by adjusting future impacts, such as the predicted design storm event and land imperviousness.
In our study, we not only considered the intensity of urban flooding but also took into account its frequency. By investigating the climate change factor, which incorporates the intensity and frequency (return period) of rainfall events, the quantified resilience in our study can reflect the effects of flood frequency on the results. Additionally, the variables of flood volume and duration were already considered in Equations (1)–(4), implicitly encompassing the intensity of urban floods. However, the proposed event flooding resilience index was calculated assuming a trapezoidal shape for the surrounding performance curve. As the shape of the curve can vary to non-linear edges, future work could explore integral mathematical approaches to calculate resilience index values more accurately.

5. Conclusions

Projecting the stormwater infrastructure performance in response to an ensemble of future disturbances is crucial for building a resilient urban drainage system. This paper contributes to enhancing the understanding of the resilience assessment of urban drainage systems under the impacts induced by urban redevelopment and climate change. The impact scenarios are configured with a variety of increases in impervious urban surfaces due to the urban infill and rainfall intensity due to climate change. The developed future scenarios predict an increase of 29% in rainfall intensity and 35% in urban imperviousness percentage from 2001 to 2099. Flooding resilience under different climatic and urbanized effects is investigated and compared by using the Sugar House case study of Salt Lake City, Utah, USA. The obtained resilience values highlight how the Sugar House urban drainage system, which was perceived as a robust network from 2001 to 2015, will be projected to be a vulnerable system due to the uncertain urban redeveloping projects and climatic changes during the future period (2085–2099). Three conclusions are drawn below:
  • The proposed event-based flooding resilience metric can accurately and consistently quantify the climatic and urbanized effects, together and alone, on resilience values at different spatial levels. At the system level, the advantage of the proposed index is to reflect the realistic system performance without underestimating the flooding magnitude and duration. At the junction level, the new resilience metric enables the engineers and decision-makers to identify the most vulnerable spots and then initiate early actions for mitigating structural failure risks.
  • This study fills an important gap in weighing the importance of future climate change and urban redevelopment on flooding resilience. Our results show that the imperviousness percentage changes caused by urban infill induce more significant impacts on system performance curves than the rainfall intensity changes. With this information, local utilities can prioritize adaptation measures, namely improving the previous landscape, adding local stormwater treatment practices along with the urban redeveloping projects, or issuing adaptive land management policies, for buffering the rapid urbanization process but not diverting too many valuable resources into resisting the threats from climatic changes.
  • A nonlinear logarithmic correlation shows that flooding resilience is more sensitive to the growth in impervious surfaces than intensified rainfalls. A 20% increase in urbanization scenarios leads to approximately a 29% decrease in system resilience, while a 20% increase in the climatic scenario only results in around a 16% decline in resilience by 2100. This quantitative correlation is crucial for the design and renovation of the urban drainage system, aimed to adapt to land cover and climate change in the future. Although the sensitivity correlation might vary from case to case, this study contributes to promoting the awareness of including future uncertain disturbances in resilient urban drainage design.

Author Contributions

Conceptualization, J.L.; Data curation, J.L. and C.S.; Formal analysis, J.L.; Investigation, J.L.; Methodology, J.L.; Funding acquisition, C.S. and J.W.; Resources, J.L. and J.W.; Software, J.L.; Validation, J.L.; Visualization, J.L.; Writing—original draft, J.L.; Writing—review & editing, J.L., C.S., J.W., and S.B. All authors have read and agreed to the published version of the manuscript.

Funding

This research received funding provided by the U.S. Western Water Assessment: a NOAA (National Oceanic and Atmospheric Administration) funded Regional Integrated Sciences and Assessment (RISA) with Grant Number of NA21OAR4310309. This work was also supported by the National Natural Science Foundation of China (No.52109025), the Natural Science Foundation of Shandong Province (No.ZR2021QE001), the Future Plan for Young Talent in Shandong University, and the Fundamental Research Funds of Shandong University.

Data Availability Statement

Data and models used in this study can be accessed upon the request of the corresponding author.

Conflicts of Interest

The authors declare no conflict of interest.

References

  1. Butler, D.; Parkinson, J. Towards sustainable urban drainage. Water Sci. Technol. 1997, 35, 53–63. [Google Scholar] [CrossRef]
  2. Arnbjerg-Nielsen, K.; Willems, P.; Olsson, J.; Beecham, S.; Pathirana, A.; Bülow Gregersen, I.; Madsen, H.; Nguyen, V.T.V. Impacts of climate change on rainfall extremes and urban drainage systems: A review. Water Sci. Technol. 2013, 68, 16–28. [Google Scholar] [CrossRef] [PubMed] [Green Version]
  3. Kim, Y.; Eisenberg, D.A.; Bondank, E.N.; Chester, M.V.; Mascaro, G.; Underwood, B.S. Fail-safe and safe-to-fail adaptation: Decision-Making for urban flooding under climate change. Clim. Chang. 2017, 145, 397–412. [Google Scholar] [CrossRef]
  4. Mohammadiun, S.; Yazdi, J.; Hager, J.; Salehi Neyshabouri, S.A.A.; Sadiq, R.; Hewage, K.; Alavi Gharahbagh, A. Effects of bottleneck blockage on the resilience of an urban stormwater drainage system. Hydrol. Sci. J. 2020, 65, 281–295. [Google Scholar] [CrossRef]
  5. Li, J.; Burian, S.; Carlos, O.; Johnson, R.C. Modeling Operations in System-level Real-time Control for Urban Flooding Reduction and Water Quality Improvement—An Open-source Benchmarked Case. Authorea 2023. Preprint. [Google Scholar] [CrossRef]
  6. Skougaard Kaspersen, P.; Høegh Ravn, N.; Arnbjerg-Nielsen, K.; Madsen, H.; Drews, M. Comparison of the impacts of urban development and climate change on exposing European cities to pluvial flooding. Hydrol. Earth Syst. Sci. 2017, 21, 4131–4147. [Google Scholar] [CrossRef] [Green Version]
  7. Huong, H.T.L.; Pathirana, A. Urbanization and climate change impacts on future urban flooding in Can Tho city, Vietnam. Hydrol. Earth Syst. Sci. 2013, 17, 379–394. [Google Scholar] [CrossRef] [Green Version]
  8. Semadeni-Davies, A.; Hernebring, C.; Svensson, G.; Gustafsson, L.G. The impacts of climate change and urbanisation on drainage in Helsingborg, Sweden: Combined sewer system. J. Hydrol. 2008, 350, 100–113. [Google Scholar] [CrossRef]
  9. Holling, C.S. Resilience and Stability. Annu. Rev. Ecol. Syst. 1973, 4, 1–23. [Google Scholar] [CrossRef] [Green Version]
  10. Holling, C.S. Engineering resilience versus ecological resilience. Natl. Acad. Eng. 1996, 31, 32. [Google Scholar]
  11. Blackmore, J.M.; Plant, R.A.J. Risk and resilience to enhance sustainability with application to urban water systems. J. Water Resour. Plan. Manag. 2008, 134, 224–233. [Google Scholar] [CrossRef] [Green Version]
  12. Butler, D.; Ward, S.; Sweetapple, C.; Astaraie-Imani, M.; Diao, K.; Farmani, R.; Fu, G. Reliable, resilient and sustainable water management: The Safe & SuRe approach. Glob. Chall. 2017, 1, 63–77. [Google Scholar] [CrossRef] [PubMed]
  13. Casal-Campos, A.; Sadr, S.M.K.; Fu, G.; Butler, D. Reliable, Resilient and Sustainable Urban Drainage Systems: An Analysis of Robustness under Deep Uncertainty. Environ. Sci. Technol. 2018, 52, 9008–9021. [Google Scholar] [CrossRef] [Green Version]
  14. Juan-García, P.; Butler, D.; Comas, J.; Darch, G.; Sweetapple, C.; Thornton, A.; Corominas, L. Resilience theory incorporated into urban wastewater systems management. State of the art. Water Res. 2017, 115, 149–161. [Google Scholar] [CrossRef] [PubMed] [Green Version]
  15. Ahern, J. From fail-safe to safe-to-fail: Sustainability and resilience in the new urban world. Landsc. Urban Plan. 2011, 100, 341–343. [Google Scholar] [CrossRef] [Green Version]
  16. Ouyang, M.; Dueñas-Osorio, L.; Min, X. A three-stage resilience analysis framework for urban infrastructure systems. Struct. Saf. 2012, 36, 23–31. [Google Scholar] [CrossRef]
  17. Park, J.; Seager, T.P.; Rao, P.S.C. Lessons in risk- versus resilience-based design and management. Integr. Environ. Assess. Manag. 2011, 7, 396–399. [Google Scholar] [CrossRef] [PubMed]
  18. Park, J.; Seager, T.P.; Rao, P.S.C.; Convertino, M.; Linkov, I. Integrating risk and resilience approaches to catastrophe management in engineering systems. Risk Anal. 2013, 33, 356–367. [Google Scholar] [CrossRef]
  19. Mugume, S.N. Modelling and Resilience-Based Evaluation of Urban Drainage and Flood Management Systems for Future Cities. Ph.D. Thesis, University of Exeter, Exeter, UK, 2015. [Google Scholar]
  20. Mugume, S.N.; Gomez, D.E.; Fu, G.; Farmani, R.; Butler, D. A global analysis approach for investigating structural resilience in urban drainage systems. Water Res. 2015, 81, 15–26. [Google Scholar] [CrossRef] [Green Version]
  21. Lee, E.H.; Lee, Y.S.; Joo, J.G.; Jung, D.; Kim, J.H. Investigating the impact of proactive pump operation and capacity expansion on urban drainage system resilience. J. Water Resour. Plan. Manag. 2017, 143, 04017024. [Google Scholar] [CrossRef]
  22. Yazdi, J. Rehabilitation of Urban Drainage Systems Using a Resilience-Based Approach. Water Resour. Manag. 2018, 32, 721–734. [Google Scholar] [CrossRef]
  23. Wang, Y.; Meng, F.; Liu, H.; Zhang, C.; Fu, G. Assessing catchment scale flood resilience of urban areas using a grid cell based metric. Water Res. 2019, 163, 114852. [Google Scholar] [CrossRef]
  24. Xiong, L.; Yan, L.; Du, T.; Yan, P.; Li, L.; Xu, W. Impacts of Climate Change on Urban Extreme Rainfall and Drainage Infrastructure Performance: A Case Study in Wuhan City, China. Irrig. Drain. 2019, 68, 152–164. [Google Scholar] [CrossRef]
  25. Li, J.; Tao, T.; Kreidler, M.; Burian, S.; Yan, H. Construction Cost-Based Effectiveness Analysis of Green and Grey Infrastructure in Controlling Flood Inundation: A Case Study. J. Water Manag. Model. 2019, 27, C466. [Google Scholar] [CrossRef] [Green Version]
  26. Zhou, Q.; Ren, Y.; Xu, M.; Han, N.; Wang, H. Adaptation to urbanization impacts on drainage in the city of Hohhot, China. Water Sci. Technol. 2016, 73, 167–175. [Google Scholar] [CrossRef] [PubMed] [Green Version]
  27. Ntelekos, A.A.; Oppenheimer, M.; Smith, J.A.; Miller, A.J. Urbanization, climate change and flood policy in the United States. Clim. Change 2010, 103, 597–616. [Google Scholar] [CrossRef]
  28. Pond, M.C.; Dietz, C. Tear-Downs: Controlling Stormwater Impacts. Available online: http://waterbucket.ca/gi/files/2013/03/Teardowns-controlling-stormwaterimpacts.%0Apdf (accessed on 6 July 2020).
  29. Panos, C.L.; Hogue, T.S.; Gilliom, R.L.; McCray, J.E. High-Resolution Modeling of Infill Development Impact on Stormwater Dynamics in Denver, Colorado. J. Sustain. Water Built Environ. 2018, 4, 04018009. [Google Scholar] [CrossRef]
  30. Li, J. Exploring the potential of utilizing unsupervised machine learning for urban drainage sensor placement under future rainfall uncertainty. J. Environ. Manag. 2021, 296, 113191. [Google Scholar] [CrossRef]
  31. Li, J. A data-driven improved fuzzy logic control optimization-simulation tool for reducing flooding volume at downstream urban drainage systems. Sci. Total Environ. 2020, 732, 138931. [Google Scholar] [CrossRef]
  32. Li, J.; Burian, S.; Oroza, C. Exploring the potential for simulating system-level controlled smart stormwater system. In Proceedings of the World Environmental and Water Resources Congress 2019: Water, Wastewater, and Stormwater; Urban Water Resources; and Municipal Water Infrastructure—Selected Papers from the World Environmental and Water Resources Congress 2019, Pittsburgh, PA, USA, 19–23 May 2019; American Society of Civil Engineers: Reston, VA, USA, 2019; pp. 46–56. [Google Scholar]
  33. Yao, L.; Wei, W.; Chen, L. How does imperviousness impact the urban rainfall-runoff process under various storm cases? Ecol. Indic. 2016, 60, 893–905. [Google Scholar] [CrossRef]
  34. Kong, F.; Ban, Y.; Yin, H.; James, P.; Dronova, I. Modeling stormwater management at the city district level in response to changes in land use and low impact development. Environ. Model. Softw. 2017, 95, 132–142. [Google Scholar] [CrossRef]
  35. Madsen, H.; Lawrence, D.; Lang, M.; Martinkova, M.; Kjeldsen, T.R. Review of trend analysis and climate change projections of extreme precipitation and floods in Europe. J. Hydrol. 2014, 519, 3634–3650. [Google Scholar] [CrossRef] [Green Version]
  36. Panos, C.L.; Wolfand, J.M.; Hogue, T.S. SWMM Sensitivity to LID Siting and Routing Parameters: Implications for Stormwater Regulatory Compliance. J. Am. Water Resour. Assoc. 2020, 56, 790–809. [Google Scholar] [CrossRef]
  37. Hekl, J.A.; Dymond, R.L. Runoff Impacts and LID Techniques for Mansionization-Based Stormwater Effects in Fairfax County, Virginia. J. Sustain. Water Built Environ. 2016, 2, 05016001. [Google Scholar] [CrossRef]
  38. Oberascher, M.; Dastgir, A.; Li, J.; Hesarkazzazi, S.; Hajibabaei, M.; Rauch, W.; Sitzenfrei, R. Revealing the challenges of smart rainwater harvesting for integrated and digital resilience of urban water infrastructure. Water 2021, 13, 1902. [Google Scholar] [CrossRef]
  39. Li, J.; Yang, X.; Sitzenfrei, R. Rethinking the framework of smart water system: A review. Water 2020, 12, 412. [Google Scholar] [CrossRef] [Green Version]
  40. Wang, S.; Fu, J.; Wang, H. Unified and rapid assessment of climate resilience of urban drainage system by means of resilience profile graphs for synthetic and real (persistent) rains. Water Res. 2019, 162, 11–21. [Google Scholar] [CrossRef]
  41. Dong, X.; Guo, H.; Zeng, S. Enhancing future resilience in urban drainage system: Green versus grey infrastructure. Water Res. 2017, 124, 280–289. [Google Scholar] [CrossRef]
  42. Putro, B.; Kjeldsen, T.R.; Hutchins, M.G.; Miller, J. An empirical investigation of climate and land-use effects on water quantity and quality in two urbanising catchments in the southern United Kingdom. Sci. Total Environ. 2016, 548–549, 164–172. [Google Scholar] [CrossRef] [PubMed] [Green Version]
  43. Salerno, F.; Viviano, G.; Tartari, G. Urbanization and climate change impacts on surface water quality: Enhancing the resilience by reducing impervious surfaces. Water Res. 2018, 144, 491–502. [Google Scholar] [CrossRef]
  44. Carter, T.R.; Alfsen, K.; Barrow, E.; Bass, B.; Dai, X.; Desanker, P. IPCC-TGICA: General Guidelines on the Use of Scenario Data for Climate Impact and Adaptation Assessment (TGICA), Version 2. 2007. Available online: https://www.ipcc-data.org/guidelines/TGICA_guidance_sdciaa_v2_final.pdf (accessed on 6 July 2020).
  45. Rossman, L.A. Storm Water Management Model User’s Manual Version 5.1. EPA/600/R-14/413b; National Risk Management Research Laboratory Office of Research and Development, United States Environmental Protection Agency: Cincinnati, OH, USA, 2015. [Google Scholar]
  46. Li, J.; Burian, S.J. Effects of Nonstationarity in Urban Land Cover and Rainfall on Historical Flooding Intensity in a Semiarid Catchment. J. Sustain. Water Built Environ. 2022, 8, 04022002. [Google Scholar] [CrossRef]
  47. Li, J.; Bortolot, Z.J. Quantifying the impacts of land cover change on catchment-scale urban flooding by classifying aerial images. J. Clean. Prod. 2022, 344, 130992. [Google Scholar] [CrossRef]
  48. Web Soil Survey “Web Soil Survey”. USDA. Available online: https://websoilsurvey.sc.egov.usda.gov/App/WebSoilSurvey.aspx (accessed on 10 July 2022).
  49. NOAA Climate Prediction Center. Available online: https://www.cpc.ncep.noaa.gov/products/predictions/814day/ (accessed on 2 January 2021).
  50. Dunkerley, D. Identifying individual rain events from pluviograph records: A review with analysis of data from an Australian dryland site. Hydrol. Process. 2008, 22, 5024–5036. [Google Scholar] [CrossRef]
  51. Cao, S.; Diao, Y.; Wang, J.; Liu, Y.; Raimondi, A.; Wang, J. KDE-Based Rainfall Event Separation and Characterization. Water 2023, 15, 580. [Google Scholar] [CrossRef]
  52. Anandhi, A.; Frei, A.; Pierson, D.C.; Schneiderman, E.M.; Zion, M.S.; Lounsbury, D.; Matonse, A.H. Examination of change factor methodologies for climate change impact assessment. Water Resour. Res. 2011, 47, 1–10. [Google Scholar] [CrossRef] [Green Version]
  53. Brekke, L.; Thrasher, B.L.; Maurer, E.P.; Pruitt, T. Downscaled CMIP3 and CMIP5 Climate Projections: Release of Downscaled CMIP5 Climate Projections, Comparison with Preceding Information, and Summary of User Needs; US Department of the Interior: Denver, CO, USA, 2013. [Google Scholar]
  54. Zhou, Q.; Leng, G.; Huang, M. Impacts of future climate change on urban flood volumes in Hohhot in northern China: Benefits of climate change mitigation and adaptations. Hydrol. Earth Syst. Sci. 2018, 22, 305–316. [Google Scholar] [CrossRef] [Green Version]
  55. Smith, K.; Strong, C.; Wang, S.Y. Connectivity between historical great basin precipitation and Pacific ocean variability: A CMIP5 model evaluation. J. Clim. 2015, 28, 6096–6112. [Google Scholar] [CrossRef]
  56. Choi, W.; Rasmussen, P.; Moore, A.; Kim, S. Simulating streamflow response to climate scenarios in central Canada using a simple statistical downscaling method. Clim. Res. 2009, 40, 89–102. [Google Scholar] [CrossRef] [Green Version]
  57. Graham, L.P.; Andreáasson, J.; Carlsson, B. Assessing climate change impacts on hydrology from an ensemble of regional climate models, model scales and linking methods—A case study on the Lule River basin. Clim. Change 2007, 81, 293–307. [Google Scholar] [CrossRef]
  58. Jung, I.W.; Chang, H.; Moradkhani, H. Quantifying uncertainty in urban flooding analysis considering hydro-climatic projection and urban development effects. Hydrol. Earth Syst. Sci. 2011, 15, 617–633. [Google Scholar] [CrossRef] [Green Version]
  59. Wilby, R.L.; Hay, L.E.; Gutowski, W.J.; Arritt, R.W.; Takle, E.S.; Pan, Z.; Leavesley, G.H.; Clark, M.P. Hydrological responses to dynamically and statistically downscaled climate model output. Geophys. Res. Lett. 2000, 27, 1199–1202. [Google Scholar] [CrossRef] [Green Version]
  60. Hay, L.E.; Wilby, R.L.; Leavesley, G.H. A comparison of delta change and downscaled GCM scenarios for three mountainous basins in the United States. J. Am. Water Resour. Assoc. 2000, 36, 387–397. [Google Scholar] [CrossRef]
  61. Leandro, J.; Chen, K.F.; Wood, R.R.; Ludwig, R. A scalable flood-resilience-index for measuring climate change adaptation: Munich city. Water Res. 2020, 173, 115502. [Google Scholar] [CrossRef] [PubMed]
  62. Cherry, L.; Mollendor, D.; Eisenstein, B.; Hogue, T.S.; Peterman, K.; McCray, J.E. Predicting parcel-scale redevelopment using linear and logistic regression-The Berkeley neighborhood Denver, Colorado case study. Sustainability 2019, 11, 1882. [Google Scholar] [CrossRef] [Green Version]
  63. Du, J.; Qian, L.; Rui, H.; Zuo, T.; Zheng, D.; Xu, Y.; Xu, C.Y. Assessing the effects of urbanization on annual runoff and flood events using an integrated hydrological modeling system for Qinhuai River basin, China. J. Hydrol. 2012, 464, 127–139. [Google Scholar] [CrossRef]
  64. Hamdi, R.; Termonia, P.; Baguis, P. Effects of urbanization and climate change on surface runoff of the Brussels Capital Region: A case study using an urban soil-vegetation-atmosphere-transfer model. Int. J. Climatol. 2011, 31, 1959–1974. [Google Scholar] [CrossRef]
  65. Nelson, K.C.; Palmer, M.A.; Pizzuto, J.E.; Moglen, G.E.; Angermeier, P.L.; Hilderbrand, R.H.; Dettinger, M.; Hayhoe, K. Forecasting the combined effects of urbanization and climate change on stream ecosystems: From impacts to management options. J. Appl. Ecol. 2009, 46, 154–163. [Google Scholar] [CrossRef] [Green Version]
  66. U.S. EPA Estimating Change in Impervious Area (IA) and Directly Connected Impervious Areas (DCIA) for Small MS4 Permit. Available online: https://www3.epa.gov/region1/npdes/stormwater/ma/MADCIA.pdf (accessed on 7 March 2020).
  67. Hwang, H.; Lansey, K.; Quintanar, D.R. Resilience-based failure mode effects and criticality analysis for regional water supply system. J. Hydroinformatics 2015, 17, 193–210. [Google Scholar] [CrossRef] [Green Version]
  68. Mugume, S.; Gomez, D.; Butler, D. Quantifying the Resilience of Urban Drainage Systems Using a Hydraulic Performance Assessment Approach. In Proceedings of the 13th International Conference on Urban Drainage; IAHR (International Association for Hydro-Environment)/IWA (International Water Association), Sarawak, Malaysia, 7–11 September 2014; pp. 7–12. [Google Scholar]
  69. Li, J.; Burian, S.; Ryan, J.; Oroza, C. Exploring Cost-effective Implementation of Real-time Control to Enhance Flooding Resilience against Future Rainfall and Land Cover Changes. Authorea 2023. Preprint. [Google Scholar] [CrossRef]
  70. Li, J.; Hansen, C.; Burian, S. Understanding rainfall nonstationarity to incubate adaptive stormwater infrastructure retrofits. Authorea 2023. Preprint. [Google Scholar] [CrossRef]
  71. Zhou, Q.; Leng, G.; Su, J.; Ren, Y. Comparison of urbanization and climate change impacts on urban flood volumes: Importance of urban planning and drainage adaptation. Sci. Total Environ. 2019, 658, 24–33. [Google Scholar] [CrossRef] [PubMed]
  72. Jung, M.; Kim, H.; Mallari, K.J.B.; Pak, G.; Yoon, J. Analysis of effects of climate change on runoff in an urban drainage system: A case study from Seoul, Korea. Water Sci. Technol. 2015, 71, 653–660. [Google Scholar] [CrossRef]
  73. Li, J.; Burian, S. Evaluating real-time control of stormwater drainage network and green stormwater infrastructure for enhancing flooding resilience under future rainfall projections. Authorea 2023. Preprint. [Google Scholar] [CrossRef]
  74. Li, J. The Performance Comparison between RTC and GI to Mitigate Impacts of Climate Change and Urban Redevelopment on Urban Flooding. Authorea 2023. Preprint. [Google Scholar] [CrossRef]
  75. Kastridis, A.; Kirkenidis, C.; Sapountzis, M. An integrated approach of flash flood analysis in ungauged Mediterranean watersheds using post-flood surveys and unmanned aerial vehicles. Hydrol. Process. 2020, 15, 4920–4939. [Google Scholar] [CrossRef]
Figure 1. The study case located in Sugar House Neighborhood, Salt Lake City, Utah, USA, is represented by the red arrows pointed maps.
Water 15 02663 g001
Figure 2. (a) The historical IDF curves from 2001–2015 (yr is for the year). (b) The Future IDF curves from 2085–2099 (yr is for the year). (c) Historical and future artificial rainfalls.
Water 15 02663 g002aWater 15 02663 g002b
Figure 3. Regressions of the historical imperviousness percentage in the past 81 years ((A). Linear function fitting with R2 equal to 0.76; (B). Two-order polynomial function fitting with R2 equal to 0.84; (C). Logarithmic function fitting with R2 equal to 0.79), aimed to select the best fitting function to predict future changes of imperviousness percentage.
Water 15 02663 g003
Figure 4. Visualization for the sub-catchment imperviousness percentage evolutions (green diamond is the mean value; yellow line represents the median value; gray box edges are the 25th and 75th percentile; red lines are the maximum; the black circles are fillers of boxes).
Water 15 02663 g004
Figure 5. System performance curve for urban drainage system under rainfall event.
Water 15 02663 g005
Figure 6. The impacts of urbanization and climate change on system performance curves under 100 year-12 h (Sim #19 to #27 scenarios) rainfall event.
Water 15 02663 g006
Figure 7. The impacts of urbanization and climate change on the flooding severity under 100 year-12 h (Sim #19 to #27 scenario) rainfall event.
Water 15 02663 g007
Figure 8. The impacts of urbanization and climate change on (A) the system flooding resilience and (B) its relative changes with respect to the reference scenario Sim#19 under 100-year, 12-h rainfall event (The yellow arrow points to the direction from the least to most impacts scenario).
Water 15 02663 g008
Figure 9. Difference between system-level and junction-level flooding resilience under 100-year,12-h (Sim #19 to #27 scenarios) rainfall event.
Water 15 02663 g009
Figure 10. The correlation between the relative changes in future flooding resilience and the increasing (a) imperviousness percentage and (b) rainfall intensity under 100 year-12 h (Sim #19 to #27 scenarios) rainfall event.
Water 15 02663 g010
Figure 11. Comparisons of impacts of urbanization and climate change on traditional (Reso) and new (Resefr) system flooding resilience metrics under (A) 2-year (Sim #1 to #9 scenarios), (B) 10-year (Sim #10 to # 18 scenarios); (C) 100-year-12 hour (Sim #19 to #27 scenarios) rainfall events.
Water 15 02663 g011
Table 1. Information summary for the SWMM model.
ConduitsSub-CatchmentsJunctions
NumberDiameter
(m)
Slope (%)RoughnessNumberArea (km2)Slope (%)Imperviousness Ratio (%)NumberElevation *
(m)
1840.5 to 1.5 0.06 to 0.400.01 to 0.016280.04 to 0.2 1.6 to 6.218 to 781814320 to 4370
Note: * refers to the elevation above the sea level.
Table 2. Simulation scenario matrix (‘Sim’ is the abbreviation of ‘Simulation’, ‘#’ is for number).
Land Cover ChangeHistoricalRCP4.5RCP8.5
Rainfall Change
Historical_2yr_12hrSim #1Sim #2Sim #3
RCP4.5_2yr_12hrSim #4Sim #5Sim #6
RCP8.5_2yr_12hrSim #7Sim #8Sim #9
Historical_10yr_12hrSim #10Sim #11Sim #12
RCP4.5_10yr_12hrSim #13Sim #14Sim #15
RCP8.5_10yr_12hrSim #16Sim #17Sim #18
Historical_100yr_12hrSim #19Sim #20Sim #21
RCP4.5_100yr_12hrSim #22Sim #23Sim #24
RCP8.5_100yr_12hrSim #25Sim #26Sim #27
Disclaimer/Publisher’s Note: The statements, opinions and data contained in all publications are solely those of the individual author(s) and contributor(s) and not of MDPI and/or the editor(s). MDPI and/or the editor(s) disclaim responsibility for any injury to people or property resulting from any ideas, methods, instructions or products referred to in the content.

