Article

Fundamental Study on the Development of an Inexpensive Velocity Meter for River Floods Using Stagnation Points

1
Graduate School of Science and Technology, Department of Civil and Environmental Engineering, Kumamoto University, Kumamoto 860-8555, Japan
2
Laboratory for Watershed Disaster Resilience, Kumamoto Prefectural University, Kumamoto 862-8570, Japan
3
Organization for Regional Co-Creation of Sustainable Communities and Watershed Disaster Resilience, Kumamoto Prefectural University, Kumamoto 862-8570, Japan
4
Department of Civil and Environmental Engineering, Faculty of Advanced Science and Technology, Kumamoto University, Chuo-ku, Kumamoto 860-8555, Japan
*
Author to whom correspondence should be addressed.
Water 2023, 15(14), 2625; https://doi.org/10.3390/w15142625
Submission received: 21 June 2023 / Revised: 10 July 2023 / Accepted: 11 July 2023 / Published: 19 July 2023
(This article belongs to the Section Hydrology)

Abstract

:
In recent years, climate change has occurred on a global scale, causing frequent flooding in many regions. In response to this situation, watershed-wide flood management is attracting attention around the world as a promising approach. Under these situations, Japan has also made a policy shift to watershed-based flood management, which aims to manage floods and control runoff in the entire watershed. For this management, it is essential to obtain areal hydraulic information, especially flow information, from each location in the watershed. To measure river flow, it is necessary to measure water level and velocity. While it is becoming possible to make area-based observations of water levels using simple methods, various attempts have been made to measure the velocity, but continuous data cannot be obtained using simple methods. Low-cost flow velocity meters would facilitate the simultaneous and continuous accumulation of data at multiple points and enable the acquisition of areal flow information for watersheds, which is important for watershed-based flood management. This study aims to develop an inexpensive, simple velocity meter that can be used to make areal measurements within watersheds, and to make this velocity meter usable by residents, thereby contributing to citizen science. Therefore, experimental studies were conducted on a method of measuring flow velocity based on the simple physical phenomenon of rising water surface elevations due to increased pressure at the stagnation point. First, we placed the cylinders in the river or waterway, observed the afflux, and compared the velocities calculated using Bernoulli’s theorem with the velocities at the experimental site. By multiplying the calculated flow velocity by 0.9, the average flow velocity was found to be obtained. Then, by using a large pitot tube with a hole diameter of about 5 mm, the rise in water level in the pitot tube was measured using a pressure-type water level meter, and the flow velocity was calculated using the pitot tube theory and compared with the flow velocity at the location of the hole at the experimental site. By multiplying the calculated velocity by 1.04, the velocity at the location of the hole can be obtained. In addition, the same experiment was conducted using a pitot tube with a slit. The slit tube was placed vertically with the slit facing upstream. Measurements were taken in the same method as for the pitot tube velocity meter and compared to the velocity at that point. By multiplying the calculated flow velocity by 0.99, the average flow velocity at that location can be obtained. These results indicate that a flow velocity measurement method utilizing stagnation points can lead to the development of inexpensive velocity meters. Because of the simplicity of this meter, there is a possibility that citizens can participate in the observation to obtain information on the flow velocity during floods and areal information within a watershed.

1. Introduction

In recent years, the effects of climate change have been manifested on a global scale [1]. In Japan, it is estimated that under the RCP2.6 climate change scenario (equivalent to a 2 °C rise), the frequency of flooding will approximately double by the end of the 21st century [2]. In Japan, we are already seeing the effects of climate change through events such as the Northern Kyushu Flood in 2017, the Western Japan Flood in 2018, Typhoon Hagibis in 2019, and the torrential rains in July 2020, which all caused significant damage. Considering this situation, the Ministry of Land, Infrastructure, Transport and Tourism of Japan announced a shift from conventional flood control measures to watershed flood management in response to a Council for Social Infrastructure Development report in July 2020 [3].
Watershed flood management is defined as flood management for all land in the entire watershed. The authors categorize the methods of watershed flood management into three types: runoff control measures to control runoff coming out of the respective locations; flood control measures to manipulate the flooded area, velocity, and depth of flood waters; and soft measures by restricting land use and revising laws within the watershed. Such approaches are also a global trend, represented by Eco-DRR [4], Nature-based Solutions (NbS) [5], and Natural Flood Management (NFM) in the UK [6].
To implement watershed flood management measures for the entire watershed as described above, it is necessary: to determine the amount of runoff by land use; to determine the areal flow rate, including tributaries and channels; and to determine the flow velocity and water depth in the floodplain at the time of flooding. However, while conventional methods can be used to determine the water level over an area, the measurement of flow velocity over an area has not yet been conducted due to cost and other issues.
River discharge is important basic data in assessing and managing water resources, biological habitats, and watershed management [7,8,9,10]. In general, river discharge is determined by the velocity–area method. This method measures the average cross-sectional velocity of a river or channel and multiplies it by the cross-sectional area to calculate the discharge [11,12]. Recent technological developments have made it relatively inexpensive and easy to measure the water levels of rivers and waterway channels, which are used to determine the cross-sectional area. In flow velocities, acoustic doppler current profiler (ADCP) measurements [13,14,15] have attracted attention as contact-type velocity measurement devices. By floating ADCPs vertically downward on the water surface, it is possible to simultaneously measure the vertical profile of flow velocity and water depth in a cross-sectional area. However, ADCPs require direct measurement by the observer at the time of measurement, are difficult to measure throughout a single rainfall event, and are expensive. For this reason, non-contact velocity measurement methods such as radio current meters [16,17,18] and video image analysis methods [19,20,21,22,23] have attracted much attention in recent years. Video image analysis methods include particle tracking velocimetry (PTV), large-scale particle image velocimetry (LSPIV), and space–time image velocimetry (STIV). The PTV method calculates the flow velocity by determining the locus of the movement of suspended matter and other substances in the flow path. The LSPIV method calculates velocity vectors by tracking the unevenness of the water surface and changes in the shading of the river water. The STIV method calculates the flow velocity in the mainstream direction by setting inspection lines in the mainstream direction on the image and stacking the lines at each time. However, images at night and during heavy rainfall are unclear, and continuous data acquisition is currently difficult. Radio current meters from above the water surface measure surface current velocities by measuring the irregularities caused by waves forming on the surface, but they are expensive. Although these methods are known for their high accuracy in flow velocity measurement, they are expensive in terms of installation and the cost of the equipment itself.
In Japan, flood discharge observation has generally been conducted by floats for many years [24,25]. The observation with floats is a method of measuring flow velocity by having operators throw in floats during high water and measuring the time between observation points, although it has been reported that it is difficult to capture peak discharge and there are also hydrological problems [26]. For this reason, the introduction and study of velocity meters with the aforementioned high accuracy are underway. However, although these meters are capable of highly accurate velocity observation during high water [16,27,28], it is difficult to make simultaneous observations from the same rainfall because they must be handled as continuous data; there are requirements for their installation locations; and it is not practical in terms of price to install them in many tributary rivers in the watershed.
In recent years, a method has been proposed to estimate the flow velocity from the afflux by utility poles, etc., using video and still images taken by the residents of inundation conditions during flooding and without using existing velocity meters [29]. However, the hydrological accuracy of this method has not been fully discussed.
Therefore, this study describes the results of research on a simple method for estimating or measuring the flow velocity from physical phenomena utilizing stagnation points, considering data on the afflux of structures in flowing water, as per the above study [29].

2. Purpose of the Study

The purpose of this study is to develop an inexpensive and fabricated method for measuring flow velocity by focusing on the phenomenon in which velocity energy is converted to potential energy when a stagnation point occurs relative to the flow to determine the areal flow velocity in watersheds. The pitot tube is a method that takes advantage of this phenomenon and is used in many fields, including aircraft. However, they are not used in rivers and channels because of the large external forces during floods and the flow of sediment. However, the phenomenon of afflux at stagnation points is a very simple physical phenomenon, and measuring the elevation could easily be used to measure the flow velocity. Based on these considerations, the following three studies were conducted to obtain fundamental knowledge for the development of a velocity meter using a stagnation point.

2.1. Afflux by Poles during Flooding

The afflux by a pole due to flood flow, as captured in photographs, is discussed through a literature review and a simple experiment using cylinders.

2.2. Large Pitot Tube

A hydraulic experiment will be conducted to study large pitot tubes with different tip shapes and a hole of about 1 cm in diameter at the tip.

2.3. Slit Pitot Tube

Hydraulic experiments will be conducted to study slit-type pitot tubes with slits in them.

3. Afflux by Poles, Piers, etc., during Flooding

The widespread use of mobile phones has led to the capture of video and still images of floods taken by residents. Nakano et al. [29] estimated the flow velocity in the flooded area from the afflux by the pole in an image taken by a resident during the Northern Kyushu Flood in 2017. An estimation of the flow velocity using stagnation point pressure or afflux is calculated from Bernoulli’s theorem based on the elevation of the river. From Bernoulli’s theorem, Equation (1) holds for an open channel where the energy loss is assumed negligible.
v 2 2 g + p ρ g + H = c o n s t
The first term represents the velocity head; the second, the pressure head; and the third, the positional head, the sum of which is constant. v is the flow velocity, g is the gravitational acceleration, p is the pressure, ρ is the water density, H is the water level, and h is the afflux. Nakano et al. [29] estimated the flow velocity from the afflux of the pole using Equation (2), assuming that the velocity head at the surface is converted to the elevation because a stagnation point occurs in front of the impact on the pole (cylinder) and the flow velocity is zero. Nakano et al. [29] obtained the actual elevation from the ratio of the known thickness of the pole to the elevation in the image:
v = α 2 g h
Equation (2) with α = 1 can be considered as the approximate value of the flow velocity, but the phenomenon of the elevation is not so simple. Therefore, it is necessary to determine the correction coefficient α in Equation (2).
There have also been many studies on objects that impede flow, such as cylinders, flow around the object, and riverbed excavation [30,31,32]. However, few studies estimate the flow velocity from afflux. For example, Watanabe et al. constructed an evaluation equation for the external force acting on the surface water level difference between the upstream and downstream of the pier and presented an equation relating the water level difference to the flow velocity [33]. However, this study calculates the fluid force acting on a cylinder by numerical analysis and does not represent actual measurements. Therefore, the results may differ depending on the parameters used in the analysis, and the calculated relational equations may also be different. In addition, Nakano et al. estimated flood velocity using the elevation at which the flood flow was raised by a pole and other structures from a video taken during a flood event [29]. Detailed verification has not been conducted for the estimated values, as actual measurements have not been obtained. Yokoi estimated the flow velocity by Bernoulli’s formula using the afflux [34]. Matsutomi et al. showed the velocity coefficients and inundation distribution of buildings and other structures for the simplified inundation velocity estimation method they proposed for tsunami flood flows [35]. This velocity coefficient is a potentially applicable value for the correction coefficient in Equation (2) and was obtained from laboratory experiments. However, it is difficult to apply this equation to rivers because it is based on the flood flow of a tsunami, which may differ from the hydraulic phenomena in rivers. These two studies were based on laboratory experiments and have not been verified in a real channel or river. Therefore, in this study, correction coefficients for Equation (1) are examined for an actual channel and river velocity.

3.1. Verification Methods

The experimental sites were actual channels and rivers where the flow velocity could be measured. The number of sites was nineteen. The velocity at the sites was measured using a propeller-type velocity meter (KENEK VR-401). The velocity near the surface (hereinafter referred to as “surface velocity”) and the velocity at 60% of the depth from the water surface (hereinafter referred to as “mean velocity”) were measured at all sites. At each location, the velocity was measured four times every five seconds during one measurement, and the four values were averaged to obtain the velocity at each depth. The water level at the experimental sites was measured using a staff when the cylinder was not placed in the low water channel. Next, we measured the water level upstream of the cylinder when the cylinder was placed (Figure 1). The difference between these two water levels was represented as h in Equation (2) to obtain the flow velocity. The cylinders used in this experiment were 40 mm in diameter and sufficiently longer than the water depth at all sites. The measurement range for this experiment was the water level where the height of the cylinder used was higher than the afflux.
Next, because the afflux by the cylinder is considered to differ depending on the diameter of the cylinder, we conducted a similar experiment to the one above using cylinders of different diameters (Figure 1). First, the surface velocity and mean velocity at the experimental site were measured using the propeller-type velocity meter. The water level at the site was measured using the staff. Cylinders with diameters of 40 mm, 120 mm, and 200 mm were then placed at the site, and the afflux of each cylinder was observed. In this case, one cylinder was placed at a time.

3.2. Results

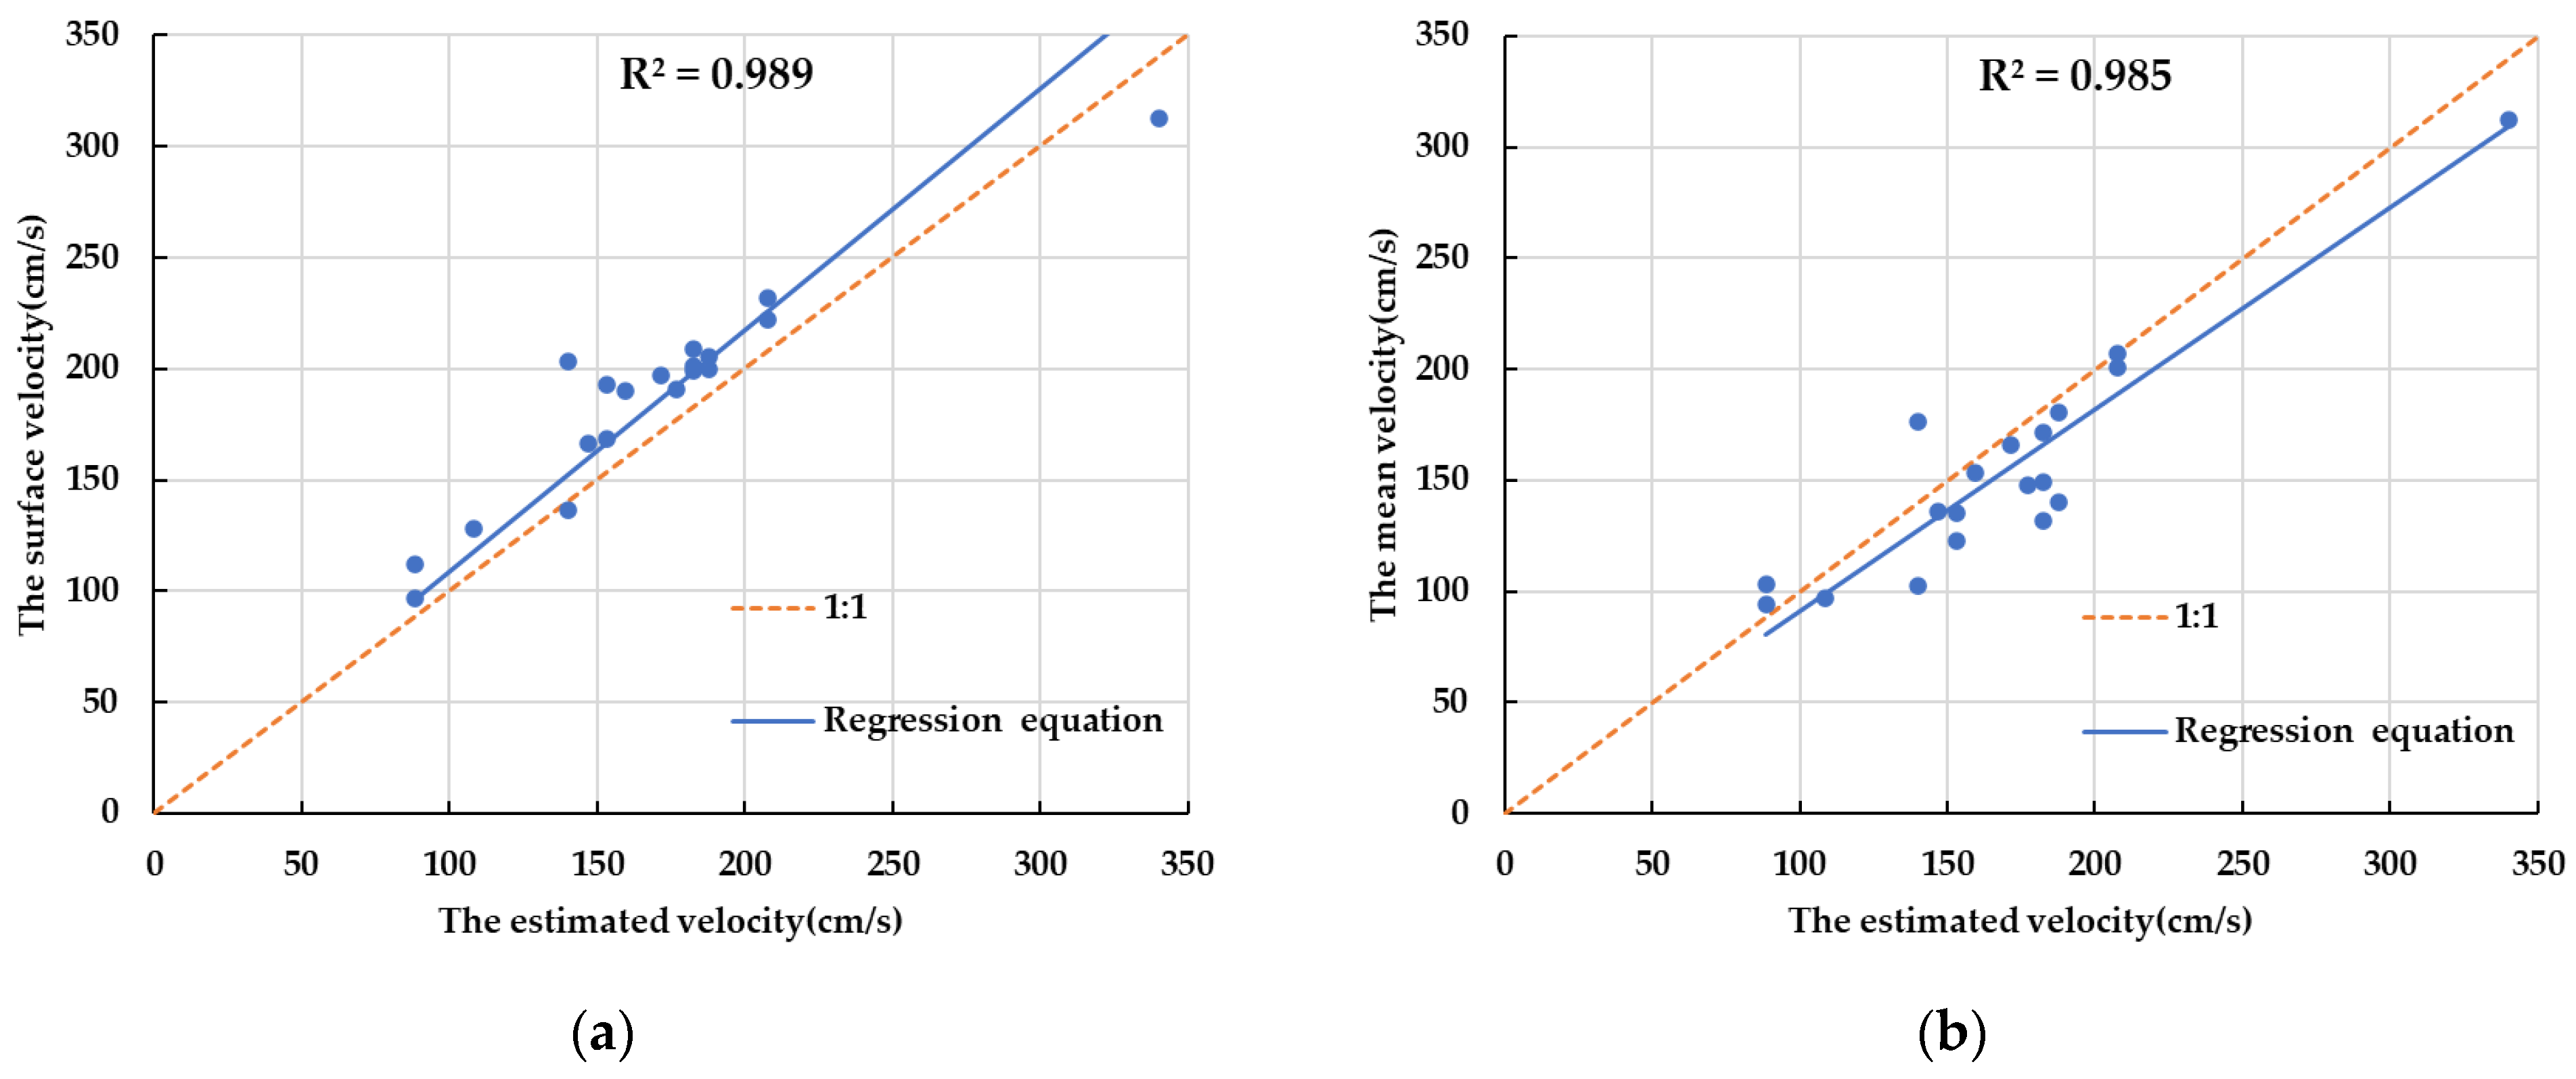
In Figure 2, the velocity calculated from the afflux by the cylinder (hereinafter referred to as “estimated velocity”) is compared with the surface velocity and the mean velocity, respectively. The estimated velocity showed a tendency to be slower than the surface velocity (Figure 2a) and faster than the mean velocity (Figure 2b).
The regression equations used for the estimated velocity ( v h ), surface velocity ( v s ), and mean velocity ( v 0.6 ) were Equation (3) for surface velocity and (4) for mean velocity, and the correlation was high with coefficients of determination R 2 = 0.989 and R 2 = 0.985 , respectively. This result proved that it is possible to obtain the actual velocity from the afflux using the cylinder. Furthermore, a high correlation with the surface velocity suggests that the elevation is strongly related to the velocity:
v s = 1 . 09 v h
v 0.6 = 0 . 91 v h
The results proved that a mean velocity of 0.9 was obtained by multiplying the estimated velocity from photographs of poles taken by residents and that this method is sufficiently practical.
Next, the result of the estimated velocity for the cylinders of different diameters is provided in Table 1. The surface velocity was 166.4 (cm/s) and the mean velocity was 135.7 (cm/s).
Table 1 showed that the estimated velocity tended to increase as the diameter increased. For the 40 mm diameter cylinder, the estimated velocity was less than the surface velocity, but close to the mean velocity. The estimated velocities at diameters of 120 and 200 mm were higher than the surface velocity. However, it was proven that the surface velocity could be approximately measured; the result suggested that it is possible to estimate the velocity of the flood flow on the landside from the afflux using cylindrical structures such as poles.

4. Large Pitot Tube

4.1. Velocity Meter Based on Pitot Tube Principle

The pitot tube currently available on the market is very thin in diameter and is not suitable for river flood observation due to its strength. On the other hand, the pitot tube is simple in principle, and the velocity can be determined by measuring the afflux or pressure at the stagnation point. The cost of pressure meters has recently been reduced, and we consider that a velocity measurement method utilizing the pitot tube principle is feasible. The principle of the pitot tube and the equation for obtaining the velocity are shown in Figure 3 [36]. The number 0 in Figure 3 is the point where the stagnation point occurs at the tip of the pitot tube. P 0   and   v 1 , P 1 are the velocity and pressure, respectively, at 0 and 1. g is the gravitational acceleration and ρ is the water density.
The conventional pitot tubes are often small, making it difficult to measure velocity in high water. There is also an existing hydro-pressure depth velocity meter that uses the pitot tube principle to simultaneously measure water depth and velocity. However, this meter is not simple and is expensive because it is suspended from the bridge and requires special equipment for measurement. In the current study, prototypes were made for the tip of the pitot tube where the stagnation point of the pitot tube occurs, and for the total pressure tube (vertical tube). The total pressure at the stagnation point is increased from the static pressure by the dynamic pressure. Therefore, the water level in the vertical tube is higher than the water level of static pressure, and the water level is measured to obtain the difference from the water level of static pressure. If the difference in the water level is h 1 , the velocity ( v ) can be obtained as in the following equation; g is the gravitational acceleration:
v = 2 g h 1

4.2. Creation of Large Pitot Tube Velocity Meters

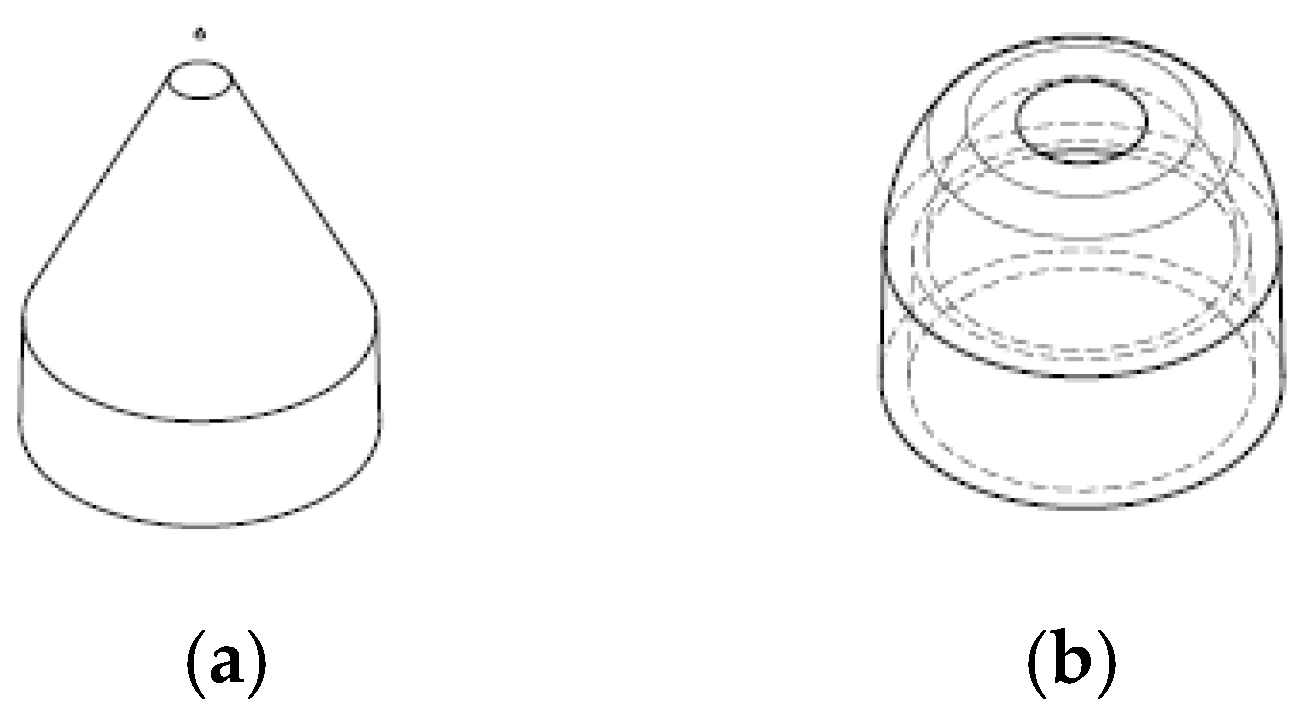
The large pitot tube velocity meter consists of a horizontal tube (65 mm in diameter) and a vertical tube (40 mm in diameter), as shown in Figure 4. The tip of the horizontal tube has a nozzle with a 1 cm diameter hole. A pressure-type water level meter (HOBO Water Level Data Logger U20L-04, manufactured by Onset Computer) (hereinafter referred to as “water level meter”) is housed in the horizontal tube, with the top of the vertical tube open and the downstream side of the horizontal tube closed. When the nozzle is directed upstream of the flow, the hole becomes a stagnation point and the velocity energy is zero, so the pressure at the nozzle point is assumed to increase, and consequently, the pressure in the horizontal tube also increases by the velocity energy. Two types of nozzles (Figure 5), a sharp type A and a round type B, were used to evaluate the difference in nozzle shapes.

4.3. Verification Methods

In this verification, the velocity, water level, and pressure in the tube were measured in actual rivers and channels. The number of sites was eight. The velocity near the bed of an experimental site (hereinafter referred to as “bed velocity”) was measured using the propeller-type velocity meter. The velocity was measured four times every five seconds during one measurement, and the average value was used as the bed velocity at the site. The static water levels and water levels in the tube were measured using the water level meter at the sites. At the sites measured by the propeller-type velocity meter, the large pitot tube velocity meters were placed near the bed (Figure 6), with the hole facing the flow direction, and the pressure water level meter inside the tube was set to record every second. This measurement was conducted for 3 min. The water level at the site was measured using a water level meter. In addition, the same water level meter was placed at each site as an atmospheric pressure meter. The measurement range for this experiment was the water level higher than the horizontal tube and lower than the opening of the vertical tube.

4.4. Result

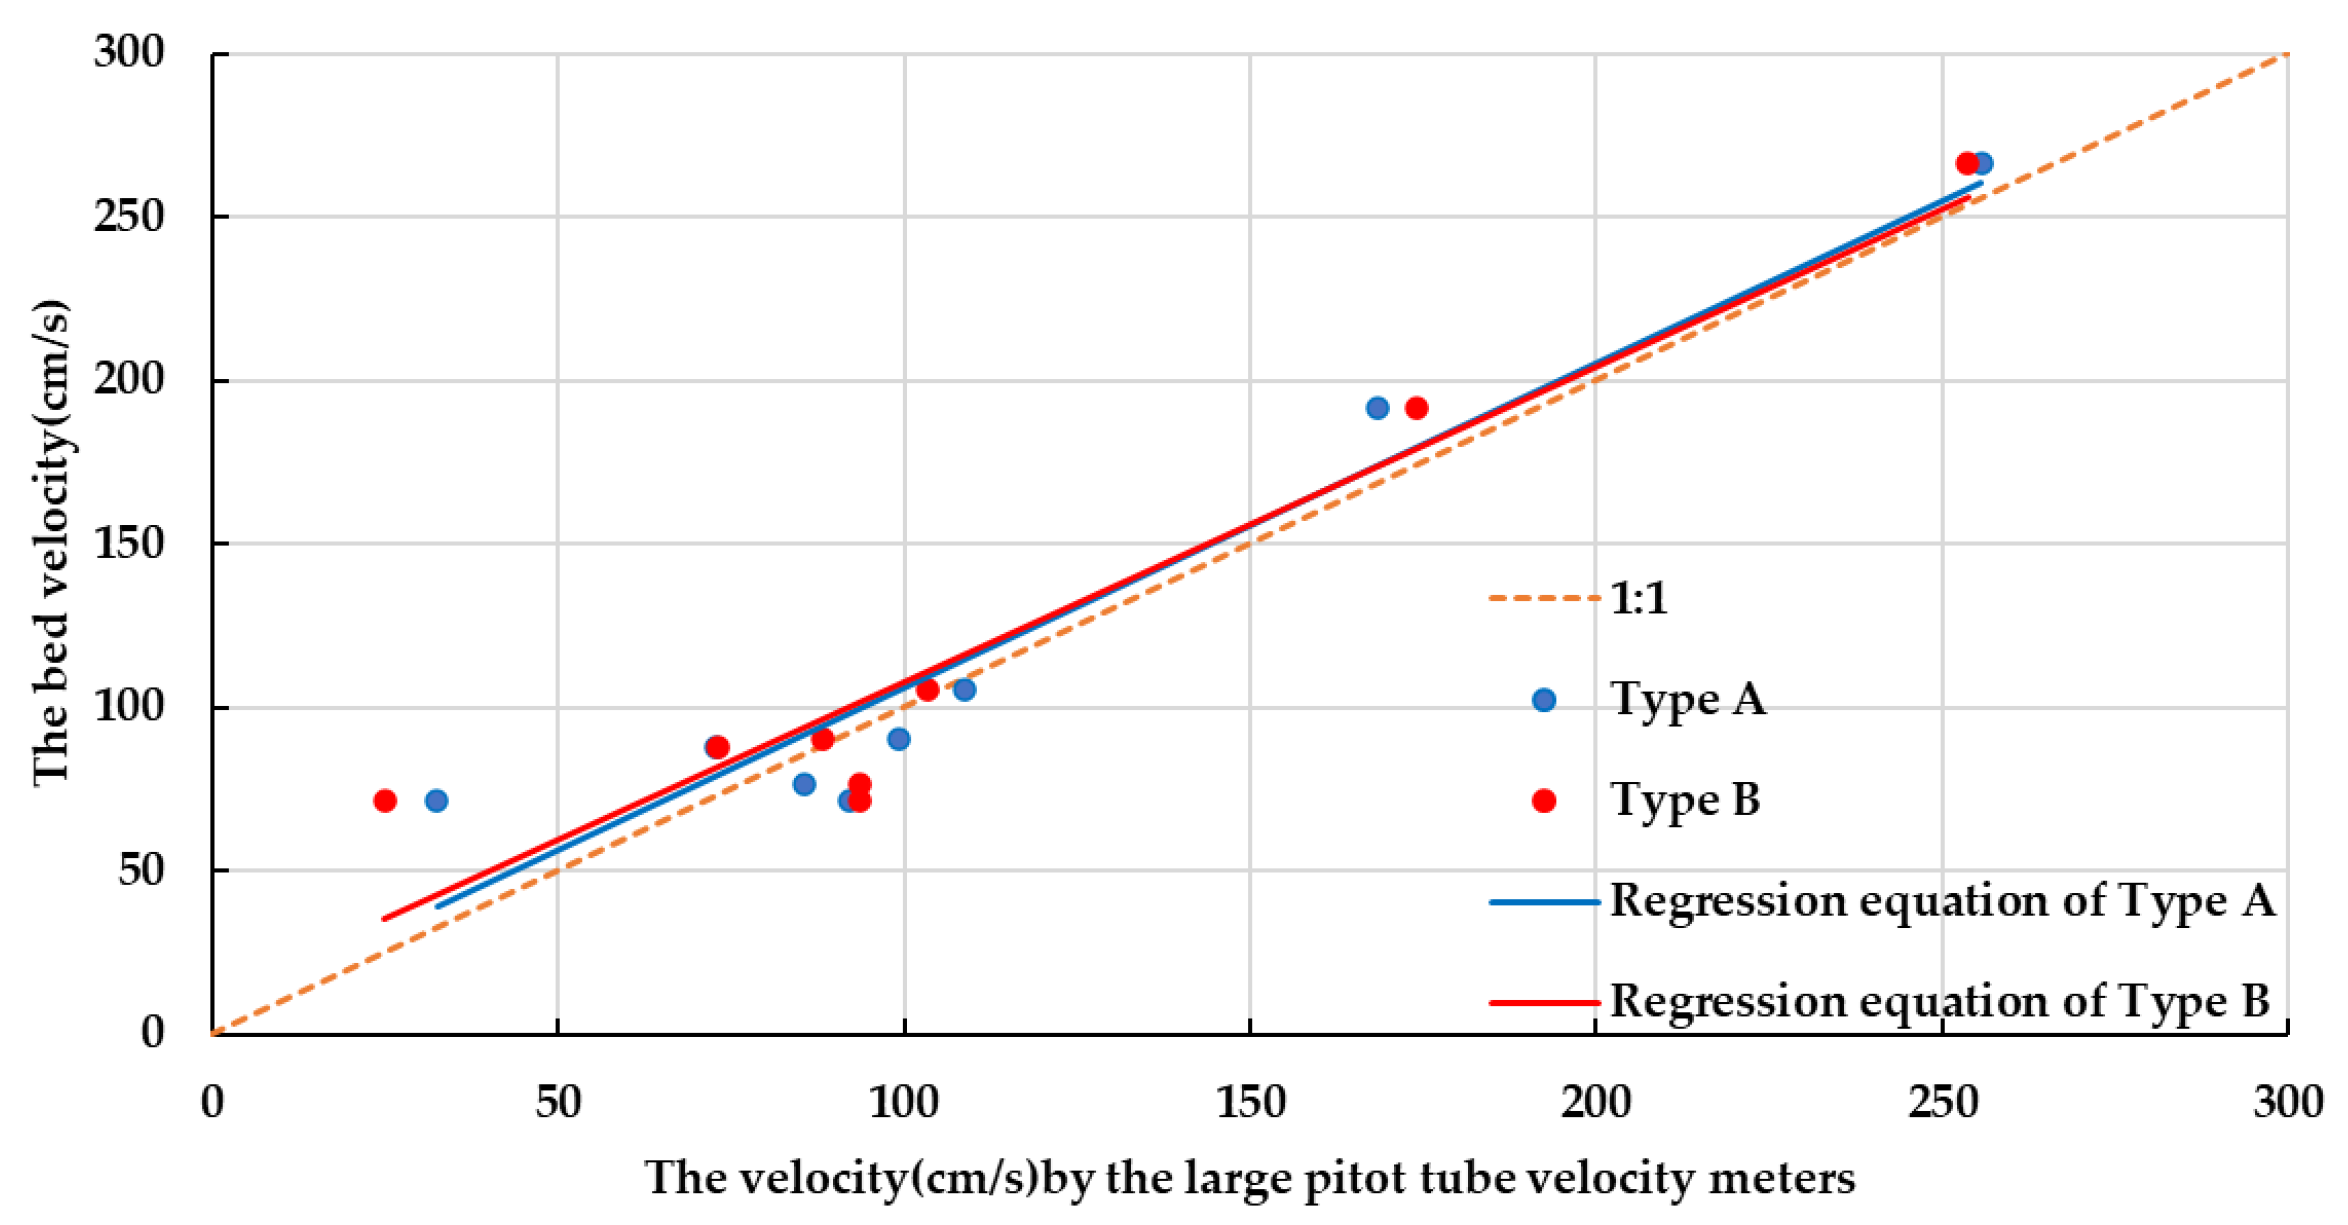
In Section 4.3, the difference between the static water level measured and the water level in the tube is h 1 , and the velocity is obtained from Equation (5) using the large pitot tube velocity meter. Figure 7 shows a comparison of the bed velocities measured by the propeller-type velocity meter with the velocities measured using the large pitot tube velocity meters of types A and B. In this verification, the large pitot tube velocity meter was installed in the bed, so only the bed velocity was compared. The same regression, Equation (6), was obtained for types A and B. The velocity measured using the large pitot tube velocity meter and the propeller-type velocity meter had a linear relationship and were close to each other:
y = 1 . 04 x
where y is the bed velocity and x is the velocity using the large pitot tube velocity meter. The correlation is quite high with the coefficient of determination at R 2 = 0.98 . There was no difference observed between the nozzle shapes. The results indicated that once a stagnation point occurs, the difference in shape has little effect on the flow velocity. Therefore, the large pitot tube velocity meter can be used to measure the velocity sufficiently.

5. Slit-Type Pitot Tube Velocity Meter

5.1. Idea and Principle

The large pitot tube velocity meter proved to be able to measure the velocity at a single point in the river and channel, respectively, quite accurately. However, the relative positions in the river and channel change when the water levels fluctuate during a flood, so, a correction is necessary to obtain the mean velocity. Moreover, there is concern about blockage due to debris because the large pitot tube velocity meter has only one hole. To solve these problems, an experiment was conducted using the slit-type pitot tube velocity meter (hereinafter referred to as “slit-type velocity meter”), in which slits were placed vertically in a vertically installed tube from the bed to the surface of the water.
The slit-type velocity meter consists of two parts: a vertical tube with a 5 mm wide slit, and a water level meter storage in the lower part. A 5 mm wide vertical slit was made in a transparent acrylic tube measuring 40 mm in diameter. The revenue part of the water level meter was made using a 3D printer (Figure 8).
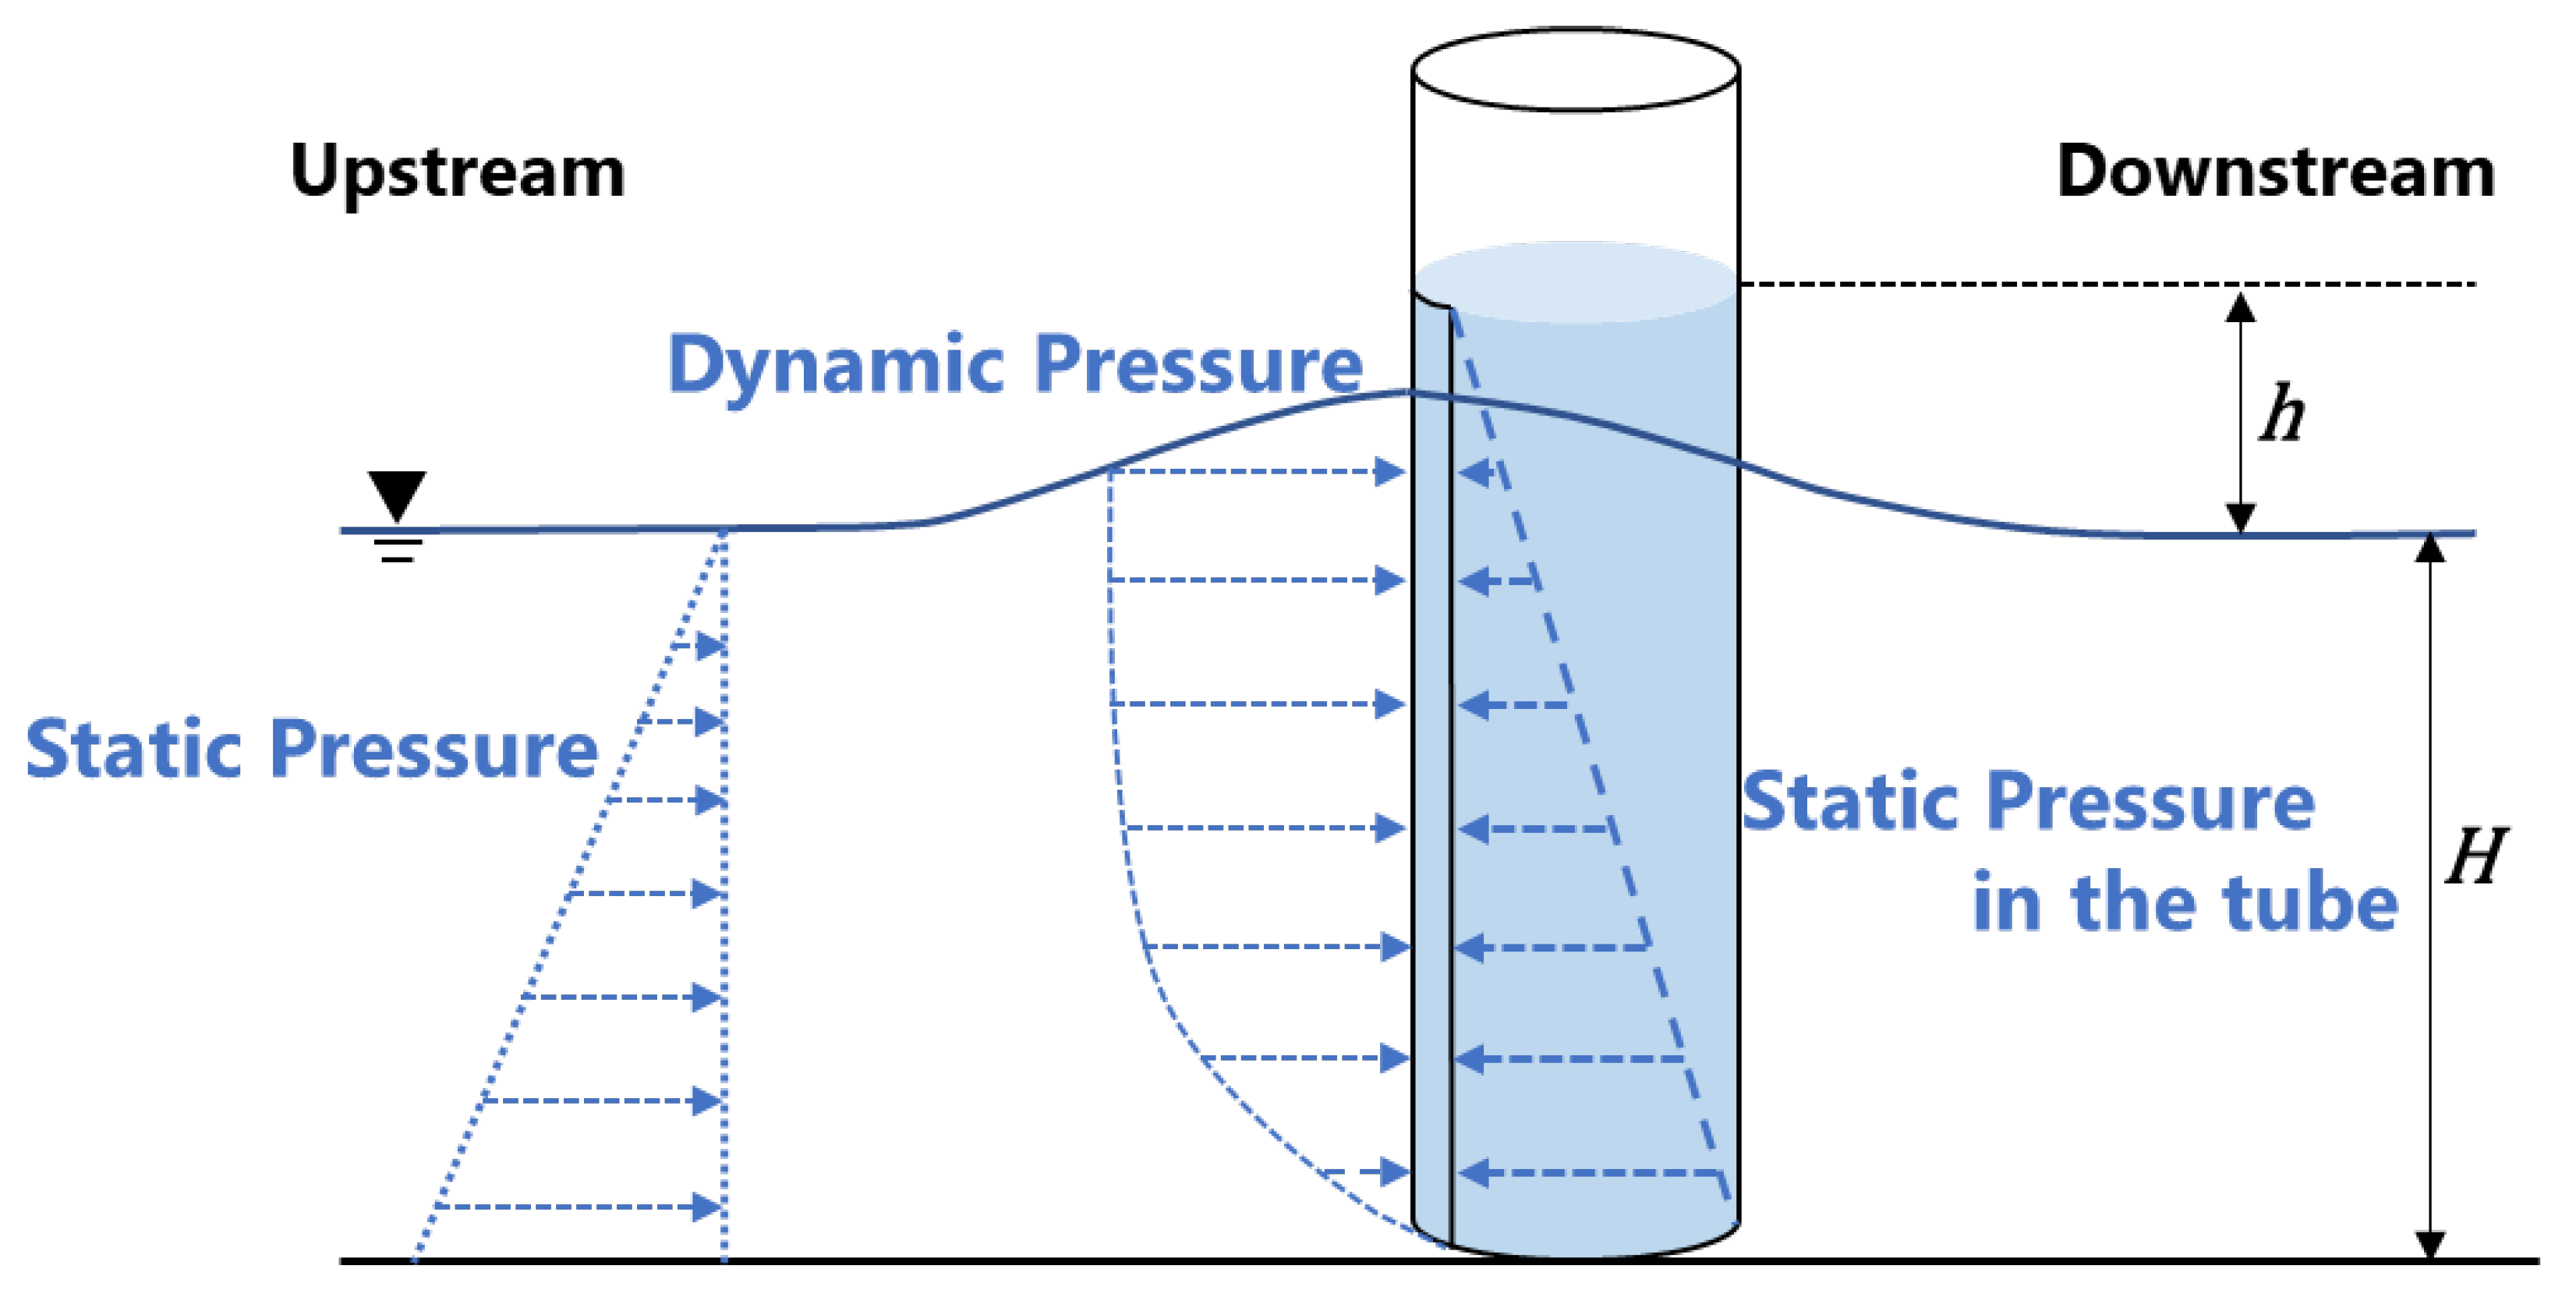
The principle of the slit-type pitot tube is shown in Figure 9. The total pressure (sum of the static and dynamic pressure) upstream, which acts on the slit and the water level in the vertical tube, is considered to be high enough to balance the static pressure in the tube. The water level rise is expected to be slightly lower because the dynamic pressure is strictly higher near the water surface, creating a downward flow and carrying momentum downward in the tube; however, this phenomenon is neglected here. From this principle, Equation (7) can be devised:
0 H ρ g h z b d z + 0 H ρ v z 2 2 b d z = 0 H + h ρ g h z b d z
where v is the velocity, g is the gravitational acceleration, p is the pressure, ρ is the water density, H is the water level, h is the difference between the water level in the vertical tube and H , and b is the slit width. In Equation (7), on the left side, the first term indicates the static pressure acting on the slit, the second term indicates the dynamic pressure, and the right side indicates the static pressure in the tube. From Equation (7), the velocity v obtained from the slit-type velocity meter is considered to result in Equation (8):
v = 2 g H H + h h z d z

5.2. Verification Method

The same method used for the large pitot tube velocity meter was also used for the verification, which was conducted at 36 sites in rivers and channels. The velocity at the experimental sites was measured using the propeller-type velocity meter. At the time of the measurements, the surface and mean velocities were measured at all sites and the bed velocity at 30 sites. The velocity was measured four times every five seconds during one measurement, and the average value was used as the surface, mean, and bed velocities at the sites. Next, the water level was measured with the water level meter using the same method described in Section 4. The slit-type velocity meter was installed with the slit facing upstream and the water level meter storage at the bed of the site. The water level meter used for the slit-type velocity meter was set to record every second. This measurement was performed for three minutes. The measurement range for this experiment was the water level higher than the storage and lower than the opening of the vertical tube.
In addition, the propeller velocity meter was used to measure the velocities at six depths (surface, 20%, 40%, 60%, 80%, and bottom) to evaluate the depth at which the slit-type velocity meter measures the velocity.

5.3. Result

At one of the survey sites (surface velocity: 344.3 cm/s, mean velocity: 300.6 cm/s), a phenomenon occurred when the water level in the tube was higher than the water level in front of the slit while the slit-type velocity meter was measuring the velocity at the site. In this phenomenon, it was observed that water flowed out from inside the tube through the slit. This is likely because the pressure applied to the slit above the water surface is atmospheric, so when the water level in the tube is higher than the water level in front of the slit, water flows out from inside the tube and is not sufficiently converted into the potential head (pressure) as a result of the velocity head. The results suggest that such phenomena occur at high velocities above certain values. Therefore, the measurements were conducted with the slit above the surface water level blocked. h is the difference between the static water level measured by the water level meter and the water level in the tube; the velocity value from the slit-type velocity meter was obtained using Equation (2). The single regression equations between the surface velocity ( v s ) , the bed velocity ( v b ) , and the velocity ( v ) measured by the slit-type velocity meter were (9) and (10), respectively, and the coefficients of determination were R 2 = 0.94 ,   0.89 , respectively. This confirms the tendency of the velocity values obtained using the slit-type velocity meter to be slower than surface velocities and faster than bed velocities, which agreed with the theory.
v s = 1 . 15 v
v b = 0.64 v  
The relationship between the mean velocity and the velocity measured by the slit-type velocity meter is shown in Figure 10.
The single regression equation of this relationship approximates the mean velocity as follows:
v m = 0 . 99 v
where v m is the mean velocity and v is the velocity measured by the slit-type velocity meter. The coefficient of determination R 2 = 0.95 is a close approximation. As described above, it is clarified that the slit-type velocity meter roughly indicates the mean velocity.
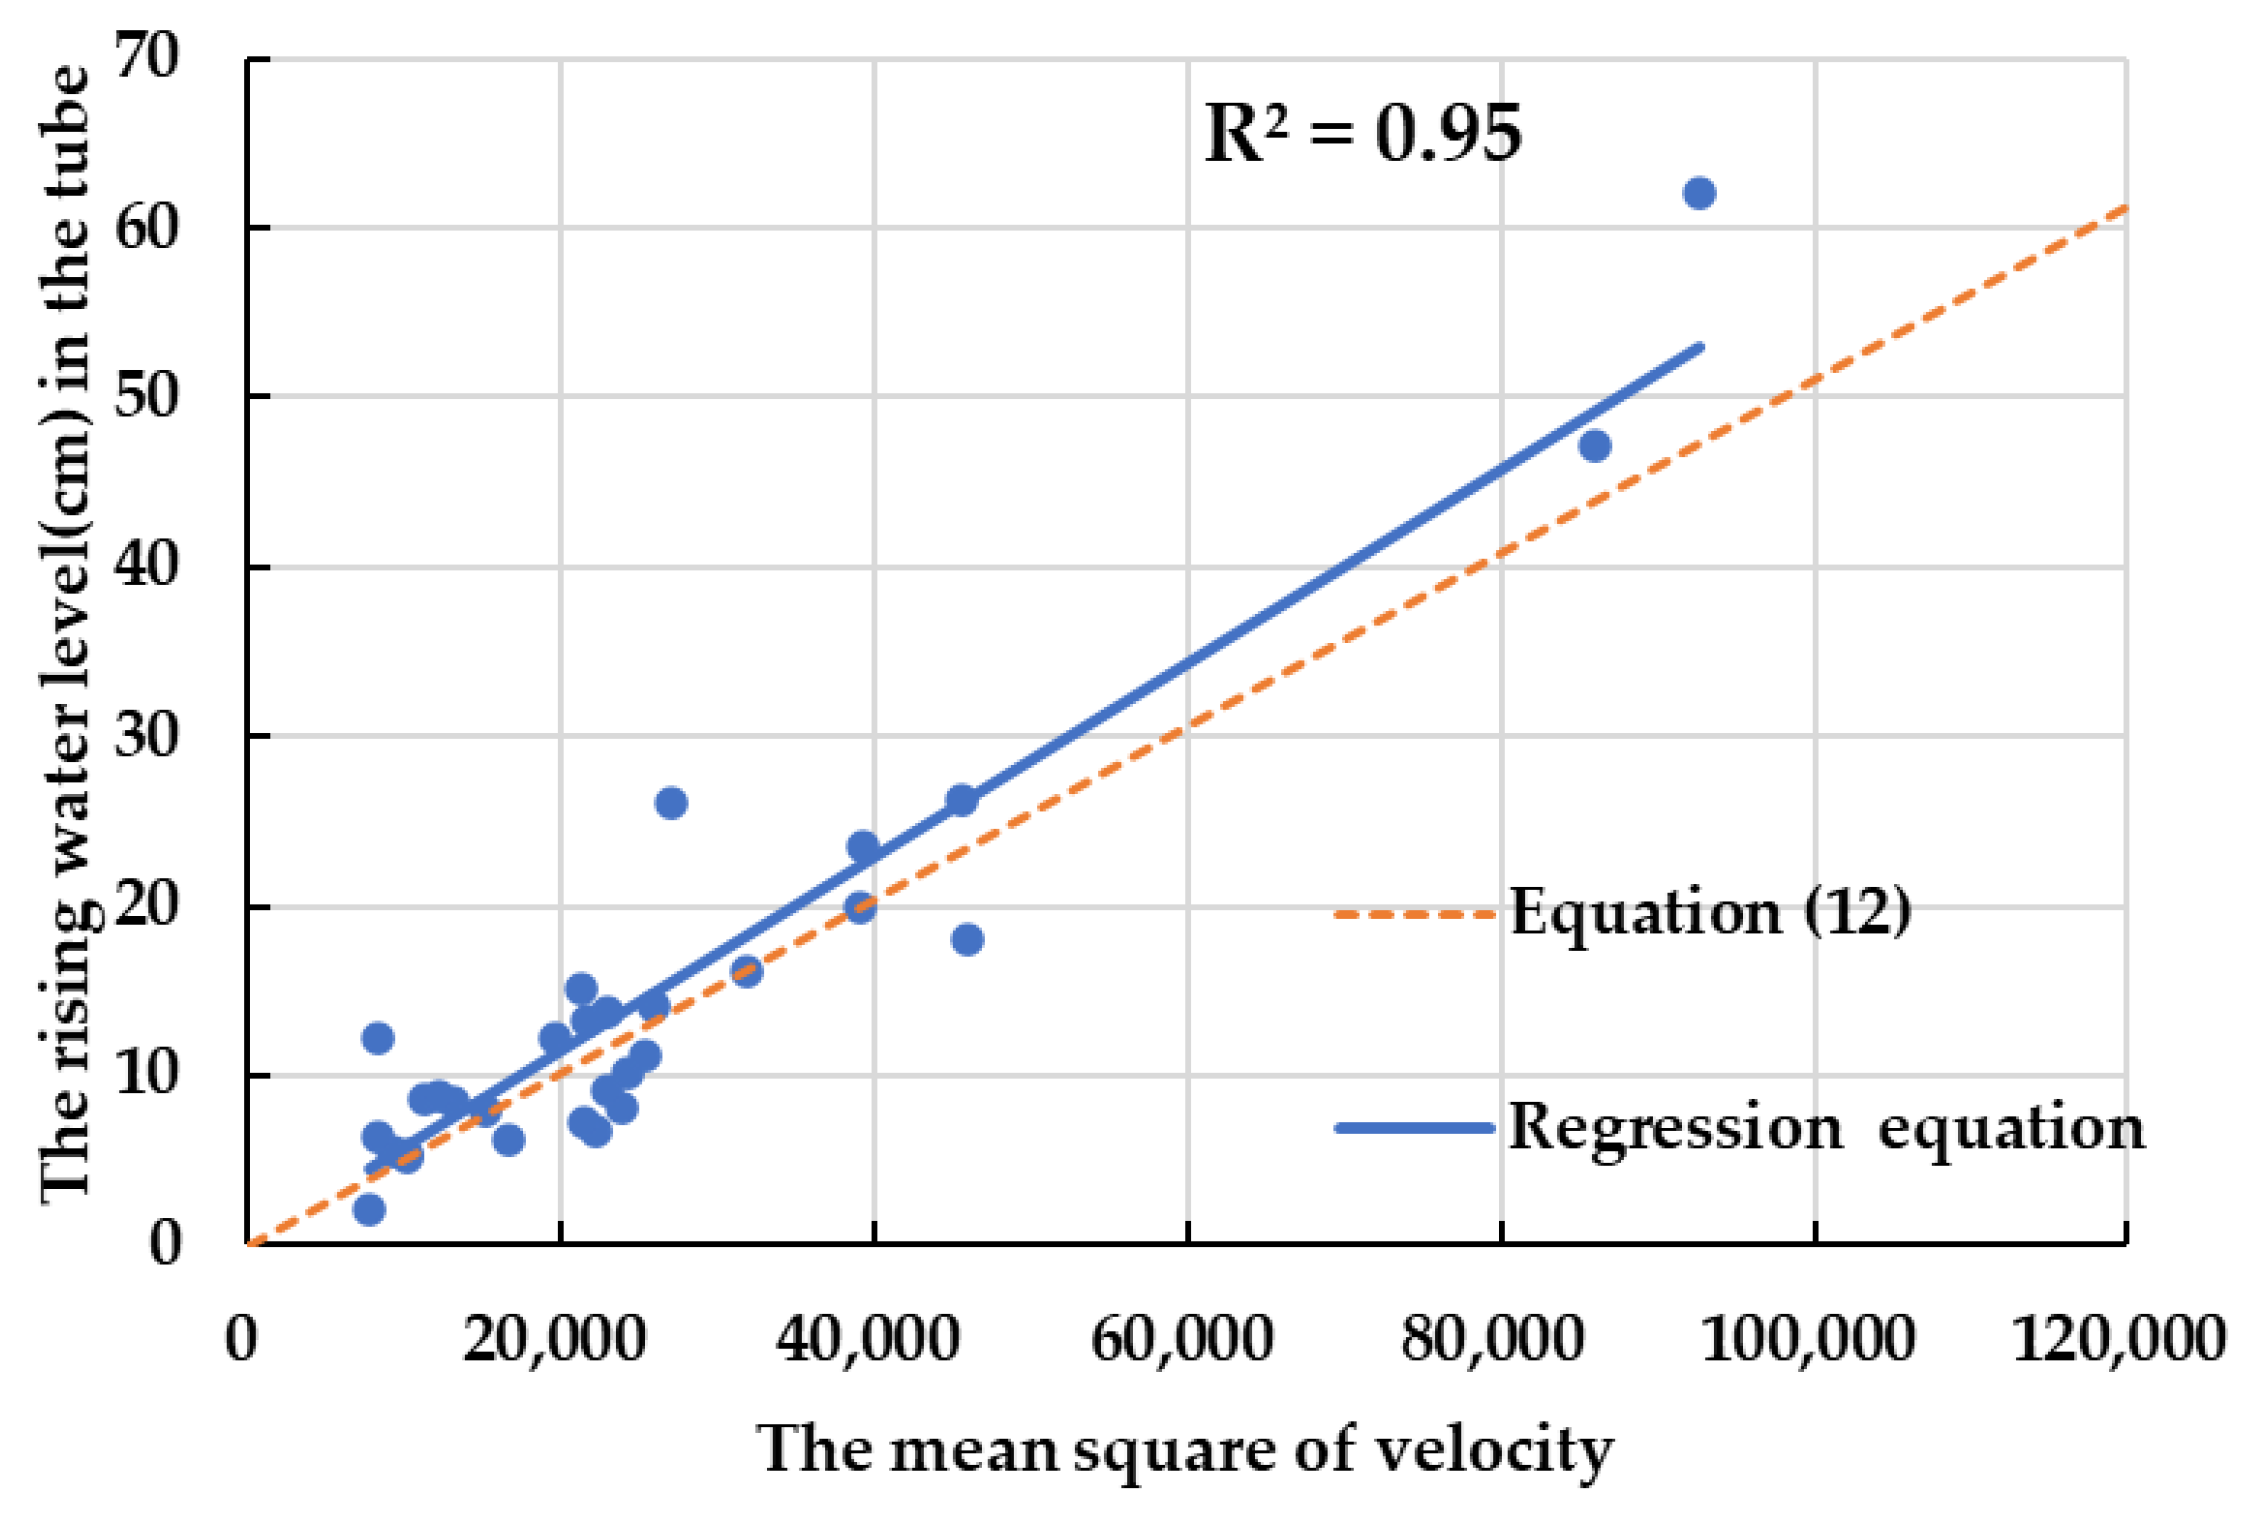
The surface velocity, mean velocity, and bed velocity at each experimental site were averaged, and the values were used as the representative velocities for that site. The mean of the squared representative velocity ( v s r ) (hereinafter referred to as “mean square of velocity”) and the water level h rising in the tube of the slit-type velocity meter is expected to be in balance, as in Equation (12) from Equation (2). However, Figure 11 shows that the slope of the regression equation showing the relationship between the mean square of velocity and the water level is larger than the slope of Equation (12) (dotted line in Figure 11):
h = 1 2 g v s r
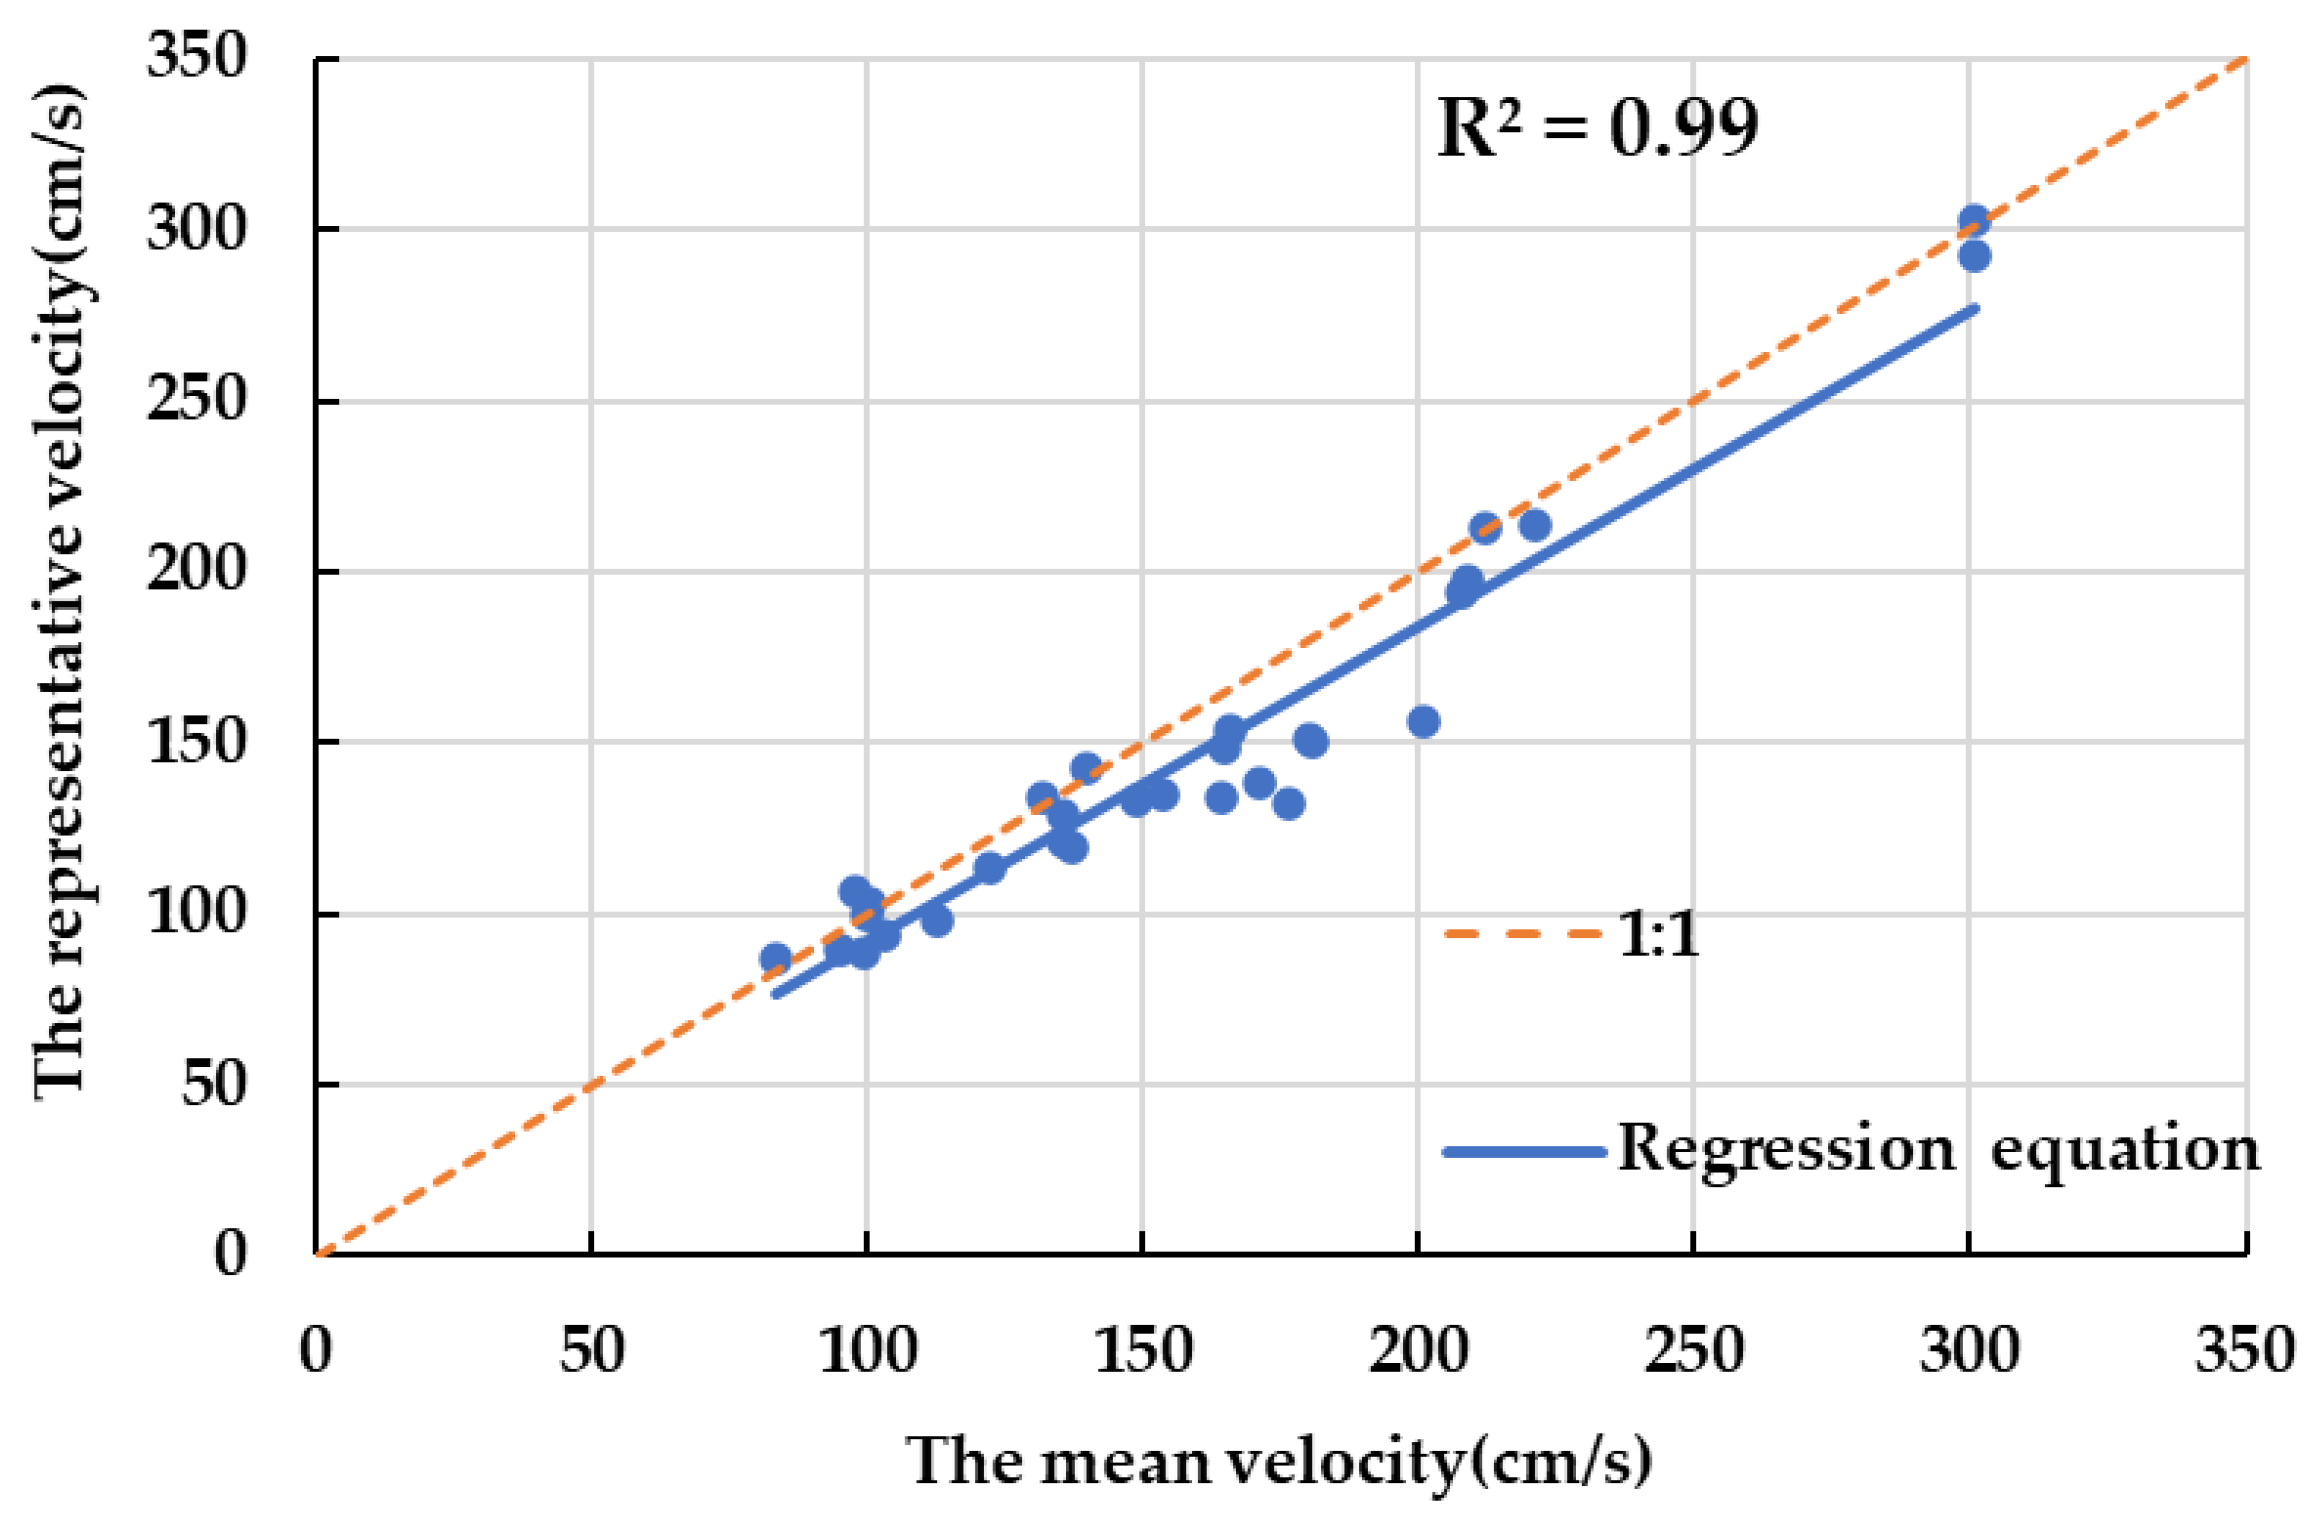
Furthermore, the relationship between the mean square of velocity ( y ) and the representative velocity ( x ) at each experimental site is y = 1.28 x 1.97 R 2 = 0.99 , which is quite close to the relationship y = x 2 . Figure 12 shows the relationship between the mean velocity ( v m ) at each experimental site and the representative velocity ( v r ) at the site. This relationship is v r = 0.95 v m   R 2 = 0.99 , indicating that this relationship is obtained regardless of water depth, although each experimental site has a different water depth.
To confirm that the velocity ( v 60 ) at 60% depth is close to the mean velocity at that location, a comparison was made with the mean velocity ( v m l ) obtained from logarithmic velocity distribution (hereinafter referred to as the log-distributed mean velocity). The distribution used in this study is Equation (13):
v m l u * = 6.0 + 5.75 log 10 R k
where u * is the friction velocity; R is the hydraulic radius, which in this study was the water depth at the experimental site; and k is the absolute roughness, which was obtained from the Manning–Strickler equation. The regression equation for the relationship between the mean velocity and the log-distributed mean velocity is v m l = 0.87 v m   R 2 = 0.99 , which means that the mean velocity at 60% depth is approximately the mean velocity at that site. Therefore, it is also considered that the velocity measured by the slit-type velocity meter indicates the mean velocity.
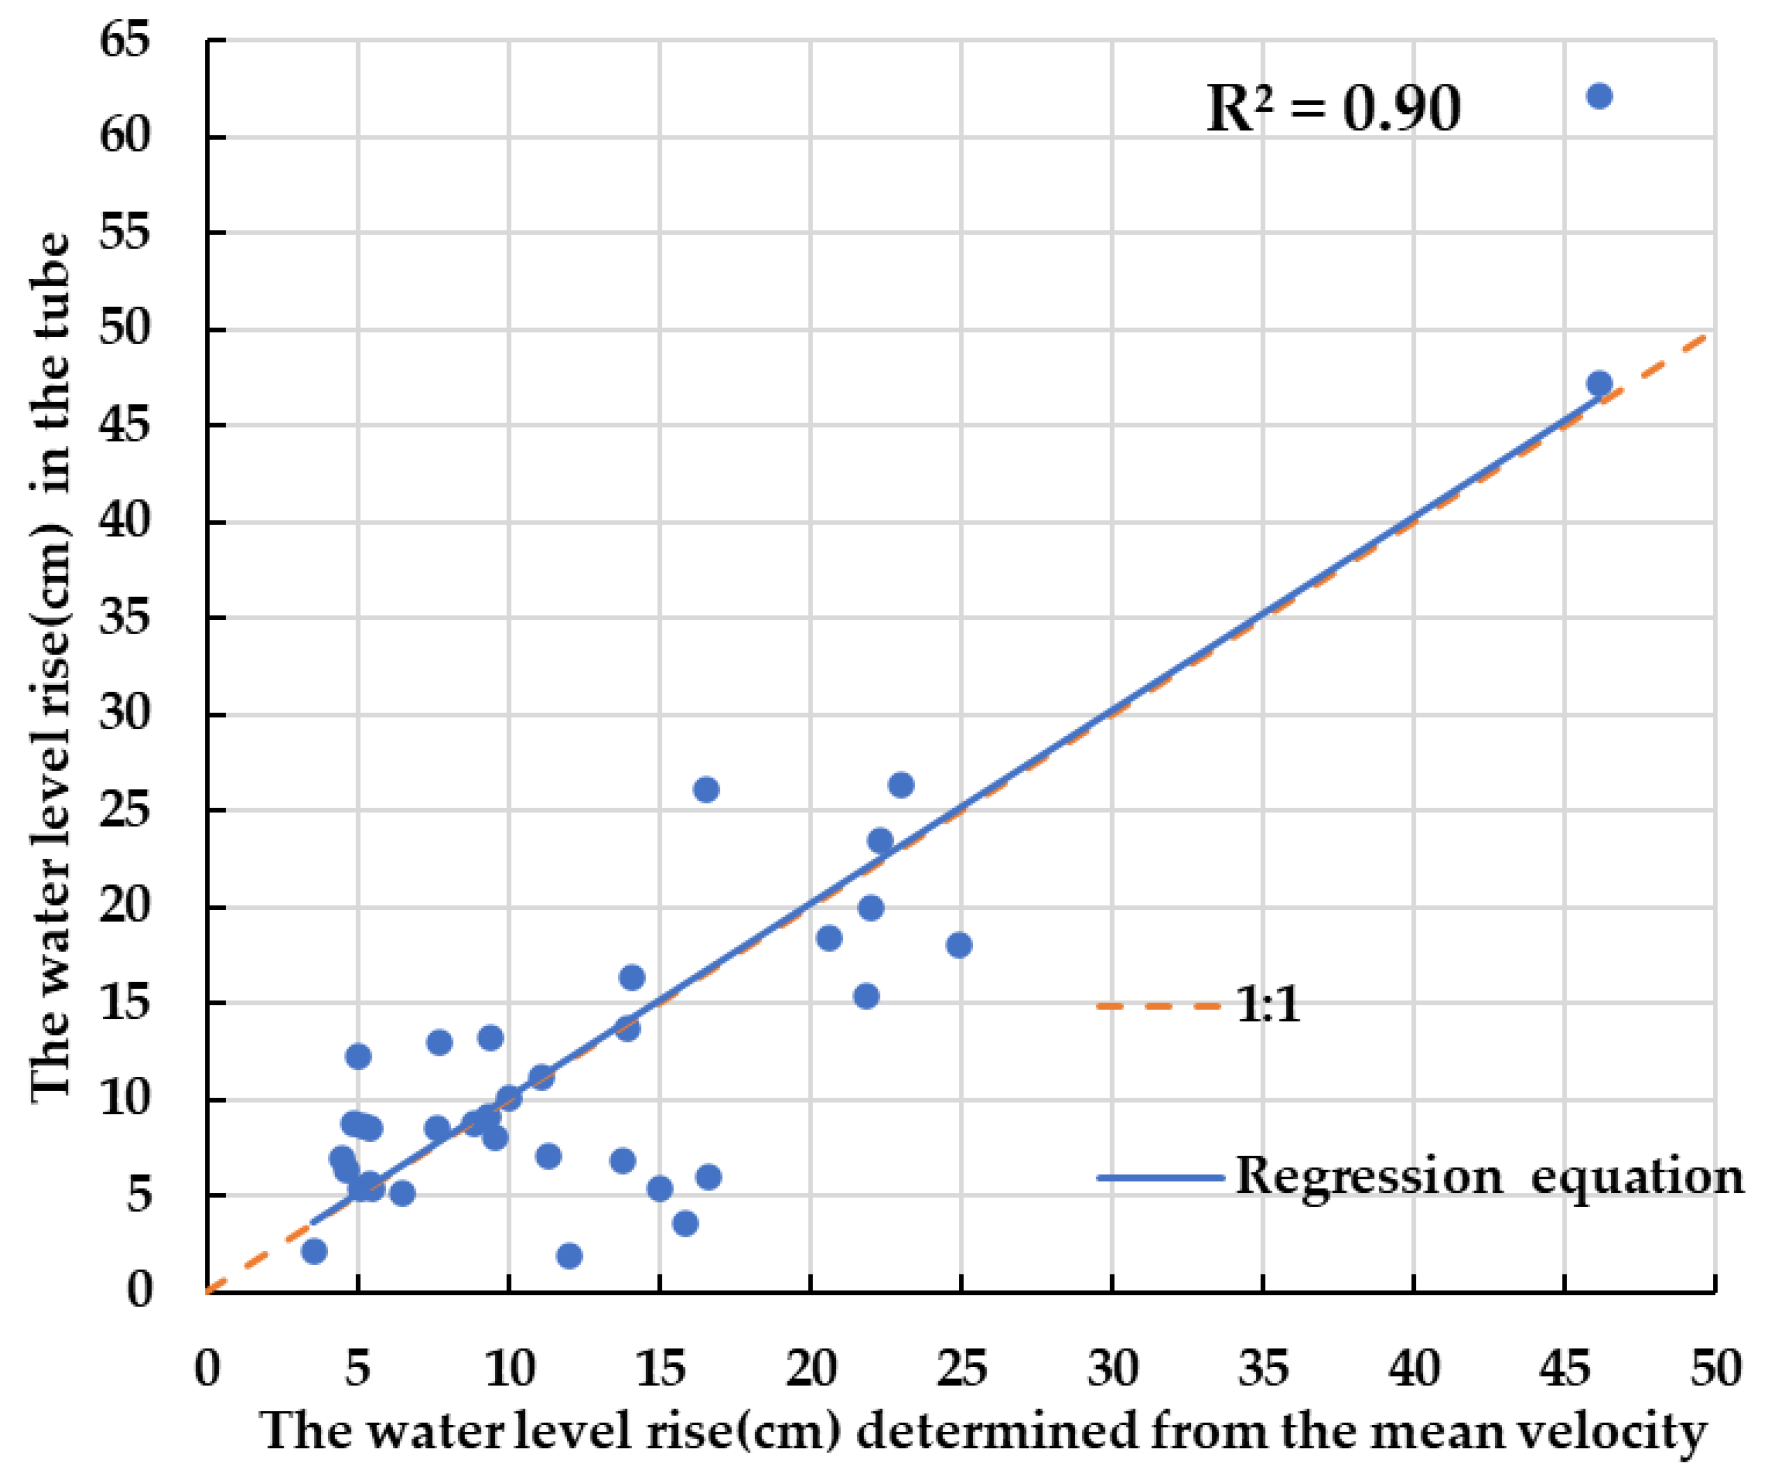
Figure 13 shows the relationship between the water level rise ( h v m ) obtained from the mean velocity and the water level rise ( h s ) in the tube of the slit-type velocity meter. The regression equation for this relationship is h v m = 1.006 h s   R 2 = 0.90 , which is close to a 1:1 correspondence. However, since the slit opens above the water surface, it is possible that the rising water level calculated from the mean velocity may be lower due to the afflux in front of the slit, which has a significant effect on the water level.
Next, the result of the velocity measurements at six depths is shown in Table 2. The mean value of the velocity at each depth was 131.4 cm/s, which is close to the mean velocity of 135.7 cm/s. The velocity measured using the slit-type velocity meter at the experimental site was 160.8 cm/s, which was close to the velocity at a depth of 40%. In this case, the pressure applied to the slit is proportional to the square of the velocity of the flow, which is considered to be close to the velocity at a depth of 40% because of the large influence of the flow near the water surface where the velocity is large. Although the previous section stated that the velocity measured by the slit-type velocity meter shows a good correlation with the mean velocity, there is no significant difference between the velocity at 40% depth and the mean velocity in this case. Furthermore, the mean of the six velocities shown in Table 2 (131.4 cm/s) and the velocity measured by the slit-type velocity meter (160.8 cm/s) was used to determine the afflux, which was 8.8 cm and 13.2 cm, respectively, showing no significant difference. These results suggest that the slit-type velocity meter is capable of estimating the mean velocity.

6. Conclusions

The velocity measurement method that utilizes the phenomenon of velocity being converted to pressure at stagnation points is based on a simple physical phenomenon but has not received much attention in recent years. However, the availability of a large amount of image information during floods taken by residents due to advances in information technology and the ease and low cost of obtaining continuous pressure data make it a method worth revisiting. The velocity obtained from the afflux phenomenon by the cylinder in this study, and the fact that the large pitot tube velocity meter and the slit-type pitot tube velocity meter are sufficiently available in terms of accuracy, etc., were clarified by this study. For the phenomenon of the elevation bridges with piers in a river, it is possible to determine the velocity based on the elevation by the piers. The comparison between the theoretical afflux calculated from the surface velocity and the actual measured afflux using the cylinder is shown in Figure 14. The theoretical value tends to be higher than the actual measured value. This may be because the Bernoulli theorem, which was used to obtain the theoretical values, does not take energy loss into account; however, in fact, there is loss, resulting in higher values than the measured values.
The observation of flow velocities during floods is difficult, even when using current technology. However, the fact that the large pitot tube velocity meter can predict point velocity and the slit-type pitot tube velocity meter can predict mean velocity with 5% accuracy indicates that they are close to the level of practical use. It is particularly interesting to note that the slit-type velocity meter measured velocity close to the mean velocity; however, at high velocities above a certain level, the water level in the tube exceeded the afflux in the front of the tube, indicating that the slit above the water level needs to be blocked.
In addition, the results of this study suggest that when the slit-type velocity meter is a closed tube, the pressure inside the tube is higher than the static pressure due to the dynamic pressure applied to the slit, and by changing the position of the slit, the velocity can be measured by pressure according to the height from the riverbed.
These experimental results suggest that the developed anemometer is inexpensive, simple, and can measure flow velocities with high accuracy, making it possible to measure the areal measurement in the watershed from the standpoint of measurement cost. On the other hand, since this study focused on experimental results at stagnation points, the management of on-site installation is an issue for the future. The developed velocity meters are inexpensive and simple, so they may possibly be set up and observed together with residents. It is anticipated that this will help citizen science by providing an actual experience of this management in response to the growing interest of the scientific community in flood-prone areas in recent years. Therefore, the developed velocimeters are inexpensive and simple, and can be used to make areal measurements within watersheds, and measurements by residents can also be expected. However, rivers and waterways are assumed to be turbid at times of high water. Therefore, this study is applicable as long as the turbidity is within the range where Bernoulli’s theorem is valid; however, this is an issue that needs to be addressed because no experiments or studies have been conducted under turbid water conditions. In addition, since the cylinders and velocity meters used in this study were set up by observers in actual rivers and channels, it has not been possible to conduct the study at velocities and depths that would be hazardous to observers. Experiments to verify this suggestion and verify the strength are necessary for practical use in the future. However, we consider this study to demonstrate the effectiveness of the velocity measurement method focusing on a stagnation point.

Author Contributions

Conceptualization, Y.S.; methodology, A.O., Y.S and H.T.; validation, A.O., Y.S and H.T.; investigation, A.O. and H.T.; writing—original draft preparation, A.O.; writing—review and editing, Y.S., H.T. and T.M.; supervision, Y.S. and T.M.; project administration, Y.S. All authors have read and agreed to the published version of the manuscript.

Funding

This work was supported by JST Grant Number JPMJPF2109.

Data Availability Statement

Not applicable.

Acknowledgments

This work was supported by JST Grant Number JPMJPF2109. The authors would like to sincerely acknowledge the editors and anonymous reviewers for their expert comments and suggestions on this manuscript.

Conflicts of Interest

The authors declare no conflict of interest.

References

  1. AR6 Climate Change 2021: The Physical Science Basis IPCC. Available online: https://www.ipcc.ch/report/sixthassessment-report-working-group-i/ (accessed on 15 November 2022).
  2. 09_kikouhendounoeikyou.pdf. Available online: https://www.mlit.go.jp/river/shinngikai_blog/shaseishin/kasenbunkakai/shouiinkai/kikouhendou_suigai/1/pdf/09_kikouhendounoeikyou.pdf (accessed on 20 February 2022).
  3. 03_honbun.pdf. Available online: https://www.mlit.go.jp/river/shinngikai_blog/shaseishin/kasenbunkakai/shouiinkai/kikouhendou_suigai/pdf/03_honbun.pdf (accessed on 20 February 2022).
  4. Estrella, M.; Saalismaa, N. Ecosystem-based disaster risk reduction (Eco-DRR): An overview. In The Role of Ecosystems in Disaster Risk Reduction; United Nations University Press: Tokyo, Japan, 2013; Volume 332. [Google Scholar]
  5. Nature-Based Solutions for Climate. Available online: https://www.iucn.org/our-work/topic/nature-based-solutions-climate (accessed on 12 January 2023).
  6. North-West-NFM-handbook. Available online: https://thefloodhub.co.uk/wp-content/uploads/2018/11/North-West-NFM-handbook.pdf (accessed on 16 December 2022).
  7. Gunawan, B.; Sun, X.; Sterling, M.; Shiono, K.; Tsubaki, R.; Rameshwaran, P.; Knight, D.W.; Chandler, J.H.; Tang, X.; Fujita, I. The application of LS-PIV to a small irregular river for inbank and overbank flows. Flow Meas. Instrum. 2012, 24, 1–12. [Google Scholar] [CrossRef] [Green Version]
  8. Le Coz, J.; Camenen, B.; Peyrard, X.; Dramais, G. Uncertainty in open-channel discharges measured with the velocity-area method (vol 26, pg 18, 2012). Flow Meas. Instrum. 2015, 46, 18–29. [Google Scholar] [CrossRef] [Green Version]
  9. Kim, S.D.; Lee, H.J.; Oh, B.D. Investigation on Application of Parshall Flume for Flow Measurement of Low-Flow Season in Korea. Meas. Sci. Rev. 2010, 10, 111–115. [Google Scholar] [CrossRef]
  10. Cheng, N.S. Power-law index for velocity profiles in open channel flows. Adv. Water Resour. 2007, 30, 1775–1784. [Google Scholar] [CrossRef]
  11. Herschy, R. The velocity-area method. Flow Meas. Instrum. 1993, 4, 7–10. [Google Scholar] [CrossRef]
  12. Chen, F.W.; Liu, C.W. Assessing the applicability of flow measurement by using non-contact observation methods in open channels. Environ. Monit. Assess. 2020, 192, 289. [Google Scholar] [CrossRef]
  13. Muste, M.; Yu, K.; Spasojevic, M. Practical aspects of ADCP data use for quantification of mean river flow characteristics; part I: Moving-vessel measurements. Flow Meas. Instrum. 2004, 15, 1–16. [Google Scholar] [CrossRef]
  14. Moradi, G.; Vermeulen, B.; Rennie, C.D.; Cardot, R.; Lane, S.N. Evaluation of aDcp processing options for secondary flow identification at river junctions. Earth Surf. Process. Landf. 2019, 44, 2903–2921. [Google Scholar] [CrossRef] [Green Version]
  15. Figuerez, J.A.; Gonzalez, J.; Galan, A. Accurate Open Channel Flowrate Estimation Using 2D RANS Modelization and ADCP Measurements. Water 2021, 13, 1772. [Google Scholar] [CrossRef]
  16. Yamaguchi, T.; Niizato, K. Flood discharge observation using radio current meter. Doboku Gakkai Ronbunshu 1994, 1994, 41–50. [Google Scholar] [CrossRef]
  17. Plant, W.J.; Keller, W.C.; Hayes, K. Measurement of river surface currents with coherent microwave systems. IEEE Trans. Geosci. Remote Sens. 2005, 43, 1242–1257. [Google Scholar] [CrossRef]
  18. Miyamura, E.; Nakajima, Y.; Yoshimura, A. Full-scale Commercialized Microwave Doppler Current Meter-Fixed Doppler Current Meter & RYUKAN. New Era River Disch. Meas. 2012, 3, 55–60. [Google Scholar]
  19. Dal Sasso, S.F.; Pizarro, A.; Samela, C.; Mita, L.; Manfreda, S. Exploring the optimal experimental setup for surface flow velocity measurements using PTV. Environ. Monit. Assess. 2018, 190, 460. [Google Scholar] [CrossRef] [PubMed]
  20. Huang, W.C.; Young, C.C.; Liu, W.C. Application of an Automated Discharge Imaging System and LSPIV during Typhoon Events in Taiwan. Water 2018, 10, 280. [Google Scholar] [CrossRef] [Green Version]
  21. Fujita, I.; Notoya, Y.; Tani, K.; Tateguchi, S. Efficient and accurate estimation of water surface velocity in STIV. Environ. Fluid Mech. 2019, 19, 1363–1378. [Google Scholar] [CrossRef] [Green Version]
  22. Eltner, A.; Sardemann, H.; Grundmann, J. Technical Note: Flow velocity and discharge measurement in rivers using terrestrial and unmanned-aerial-vehicle imagery. Hydrol. Earth Syst. Sci. 2020, 24, 1429–1445. [Google Scholar] [CrossRef] [Green Version]
  23. Bandini, F.; Frias, M.C.; Liu, J.; Simkus, K.; Karagkiolidou, S.; Bauer-Gottwein, P. Challenges with Regard to Unmanned Aerial Systems (UASs) Measurement of River Surface Velocity Using Doppler Radar. Remote Sens. 2022, 14, 1277. [Google Scholar] [CrossRef]
  24. Harada, Y.; Nihei, Y.; Sakai, T.; Kimizu, A. Undamental Study on Measuring Accuracy for Flood Discharge with Floats. Proc. Hydraul. Eng. 2007, 51, 1081–1086. [Google Scholar] [CrossRef] [Green Version]
  25. Fukuoka, S.; Watanabe, A.; Takatsugu, W.; Sakamoto, H. Effect of Plan and Cross Sectional Shapes on Accuracy of Discharge Measurement by Means of Floats. Proc. Hydraul. Eng. 2002, 46, 803–808. [Google Scholar] [CrossRef] [Green Version]
  26. Nihei, Y.; Irokawa, Y.; Ide, K.; Takamura, T. Study on River-Discharge Measurements using Accoustic Doppler Current Profilers. J. Hydraul. Coast. Environ. Eng. 2008, 64, 99–114. [Google Scholar]
  27. Leyland, J.; Hackney, C.R.; Darby, S.E.; Parsons, D.R.; Best, J.L.; Nicholas, A.P.; Aalto, R.; Lague, D. Extreme flood-driven fluvial bank erosion and sediment loads: Direct process measurements using integrated Mobile Laser Scanning (MLS) and hydro-acoustic techniques. Earth Surf. Process. Landf. 2017, 42, 334–346. [Google Scholar] [CrossRef]
  28. Le Coz, J.; Hauet, A.; Pierrefeu, G.; Dramais, G.; Camenen, B. Performance of image-based velocimetry (LSPIV) applied to flash-flood discharge measurements in Mediterranean rivers. J. Hydrol. 2010, 394, 42–52. [Google Scholar] [CrossRef] [Green Version]
  29. Nakano, K.; Hayashi, H.; Shimatani, Y. Flood Flow Velocity Estimation Method Using Movies Taken by Residents. J. Jpn. Soc. Civ. Eng. Ser. B1 (Hydraul. Eng.) 2018, 74, I_601–I_606. [Google Scholar] [CrossRef] [PubMed]
  30. Chaplin, J.R.; Teigen, P. Steady flow past a vertical surface-piercing circular cylinder. J. Fluids Struct. 2003, 18, 271–285. [Google Scholar] [CrossRef]
  31. Unger, J.; Hager, W.H. Down-flow and horseshoe vortex characteristics of sediment embedded bridge piers. Exp. Fluids 2007, 42, 1–19. [Google Scholar] [CrossRef] [Green Version]
  32. Huang, W.R.; Yang, Q.P.; Xiao, H. CFD modeling of scale effects on turbulence flow and scour around bridge piers. Comput. Fluids 2009, 38, 1050–1058. [Google Scholar] [CrossRef]
  33. Watanabe, G.; Akamatsu, Y.; Irie, T.; Ono, Y. The Evluation of Dynamic Water Pressure to Existing Bridge Pier in a River at a Flood. J. Jpn. Soc. Civ. Eng. Ser. A2 (Appl. Mech. (AM)) 2015, 71, I_359–I_368. [Google Scholar] [CrossRef]
  34. Yokoi, Y. The aspect of the flow around a circular cylinder in a free surface water flow. In Proceedings of the EPJ Web of Conferences, Františkovy Lázně, Czech Republic, 19–22 November 2022; p. 01070. [Google Scholar]
  35. Matsutomi, H.; Okamoto, K.; Sato, K. Basic examination on the simplified method for estimating velocity of inundated flow with inundation traces. Proc. Hydraul. Eng. 2008, 52, 673–678. [Google Scholar] [CrossRef] [Green Version]
  36. Pitot Tube Working and Principle. Available online: https://www.hkdivedi.com/2018/06/pitot-tube-working-and-principle.html (accessed on 24 December 2022).
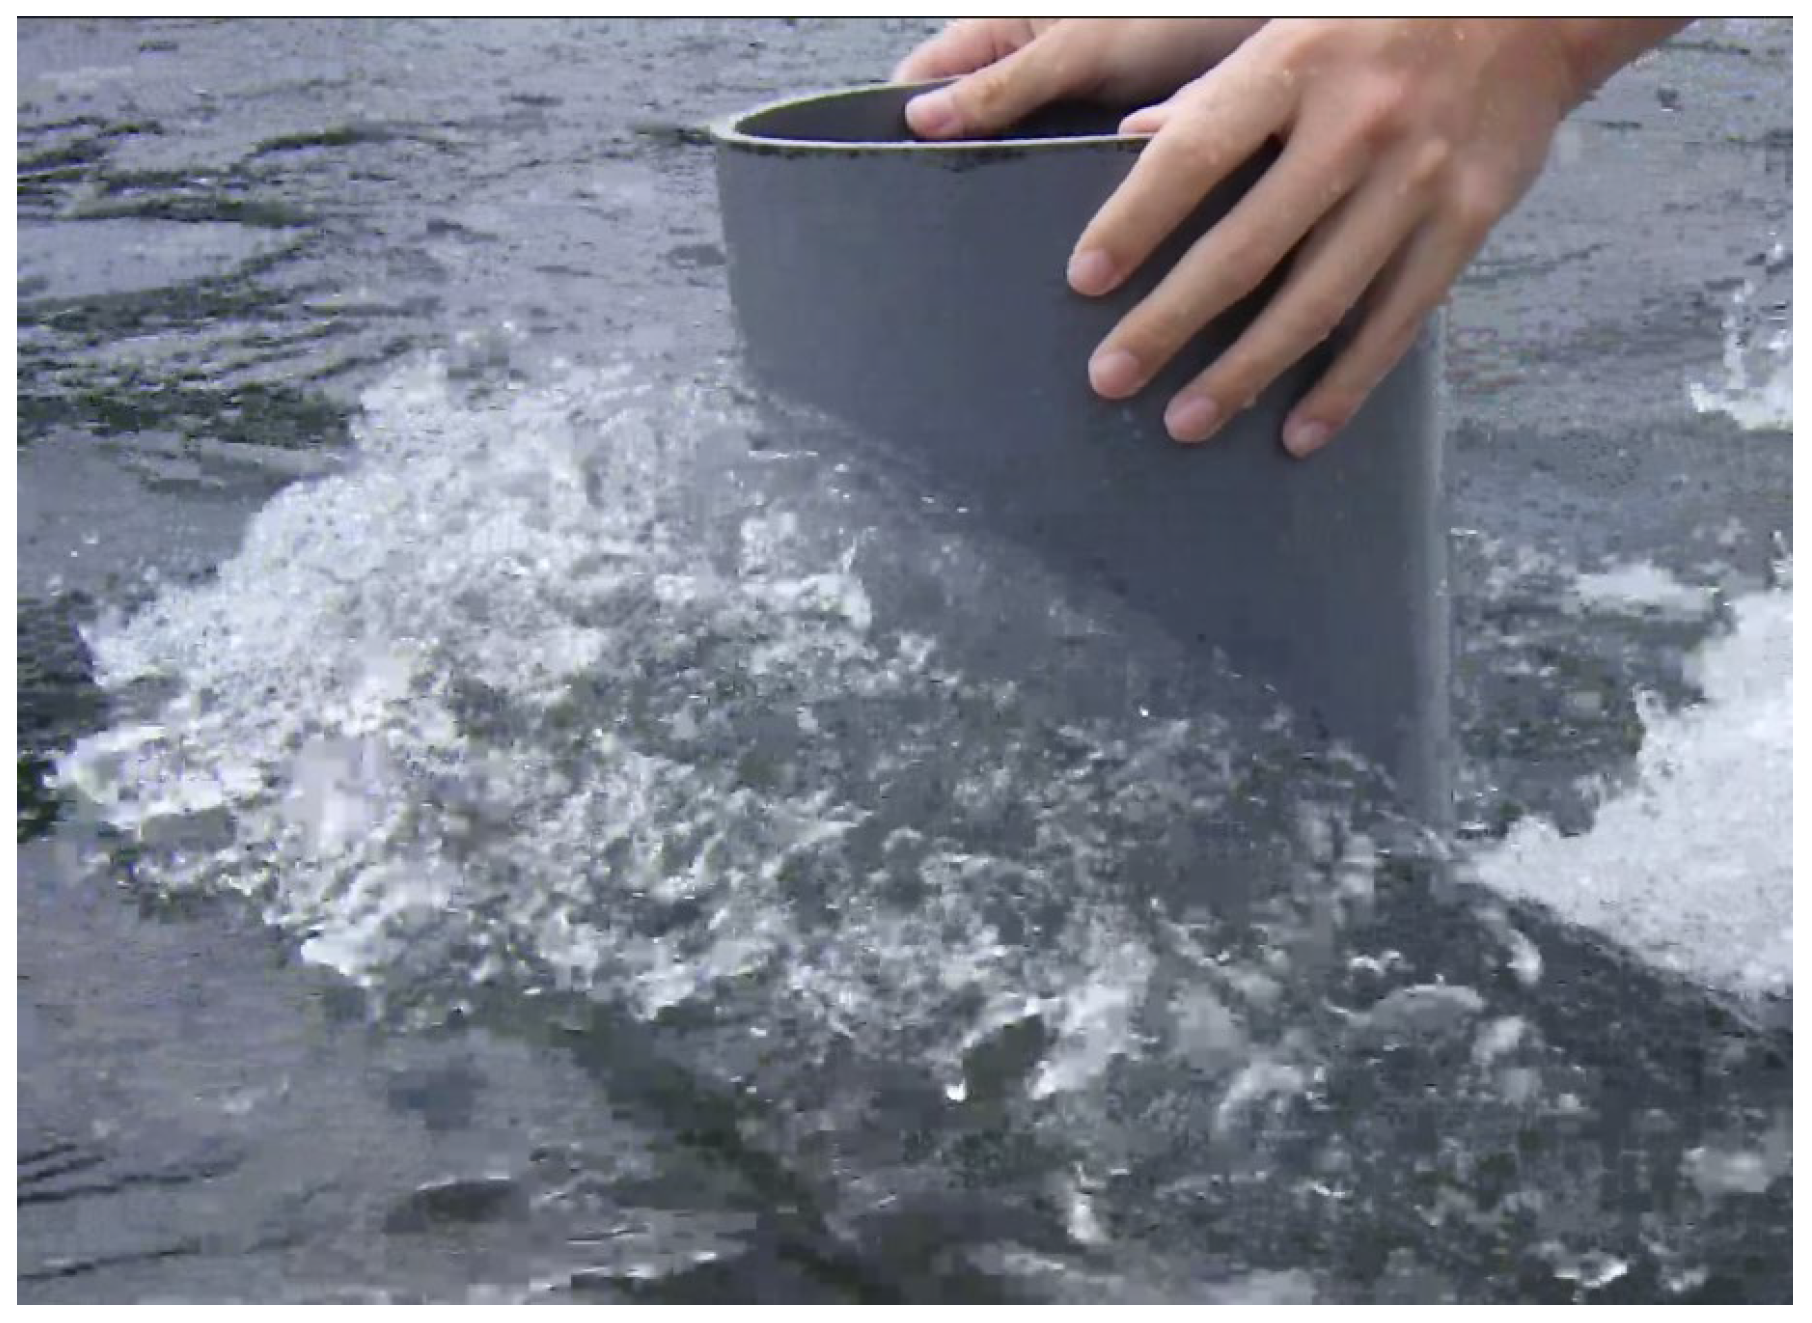
Figure 1. Observation of the afflux by the cylinder.
Water 15 02625 g001
Figure 2. Relationship between the velocity obtained from the propeller-type velocity meter and the estimated velocity. (a) Relationship between the surface velocity and the estimated velocity; (b) the relationship between the mean velocity and the estimated velocity.
Water 15 02625 g002
Figure 3. Principle of the pitot tube and equation for calculating velocity [36].
Water 15 02625 g003
Figure 4. Large pitot tube velocity meter schematic.
Water 15 02625 g004
Figure 5. Nozzle shapes of the large pitot tube velocity meter. (a) Type A shape; (b) type B shape.
Water 15 02625 g005
Figure 6. Measurement using a large pitot tube velocity meter.
Water 15 02625 g006
Figure 7. Comparison of the bed velocity and the velocity measured by the large pitot tube velocity meters of types A and B.
Water 15 02625 g007
Figure 8. The water level meter storage. (a) Directly above view; (b) side view.
Water 15 02625 g008
Figure 9. Principle of slit-type pitot tube velocity meter.
Water 15 02625 g009
Figure 10. Relationship between the mean velocity and the velocity obtained from the slit-type velocity meter.
Water 15 02625 g010
Figure 11. Relationship between the mean square of the velocity and the rising water level in the tube of the slit-type velocity meter.
Water 15 02625 g011
Figure 12. Relationship between the mean velocity and the representative velocity.
Water 15 02625 g012
Figure 13. Relationship between the water level rise determined from the mean velocity and the water level rise in the tube of the slit-type velocity meter.
Water 15 02625 g013
Figure 14. Comparison between theoretical afflux calculated from the surface velocity and the actual measured afflux by the cylinder.
Water 15 02625 g014
Table 1. Estimated velocity results for each cylinder.
Diameter (mm)40120200
Estimated velocity (cm/s)146.8171.5177.1
Table 2. Velocity (cm/s) at each depth using the propeller velocity meter.
Surface20% Depth40% DepthMean20% DepthBed
166.4166.7157.5135.7100.062.3
Disclaimer/Publisher’s Note: The statements, opinions and data contained in all publications are solely those of the individual author(s) and contributor(s) and not of MDPI and/or the editor(s). MDPI and/or the editor(s) disclaim responsibility for any injury to people or property resulting from any ideas, methods, instructions or products referred to in the content.