Zinnia (Zinnia elegans L.) and Periwinkle (Catharanthus roseus (L.) G. Don) Responses to Salinity Stress
Abstract
1. Introduction
2. Materials and Methods
2.1. Plant Material
2.2. Salinity Stress Treatment
2.3. Data Collection
2.4. Statistical Analysis
3. Results
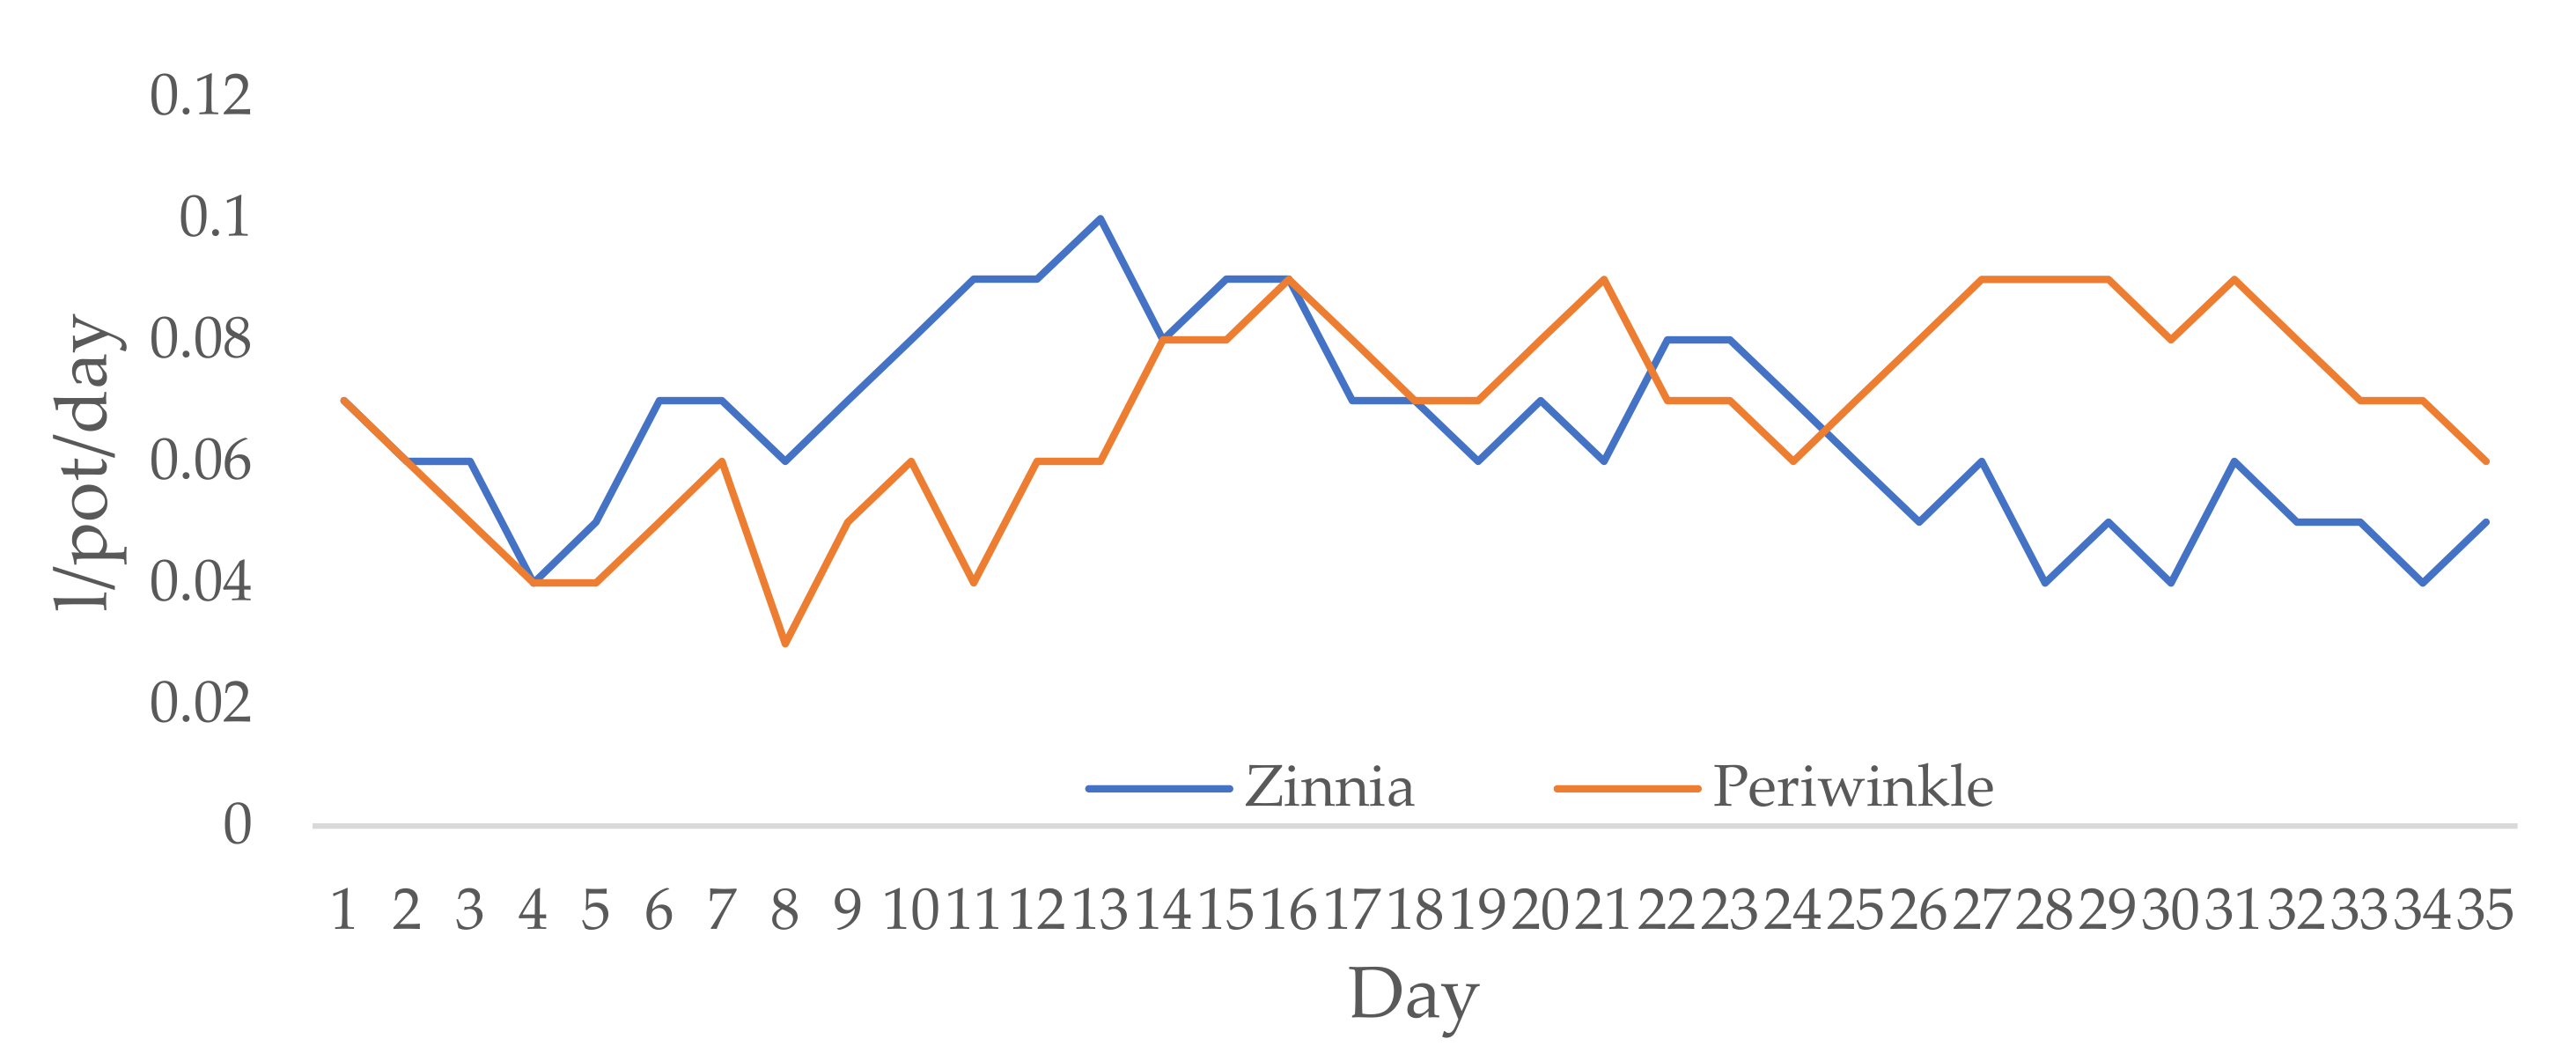
3.1. Growing Conditions and Irrigation Scheduling
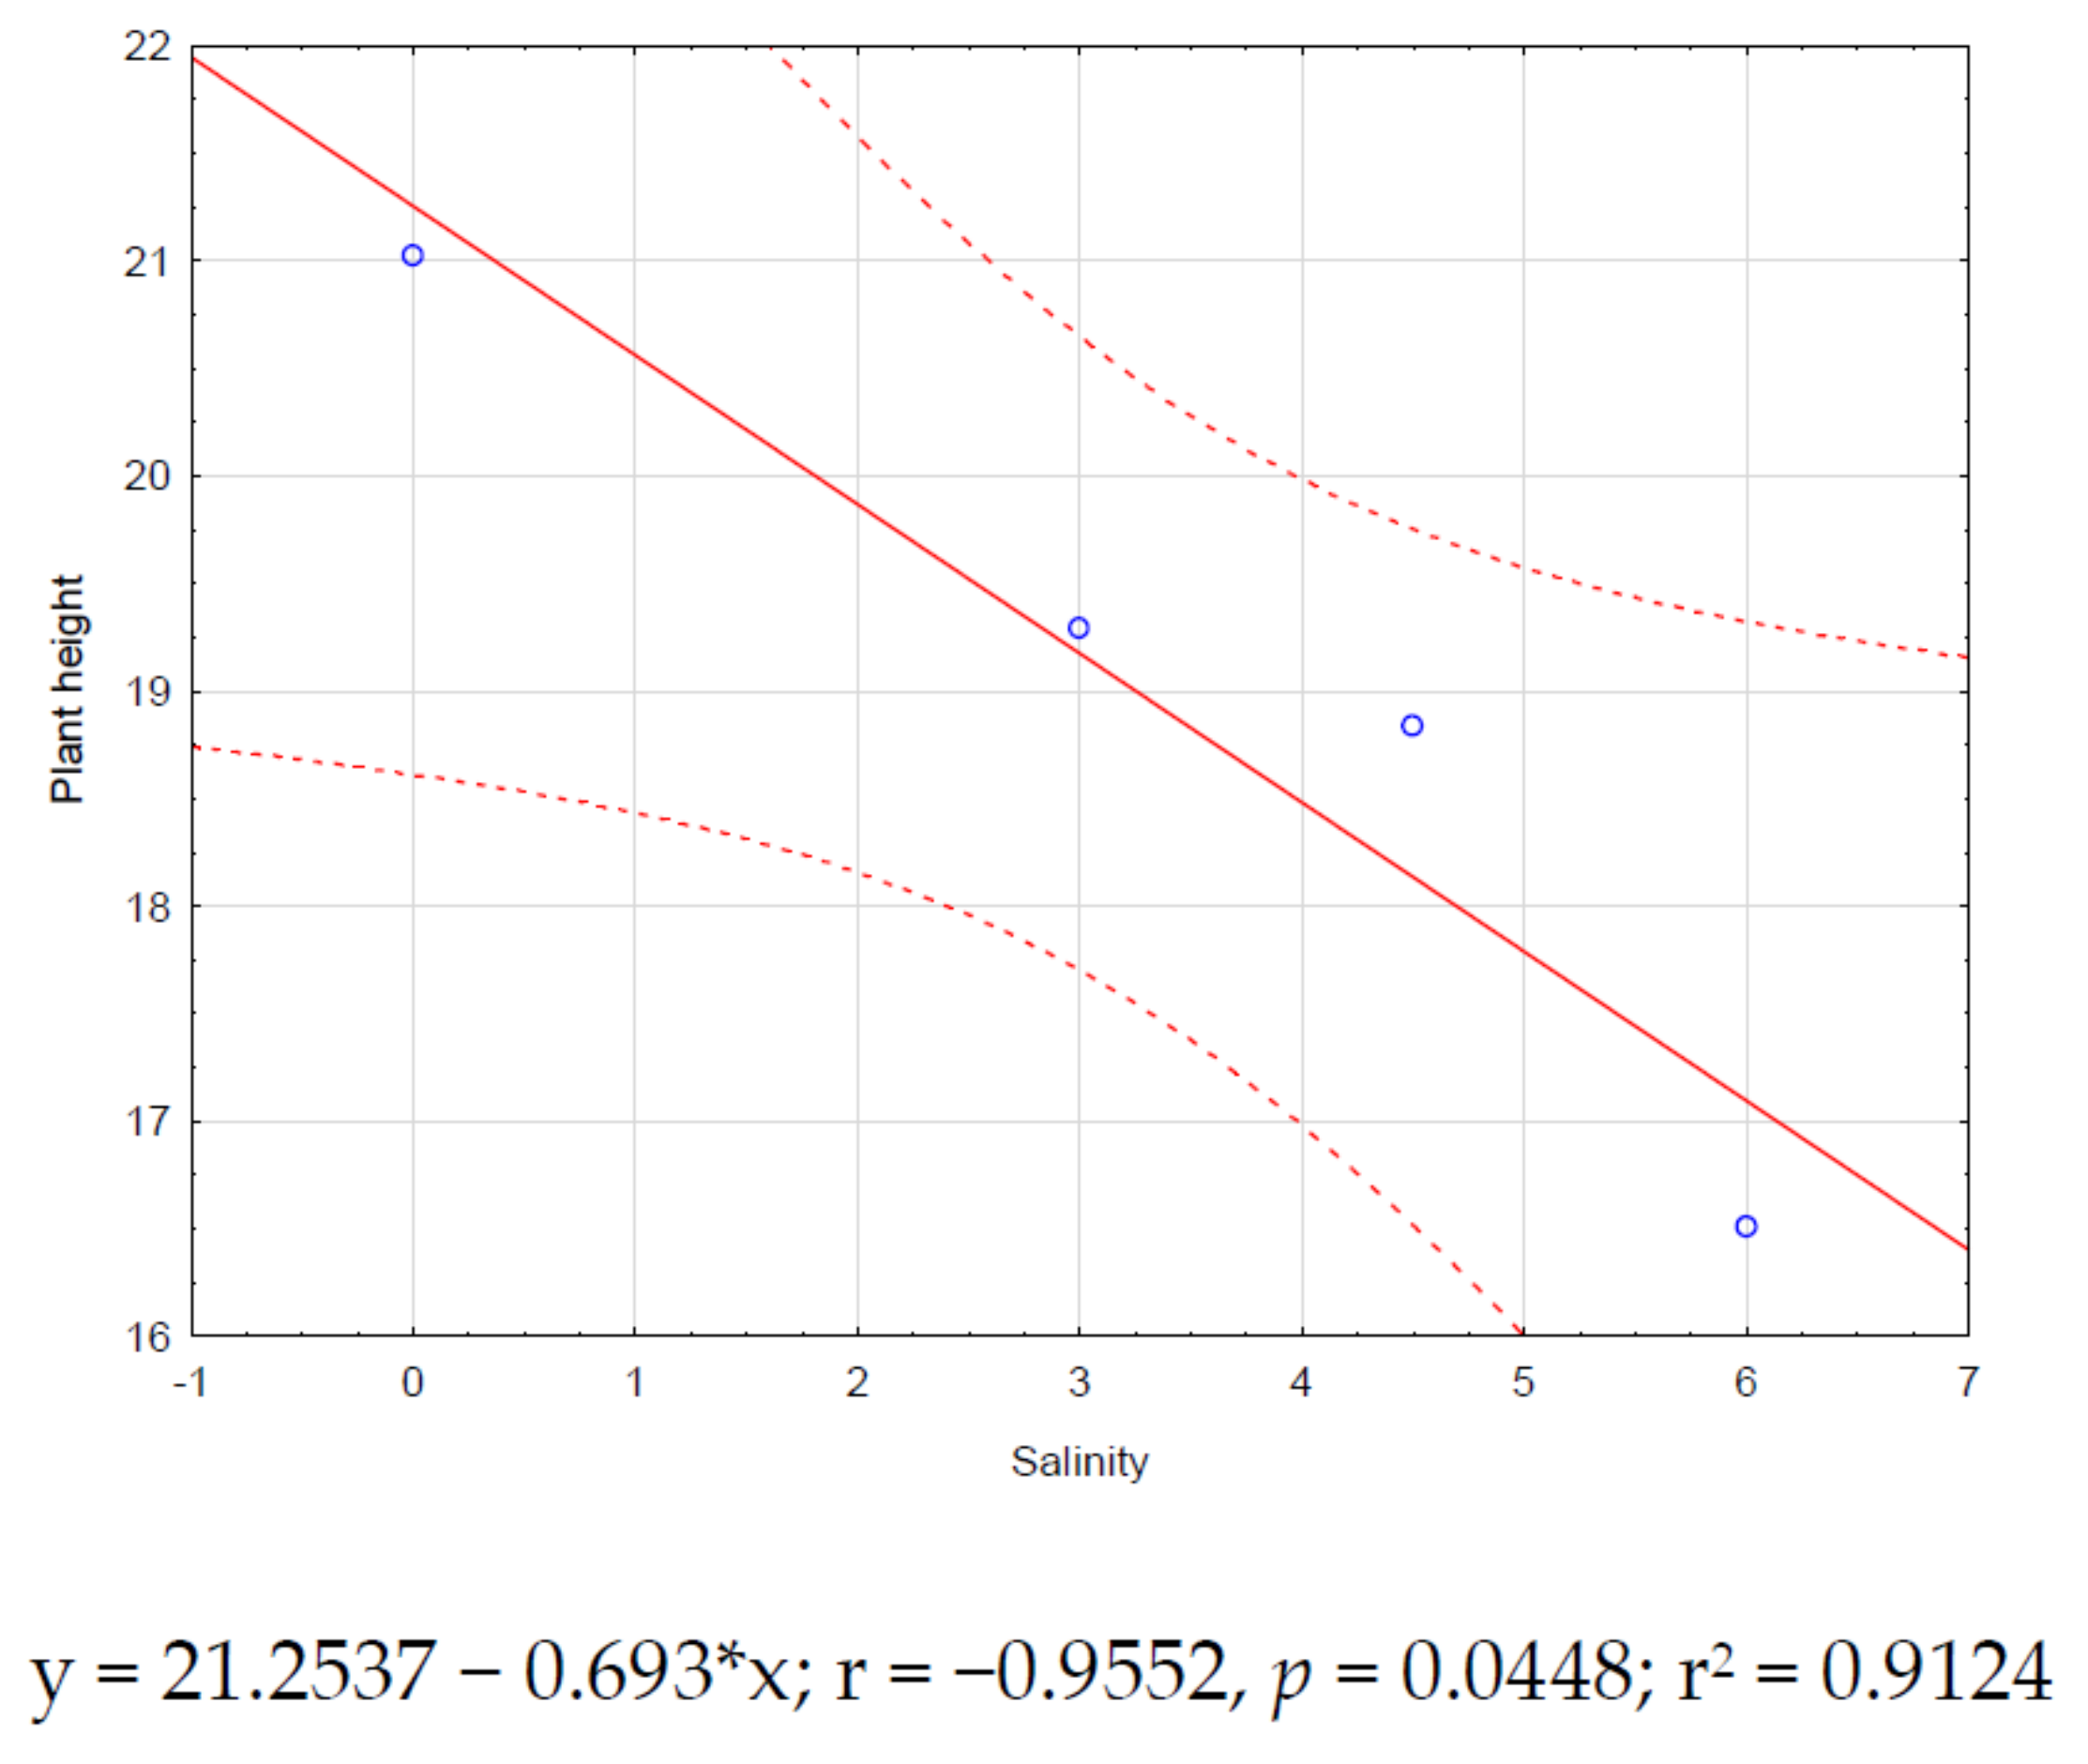
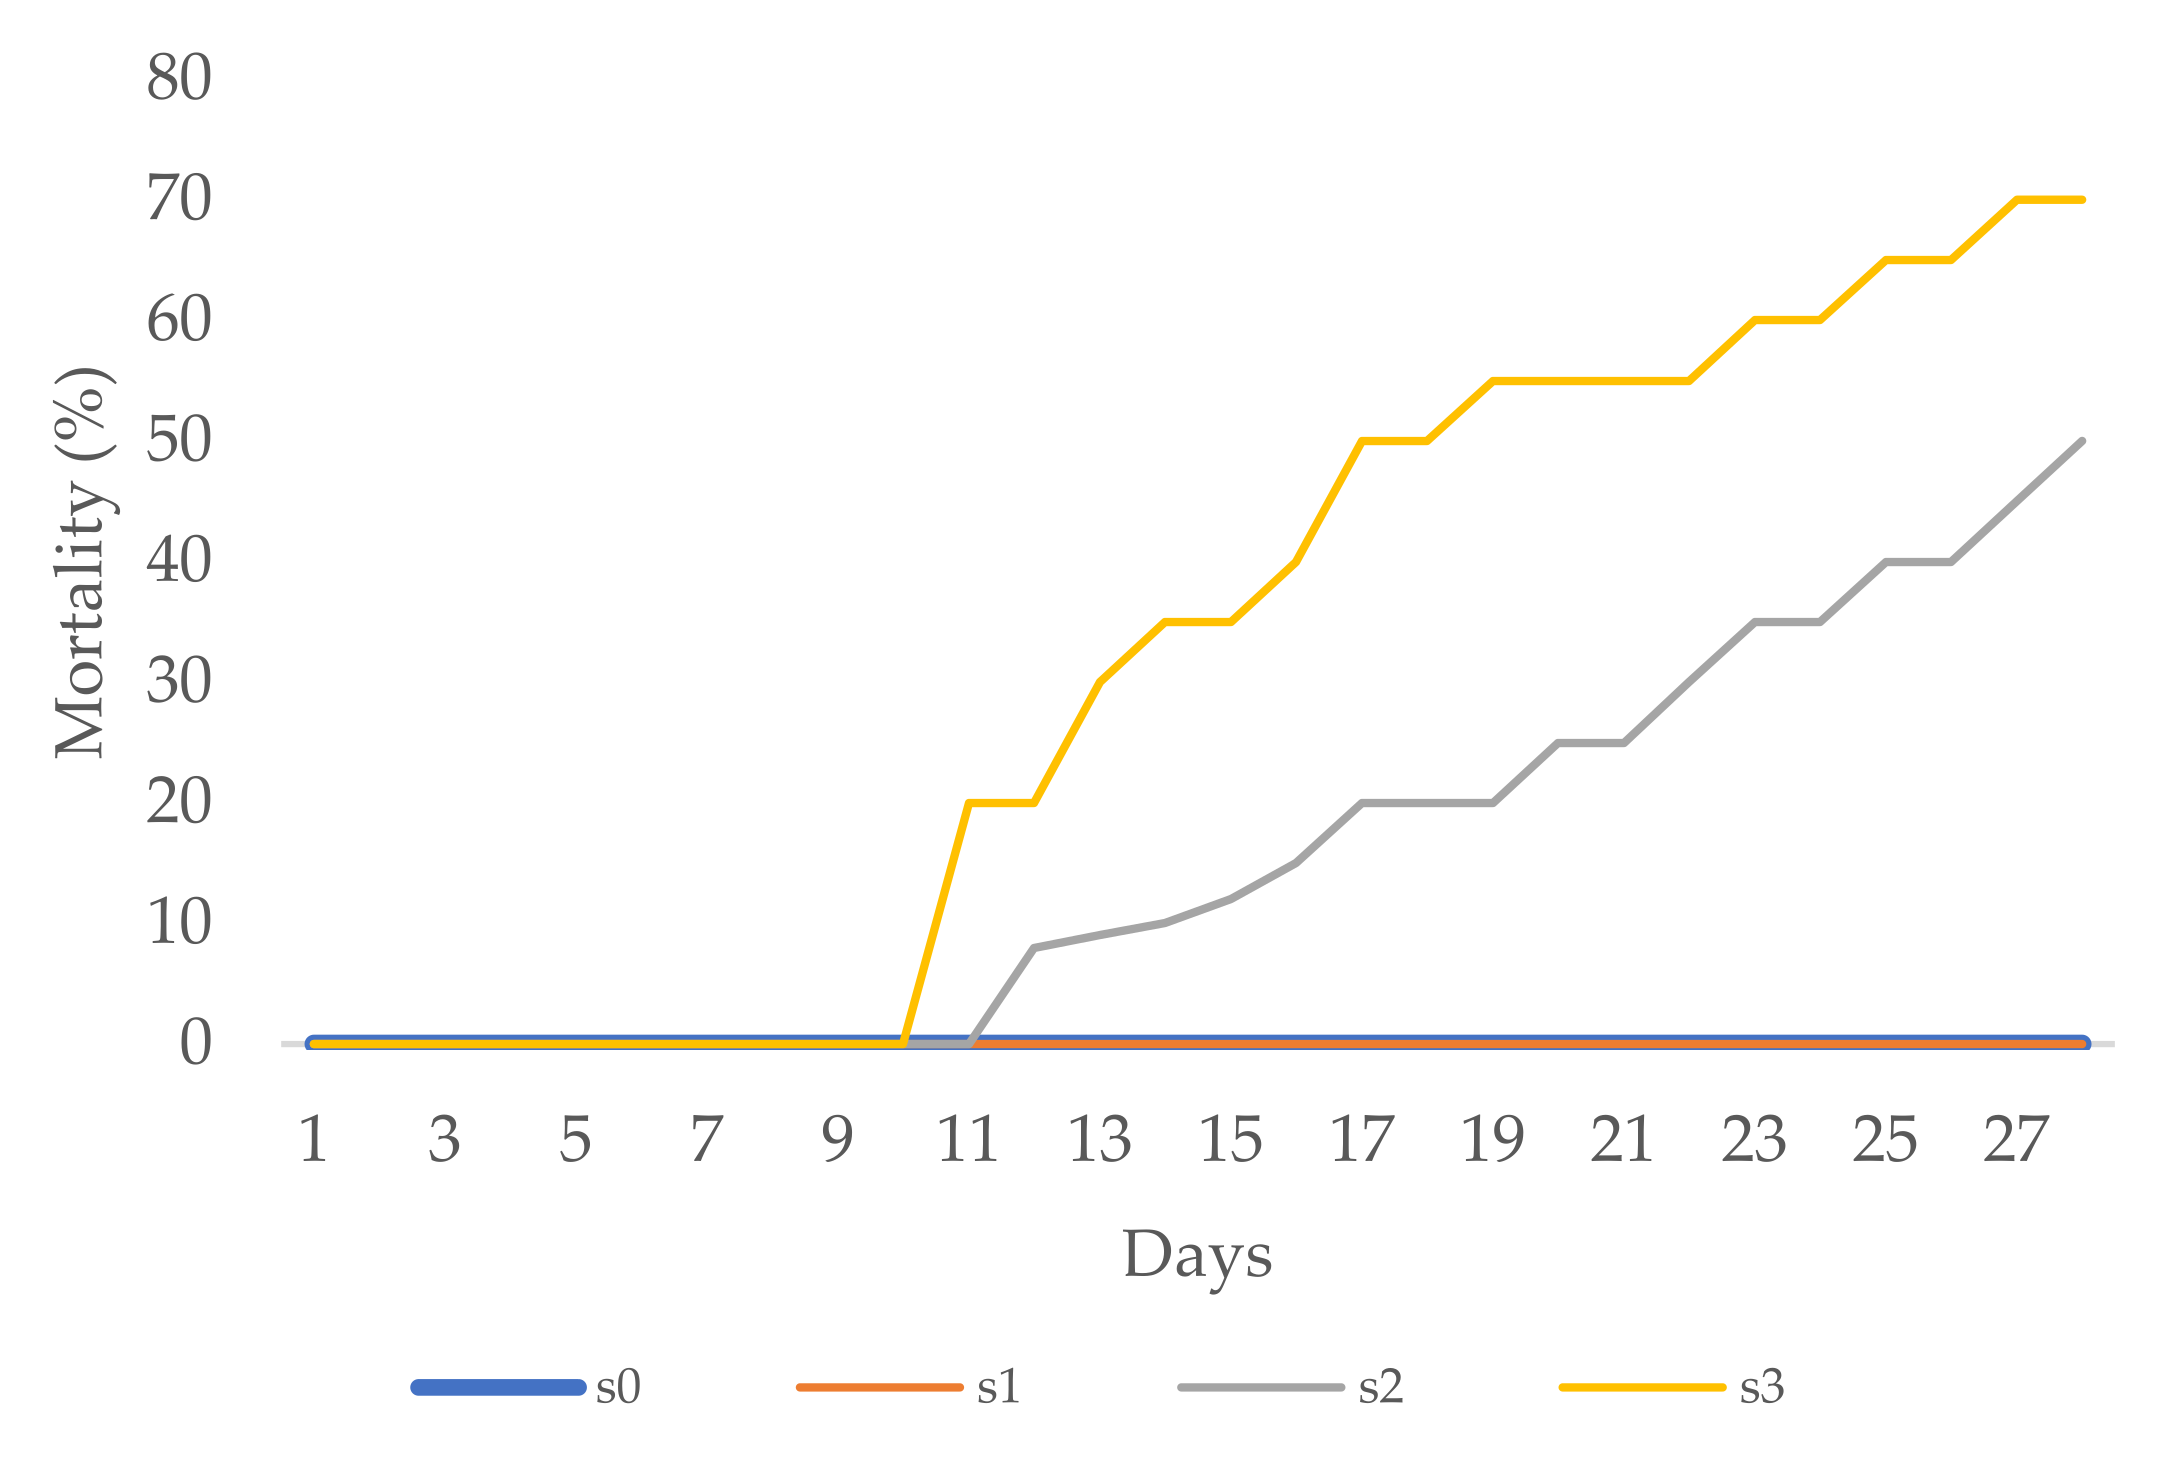
3.2. Effect of Salinity Stress on Zinnia Growth
3.3. Effect of Salinity Stress on Periwinkle Growth
3.4. Leaf Relative Water Content (RWC), Water Use Efficiency (WUE), and Growth Index (GI)
3.5. Aesthetic Value
4. Discussion
5. Conclusions
Author Contributions
Funding
Conflicts of Interest
References
- Food and Agriculture Organization of the United Nations (FAO). AQUASTAT Database. 2012. Available online: http://www.fao.org/nr/aquastat (accessed on 20 December 2021).
- Food and Agriculture Organization of the United Nations (FAO). The Global Framework on Water Scarcity in Agriculture. 2018. Available online: https://www.fao.org/documents/card/en/c/8dd680fd-70d3-4725-8d9f-30f9a02455a0/ (accessed on 20 December 2021).
- Mancosu, N.; Snyder, R.L.; Kyriakakis, G.; Spano, D. Water Scarcity and Future Challenges for Food Production. Water 2015, 7, 975–992. [Google Scholar] [CrossRef]
- Boretti, A.; Rosa, L. Reassessing the projections of the World Water Development Report. NPJ Clean Water 2019, 2, 15. [Google Scholar] [CrossRef]
- Mukheibir, P. Water Access, Water Scarcity, and Climate Change. Environ. Manag. 2010, 45, 1027–1039. [Google Scholar] [CrossRef]
- Gosling, S.N.; Arnell, N.W. A global assessment of the impact of climate change on water scarcity. Clim. Change 2016, 134, 371–385. [Google Scholar] [CrossRef]
- Rey, D.; Holman, I.P.; Knox, J.W. Developing drought resilience in irrigated agriculture in the face of increasing water scarcity. Reg. Environ. Chang. 2017, 17, 1527–1540. [Google Scholar] [CrossRef] [PubMed]
- Dobson, B.; Coxon, G.; Freer, J.; Gavin, H.; Mortazavi-Naeini, M.; Hall, J.W. The spatial dynamics of droughts and water scarcity in England and Wales. Water Resour. Res. 2020, 56, e2020WR027187. [Google Scholar] [CrossRef]
- Munns, R. Comparative physiology of salt and water stress. Plant Cell Environ. 2002, 25, 239–250. [Google Scholar] [CrossRef]
- Oyiga, B.C.; Sharma, R.; Shen, J.; Baum, M.; Ogbonnaya, F.; Léon, J.; Ballvora, A. Identification and characterization of salt tolerance of wheat germplasm using a multivariable screening approach. J. Agron. Crop Sci. 2016, 202, 472–485. [Google Scholar] [CrossRef]
- Ravindran, K.C.; Venkatesan, K.; Balakrishnan, V.; Chellappan, K.P.; Balasubramanian, T. Restoration of saline land by halophytes for Indian soils. Soil Biol. Biochem. 2007, 39, 2661–2664. [Google Scholar] [CrossRef]
- Sarmoum, R.; Haid, S.; Biche, M.; Djazouli, Z.; Zebib, B.; Merah, O. Effect of Salinity and Water Stress on the Essential Oil Components of Rosemary (Rosmarinus officinalis L.). Agronomy 2019, 9, 214. [Google Scholar] [CrossRef]
- Abrar, M.M.; Saqib, M.; Abbas, G.; Atiq-ur-Rahman, M.; Mustafa, A.; Shah, S.A.A.; Mehmood, K.; Maitlo, A.A.; ul-Hassan, M.; Sun, N.; et al. Evaluating the Contribution of Growth, Physiological, and Ionic Components towards Salinity and Drought Stress Tolerance in Jatropha curcas. Plants 2020, 9, 1574. [Google Scholar] [CrossRef]
- Alvino, A.; Ferreira, M.I.F.R. Refining Irrigation Strategies in Horticultural Production. Horticulturae 2021, 7, 29. [Google Scholar] [CrossRef]
- Romero-Trigueros, C.; Gambín, J.M.B.; Nortes Tortosa, P.A.; Cabañero, J.J.A.; Nicolás, E. Isohydricity of Two Different Citrus Species under Deficit Irrigation and Reclaimed Water Conditions. Plants 2021, 10, 2121. [Google Scholar] [CrossRef] [PubMed]
- Acosta-Motos, J.R.; Ortuño, M.F.; Bernal-Vicente, A.; Diaz-Vivancos, P.; Sanchez-Blanco, M.J.; Hernandez, J.A. Plant Responses to Salt Stress: Adaptive Mechanisms. Agronomy 2017, 7, 18. [Google Scholar] [CrossRef]
- Roy, S.; Chowdhury, N. Salt Stress in Plants and Amelioration Strategies: A Critical Review. In Abiotic Stress in Plants; Fahad, S., Saud, S., Chen, Y., Wu, C., Wang, D., Eds.; Intech Open Limited: London, UK, 2020. [Google Scholar]
- Rahavi, S.M.; Kovalchuk, I. Changes in homologous recombination frequency in Arabidopsis thaliana plants exposed to stress depend on time of exposure during development and on duration of stress exposure. Physiol. Mol. Biol. Plants 2013, 19, 479–488. [Google Scholar] [CrossRef][Green Version]
- Ma, Y.; Dias, M.C.; Freitas, H. Drought and Salinity Stress Responses and Microbe-Induced Tolerance in Plants. Front. Plant Sci. 2020, 11, 591911. [Google Scholar] [CrossRef] [PubMed]
- Shahid, M.A.; Sarkhosh, A.; Khan, N.; Balal, R.M.; Ali, S.; Rossi, L.; Gómez, C.; Mattson, N.; Nasim, W.; Garcia-Sanchez, F. Insights into the Physiological and Biochemical Impacts of Salt Stress on Plant Growth and Development. Agronomy 2020, 10, 938. [Google Scholar] [CrossRef]
- Hussain, S.C.; Xiaochuang, Z.; Chu, Z.; Lianfeng, K.; Maqsood, A.; Fiaz, S.; Zhang, J.; Jin, Q. Sodium chloride stress during early growth stages altered physiological and growth characteristics of rice. Chil. J. Agric. Res. 2018, 78, 183–197. [Google Scholar] [CrossRef]
- Bimurzayev, N.; Sari, H.; Kurunc, A.; Doganay, K.H.; Asmamaw, M. Effects of different salt sources and salinity levels on emergence and seedling growth of faba bean genotypes. Sci. Rep. 2021, 11, 18198. [Google Scholar] [CrossRef]
- Grieve, C.M. Review: Irrigation of floricultural and nursery crops with saline wastewaters. Isr. J. Plant Sci. 2011, 59, 187–196. [Google Scholar] [CrossRef]
- Valdez-Aguilar, L.A.; Grieve, C.M.; Poss, J. Salinity and Alkaline pH in Irrigation Water Affect Marigold Plants: I. Growth and Shoot Dry Weight Partitioning. Hortscience 2009, 44, 1719–1725. [Google Scholar] [CrossRef]
- Niu, G.; Rodriguez, D.S.; Wang, Y.T. Impact of Drought and Temperature on Growth and Leaf Gas Exchange of Six Bedding Plant Species Under Greenhouse Conditions. Hortscience 2006, 41, 1408–1411. [Google Scholar] [CrossRef]
- El-Nashar, Y.; Hassan, B.A. Effect of saline irrigation water levels on the growth of two Zinnia elegans L. cultivars. Sci. J. Flowers Ornam. Plants 2020, 7, 425–445. [Google Scholar] [CrossRef]
- Aydinsakir, K.; Tepe, A.; Buyuktas, D. Effects of saline irrigation water applications on quality characteristics of freesia grown in greenhouse. Akdeniz Üniversitesi Ziraat Fakültesi Derg. 2010, 23, 65–72. [Google Scholar]
- Carter, C.T.; Grieve, C.M. Growth and Nutrition of Two Cultivars of Zinnia elegans Under Saline Conditions. HortScience 2010, 45, 1058–1063. [Google Scholar] [CrossRef]
- Villarino, G.H.; Mattson, N.S. Assessing tolerance to sodium chloride salinity in fourteen floriculture species. HortTechnology 2011, 21, 539–545. [Google Scholar] [CrossRef]
- Sun, Y.; Niu, G.; Perez, C.; Pemberton, H.B.; Altland, J. Responses of Marigold Cultivars to Saline Water Irrigation. HortTechnology 2018, 28, 166–171. [Google Scholar] [CrossRef]
- Favali, M.; Muestti, R.; Benvenuti, S.; Bianchi, A.; Pressacco, L. Catharanthus roseus L. plants and explants infected with phytoplasmas: Alkaloid production and structural observations. Protoplasma 2004, 223, 45–51. [Google Scholar] [CrossRef] [PubMed]
- El-Sheikh, N.; Farouk, S.; Mohamed, Z.; Arafa, A. Growth, as well as Leaf and Stem Anatomy in Periwinkle Plant as Affected by Certain Biotic and Abiotic Elicitors. J. Plant Prod. 2019, 10, 283–291. [Google Scholar] [CrossRef][Green Version]
- Cartmill, A.D.; Valdez-Aguilar, L.A.; Bryan, D.L.; Alarcón, A. Arbuscular mycorrhizal fungi enhance tolerance of vinca to high alkalinity in irrigation water. Sci. Hortic. 2008, 115, 275–284. [Google Scholar] [CrossRef]
- Toscano, S.; Romano, D. Morphological, Physiological, and Biochemical Responses of Zinnia to Drought Stress. Horticulturae 2021, 7, 362. [Google Scholar] [CrossRef]
- European Parliament and the Council of European Union. Directives on the Quality of Water Intended For Human Consumption. Available online: https://eur-lex.europa.eu/legal-content/EN/TXT/PDF/?uri=CELEX:32020L2184&from=ES (accessed on 2 January 2022).
- Ayers, R.S.; Westcot, D.W. Water Quality for Agriculture. FAO Irrigation and Drainage Paper. Available online: https://www.fao.org/3/t0234e/t0234e01.htm (accessed on 2 January 2022).
- Warsaw, A.L.; Fernandez, R.T.; Cregg, B.M.; Andresen, J.A. Container-grown Ornamental Plant Growth and Water Runoff Nutrient Content and Volume Under Four Irrigation Treatments. Hortscience 2009, 44, 1573–1580. [Google Scholar] [CrossRef]
- Pieczynski, M.; Marczewski, W.; Hennig, J.; Dolata, J.; Bielewicz, D.; Piontek, P.; Wyrzykowska, A.; Krusiewicz, D.; Strzelczyk-Zyta, D.; Konopka-Postupolska, D.; et al. Down-regulation of CBP80 gene expression as a strategy to engineer a drought-tolerant potato. Plant Biotechnol. J. 2013, 11, 459–469. [Google Scholar] [CrossRef] [PubMed]
- Heidari, Z.; Nazarideljou, M.J.; Danesh, Y.R.; Khezrinejad, N. Morphophysiological and Biochemical Responses of Zinnia elegans to Different Irrigation Regimes in Symbiosis with Glomus mosseae. Int. J. Hortic. Sci. 2016, 3, 19–32. [Google Scholar]
- Macherla, K.; McAvoy, R.J. The Effect of Salinity on the Growth and Nutrient Status of Zinnia Grown under Short- and Long-cycle Subirrigation Management. HortScience 2017, 52, 770–773. [Google Scholar] [CrossRef]
- Duan, L.; Sebastian, J.; Dinneny, J.R. Salt-stress regulation of root system growth and architecture in Arabidopsis seedlings. In Plant Cell Expansion; Humana Press: New York, NY, USA, 2015; pp. 105–122. [Google Scholar]
- Yasemin, S.; Değer, A.G.; Köksal, N. The Effects of Salt Stress in Zinnia (Zinnia sp.) Cultivars during Seed Germination and at the Early Stages of Seedling Growth. Turk. J. Agric. Res. 2020, 7, 253–265. [Google Scholar]
- Taiz, L.; Zeiger, E. Plant Physiology, 5th ed.; Sinauer Associates Inc.: Sunderland, MA, USA, 2009. [Google Scholar]
- Xiang, M.; Moss, J.Q.; Martin, D.L.; Su, K.; Dunn, B.L.; Wu, Y. Evaluating the Salinity Tolerance of Clonal-type Bermudagrass Cultivars and an Experimental Selection. HortScience 2017, 52, 185–191. [Google Scholar] [CrossRef]
- Sifers, S.I.; Beard, J.B. Comparative inter- and intraspecific leaf firing soil drying. Intl. Turfgrass Soc. Res. J. 2000, 9, 291–296. [Google Scholar]
- Escalona, A.; Salas-Sanjuán, M.C.; Santos, D.; Guzmán, M. The effect of water salinity on growth and ionic concentration and relation in plant tissues in Zinnia elegans and Tagetes erecta for use in urban landscasping. Itea-Inf. Tec. Econ. Agrar. 2014, 110, 325–334. [Google Scholar]
- Cai, X.; Niu, G.; Starman, T.; Hall, C. Response of six garden roses (Rosa × hybrida L.) to salt stress. Sci. Hortic. 2014, 168, 27–32. [Google Scholar] [CrossRef]
- Zapryanova, N.; Atanassova, B. Effects of Salt Stress on Growth and Flowering of Ornamental Annual Species. Biotechnol. Biotechnol. Equip. 2009, 23, 177–179. [Google Scholar] [CrossRef]
- Neves, A.L.R.; de Lacerda, C.F.; de Oliveira, A.C.; Sousa, C.H.C.; Oliveira, F.I.F.; Ribeiro, M.D.S.D.S. Quantitative and qualitative responses of Catharanthus roseus to salinity and biofertilizer. R. Bras. Eng. Agríc. Ambiental 2018, 22, 22–26. [Google Scholar] [CrossRef]
- Huang, Z.T.; Cox, D.A. Salinity effects on annual bedding plants in a peat-perlite medium and solution culture. J. Plant Nutr. 1988, 11, 145–159. [Google Scholar] [CrossRef]
- Römheld, V. The chlorosis paradox: Fe inactivation as a secondary event in chlorotic leaves of grapevine. J. Plant Nutr. 2000, 23, 1629–1643. [Google Scholar] [CrossRef]
- Lea-Cox, J.D.; Syvertsen, J.P. Salinity Reduces Water Use and Nitrate-N-use Efficiency of Citrus. Ann. Bot. 1993, 72, 47–54. [Google Scholar] [CrossRef]
- Gholipoor, M.; Soltani, A.; Shekari, F. Effects of salinity on water use efficiency and its components in chickpea (Cicer arietinum L.). Acta Agron. Hung. 2002, 50, 127–134. [Google Scholar] [CrossRef]
- Yang, H.; Shukla, M.K.; Mao, X.; Kang, S.; Du, T. Interactive Regimes of Reduced Irrigation and Salt Stress Depressed Tomato Water Use Efficiency at Leaf and Plant Scales by Affecting Leaf Physiology and Stem Sap Flow. Front. Plant Sci. 2009, 10, 160. [Google Scholar] [CrossRef]
- Polas, M.A.S.; Sakil, M.A.; Tahjib-Ul-Arif, M.; Hossain, M.A. Effect of salinity on osmolytes and relative water content of selected rice genotypes. Trop. Plant Res. 2019, 5, 227–232. [Google Scholar] [CrossRef]
- Meguekam, T.L.; Moualeu, D.P.; Taffouo, V.D.; Stützel, H. Changes in plant growth, leaf relative water content and physiological traits in response to salt stress in peanut (Arachis hypogaea L.) varieties. Not. Bot. Horti Agrobot. Cluj-Napoca 2021, 49, 12049. [Google Scholar] [CrossRef]
- He, J.; Ng, O.W.J.; Qin, L. Salinity and Salt-Priming Impact on Growth, Photosynthetic Performance, and Nutritional Quality of Edible Mesembryanthemum crystallinum L. Plants 2022, 11, 332. [Google Scholar] [CrossRef]
- Talei, D.; Kadir, M.A.; Yusop, M.K.; Valdiani, A.; Abdullah, M.P. Growth indices and salinity tolerance threshold in a medicinal plant Andrographis paniculata Nees. J. Med. Plant Res. 2013, 7, 104–110. [Google Scholar]
- Sadaqat Shah, S.; Li, Z.; Yan, H.; Shi, L.; Zhou, B. Comparative Study of the Effects of Salinity on Growth, Gas Exchange, N Accumulation and Stable Isotope Signatures of Forage Oat (Avena sativa L.) Genotypes. Plants 2020, 9, 1025. [Google Scholar] [CrossRef] [PubMed]


| Temp. | Turbidity | Color | Odor | EC | ||
|---|---|---|---|---|---|---|
| Unit | °C | NTU | Pt/Co | |||
| Range | 22–25 | 4 | 20 | 2.5 dS m−1 | ||
| Value | 24 | 1.06 | <3 | - | 0.63 | |
| Parameter | pH | Chlorite | Ammonium | Nitrite | Nitrate | |
| MAC | 6.5–9.5 | 0.25 mg/L | 0.5 mg NH4/L | 0.50 mg NO2/L | 50 mg NO3/L | |
| Value | 7.73 | 0.13 | <0.01 | <0.001 | 1.32 | |
| Parameter | Iron | Manganese | Aluminium | Phosphate | Sulphate | TDS |
| MAC | 200 µg/L | 50 µg/L | 200 µg/L | 300 µg P/L | 250 mg SO4/L | <450 mg/L |
| Value | <1 | 19 | 50 | 8.47 | 20.2 | 349.6 |
| Salinity Level | Flower Number | Plant Height | Branch Number | Leaf Number | Total Fresh Biomass | Total Dry Biomass | Root Length |
|---|---|---|---|---|---|---|---|
| n | cm | n | n | g | g | cm | |
| s0 | 5 | 21.02 | 4 | 45 | 11.1 | 2.8 | 4.73 |
| s1 | 4 | 19.29 | 4 | 39 | 10.9 | 2.7 | 3.98 |
| s2 | 3 | 18.84 | 3 | 32 | 7.6 | 2.1 | 2.12 |
| s3 | 0 | 16.51 | 2 | 25 | 5.3 | 1.3 | 1.69 |
| LSD0.01 | 0.793 | 4.819 | 0.298 | 8.614 | 1.264 | 0.351 | 1.132 |
| LSD0.05 | 1.082 | 6.248 | 0.461 | 11.544 | 2.085 | 0.498 | 1.936 |
| Fvalue | 36.242 ** | 2.692 n.s. | 49.318 ** | 6.748 ** | 7.358 ** | 39.252 ** | 6.698 ** |
| Salinity Level | Flower Number | Plant Height | Branch Number | Leaf Number | Total Fresh Biomass | Total Dry Biomass | Root Length |
|---|---|---|---|---|---|---|---|
| n | cm | n | n | g | g | cm | |
| s0 | 28 | 65.22 | 9.26 | 294.5 | 27.41 | 2.8 | 15.35 |
| s1 | 31 | 65.38 | 11.84 | 306.8 | 28.36 | 3.3 | 16.21 |
| s2 | 24 | 52.31 | 7.31 | 261.0 | 24.35 | 2.4 | 11.02 |
| s3 | 18 | 43.16 | 4.01 | 174.3 | 22.80 | 1.8 | 10.76 |
| LSD0.01 | 6.99 | 22.34 | 4.84 | 201.3 | 1.91 | 0.413 | 2.73 |
| LSD0.05 | 5.78 | 14.92 | 3.52 | 118.9 | 1.45 | 0.564 | 1.76 |
| Fvalue | 39.584 ** | 3.39 * | 5.361 ** | 6.45 * | 5.648 ** | 42.264 ** | 5.683 ** |
| Salinity Stress | RWC (%) | WUE (g/L) | GI (cm) | |||
|---|---|---|---|---|---|---|
| Zinnia | Periwinkle | Zinnia | Periwinkle | Zinnia | Periwinkle | |
| s0 | 74.2 | 75.4 | 6.07 | 14.13 | 27.01 | 38.92 |
| s1 | 69.8 | 74.9 | 5.96 | 14.62 | 20.65 | 39.41 |
| s2 | 68.7 | 68.8 | 4.15 | 12.55 | 16.32 | 26.73 |
| s3 | 52.4 | 59.3 | 2.90 | 11.75 | 12.12 | 19.18 |
| Flower Number | Plant Height | Branch Number | Leaf Number | Total Fresh Biomass | Total Dry Biomass | |
|---|---|---|---|---|---|---|
| FN | - | |||||
| PH | 0.97 | - | ||||
| BN | 0.96 | 0.91 | - | |||
| LN | 0.96 | 0.97 | 0.95 | - | ||
| TFB | 0.95 | 0.90 | 0.99 | 0.96 | - | |
| TDB | 0.98 | 0.94 | 0.99 | 0.96 | 0.98 | - |
| RL | 0.88 | 0.88 | 0.92 | 0.97 | 0.95 | 0.92 |
| Flower Number | Plant Height | Branch Number | Leaf Number | Total Fresh Biomass | Total Dry Biomass | |
|---|---|---|---|---|---|---|
| FN | - | |||||
| PH | 0.97 | - | ||||
| BN | 0.99 | 0.94 | - | |||
| LN | 0.97 | 0.95 | 0.95 | - | ||
| TFB | 0.97 | 0.98 | 0.96 | 0.92 | - | |
| TDB | 0.99 | 0.94 | 0.99 | 0.94 | 0.97 | - |
| RL | 0.91 | 0.94 | 0.90 | 0.82 | 0.97 | 0.91 |
Publisher’s Note: MDPI stays neutral with regard to jurisdictional claims in published maps and institutional affiliations. |
© 2022 by the authors. Licensee MDPI, Basel, Switzerland. This article is an open access article distributed under the terms and conditions of the Creative Commons Attribution (CC BY) license (https://creativecommons.org/licenses/by/4.0/).
Share and Cite
Marković, M.; Šoštarić, J.; Kojić, A.; Popović, B.; Bubalo, A.; Bošnjak, D.; Stanisavljević, A. Zinnia (Zinnia elegans L.) and Periwinkle (Catharanthus roseus (L.) G. Don) Responses to Salinity Stress. Water 2022, 14, 1066. https://doi.org/10.3390/w14071066
Marković M, Šoštarić J, Kojić A, Popović B, Bubalo A, Bošnjak D, Stanisavljević A. Zinnia (Zinnia elegans L.) and Periwinkle (Catharanthus roseus (L.) G. Don) Responses to Salinity Stress. Water. 2022; 14(7):1066. https://doi.org/10.3390/w14071066
Chicago/Turabian StyleMarković, Monika, Jasna Šoštarić, Antonija Kojić, Brigita Popović, Ante Bubalo, Dejan Bošnjak, and Aleksandar Stanisavljević. 2022. "Zinnia (Zinnia elegans L.) and Periwinkle (Catharanthus roseus (L.) G. Don) Responses to Salinity Stress" Water 14, no. 7: 1066. https://doi.org/10.3390/w14071066
APA StyleMarković, M., Šoštarić, J., Kojić, A., Popović, B., Bubalo, A., Bošnjak, D., & Stanisavljević, A. (2022). Zinnia (Zinnia elegans L.) and Periwinkle (Catharanthus roseus (L.) G. Don) Responses to Salinity Stress. Water, 14(7), 1066. https://doi.org/10.3390/w14071066


