
Spatial Analysis of the Chemical Regime of Groundwater in the Karatal Irrigation Massif in South-Eastern Kazakhstan


 ,
,  and
and 
Abstract
:1. Introduction
2. Materials and Methods
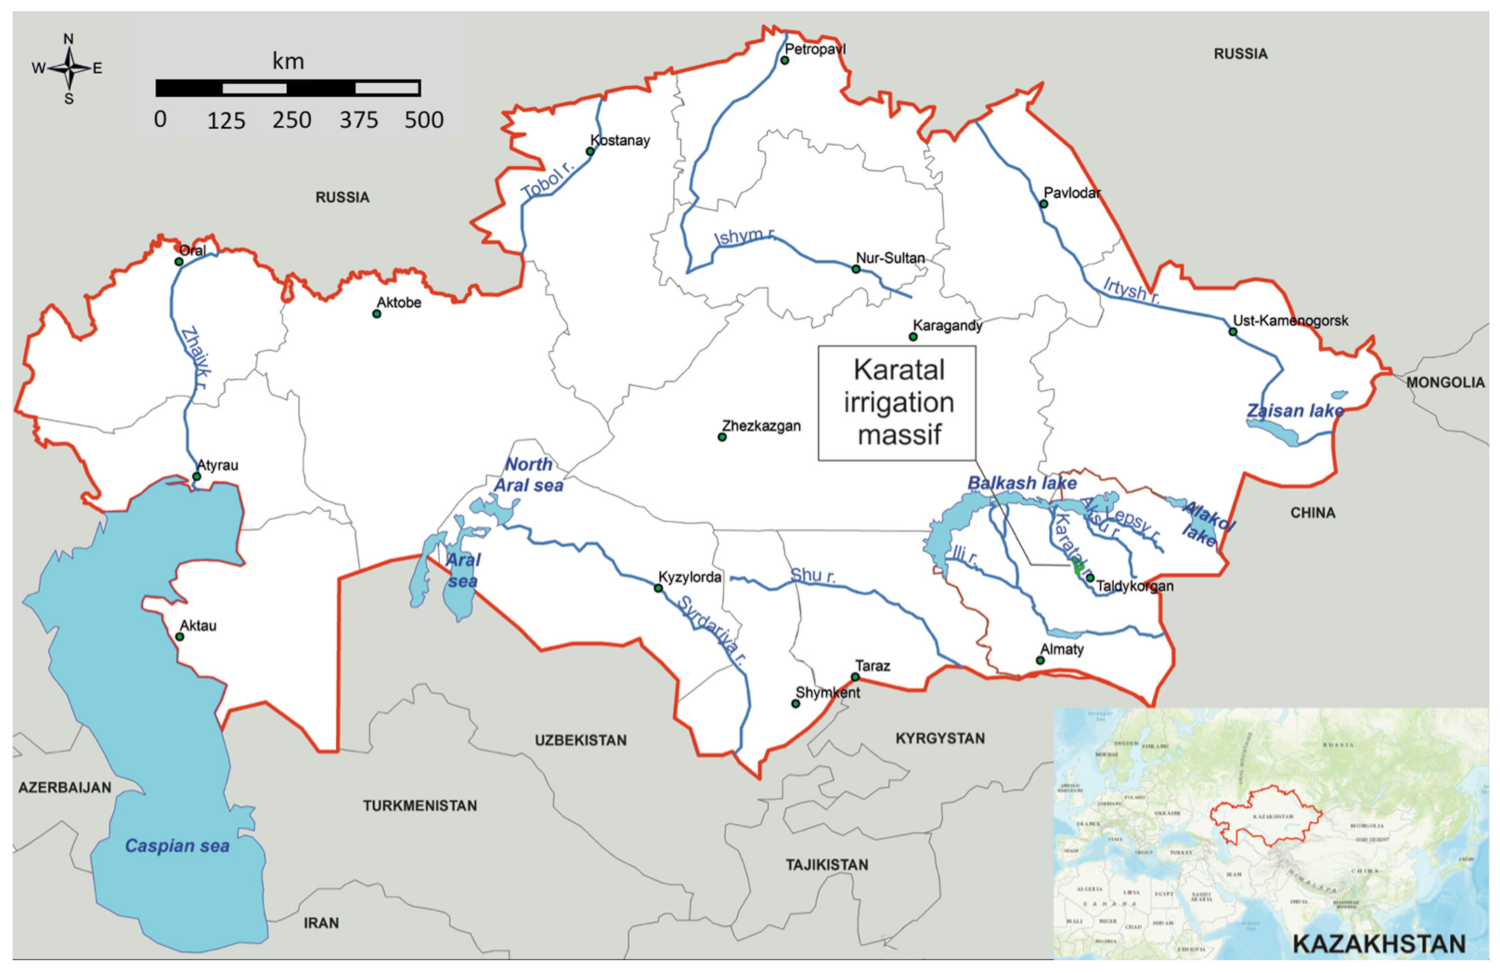
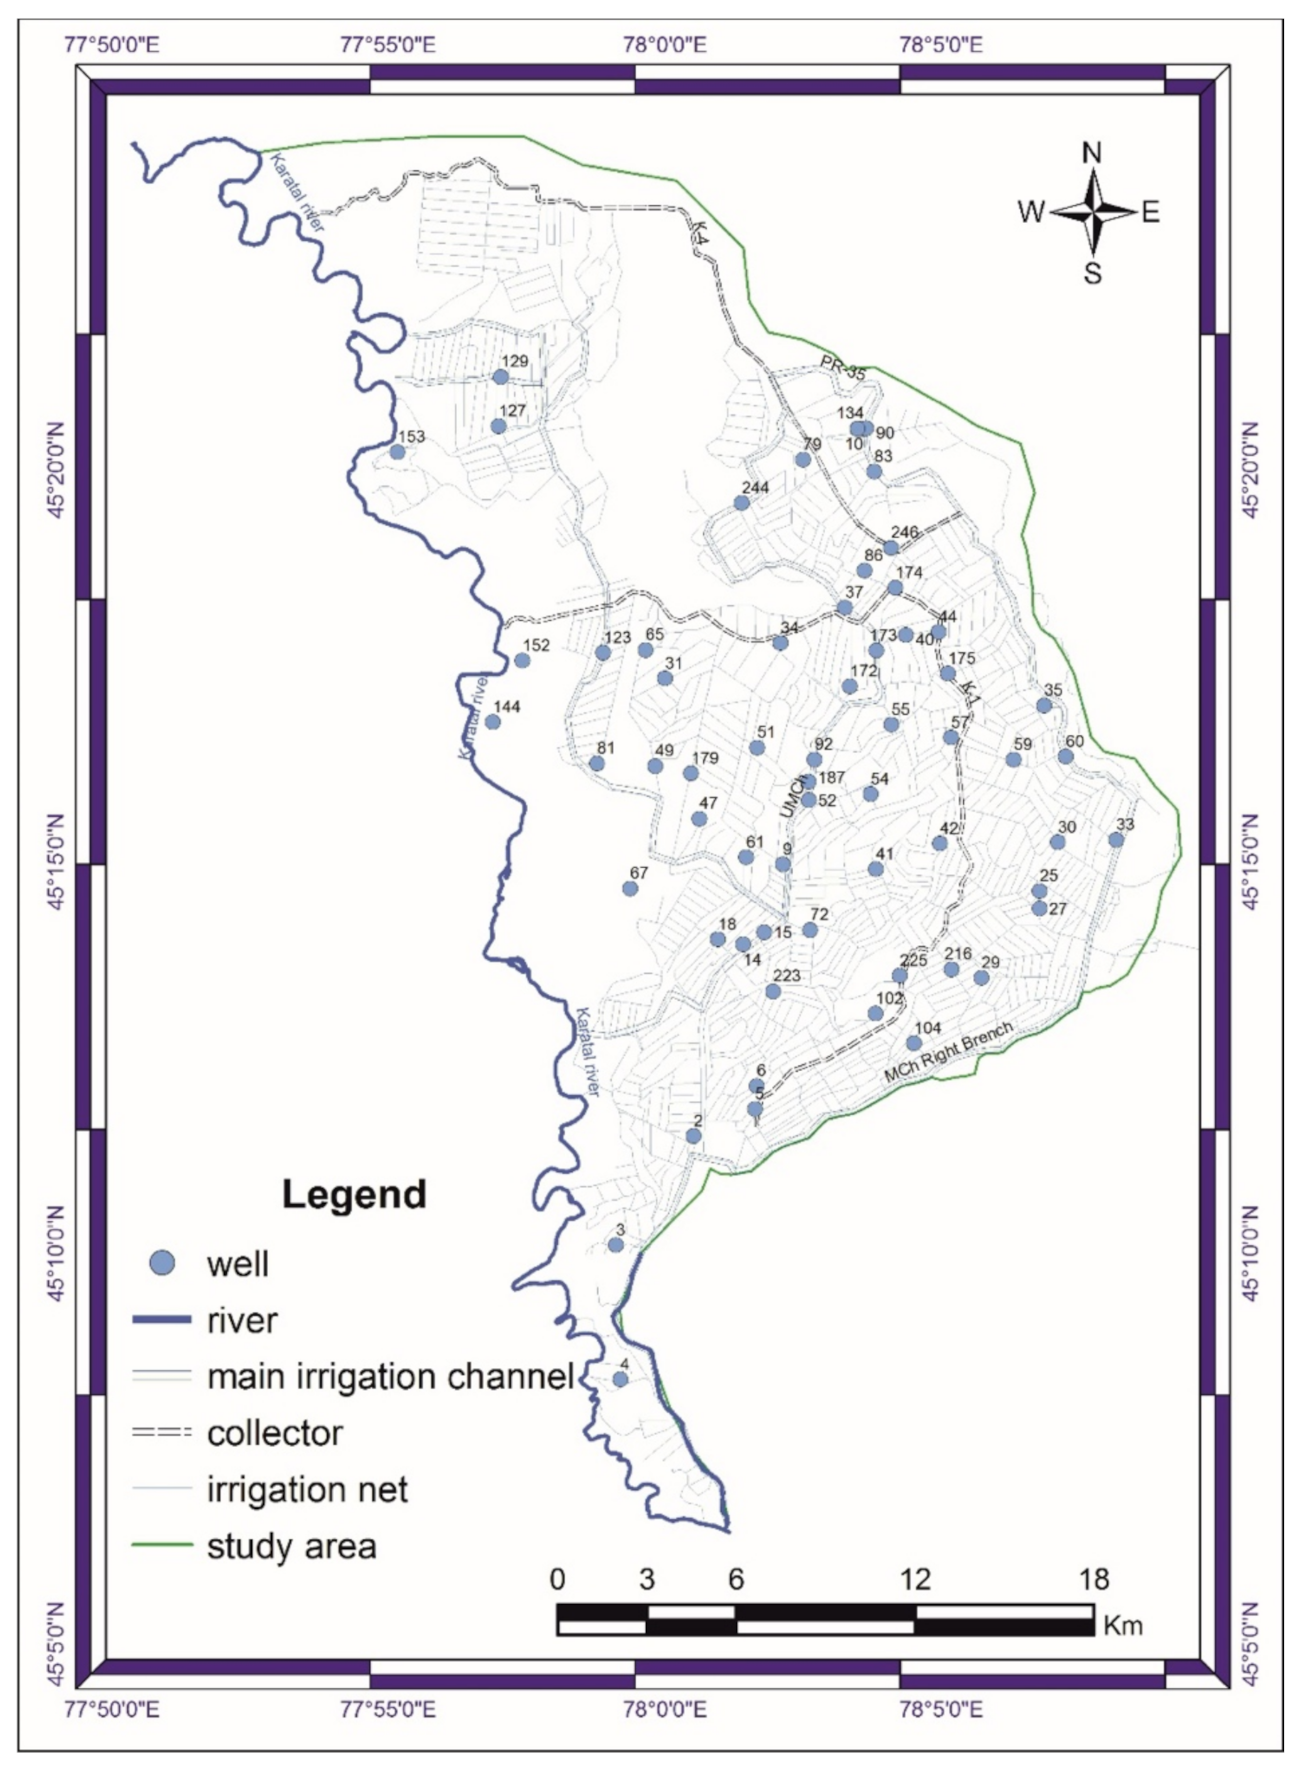
2.1. Description of the Study Area
2.2. Data Collection
- (i).
- Sampling site name
- (ii).
- Sampling date
- (iii).
- pH
- (iv).
- Values of the following parameters (mg/dm3): CO3, H CO3, Cl, SO4, Ca, Mg, Na+K, Salinity
- (v).
- Kurlov’s formula (as required by [37])
- (vi).
- Sodium adsorption ratio (SAR)
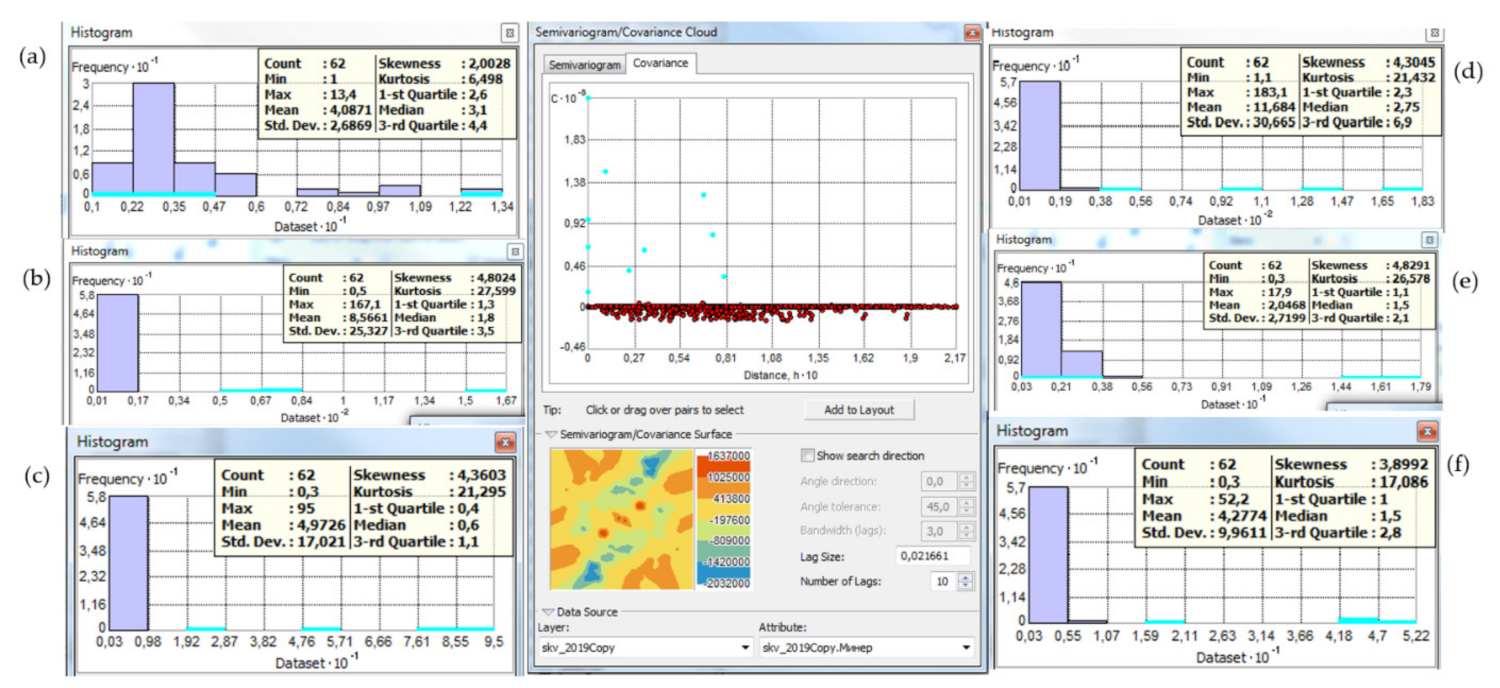
2.3. Data Analysis
3. Results and Discussion
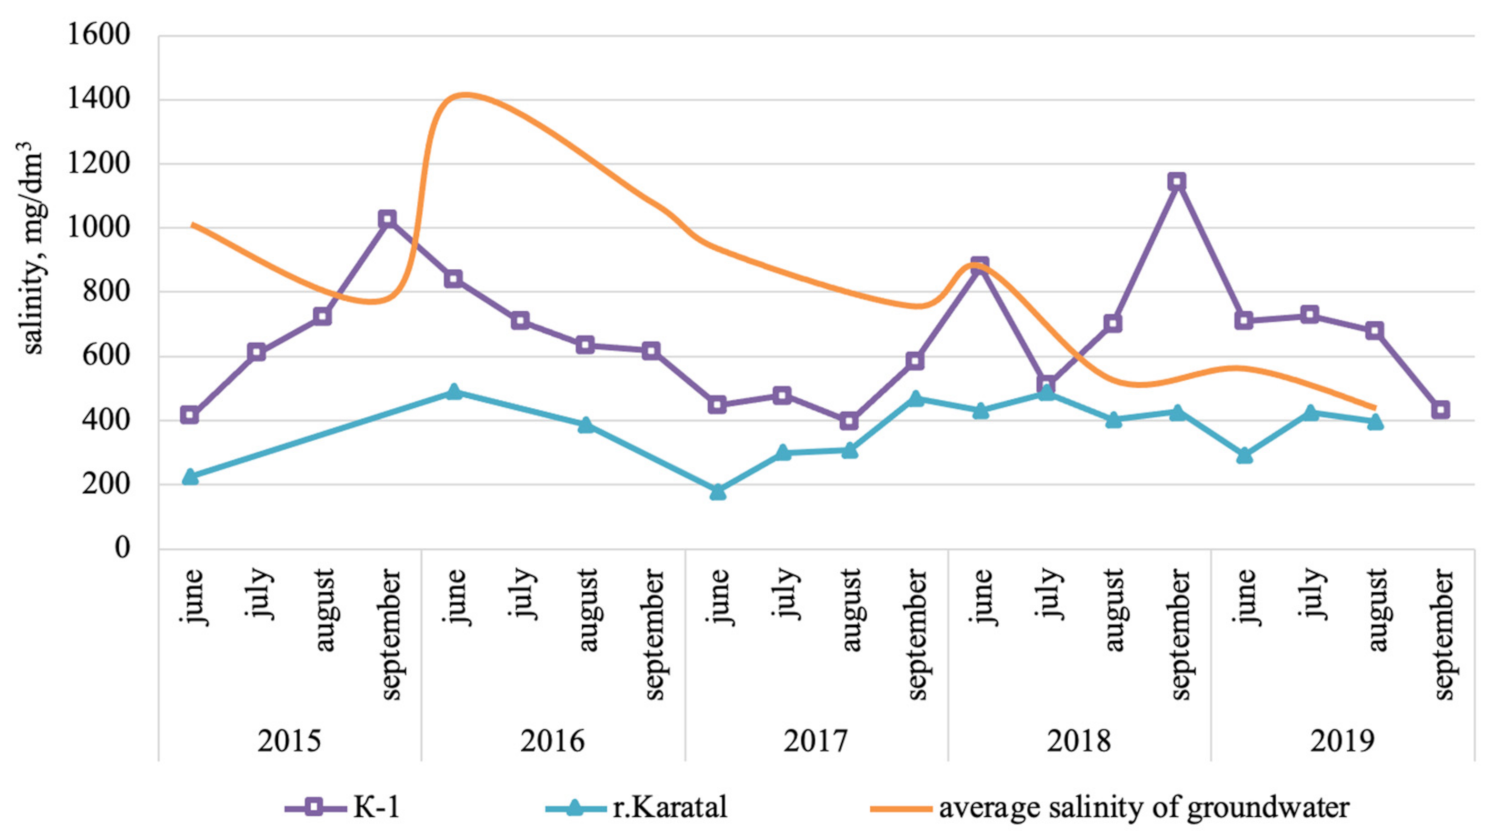
3.1. Surface Water Quality
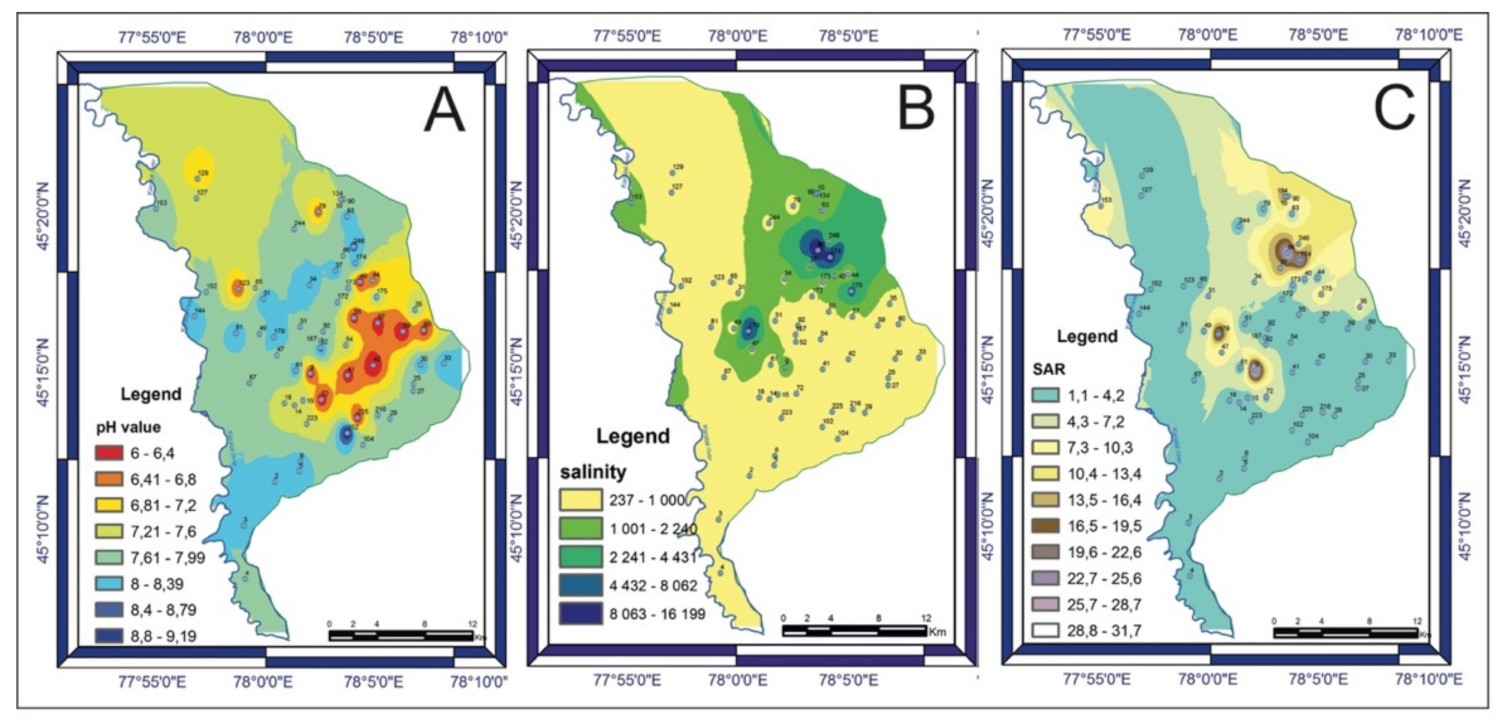
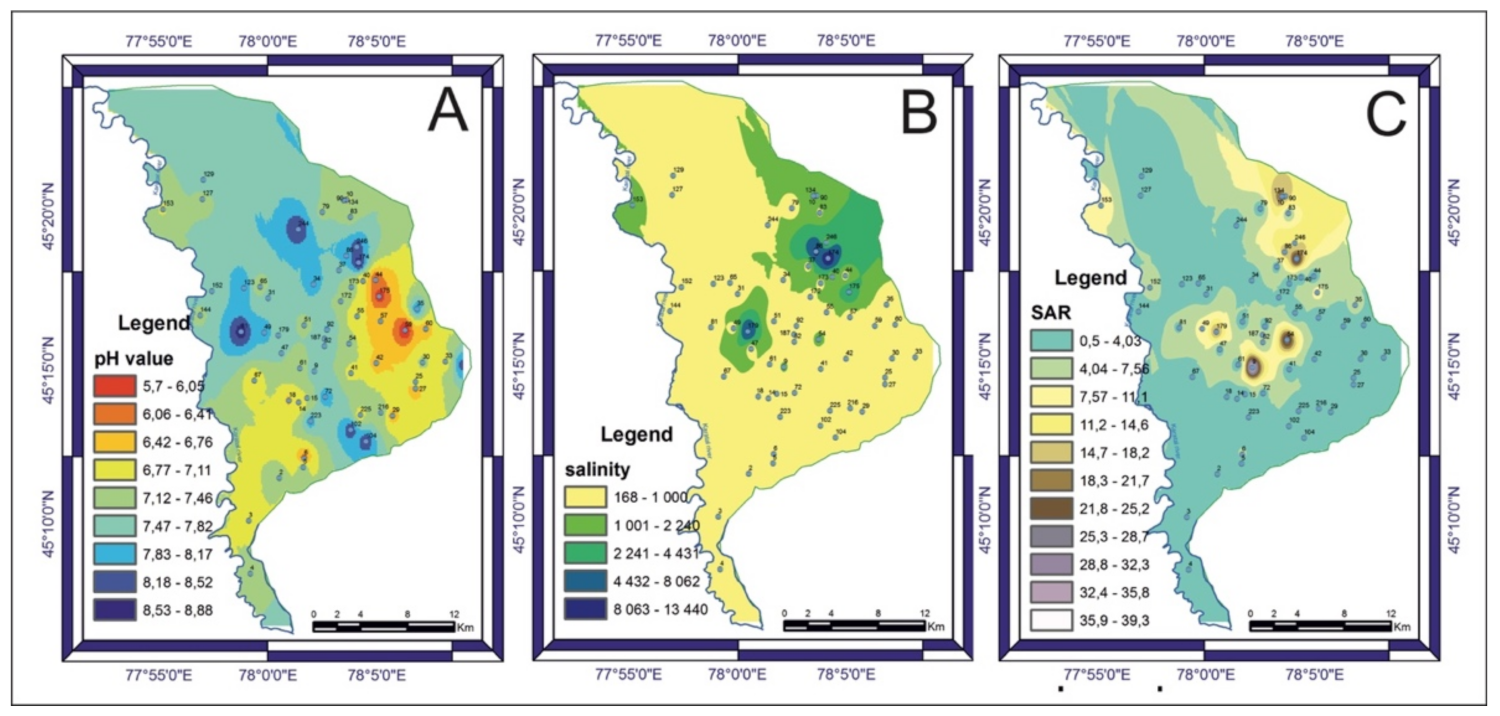
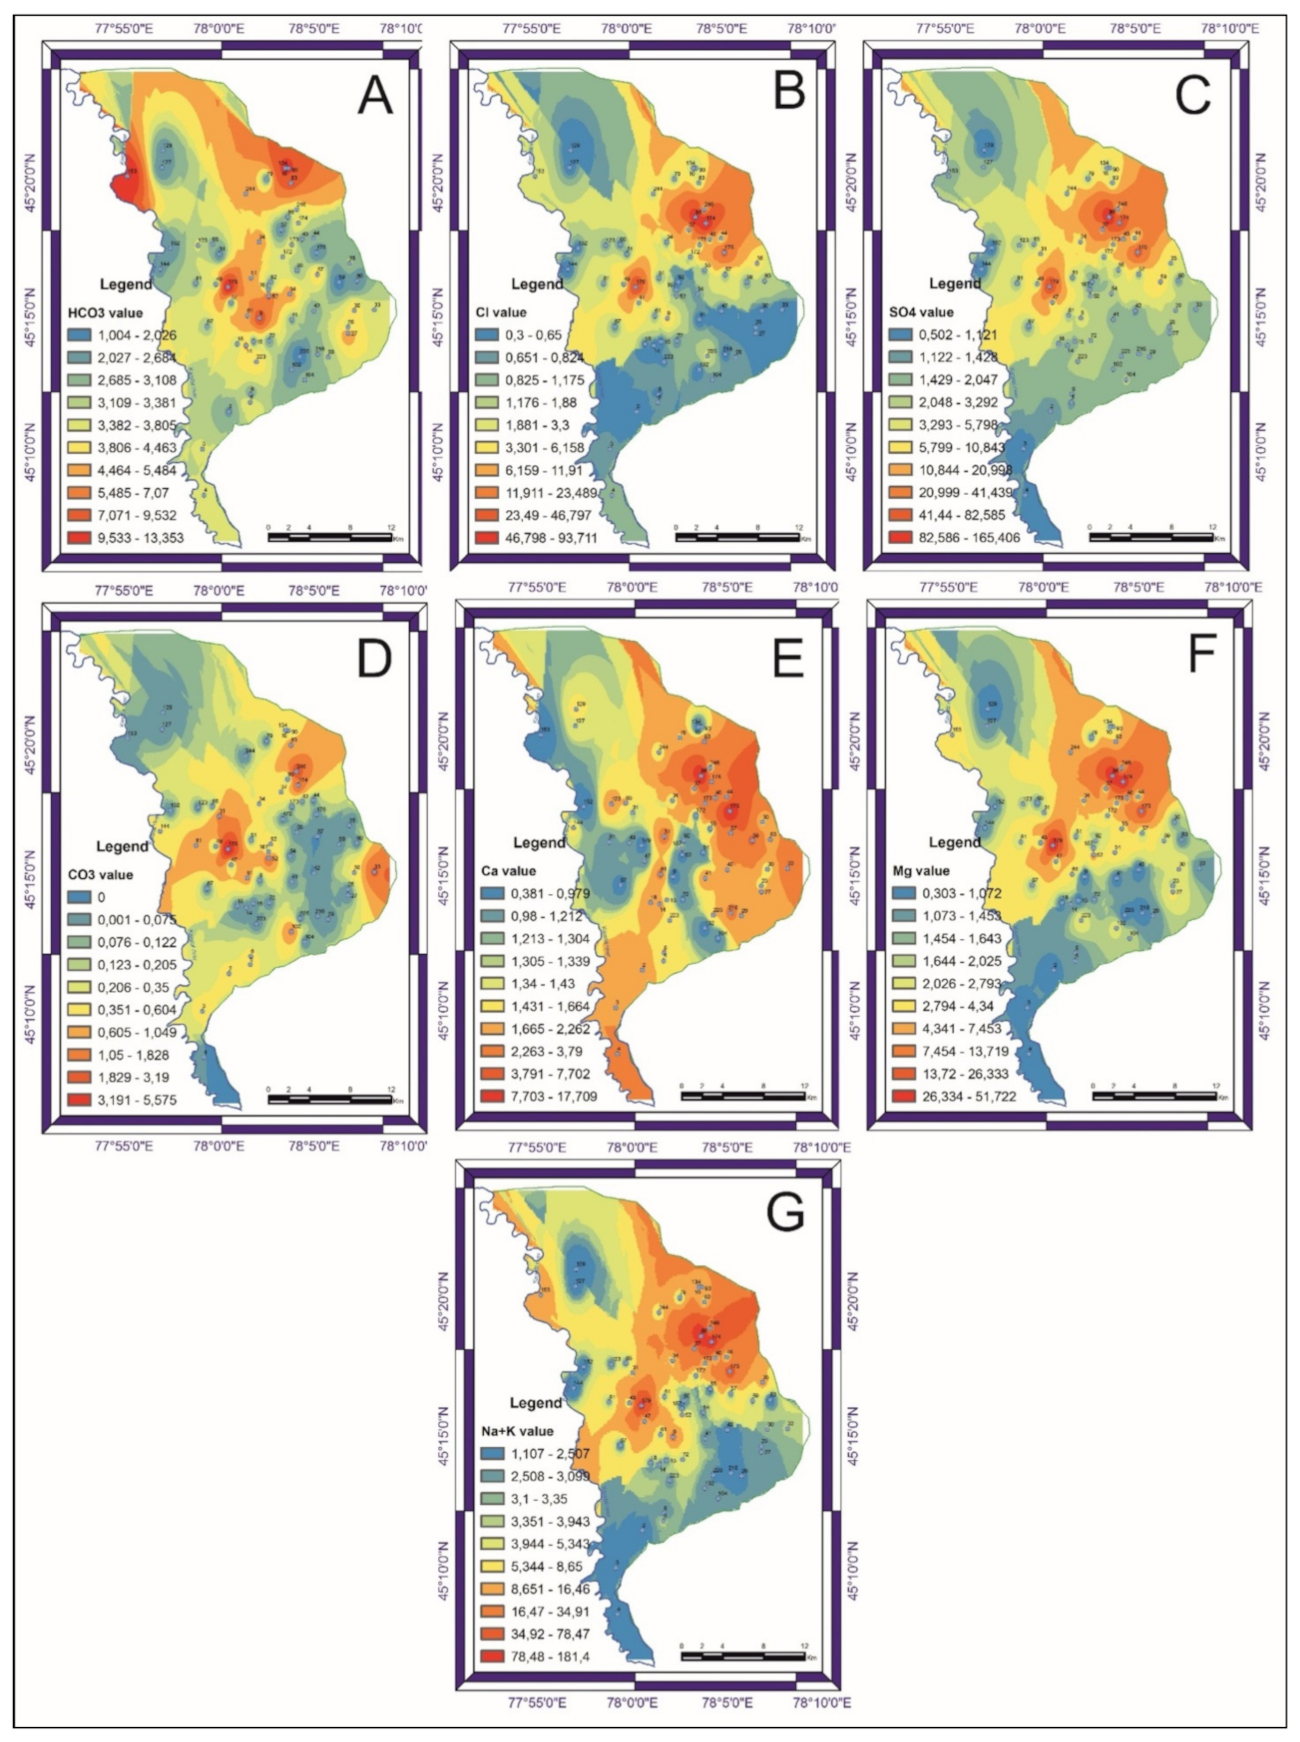
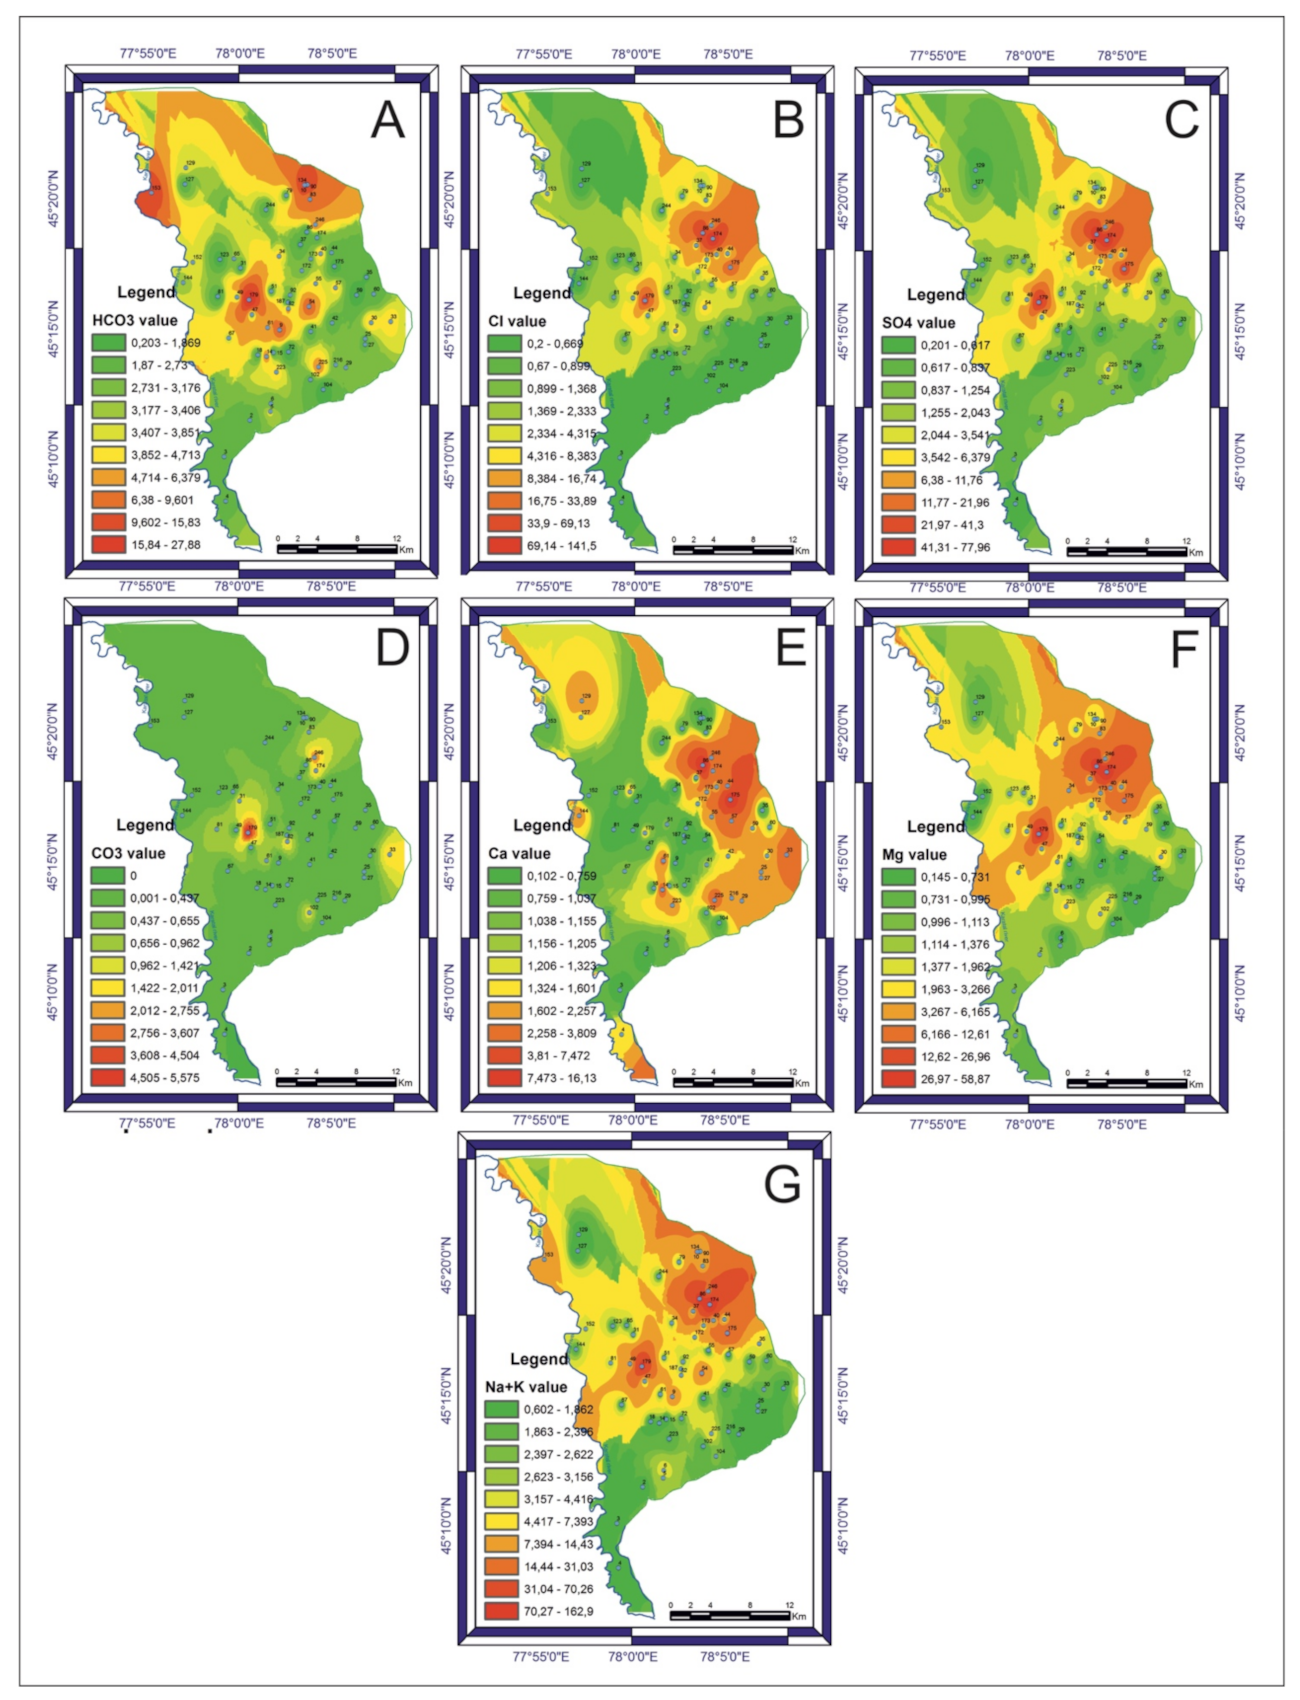
3.2. Groundwater Quality and Chemistry
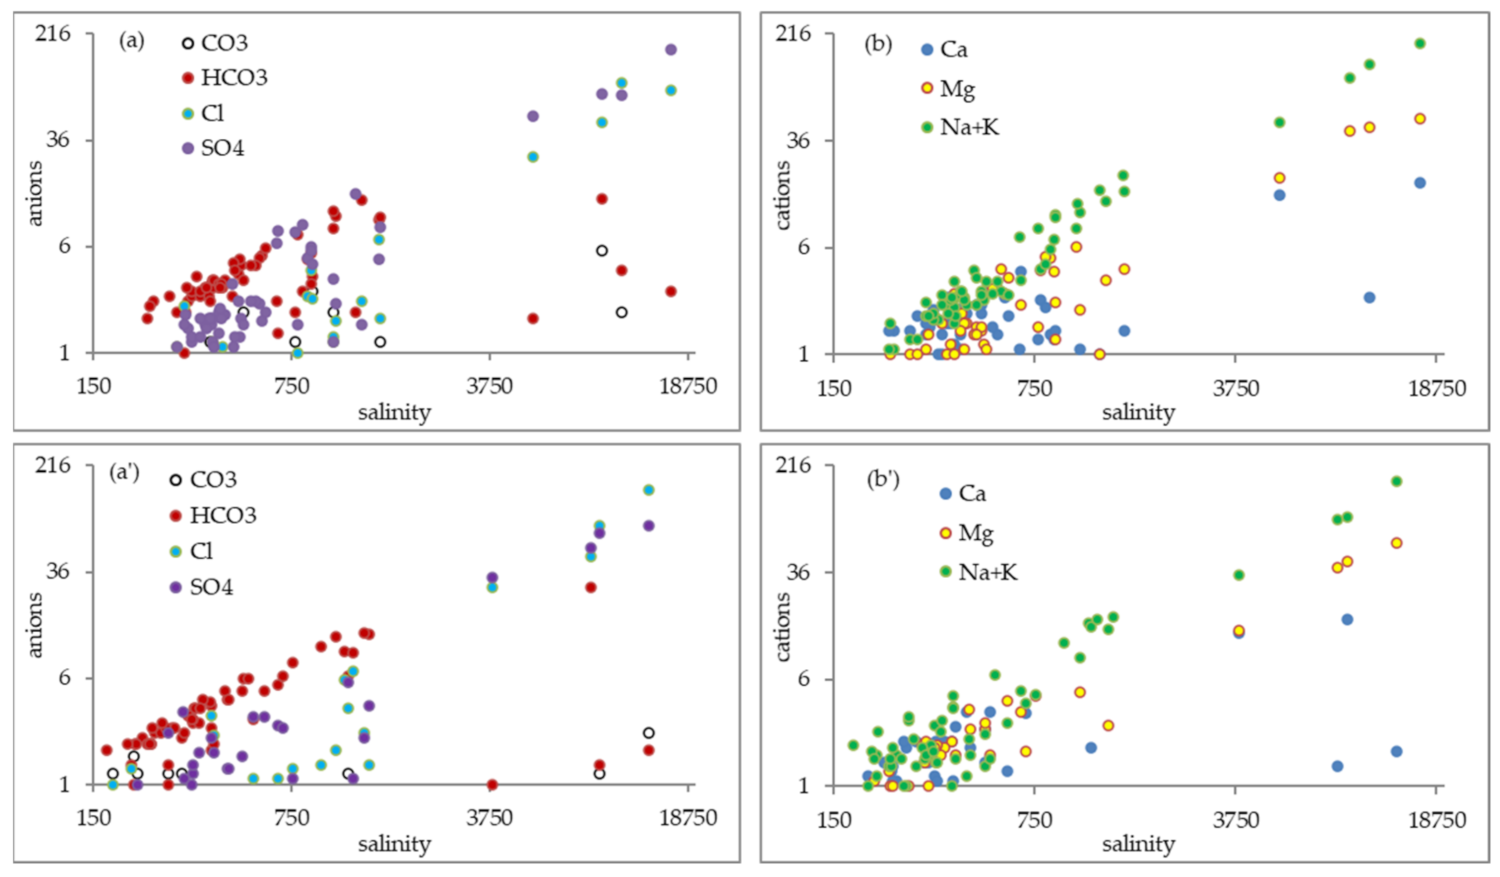
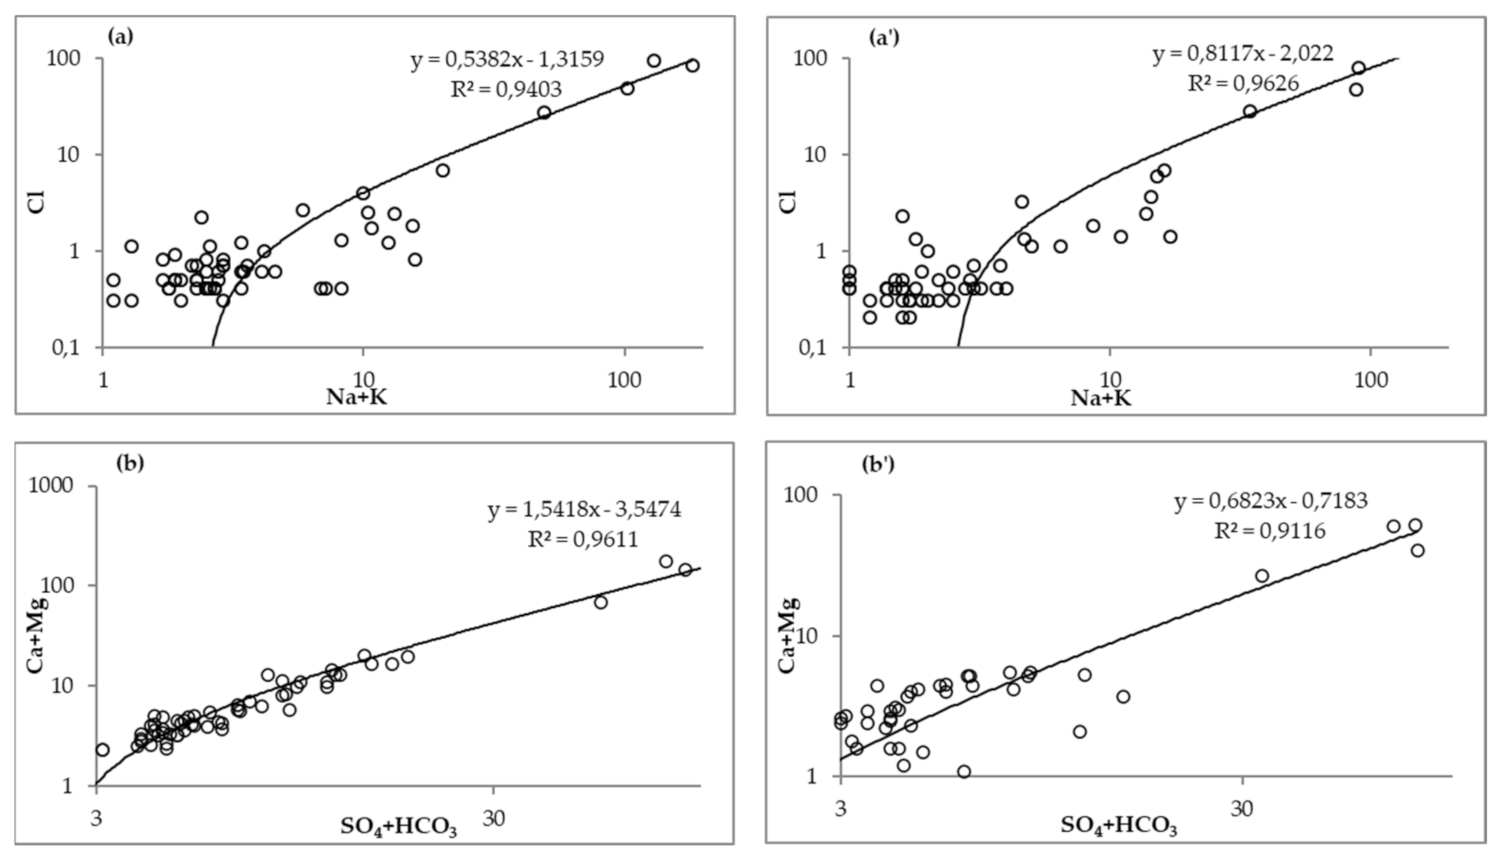
3.3. Correlation Analysis of Chemical Parameters
4. Conclusions
Supplementary Materials
Author Contributions
Funding
Informed Consent Statement
Data Availability Statement
Conflicts of Interest
References
- Singh, A. Soil salinization management for sustainable development: A review. J. Environ. Manag. 2021, 277, 111383. [Google Scholar] [CrossRef]
- Cuevas, J.; Daliakopoulos, I.N.; del Moral, F.; Hueso, J.J.; Tsanis, I.K. A review of soil-improving cropping systems for soil salinization. Agronomy 2019, 9, 295. [Google Scholar] [CrossRef] [Green Version]
- Daliakopoulos, I.N.; Tsanis, I.K.; Koutroulis, A.; Kourgialas, M.N.; Varouchakis, A.E.; Karatzas, G.P.; Ritsema, C.J. The threat of soil salinity: A European scale review. Sci. Total Environ. 2016, 573, 727–739. [Google Scholar] [CrossRef] [PubMed]
- Mao, W.; Zhu, Y.; Wu, J.; Ye, M.; Yang, J. Evaluation of effects of limited irrigation on regional-scale water movement and salt accumulation in arid agricultural areas. Agric. Water Manag. 2022, 262, 107398. [Google Scholar] [CrossRef]
- Zaporozec, A. Graphical Interpretation of Water-Quality Data. Groundwater 1972, 10, 32–43. [Google Scholar] [CrossRef]
- Katz, D.M. The Effect of Irrigation on Groundwater; Kolos: Moscow, Russia, 1976. [Google Scholar]
- Duyunov, I.K. Land Reclamation in the Conditions of Groundwater Pressure Supply; Kolos: Moscow, Russia, 1978. [Google Scholar]
- Gorev, L.N.; Peleshenko, V.I. Meliorative Hydrochemistry; Vishchashkola: Kiev, Ukraine, 1984. [Google Scholar]
- Ayers, R.S.; Westcot, D.W. Water Quality for Agriculture. In FAO Irrigation and Drainage Paper; FAO: Rome, Italy, 1985; Volume 29, p. 176. [Google Scholar]
- Rabemanana, V.; Violette, S.; de Marsily, G.; Robain, H.; Deffontaines, B.; Andrieux, P.; Bensimon, M.; Parriaux, A. Origin of the high variability of water mineral content in the bedrock aquifers of Southern Madagascar. J. Hydrol. 2005, 310, 143–156. [Google Scholar] [CrossRef]
- Scanlon, B.R.; Jolly, I.; Sophocleous, M.; Zhang, L. Global impacts of conversions from natural to agricultural ecosystems on water resources: Quantity versus quality. Water Resour. Res. 2007, 43. [Google Scholar] [CrossRef] [Green Version]
- Rotiroti, M.; Bonomi, T.; Sacchi, E.; McArthur, J.M.; Stefania, G.A.; Zanotti, C.; Taviani, S.; Patelli, M.; Nava, V.; Soler, V.; et al. The effects of irrigation on groundwater quality and quantity in a human-modified hydro-system: The Oglio River basin, Po plain, northern Italy. Sci. Total Environ. 2019, 672, 342–356. [Google Scholar] [CrossRef]
- Jia, H.; Qian, H.; Zheng, L.; Feng, W.; Wang, H.; Gao, Y. Alterations to groundwater chemistry due to modern water transfer for irrigation over decades. Sci. Total Environ. 2020, 717, 13170. [Google Scholar] [CrossRef]
- Shomar, B. Geochemistry of soil and groundwater in arid regions: Qatar as a case study. Groundw. Sustain. Dev. 2015, 1, 33–40. [Google Scholar] [CrossRef]
- Khodjibaev, N.N. Hydrogeological and Meliorative Zoning; Fan Publishing: Tashkent, Uzbekistan, 1975; p. 143. [Google Scholar]
- Katz, D.M.; Shestakov, V.M. Meliorative Hydrogeology; MSU: Moscow, Russia, 1981; p. 296. [Google Scholar]
- Rau, A.; Bakirov, A.; Anuarbek, K.; Kudasheva, J. Geochemistry of water in rice irrigation systems Akdala. News Natl. Acad. Sci. Repub. Kazakhstan 2019, 5, 74–81. [Google Scholar] [CrossRef]
- Tewabe, D.; Dessie, M.; Asmamaw, D.K.; Tamiru, E.; Adgo, E.; Nyssen, J.; Walraevens, K.; Cornelis, W.M. Comparative analysis of groundwater conditions on rain-fed and irrigated agriculture in the upper Blue Nile basin, Ethiopia. J. Hydrol. Reg. Stud. 2021, 37, 100916. [Google Scholar] [CrossRef]
- Moharir, K.; Pande, C. Spatial analysis of groundwater quality mapping in hard rock area in the Akola and Buldhana districts of Maharashtra, India. Appl. Water Sci. 2018, 8, 106. [Google Scholar] [CrossRef] [Green Version]
- Boyd, C.E. Water Quality, an Introduction; Springer International Publishing: Cham, Switzerland, 2000; p. 323. [Google Scholar]
- Schoeller, H. Geochemistry of Groundwater: An International Guide for Research and Practice; UNESCO: India, 1967; Chapter 15; pp. 1–18. [Google Scholar]
- Hale, B.; Evans, L.; Lambert, R. Effects of cement or lime on Cd, Co, Cu, Ni, Pb, Sb and Zn mobility in field-contaminated and aged soils. J. Hazard. Mater. 2012, 199–200, 119–127. [Google Scholar] [CrossRef] [PubMed]
- Bolan, N.S.; Rowarth, J.; Mora, M.L.L.; Adriano, D.; Curtin, D. Biological transformation and bioavailability of nutrient elements in acid soils as affected by liming. Dev. Soil Sci. 2008, 32, 413–446. [Google Scholar] [CrossRef]
- Beecher, H.G. Effect of saline water on rise and soil properties in the Murrumbidgee Valley. Austral. J. Exp. Agr. 1991, 6, 819. [Google Scholar] [CrossRef]
- Asch, F.; Dingkuhn, M.; Dorffling, K. Salinity increases CO2 assimilation but reduce growth in field-grown irrigated rice. Plant Soil 2000, 218, 1–10. [Google Scholar] [CrossRef]
- Kitamura, Y.; Yano, T.; Yasuda, S.; Oba, T. Water and salt behavior in an irrigation block under rice-based cropping system in Central Asia—Research on water management to prevent secondary salinization in Arid Land (II). Trans. Jpn. Soc. Irri. Drain. Reclam. Eng. 2000, 206, 47–56. [Google Scholar] [CrossRef]
- Asch, F.; Wopereis, M.S.C. Responses of field-grown irrigated rice cultivars to varying levels of floodwater salinity under semi-arid conditions. Field Crops Res. 2001, 70, 127–137. [Google Scholar] [CrossRef]
- Rau, A.G. Rice production on saline lands in the Syrdarya basin. In Proceedings of the Water Resources of Central Asia and Their Use Conference Proceedings, Almaty, Kazakhstan, 22–23 September 2016. [Google Scholar]
- Chen, L.; Feng, Q. Geostatistical analysis of temporal and spatial variations in groundwater levels and quality in the Minqin oasis, Northwest China. Env. Earth Sci. 2013, 70, 1367–1378. [Google Scholar] [CrossRef]
- Shakibayev, I.; Barmakova, D.; Yerikuly, Z.; Rau, G.; Kadasheva, Z.; Begmatov, I. Methodology for creating a geoinformation-analytical system to monitor irrigated lands in the south-east of Kazakhstan. Proc. InterCarto. InterGIS Conf. 2020, 26, 286–293. [Google Scholar] [CrossRef]
- Piper, A.M. A graphic procedure in geochemical interpretation of water analysis. Trans. Am. Geophys. Union 1944, 25, 914–928. [Google Scholar] [CrossRef]
- Fritch, T.G.; McKnigth, C.L.; Yelderman, J.C.; Dworkin, S.I.; Arnold, J.G. A predictive modeling approach to assessing the groundwater pollution susceptibility of the Paluxy Aquifer, Central Texas, using a Geographic Information System. Environ. Geol. 2000, 39, 1063–1069. [Google Scholar] [CrossRef]
- Böhlke, J.K. Groundwater recharge and agricultural contamination. Hydrogeol. J. 2000, 10, 153–179. [Google Scholar] [CrossRef]
- Tiwari, K.; Goyal, R.; Sarkar, A. GIS-based spatial distribution of groundwater quality and regional suitability evaluation for drinking water. Environ. Proc. 2007, 4, 645–662. [Google Scholar] [CrossRef]
- Salikova, N.S.; Rodrigo-Ilarri, J.; Alimova, K.K.; Rodrigo-Clavero, M.E. Analysis of the Water Quality of the Ishim River within the Akmola Region (Kazakhstan) Using Hydrochemical Indicators. Water 2021, 13, 1243. [Google Scholar] [CrossRef]
- Honarbakhsh, A.; Azma, A.; Nikseresht, F.; Mousazadeh, M.; Eftekhari, M.; Ostovari, Y. Hydro-chemical assessment and GIS-mapping of groundwater quality parameters in semi-arid regions. J. Water Supply Res. Technol.-Aqua 2019, 68, 509–522. [Google Scholar] [CrossRef]
- The Rules of State Conduct Monitoring and Evaluation of Ameliorative Condition of Irrigated Lands in the Republic of Kazakhstan and Information Data Bank on Reclamation of the land for Agricultural Purposes. Approved by the Ministry of Agriculture of the Republic of Kazakhstan on 25 July 2016. No. 330. Available online: https://adilet.zan.kz/rus/docs/V1600014227 (accessed on 16 January 2022).
- Ndoye, S.; Fontaine, C.; Becaye Gaye, C.; Razack, M. Groundwater quality and suitability for different uses in the Saloum Area of Senegal. Water 2018, 10, 1837. [Google Scholar] [CrossRef] [Green Version]
- Averyanov, S.F. Filtration from Channels and Its Influence on the Groundwater Regime//The Influence of irrigation Systems on the Groundwater Regime; USSR: Kolos, Moscow, 1982. [Google Scholar]
- Katz, D.M. The Groundwater Regime of Irrigated Areas and Its Regulation; H UTCHINSON/FAO/UNESC: Moscow, Russia, 1963; p. 367. [Google Scholar]
- Pulido-Bosch, A.; Rigol-Sánchez, J.P.; Vallejos, Á.; Andreu, J.M.; Cerón, J.C.; Molina-Sánchez, L.; Sola, F. Impacts of agricultural irrigation on groundwater salinity. Environ. Earth Sci. 2018, 77, 197. [Google Scholar] [CrossRef] [Green Version]
- Suárez, D.L. Impact of Agricultural Practices on Groundwater Salinity. Agric. Ecosyst. Environ. 1989, 26, 215–227. [Google Scholar] [CrossRef]


| Types of Analyses | Current Kazakh State Standard |
|---|---|
| Abbreviated chemical analysis (pH, Cl−, SO42−, HCO3−, NO3−, CO32−, Ca2+, Mg2+, Na+, K+, CO32−, H2CO3) | |
| Sodium ion (Na+) | GOST 26449.1-85, i. 7. |
| Calcium ion (Ca2+) and Magnesium ion(Mg2+) | GOST 26449.1-85, i. 11. |
| Potassium ion (K+) | GOST 26449.1-85, i. 12. |
| Sulfate ion (SO42−) | GOST 26449.1-85, i. 9. |
| Chlorine ion (Cl−) | GOST 26449.1-85, i. 13. |
| Bicarbonate (HCO3−) | GOST 26449.1-85, i. 18. |
| Alkalinity pH | GOST 26449.1-85, i. 17. |
| Total Water Salinity (g/dm3) | Hazard of Soil Salinization | Hazard of Soil Salinization by SAR Value | |||
|---|---|---|---|---|---|
| Low | Average | High | Very High | ||
| <1 | Low | 8–10 | 15–18 | 22–26 | >26 |
| 1–2 | Average | 6–8 | 12–15 | 18–22 | >22 |
| 2–3 | High | 4–6 | 9–12 | 14–18 | >18 |
| >3 | Very high | 2–4 | 6–9 | 11–14 | >14 |
| mg/dm3 | Min | Max | Average | Median | Standard Deviation |
|---|---|---|---|---|---|
| Numerator (pre-veg.)—Denominator (post-veg.) | |||||
| CO3 | 0 0 | 5.6 2.4 | 0.39 1.02 | 0 1.2 | 0.9 0.9 |
| HCO3 | 1 0.2 | 13.4 28 | 4.09 4.13 | 3.1 2.8 | 2.69 4.22 |
| Cl | 0.3 0.2 | 95 143.6 | 4.97 5.62 | 0.6 0.4 | 17.02 21.39 |
| SO4 | 0.5 0.2 | 167.1 79 | 8.57 4.85 | 1.8 0.8 | 25.33 15.03 |
| Ca | 0.3 0.1 | 17.9 16.3 | 2.05 1.68 | 1.5 1.1 | 2.72 2.55 |
| Mg | 0.3 0.1 | 52.2 59.7 | 4.28 3.74 | 1.5 0.9 | 9.96 10.33 |
| Na+K | 1.1 0.6 | 183.1 165.3 | 11.68 9.41 | 2.75 1.9 | 30.67 25.85 |
| pH | 6 5.7 | 9.2 8.9 | 7.57 7.33 | 7.8 7.25 | 0.84 0.67 |
| salinity | 237 167 | 16,354 13,632 | 1210.4 986.19 | 466.5 340.5 | 2679.1 2269.8 |
| SAR | 1.1 0.5 | 31.8 39.4 | 5.14 5.28 | 2.1 1.85 | 7.12 8.17 |
| mg/dm3 | CO32− | HCO3− | Cl− | SO42− | Ca+2 | Mg+2 | Na+K | pH | Salinity |
|---|---|---|---|---|---|---|---|---|---|
| Numerator (pre-veg.)—Denominator (post-veg.) | |||||||||
| CO32− | 1.000 1.000 | ||||||||
| HCO3− | 0.665 −0.265 | 1.000 1.000 | |||||||
| Cl− | 0.526 0.652 | 0.120 0.106 | 1.000 1.000 | ||||||
| SO42− | 0.707 0.590 | 0.090 0.214 | 0.916 0.951 | 1.000 1.000 | |||||
| Ca2+ | −0.287 0.123 | −0.199 −0.114 | 0.569 0.430 | 0.755 0.583 | 1.000 1.000 | ||||
| Mg2+ | 0.707 0.601 | 0.211 0.255 | 0.965 0.963 | 0.948 0.982 | 0.591 0.476 | 1.000 1.000 | |||
| Na+K | 0.657 0.661 | 0.190 0.280 | 0.970 0.981 | 0.977 0.962 | 0.638 0.390 | 0.974 0.973 | 1.000 1.000 | ||
| pH | 0.259 0.738 | 0.164 −0.006 | 0.136 0.309 | 0.123 0.250 | −0.009 −0.162 | 0.179 0.290 | 0.148 0.313 | 1.000 1.000 | |
| salinity | 0.678 0.630 | 0.189 0.300 | 0.963 0.972 | 0.984 0.983 | 0.673 0.468 | 0.980 0.987 | 0.998 0.994 | 0.148 0.281 | 1.000 1.000 |
| Area (ha) | Water Salinity (mg/dm3) Numerator (April)—Denominator (September) | ||
|---|---|---|---|
| <1000 | >1000 | ||
| Irrigated area | 11,845 | ||
Publisher’s Note: MDPI stays neutral with regard to jurisdictional claims in published maps and institutional affiliations. |
© 2022 by the authors. Licensee MDPI, Basel, Switzerland. This article is an open access article distributed under the terms and conditions of the Creative Commons Attribution (CC BY) license (https://creativecommons.org/licenses/by/4.0/).
Share and Cite
Barmakova, D.B.; Rodrigo-Ilarri, J.; Zavaley, V.A.; Rodrigo-Clavero, M.-E.; Capilla, J.E. Spatial Analysis of the Chemical Regime of Groundwater in the Karatal Irrigation Massif in South-Eastern Kazakhstan. Water 2022, 14, 285. https://doi.org/10.3390/w14030285
Barmakova DB, Rodrigo-Ilarri J, Zavaley VA, Rodrigo-Clavero M-E, Capilla JE. Spatial Analysis of the Chemical Regime of Groundwater in the Karatal Irrigation Massif in South-Eastern Kazakhstan. Water. 2022; 14(3):285. https://doi.org/10.3390/w14030285
Chicago/Turabian StyleBarmakova, Dinara B., Javier Rodrigo-Ilarri, Vyacheslav A. Zavaley, María-Elena Rodrigo-Clavero, and José E. Capilla. 2022. "Spatial Analysis of the Chemical Regime of Groundwater in the Karatal Irrigation Massif in South-Eastern Kazakhstan" Water 14, no. 3: 285. https://doi.org/10.3390/w14030285
APA StyleBarmakova, D. B., Rodrigo-Ilarri, J., Zavaley, V. A., Rodrigo-Clavero, M.-E., & Capilla, J. E. (2022). Spatial Analysis of the Chemical Regime of Groundwater in the Karatal Irrigation Massif in South-Eastern Kazakhstan. Water, 14(3), 285. https://doi.org/10.3390/w14030285