Article

Assessment of Groundwater Contamination Risk in Oilfield Drilling Sites Based on Groundwater Vulnerability, Pollution Source Hazard, and Groundwater Value Function in Yitong County

1
Key Laboratory of Groundwater Resources and Environment, Ministry of Education, Changchun 130021, China
2
Jilin Provincial Key Laboratory of Water Resources and Environment, Jilin University, Changchun 130021, China
3
China Institute of Water Resources and Hydropower Research, Beijing 100038, China
*
Author to whom correspondence should be addressed.
Water 2022, 14(4), 628; https://doi.org/10.3390/w14040628
Submission received: 10 January 2022 / Revised: 14 February 2022 / Accepted: 16 February 2022 / Published: 18 February 2022
(This article belongs to the Special Issue Groundwater Vulnerability to Pollution Assessment)

Abstract

:
Oilfield drilling sites are the potential dispersive pollution source of groundwater, especially to shallow groundwater. The pollution risk assessment in these areas is an important reference for effective groundwater management and protection. The vulnerability assessment alone is not sufficient for groundwater contamination risk assessment. In this study, we developed a comprehensive groundwater pollution risk assessment method for oilfield drilling sites that combine groundwater vulnerability, pollution source hazard, and groundwater value function to produce a more comprehensive result. Consider the oilfield drilling area in Yitong County of Jilin Province, China, as an example. Thematic maps of the three aspects (groundwater vulnerability, pollution source hazard, and groundwater value function) were generated in ArcGIS environment to assess the contamination risk of groundwater in quaternary pore unconfined aquifer. The results show that 9.92% of the study area is characterized as being at high risk. These areas are mainly distributed around the center position of the oil drilling site, floodplains, and the reservoir. The moderate risk area accounts for 21.04% of the total area. It is distributed in the first-level terrace, mainly because of the high function value of groundwater. The remaining 69.04% of the study area is characterized as none and mild risk, mainly distributed in the valleys and terraces. This integrated groundwater contamination risk assessment method is suited for comparative assessment of multiple-point sources of contamination at a regional scale. Finally, the groundwater contamination risk grade distributed in this area provides a reference for effective protection and sustainable supply of groundwater in the oilfield drilling area.

1. Introduction

Petroleum is one of the most important resources in the world. Oilfield drilling and exploitation distribute widely in the area where oil has been extracted. The oilfield drilling sites are generally considered as the multiple-point sources of contamination to groundwater. Groundwater pollution incidents occur frequently in oil exploitation, transportation, and processing [1]. Oil leakage in the process of oil recovery would produce great harm to groundwater quality, especially carcinogenic, teratogenic, and mutagenic petroleum pollutants [2]. They are greatly harmful to the ecological environment and human health [3]. It is essential to evaluate oil drilling hazards to the environment, especially to groundwater. Therefore, the groundwater pollution risk assessment is strongly necessary in this area.
Groundwater risk assessment is an essential tool for prevention and control of oil leakage [4,5]. It is highly associated with ecological, agricultural, industrial, and human activities. According to former studies, the influence factors of groundwater contamination risk can be categorized into three aspects: the vulnerability, the hazard caused by pollutants, and the degree of groundwater development and utilization [6,7,8]. Groundwater vulnerability research is a key step in assessing pollution risk [9,10]. To deeply understand groundwater vulnerability, various methods are proposed, such as the process-based simulation method [11], statistical method, and index overlay methods (DRASTIC, SINTACS, GOD, SI, etc.) [12,13,14,15,16,17]. At present, the DRASTIC model is the most widely applied one in various countries [18,19,20,21,22,23,24]. The DRASTIC model was first developed by the United States Environmental Protection Agency (USEPA). It then became increasingly mature with the intrinsic vulnerability indices of groundwater and dynamic factors such as anthropogenic activities [22,25,26,27]. Due to distinctive hydrogeological characteristics and diverse human activities, different evaluation methods for intrinsic aquifer vulnerability have been developed and applied [28]. In addition, there are several methods (LM-BP, AHP, PCA, etc.) applied to improve the value of indicators, which were usually subjective [29,30,31].
Groundwater vulnerability assessment, integrated with groundwater pollution source hazard assessment, was gradually applied to appraise the groundwater pollution risk since the 1980s [32,33]. Groundwater pollution source hazard assessments were usually evaluated on water quality by samples, but rarely be mentioned for future pollution forecasts [34]. Therefore, it has been gradually agreed upon that the risk should be expressed by integrating the probability of contamination occurrence with the expected damage of groundwater pollution [35,36,37]. Moreover, the groundwater function value is an important reference for groundwater protection. The value function assessment of groundwater was included in the pollution risk of a groundwater system which focuses on the pollution risk receptors [38]. The purpose of groundwater assessment is to make people aware of the present and future value of groundwater exploitation [39]. Various factors have been illustrated to quantify the value of groundwater as a means to measure the total value of groundwater function through its exploitation and in situ value by many researchers [40]. The groundwater function value assessment system was established by selecting the factors about groundwater ecological service, health service, and socio-economic service functions [41,42]. Generally, it was assessed by groundwater quantity and quality, and water supply significance [43]. In the karst area, the evaluated indices included population density, per capita GDP, groundwater level, average annual precipitation, groundwater quality, and modulus of groundwater resources [44]. All these factors chosen in existing research are mainly related to human activities, and the quality and quantity of groundwater. Groundwater function values can be classified into not only an ex situ (exploration) value and an in situ value but also groundwater quantity and quality [43]. The groundwater function values are difficult to calculate because of their highly complex relationships, such as water quality, water richness, and the capture zone of pumping wells, etc. [35,45]. These indices need to be selected and integrated based on their relevance to the study area.
In this study, we assess groundwater contamination risk in the oilfield drilling site in Yitong County of Jilin Province, China. In particular, we combine groundwater intrinsic vulnerability with pollution source hazard and groundwater function value to produce a more objective result for groundwater contamination risk. This integrated groundwater contamination risk assessment method is suited for comparative assessment of a large number of dispersive pollution sources at a regional scale, especially in the countries with the most impacted groundwater resources such as Iran, Pakistan, India, USA, and North China, etc. The results above provide a good approach for accurately assessing groundwater risk. The mapping can be applied for the effective protection and sustainable supply of groundwater.

2. Study Area

The study area is located to the west of the Yitong River in Yitong Manchu Autonomous County, Jilin Province of China, with a total area of 197.5 km2 (Figure 1). The geomorphological types are mainly alluvial plains and erosion platforms. The terrain is roughly inclined from south to north. This study area is located in the Mori-qing fault depression [46]. The climatic condition of this area is the continental monsoon that is influenced by the east monsoon during the summer. The average annual precipitation is 651.7 mm. The amount of potential evaporation is about 800 mm. The sediments in the unsaturated zone and the lithology of aquifers are mainly sand, gravel, conglomerate, sandstone, and others. The western boundary of the study area is the northwest Songliao watershed. The quaternary unconfined aquifer thickens on both sides of the watershed and thins in the plain area. The depth of groundwater is between 0 m and 9.6 m. Moreover, the Quaternary unconfined aquifer and Neogene confined aquifer are in unconformity contact. The main recharge of groundwater is infiltration of precipitation. There is then the lateral runoff, river, and irrigation infiltration in local areas. The main discharge of groundwater is seepage into the rivers, and the vertical evaporation is the main discharge in the valley area. The hydrogeological conditions are different with obvious characteristics from the erosion platform areas in the northwest and southeast to the central plains. For example, groundwater is mainly stored in carbonate rock fissures and fault veins in the northwest and southeast. It is stored mainly in the porous medium in the central alluvial plains. Most of the area is cultivated land with corn crops. The irrigation water is mainly from groundwater except the land near the surface water [47].
The drilling wells of an oilfield mining plant in the study area are located in the quasi-protected area of the drinking water source in the Yitong area. The site selection scope includes the distribution of centralized water supply source wells in Yitong County. At present, 20 underground water source mining wells supply water to the urban settlements in Yitong County for domestic and production. An oil field company intends to drill wells in Yitong County, and 51 oil drilling wells are preliminarily designed in the quasi-protected zone (Figure 1) [47]. Therefore, it is urgent to assess groundwater pollution risk to find out whether and how the oil drilling activities influence the groundwater resource. Effective decisions must be made for the protection and management of groundwater in this area.

3. Materials and Methods

3.1. Groundwater Vulnerability Assessment

Groundwater intrinsic vulnerability assessment indicators include Depth to water (D), net Recharge (R), Aquifer medium (A), Soil medium (S), Terrain Slope (T), Impact of the vadose zone (I), and hydraulic Conductivity (C) [24,25,26,27,28,29,30,31,32,33,34,35,36,37,38,39,40,41,42,43,44,45,46,48]. Considering the rapid development of a social economy in this area, the groundwater vulnerability is highly affected by human activities. The types of land use in this area are industrial land, dry land, paddy field, residential land, and woodland. The land is irrigated by groundwater in a large area, and it is closely relevant to the quantity and quality of groundwater. Moreover, there are several rivers across the study area. According to the field survey, the cultivated land near the rivers is irrigated by the surface water. The distance to the river should not be neglected. Therefore, land-use type (L) and distance to rivers (DR) are selected as the supplemental indices of the intrinsic vulnerability assessment system. The unconfined aquifer is much easier to be polluted by the activities of oil drilling. The Quaternary unconfined aquifer is considered to be the target aquifer in this study. According to the conditions mentioned above, the DASTIC-LDR evaluation system was developed to assess the groundwater vulnerability in this area. The index rating applied for parameter quantification is listed in Table 1.
Based on the analysis above, the groundwater vulnerability can be calculated by the Equation (1):
DI = Dw × Dr + Rw × Rr + Aw × Ar + Sw × Sr + Tw × Tr + Iw × Ir + Cw × Cr + Lw × Lr + DRw × DRr
where DI is the groundwater vulnerability index; r is the rating value of factors; w is the weight.
Groundwater vulnerability was divided into five grades: low, relatively low, medium, relatively high, and high. The range of each grade for groundwater vulnerability is shown in Table 2. The higher the DASTIC-LDR indicator is, the greater the groundwater vulnerability is.
The Principal Component Analysis (PCA) method was applied to determine the weight of each evaluation index [31]. As a multivariate statistical method, PCA is applied to produce a set of values of linear uncorrelated variables. The principal components reserve as much as possible of the important alteration variation present in the data set [49].
Y = AX
where Y is the principal components; X is the evaluating indicator; and A is the transformation matrix.
The weight coefficient and the normalized weight were calculated by SPSS 16.0. The results for the indices are shown in Table 3.

3.2. Groundwater Pollution Source Hazard Evaluation

The result of groundwater pollution source hazard reveals the degree of damage caused by pollution sources to groundwater [50]. During the oilfield drilling process, oily sewage such as ground crude oil, drilling wastewater, and waste mud penetrates into the groundwater through the aeration zone, which are potential pollutants. Benzene, toluene, ethylbenzene, and xylene are the most common components of groundwater petroleum pollutants [51,52]. Therefore, the benzene series was selected as the simulation indicator, and its transport range in groundwater was forecasted in certain scenarios. According to the government standard for groundwater quality in China (GB/T 14848-2017), the concentration of benzene series in groundwater should not exceed 0.05 mg/L in the producing state of the oilfield. Groundwater reaches the III class of drinking water standard, which can be regarded as no risk. When the concentration of benzene series exceeds 0.3 mg/L, it would seriously contaminate groundwater and would severely exceed the standard range [53]. The concentration of petroleum pollutants was set to four pollution level ranges: none (0, 0.05), mild (0.05, 0.15), medium (0.15, 0.30), and severe (0.30, ). The grade of groundwater pollution source hazard was divided into four classes accordingly: no, mild, medium, and high. In order to analyze the transport characteristics of pollutants in the porous medium, groundwater numerical simulation was built by applying the finite difference method (FDM). The software Groundwater Modelling System (GMS, Version 10.4) was chosen to find out the contamination transfer law, such as the range and the concentration of pollutants in a certain time. GMS has become one of the most widely used groundwater simulation software in the world with a good user interface, powerful pre-processing and post-processing functions, and excellent 3D visual effects [54,55]. The modules MODFLOW and MT3DMS are applied separately to simulate groundwater flow and the influence range of benzene series when pollutants are released [56]. The effects of drilling on the unconfined water near each water source well are forecasted by simulation.

3.3. Groundwater Function Assessment

The selection of assessment indices for groundwater function is according to the main influence facts in the ecological and environment of groundwater as well as the economic and social development of water [57]. The oilfield drilling and centralized water supply wells for human habitation and groundwater function value were assessed by groundwater quality and groundwater storage. The calculation formula is as follow:
V = G Q G S
where V is groundwater function value; GQ is groundwater quality; and GS is groundwater storage. The grade of groundwater function value was divided into four classes: no, mild, medium, and high. The high value means the area contains abundant storage and high groundwater quality, so it has greater sensitivity and susceptibility of groundwater to pollution [57,58,59].

3.4. Comprehensive Assessment of Groundwater Pollution Risk

The groundwater contamination risk is not only related to the groundwater vulnerability, but also closely connected to the groundwater pollution source hazard and groundwater function value. The three aspects mentioned above were appraised separately by applying the geographic information system (GIS). The groundwater vulnerability assessment map, groundwater pollution source risk assessment map, and groundwater value function assessment map were counted by software ArcGIS (Version. 10.2). The attributes of the three layers were extracted for statistics. The weights of groundwater contamination risk were calculated by the principal component factor analysis (PCA) function using the software SPSS (Version. 16.0). Finally, the groundwater contamination risk level map was drawn by software ArcGIS. The flow chart of the study is shown in Figure 2.

4. Results and Discussion

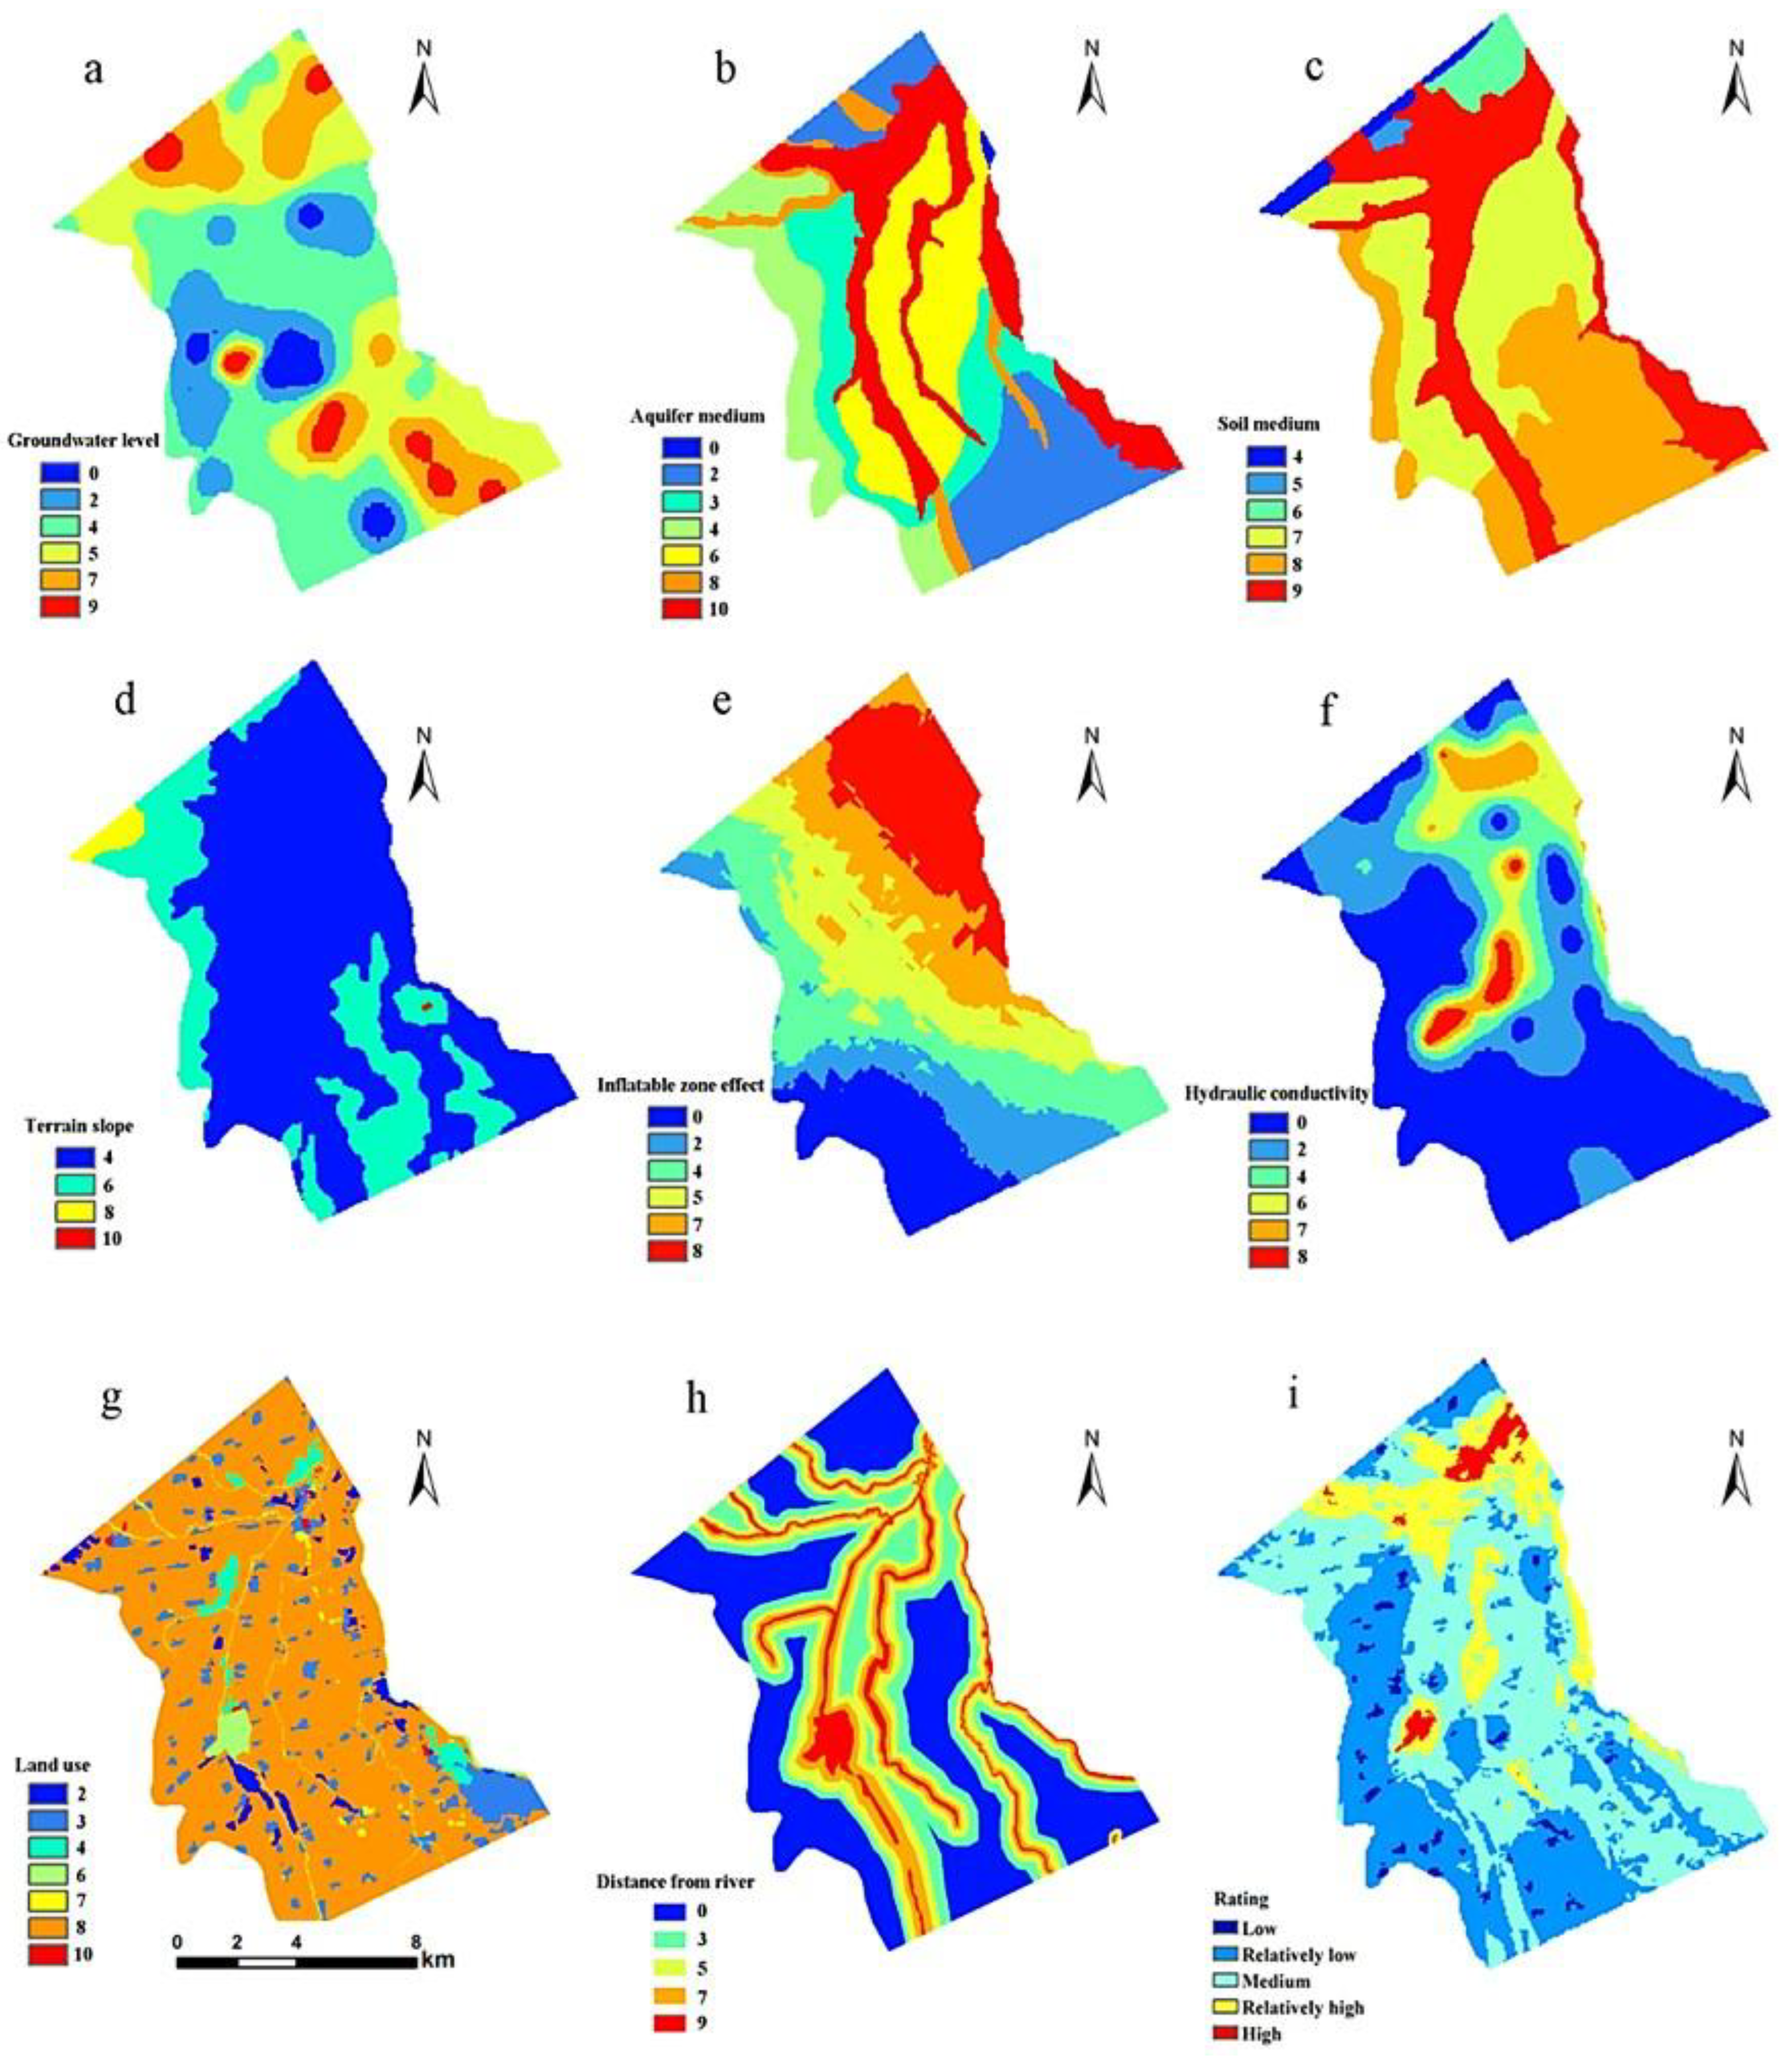
4.1. Groundwater Vulnerability Assessment

The groundwater vulnerability assessment indices were calculated with Equation (2) by applying SPSS (Version 16.0), and the assessment results were calculated by Equation (1). The raster maps of each indicator for the DASTIC-LDR model were mapped separately by the software ArcGIS (Version 10.2) (Figure 3a–h). The value of DI was between 2.5 and 5.0. It was divided into five grades according to the equal interval method. The weight of each evaluation indicator was between 0.079 and 0.173, which showed a clear difference to vulnerability. The aeration zone exhibited the highest impaction weight, followed by depth to water, hydraulic conductivity, and distance to rivers. High groundwater vulnerability was observed in areas where the groundwater was shallow [60]. In comparison, aquifer medium, soil medium, terrain slope, and land use forms exerted less of an impact on the vulnerability distribution.
According to the results of the groundwater vulnerability assessment shown in Figure 3i, the area with relatively low vulnerability accounted for 25.57% of the total area. It is mainly distributed in the U-shaped valleys and first terraces, where the lithology is loess and sandy loam. The medium and relatively high vulnerability areas accounted for 69.85% and are concentrated in the floodplain and first terraces. Mainly, the lithology is sand gravel alluvium and sub-sand, the permeability coefficient is high, and the aquifer is shallow. In addition, human activity is an important factor in the expansion and intensification of groundwater vulnerability [57]. Human activities are relatively intense with industrial activities and extensive pollution emissions. The comprehensive results between groundwater quality analysis and groundwater vulnerability assessment show that the valley area and first terrace are the place with poor groundwater quality and high groundwater vulnerability. The U-shaped valleys show good water quality and where the low groundwater vulnerability distributes [60].

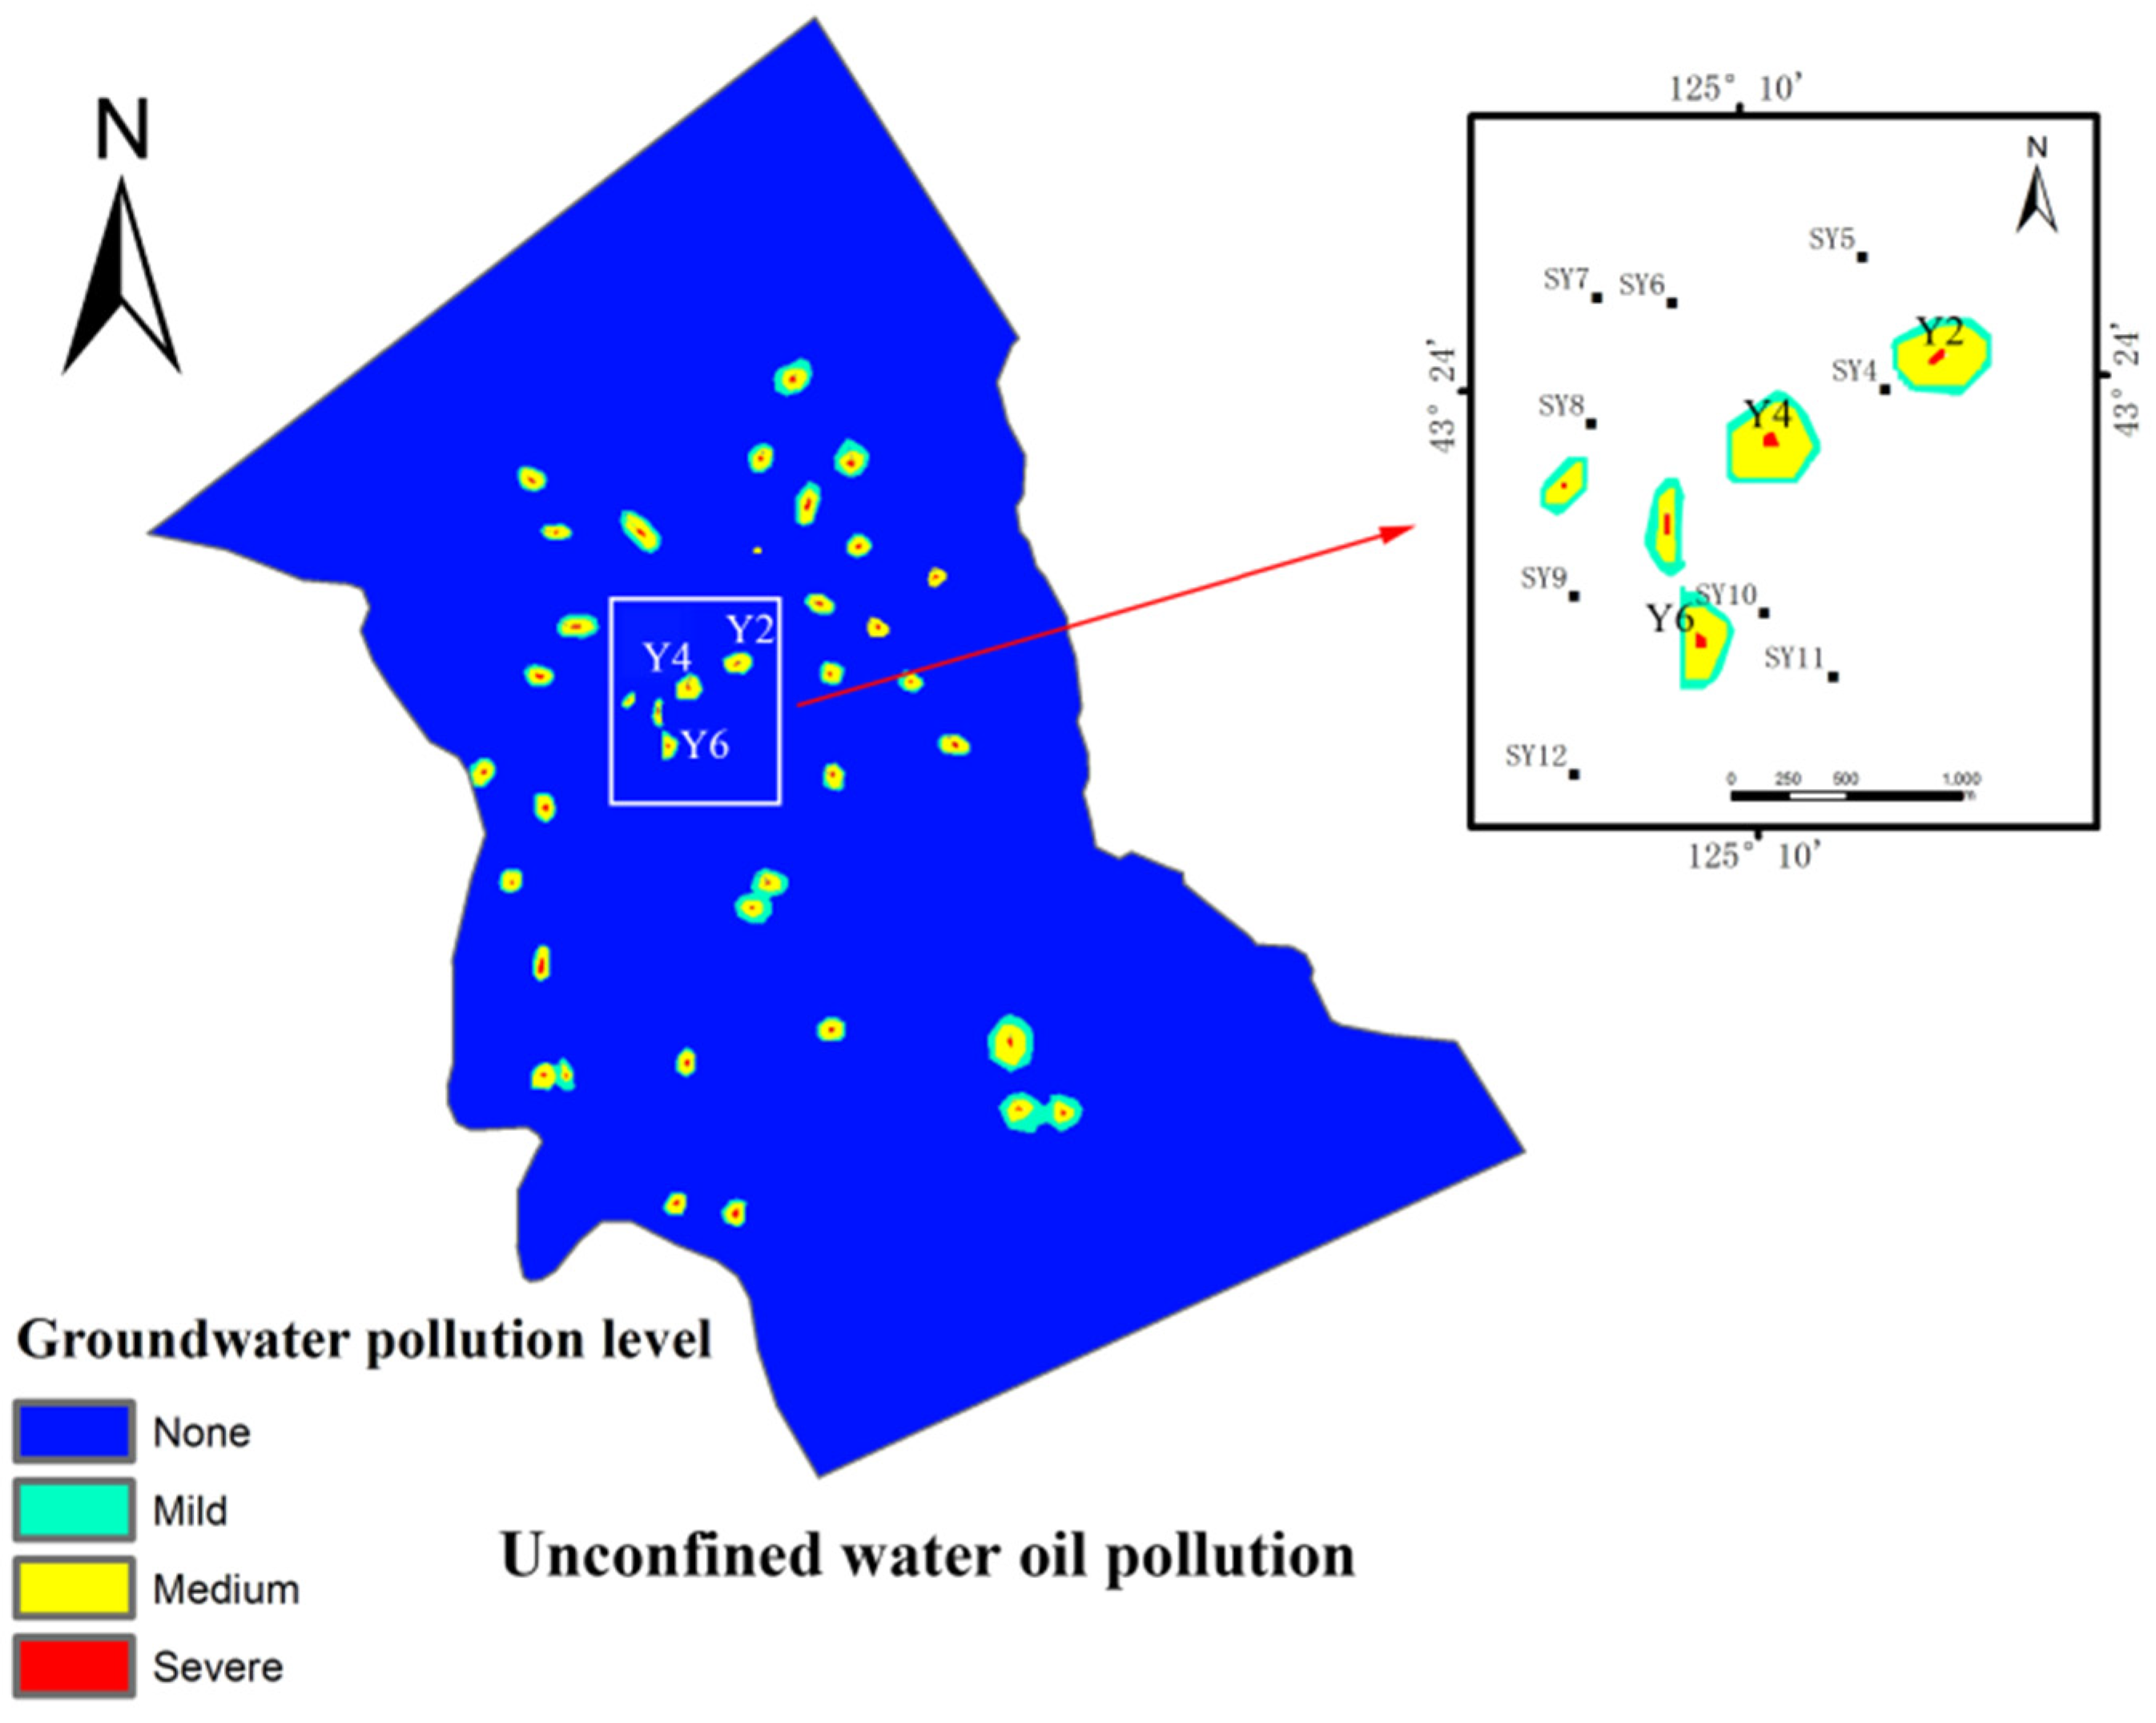
4.2. Groundwater Pollution Source Hazard Evaluation

The hydrogeological conceptual model was established based on hydrogeological conditions (Figure 4a). The seepage movement is basically in accordance with the Darcy’s law. The groundwater flow is limited by the accuracy of the data and is treated as a planar two-dimensional flow. The elements change over time and are generalized as unsteady.
The western boundary of the study area is the Songliao watershed, which can be generalized to the impervious boundary. The eastern boundary is the Yitong River, which can be generalized to river boundaries as the recharge of the unconfined aquifer. The northern and southern borders are generalized to the Neumann boundary. According to the hydrogeological conceptual model, the groundwater flow in the study area is generalized as a pore unconfined water in loose rocks. The hydrogeological parameters, such as infiltration coefficient of precipitation, phreatic evaporation coefficient, irrigation leakage coefficient, and specific yield were calculated. They were input to the model as the initial parameters. The groundwater recharge such as precipitation infiltration, lateral inflow, river seepage, and irrigation infiltration were all calculated and input to the model, so was the groundwater discharge such as evaporation, lateral outflow, and artificial mining.
After the model had been calibrated, the observed water level and the simulated one fit well. The final value of parameters was confirmed, which is shown in Table 4. The scatter plot in Figure 4c shows good compatibility between observed and calculated groundwater levels by the model.
The mobility of pollutants was assessed based on the migration characteristics in groundwater [56]. The impact of petroleum pollutants on groundwater is predicted by applying the groundwater solute transport model of 20 years to the leakage of polluted water from drilling wells in the process of oil mining.
According to relevant statistics, 359 oil wells already existed in the Yitong area. Assorted indicators of oil pollution or the oil content, will reach 2–10% after 20 years [47]. Therefore, the concentration of the benzene series in the model is set to be 85.0 mg/l. The maximum amount of return water outside the oil pipe is 20 m3/d for 15 d.
The forecasted results are shown in Figure 5. The total range of the benzene series on the unconfined aquifer in 20 years is 3.572 km2, and the total area that exceeds the standard range is 0.350 km2. The maximum migration distance of the benzene series for single oil drilling is 0.824 km on the phreatic water. The influence range of the benzene series in oil drilling wells (Y2, Y4, and Y6) is relatively close to the water source wells (SY4-SY12). The pollution risk to the water source well (SY4) is high, with the nearest distance of 75 m. The map suggests that the areas where they have oil drilling wells were the most harmful potential contamination sources [39].

4.3. Groundwater Function Value Assessment

With the sensitivity analysis of groundwater function value assessment in the study area (Figure 6), which was calculated by Equation (3), the relatively low function value areas accounted for 40.71% of the total area. It is mainly distributed in the northeast and southwest, with sparsely populated areas, dispersed water supply, and relatively good groundwater quality. The medium function value accounted for 18.88% and is mainly distributed in the north and south, with small population density, scattered water supply, and a poor groundwater utilization rate. The rating of relatively high and high includes 40.41%. They are mainly distributed in the central and western areas, due to densely populated villages and large population density. There are groundwater sources for concentric supply, and the groundwater quality is medium. As such, there is medium or low groundwater quality in more populated areas where the groundwater function is high.

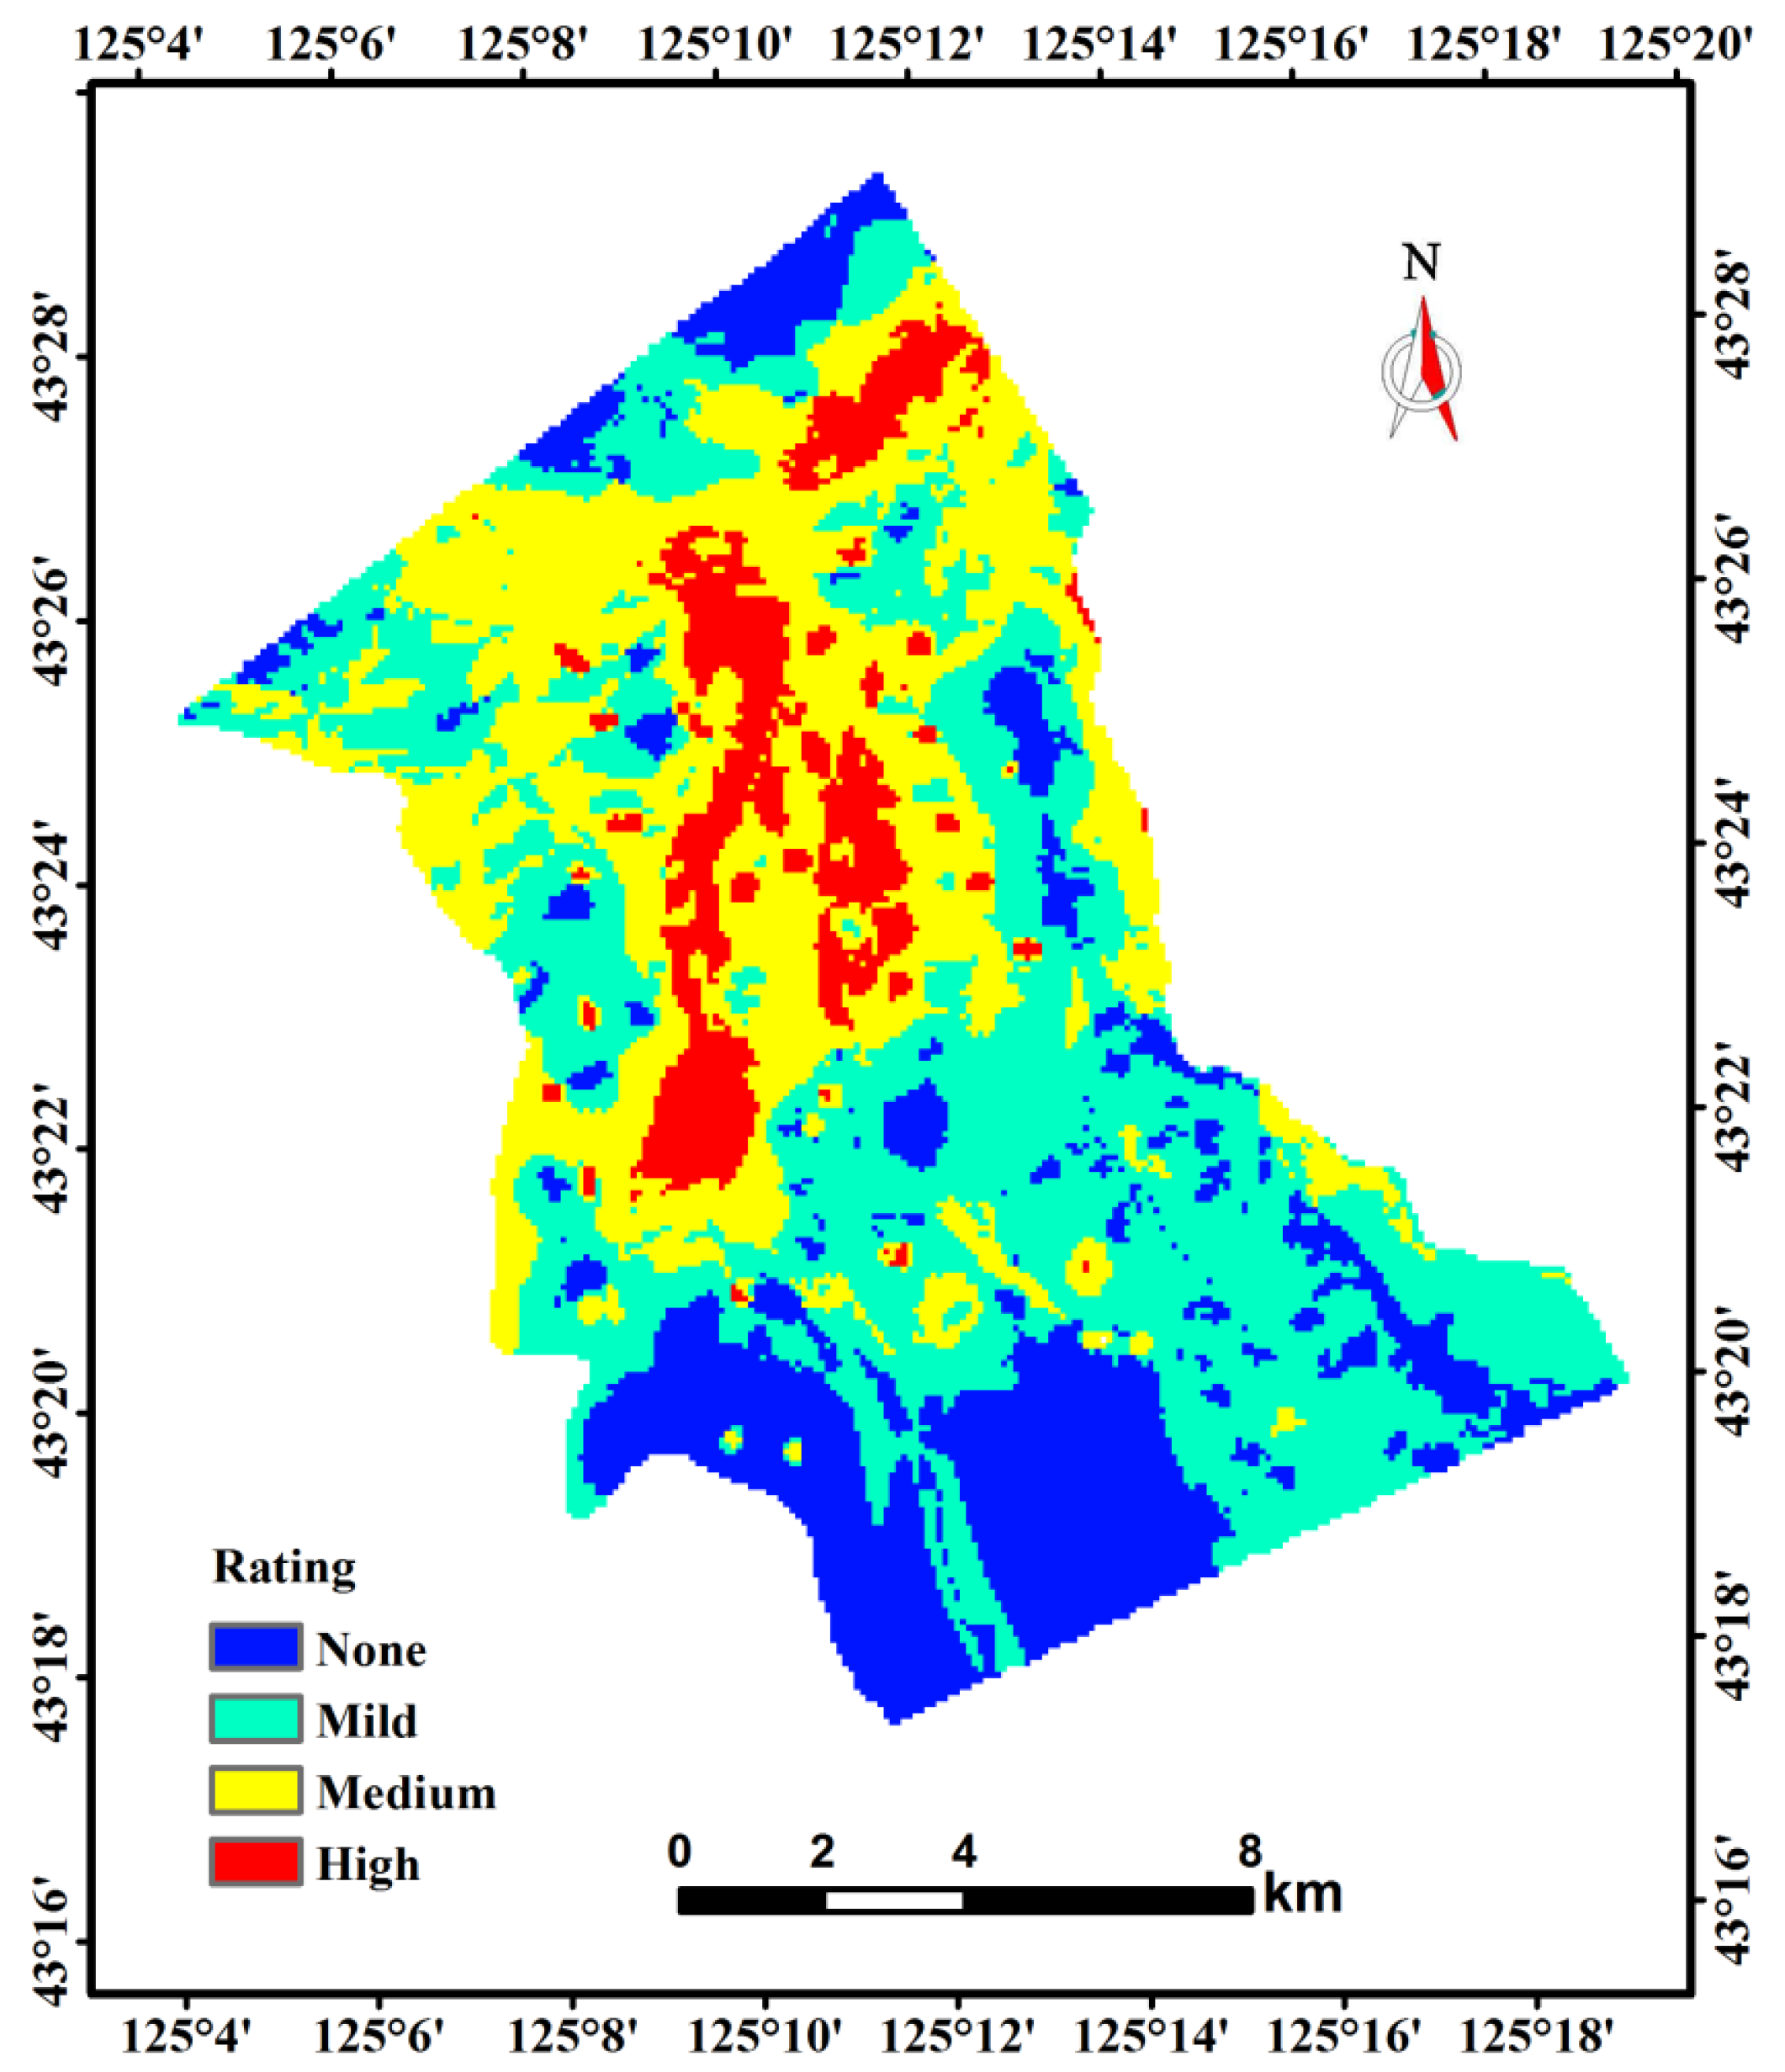
4.4. Comprehensive Assessment of Groundwater Pollution Risk

The groundwater pollution risk assessment rating mapping can be obtained using the Raster Calculator of the ArcGIS by further analysis of the range values of the risk assessment. The range [1.8, 3.8] was divided into four classes according to the equal interval method: none, mild, medium, and high (Figure 7). First, the results of groundwater pollution risk assessment show that the groundwater in the region with no risk and mild risk include the area of about 136.35 km2, which is 69.04% of the total area. Because there is no water source well in these areas, the risk of groundwater pollution in U-shaped valleys and first terraces is low. The groundwater vulnerability in these areas is also low or medium. Furthermore, the medium pollution risk area is about 41.55 km2, which includes 21.04% since it is mainly located around the first terrace and the oil drilling site. The vulnerability of groundwater and the hazard from groundwater pollution sources is high. Lastly the high-risk area is about 19.60 km2, which includes 9.92%. It is mainly distributed in the floodplain and oil drilling site, with high groundwater vulnerability and a high hazard from groundwater pollution sources.

5. Conclusions

In this study, we developed a comprehensive groundwater pollution risk assessment method for areas with dispersive pollutants such as the oilfield drilling sites. The results of groundwater pollution risk assessment show that groundwater at no risk and mild risk accounted for 69.04% of the total area and are mainly distributed in U-shaped valleys and first terraces. Medium risk accounted for 21.04% and is mainly distributed around the first terrace and the oil drilling sites. High risk accounted for 9.92% and is mainly distributed in the floodplain and oil drilling sites. In high risk areas, the water manager should take relevant prevention and control measures, carry out groundwater protection and purification work according to local conditions, and strengthen groundwater quality monitoring. When the water source is not polluted by petroleum pollutants in oil drilling sites, long-term monitoring is still needed and relevant treatment measures should be taken.
The study proposes a new method to assess groundwater pollution risk which combines groundwater vulnerability, pollution source hazard, and groundwater function value. This integrated groundwater contamination risk assessment method is suited for comparative assessment of a large number of dispersive pollution sources at a regional scale. The results above provide a good approach for assessing groundwater risk accurately. The mapping can be applied for the effective protection and sustainable supply of groundwater.

Author Contributions

Conceptualization, X.L. and Z.F.; methodology, Z.F.; software, Z.L.; validation, Z.L., S.Z. and Y.M.; formal analysis, H.G.; investigation, X.L.; resources, Z.F.; data curation, Z.L.; writing—original draft preparation, X.L.; writing—review and editing, Y.M.; visualization, S.Z.; supervision, Z.F.; project administration, Z.F.; funding acquisition, Z.F. All authors have read and agreed to the published version of the manuscript.

Funding

This research was funded by National Key Research and development program of China (No. 2020YFC1808300). And the APC was funded by National Key Research and development program of China (No. 2020YFC1808300).

Institutional Review Board Statement

Not applicable.

Informed Consent Statement

Not applicable.

Data Availability Statement

Not applicable.

Acknowledgments

We would like to thank the anonymous reviewers and the editor.

Conflicts of Interest

The authors declare no conflict of interests.

References

  1. Wang, W.; Chen, D.; Ma, Z.; Chen, P. Forecast and suitability assessment of monitored natural attenuation (MNA) of petroleum pollutant in shallow groundwater. Water Sav. Irrig. 2014, 8, 29–33. [Google Scholar]
  2. Miao, Y. The way, harm and preventive measures of groundwater pollution caused by oil exploitation. Water Resour. Dev. Res. 2016, 5, 32–33. [Google Scholar]
  3. Chang, K. The Effect of Iron Catalyst on Oxidation of Oil Contaminated Soil. Master’s Thesis, Xi’an University of Architecture and Technology, Xi’an, China, 2013. [Google Scholar]
  4. An, Y. Study on Risk Assessment and Early Warning of Groundwater Pollution in the Ordos Basin. Master’s Thesis, Jilin University, Changchun, China, 2016. [Google Scholar]
  5. Sun, X. A brief analysis of the management and protection of groundwater resources. Priv. Technol. 2014, 8, 248. [Google Scholar]
  6. Kaliraj, S.; Chandrasekar, N.; Peter, T.S.; Selvakumar, S.; Magesh, N.S. Mapping of coastal aquifer vulnerable zone in the south west coast of Kanyakumari, South India, using GIS-based DRASTIC model. Environ. Monit. Assess. 2015, 187, 4073. [Google Scholar] [CrossRef] [PubMed]
  7. Khan, R.; Jhariya, D.C. Assessment of Groundwater Pollution Vulnerability Using GIS Based Modified DRASTIC Model in Raipur City, Chhattisgarh. J. Geol. Soc. India 2019, 93, 293–304. [Google Scholar] [CrossRef]
  8. Medici, G.; Engdahl, N.B.; Langman, J.B. A Basin-Scale Groundwater Flow Model of the Columbia Plateau Regional Aquifer System in the Palouse (USA): Insights for Aquifer Vulnerability Assessment. Int. J. Environ. Res. 2021, 15, 299–312. [Google Scholar] [CrossRef]
  9. Wang, L.; Liu, T.; Hao, W.; Song, Y.; Liu, Y. Comparison of groundwater vulnerability assessment methods. Inn. Mong. Water Resour. 2019, 7, 15–17. [Google Scholar]
  10. Ouedraogo, I.; Girard, A.; Vanclooster, M.; Jonard, F. Modelling the Temporal Dynamics of Groundwater Pollution Risks on the African Scale. Water 2020, 12, 1406. [Google Scholar] [CrossRef]
  11. National Research Council. Groundwater Vulnerability Assessment, Contaminant Potential under Conditions of Uncertainity; National Academy Press: Washington, DC, USA, 1993. [Google Scholar]
  12. Tesoriero, A.J.; Inkpen, E.L.; Voss, F.D. Assessing groundwater vulnerability using logistic regression. In Proceedings of the Source Water Assessment and Protection 98 Conference, Dallas, TX, USA, 28–30 April 1998; pp. 157–165. [Google Scholar]
  13. Harbaugh, A.W.; Banta, E.R.; Hill, M.C.; Mcdonald, M.G. MODFLOW-2000, The US Geological Survey Modular Ground-Water Model-Users Guide to Modularization Concepts and the Groundwater Flow Process; US Geological Survey Open—File Report 00-92; US Geological Survey: Reston, VA, USA, 2000; p. 121.
  14. Dixon, B. Prediction of groundwater vulnerability using an integrated GIS-based neuro-fuzzy techniques. J. Hydrol. 2004, 4, 17–38. [Google Scholar]
  15. Neshat, A.; Pradhan, B.; Pirasteh, S.; Shafri, H.Z.M. Estimating groundwater vulnerability to pollution using a modified DRASTIC model in the Kerman agricultural area, Iran. Environ. Earth Sci. 2014, 71, 3119–3131. [Google Scholar] [CrossRef]
  16. Sinha, M.K.; Verma, M.K.; Ahmad, I.; Baier, K.; Jha, R.; Azzam, R. Assessment of groundwater vulnerability using modified DRASTIC model in Kharun Basin, Chhattisgarh, India. Arab. J. Geosci. 2015, 9, 98. [Google Scholar] [CrossRef]
  17. Noori, R.; Ghahremanzadeh, H.; Kløve, B.; Adamowski, J.; Baghvand, A. Modified-DRASTIC, modified-SINTACS and SI methods for groundwater vulnerability assessment in the southern Tehran aquifer. J. Environ. Sci. Health 2019, 54, 89–100. [Google Scholar] [CrossRef] [PubMed]
  18. Evans, B.M.; Mayers, W.L. A GIS-based approach to evaluating regional groundwater pollution potential with DRASTIC. J. Soil Water Conserv. 1990, 45, 242–245. [Google Scholar]
  19. Fritch, T.G.; McKnight, C.L.; Yelderman, J.J.C.; Arnold, J.G. An aquifer vulnerability assessment of the paluxy aquifer, central Texas, USA, using GIS and a modified DRASTIC approach. Environ. Manag. 2000, 25, 337–345. [Google Scholar] [CrossRef] [PubMed]
  20. Knox, R.C.; Sabatini, D.A.; Canter, L.W. Subsurface Transport and Fate Processes; Lewis Publishers: Boca Raton, FL, USA, 1993. [Google Scholar]
  21. Secunda, S.; Collin, M.; Melloul, A.J. Groundwater vulnerability assessment using a composite model combining DRASTIC with extensive land use in Israel’s Sharon region. J. Environ. Manag. 1998, 54, 39–57. [Google Scholar] [CrossRef]
  22. Aller, I.; Bennet, T.; Lehr, J.H.; Petty, R.J. A Standardized System for Evaluating Groundwater Pollution Potential Using Hydrogeologic Settings; U.S. EPA Report; U.S. Environmental Protection Agency: Washington, DC, USA, 1987.
  23. Nawafleh, A.S.M. GIS-Based Modeling of Groundwater Vulnerability and Hydrochemistry in Irbid Governorate. Ph.D. Thesis, University of Jordan, Amman, Jordan, 2007. [Google Scholar]
  24. Ewa, K.; Sebastian, Z.; Danuta, Z. Variability of Intrinsic Groundwater Vulnerability to Pollution in River Valley due to Groundwater Depth and Recharge Changes. Appl. Sci. 2019, 9, 1133. [Google Scholar]
  25. Vrba, J.; Zaporozec, A. Guidebook on Mapping Groundwater Vulnerability; International Contributions to Hydrogeology; H. Heise: Hanover, Germany, 1994. [Google Scholar]
  26. Ducci, D.; De, M.G.; Delli, P.G. Contamination risk of the Alburni Karst System (Southern Italy). Eng. Geol. 2008, 99, 109–120. [Google Scholar] [CrossRef]
  27. Yao, W. Study on Groundwater Vulnerability Based on Process Simulation. Ph.D. Thesis, Tsinghua University, Beijing, China, 2007. [Google Scholar]
  28. Li, H.; Yu, X.; Zhang, W.; Huan, Y.; Yu, J.; Zhang, Y. Risk Assessment of Groundwater Organic Pollution Using Hazard, Intrinsic Vulnerability, and Groundwater Value, Suzhou City in China. Expo. Health 2018, 10, 99–115. [Google Scholar] [CrossRef]
  29. Li, R.; Merchant, J.W. Modeling vulnerability of groundwater to pollution under future scenarios of climate change and biofuels-related land use change: A case study in North Dakota, USA. Total Environ. 2013, 447, 32–45. [Google Scholar] [CrossRef] [Green Version]
  30. Xue, Y.; Liu, R.; Xu, S. Groundwater Vulnerability Assessment and Analysis Based on LM-BP Neural Network. New Technol. New Prod. China 2016, 9, 125–126. [Google Scholar]
  31. Soraya, K.; Nozar, S.; Zargham, M. Characterization of Semnan thermal springs using principal component analysis and geochemical inverse modeling. Arab. J. Geosci. 2019, 12, 777. [Google Scholar]
  32. Nixdorf, E.; Sun, Y.; Lin, M.; Kolditz, O. Development and application of a novel method for regional assessment of groundwater contamination risk in the Songhua River Basin. Total Environ. 2017, 605, 598–609. [Google Scholar] [CrossRef] [PubMed]
  33. Baalousha, H.M. Vulnerability, probability and groundwater contamination risk. Environ. Earth Sci. 2017, 76, 383–384. [Google Scholar] [CrossRef]
  34. Khaiwal, R.; Parteek, S.; Sahil, M.; Tanbir, S.; Suman, M. Evaluation of groundwater contamination in Chandigarh: Source identification and health risk assessment. Environ. Pollut. 2019, 255, 113062. [Google Scholar]
  35. Huan, H.; Zhang, B.; Kong, H.; Li, M.; Wang, W.; Xi, B.; Wang, G. Comprehensive assessment of groundwater pollution risk based on HVF model: A case study in Jilin City of northeast China. Total Environ. 2018, 628–629, 1518–1530. [Google Scholar] [CrossRef]
  36. Kumar, S.; Thirumalaivasan, D.; Radhakrishnan, N. GIS Based Assessment of Groundwater Vulnerability Using Drastic Model. Arab. J. Sci. Eng. 2014, 39, 207–216. [Google Scholar] [CrossRef]
  37. Amharref, M.; Bouchnan, R.; Bernoussi, A.S. Extension of DRASTIC Approach for Dynamic Vulnerability Assessment in Fissured Area: Application to the Angad Aquifer (Morocco); Springer: Berlin/Heidelberg, Germany, 2015. [Google Scholar]
  38. Sun, C.; Chen, X.T.; Chen, X.J.; Zheng, D. Recent advances in groundwater contamination risk assessment. Adv. Sci. Technol. Water Resour. 2015, 35, 152–161. [Google Scholar]
  39. Wang, J.; He, J.; Chen, H. Assessment of groundwater contamination risk using hazard quantification, a modified DRASTIC model and groundwater value, Beijing Plain, China. Total Environ. 2012, 432, 216–226. [Google Scholar] [CrossRef]
  40. National Research Council. Valuing Ground Water: Economic Concepts and Approaches, 1st ed.; National Academies Press: Washington, DC, USA, 1997. [Google Scholar]
  41. Li, J. Development and Application of Petroleum Contaminated Groundwater Management Models with Consideration of Health Risk. Ph.D. Thesis, North China Electric Power University, Beijing, China, 2016. [Google Scholar]
  42. Zhang, L. Review on groundwater vulnerability and risk assessment. Hydrogeol. Eng. Geol. 2006, 6, 113–119. [Google Scholar]
  43. Jiang, J.; Dong, D.; Yang, G.; Wang, L. Risk assessment of groundwater pollution of Haidian District of Beijing. Urban Geol. 2010, 5, 14–18. [Google Scholar]
  44. Liu, H.; Zhang, B.; Fan, M.; Shi, Y.; Yang, X.; Zhang, J.; Liu, D. Karst Groundwater Value Evaluation of Feicheng Basin. Yellow River 2014, 36, 74–76. [Google Scholar]
  45. Hua, S. Optimal Management and Protective Measures of Groundwater Resources in China Based on Vulnerability Assessment under the Changing Environment. Master’s Thesis, Hunan University, Changsha, China, 2016. [Google Scholar]
  46. Lv, D.; Liu, R.; Lian, X.; Zhu, J.; Lin, B.; Chen, J. Characteristics of lithologic hydrocarbon reservoir in the second member of Shuangyang Formation in Moliqing fault depression of Yitong Basin. Glob. Geol. 2016, 35, 470–479. [Google Scholar]
  47. Liu, C.S.; Li, L.J. Groundwater Evaluation in Quasi Protected Areas of Drinking Water Sources in Yitong Area; Geological Environment Monitoring Station: Changchun, China, 2016.
  48. Abu-Bakr, H.A.-A. Groundwater vulnerability assessment in different types of aquifers. Agric. Water Manag. 2020, 240, 106275. [Google Scholar] [CrossRef]
  49. Chen, Q.; Zhao, Z.; Jiang, Q.; Zhou, J.-X.; Tian, Y.; Zeng, S.; Wang, J. Detecting subtle alteration information from ASTER data using a multifractal-based method: A case study from Wuliang Mountain, SW China. Ore Geol. Rev. 2019, 115, 103182. [Google Scholar] [CrossRef]
  50. Zhong, X.; Ma, T.; Liu, L.; Dong, Y.; Wang, Y.; Zhang, J. Method Research on the Risk Level Evaluation of Contamination Sources for Drinking Groundwater Wellhead. Saf. Environ. Eng. 2014, 21, 104–108. [Google Scholar]
  51. Chen, H.; Li, Y. Simulation on in-situ air sparging remediation of BTEX-contaminated groundwater. China Environ. Sci. 2014, 30, 46–51. [Google Scholar]
  52. Liu, J. Application of GMS software in the determination of anti-floating water level of underground rail transit project. Groundwater 2017, 39, 22–23. [Google Scholar]
  53. Fang, Z. Research of Groundwater Vulnerability in Songnen Plain. Master’s Thesis, Jilin University, Changchun, China, 2007. [Google Scholar]
  54. Qi, Q.Q.; Xu, Y.X.; Song, S.H.; Zhang, Z.Z. Application of a groundwater modelling system in groundwater environmental impact assessment of river and lake connection in western Jilin region. Appl. Ecol. Environ. Res. 2019, 17, 5059–5066. [Google Scholar] [CrossRef]
  55. Feng, Z.Y.; Zhang, H.; Dong, S.G. Numerical simulation of landfill leachate underground migration and sensitivity analysis of model parameters. J. Yangtze River Sci. Res. Inst. 2011, 28, 107–111. [Google Scholar]
  56. Noori, R.; Hooshyaripor, F.; Javadi, S.; Dodangeh, M.; Tian, F.Q.; Adamowski, J.F.; Berndtsson, R.; Baghvand, A.; Klove, B. PODMT3DMS-Tool: Proper orthogonal decomposition linked to the MT3DMS model for nitrate simulation in aquifers. Hydrogeol. J. 2020, 28, 1125–1142. [Google Scholar] [CrossRef]
  57. Zhao, Y.S.; Zhang, J.W.; Chen, Z.; Zhang, W.H. Groundwater contamination risk assessment based on intrinsic vulnerability, pollution source assessment, and groundwater function zoning. Hum. Ecol. Risk Assess. 2019, 25, 1907–1923. [Google Scholar] [CrossRef]
  58. China Geological Survey. Technical Requirements for Groundwater Vulnerability Assessment; China Geological Survey: Beijing, China, 2006.
  59. Guo, J.; Zhao, L.; Liu, N. Study on the ability of blocking pollutants in the vadose zone based on DRASTIC. Environ. Pollut. Prev. 2011, 33, 52–55. [Google Scholar]
  60. Duda, R.; Klebert, I.; Zdechlik, R. Groundwater Pollution Risk Assessment Based on Vulnerability to Pollution and Potential Impact of Land Use Forms. Pol. J. Environ. Stud. 2020, 29, 87–99. [Google Scholar] [CrossRef]
Figure 1. Location of study area and distribution of water source wells and designed oil drilling wells.
Water 14 00628 g001
Figure 2. Modeling framework of groundwater pollution risk assessment.
Water 14 00628 g002
Figure 3. Maps of groundwater vulnerability conditioning factors: (a) Groundwater level, (b) Aquifer medium, (c) Soil medium, (d) Terrain slope, (e) Inflatable zone effect, (f) Hydraulic conductivity, (g) Land use, (h) Distance to river, and (i) Groundwater vulnerability assessment rating mapping.
Water 14 00628 g003
Figure 4. (a) Boundary condition mapping of the study area. (b) Phreatic water partition mapping. (c) Scatter plot of observed and simulated groundwater level based on calibration.
Water 14 00628 g004
Figure 5. Forecasting oil pollution level mapping in 20 years of unconfined water.
Water 14 00628 g005
Figure 6. Groundwater function value assessment rating mapping.
Water 14 00628 g006
Figure 7. Groundwater pollution risk assessment rating mapping.
Water 14 00628 g007
Table 1. Groundwater vulnerability assessment index rating.
RatingDepth to Water
(m)
Aquifer MediaSoil
Medium
Terrain Slope
(%)
Impact of the Vadose ZoneHydraulic
Conductivity
(m/d)
Land Use TypesDistance to Rivers
(m)
100–1.0Fan-shaped sandy gravelRubbish0–0.01Gravel≥100Industrial land-
91.0–3.0Ice water sedimentation with kaolin soil gravelSand gravel0.01–0.05Sand gravel--0–100
8-River valley plain gravel-0.05–0.10Coarse sand80–100Dry land-
73.0–5.0Ice water stacked gravelLoess, Sand loam-Fine sand--100–300
6-Wavy platform gravelFine sand0.10~0.30Silty sand50–80Surface waters-
55.0–10Waxy platform sand, fine sandSilty sand-Sub-sand--300–500
4-SandstoneSub-clay-Muddy sub-sand30–50Paddy field-
310.0–15Medium coarse sandstone-0.30–0.50Sub-clay20–30Residential land500–800
215–20Gravel fine sandstoneMuddy clay0.50–0.80-4–20Woodland-
1≥20BedrockSilt≥0.80Bedrock<4-≥800
Table 2. The range of each grade for groundwater vulnerability.
GradeLowRelatively LowMediumRelatively HighHigh
Range2.5–3.03.0–3.53.5–4.04.0–4.54.5–5.5
Table 3. Weight of each indicator in groundwater vulnerability assessment.
Assessment IndicatorWeight CoefficientWeight Value
D0.4430.17
A0.2060.079
S0.2290.088
T0.2420.093
I0.4510.173
C0.4120.158
L0.2420.093
DR0.3810.146
Table 4. Calculated value of sources-sinks and the final hydrogeological parameters.
Sources-SinksCalculated ValueTotalParameterCalculated Value
Area (km2)-197.51Area (km2)197.51
Precipitation infiltration11.38~373.071014.61Hydraulic conductivity (m/d)4~102
Lateral inflow0~187.08196.16Specific yield0.03~0.25
River infiltration0~61.40157.42Irrigation leakage coefficient0.05~0.15
Irrigation flow0.80~12.8871.1Evaporation coefficient0~0.1
Evaporation0~−228.98−340.81Longitudinal diffusion coefficient (m2/h)3.98
Lateral outflow0~−63.40−63.4Lateral diffusion coefficient (m2/h)0.313
Artificial mining−9.13~−302.61−971.87
Publisher’s Note: MDPI stays neutral with regard to jurisdictional claims in published maps and institutional affiliations.

