Article

Role of Reef-Flat Plate on the Hydrogeology of an Atoll Island: Example of Rangiroa

by
Jean-Christophe Maréchal
1,2,*,
Vivien Hakoun
1,2 and
Pauline Corbier
3
1
Bureau de Recherches Géologiques et Minières (BRGM), Université de Montpellier, 34000 Montpellier, France
2
G-eau, UMR 183, Institut National de Recherche pour l’Agriculture, l’Alimentation et l’Environnement (INRAE), Centre de Coopération Internationale en Recherche Agronomique pour le Développement (CIRAD), Institut de Recherche pour le Développement (IRD), AgroParisTech, Institut Agro Montpellier, BRGM, 34090 Montpellier, France
3
Bureau de Recherches Géologiques et Minières (BRGM), 45100 Bastia, France
*
Author to whom correspondence should be addressed.
Water 2022, 14(17), 2695; https://doi.org/10.3390/w14172695
Submission received: 15 June 2022 / Revised: 24 August 2022 / Accepted: 24 August 2022 / Published: 30 August 2022
(This article belongs to the Special Issue Coastal Aquifers: Seawater/Saltwater Intrusion)

Abstract

:
On atoll islands, the fresh water lens (FWL) constitutes, for the island population, a very important fresh water resource for various usages. Its shape and thickness highly depend on the underground characteristics of several rock formations which constitute the underground of the island: upper Holocene sediments and lower Pleistocene limestone rocks separated by the Holocene Pleistocene Unconformity. In this study, several very simple investigation methods were applied on the Pacific atoll of Rangiroa in order to characterize the aquifer hydrodynamics and their impact on the FWL. A water budget of the aquifer was proposed, including the deep infiltration to the FWL. Pumping tests and tidal analysis demonstrated the confined character of the aquifer and its main hydrodynamic properties (storage and hydraulic conductivity). The role of the reef-flat plate on the hydrogeology of the atoll was highlighted. Its impermeable nature contributes to reduce the deep infiltration to the aquifer. It also contributes to the confined flow regime of the aquifer, inducing high and fast water level fluctuations due to tide forces, and consequently contributes to increase the thickness of the saline mixing zone. Both phenomena contribute to reduce the thickness of the FWL, which is only 2 m-thick in that atoll.

1. Introduction

In highly isolated areas such as tropical islands, groundwater resources are very important for several usages. On atolls (ring-shaped island, including a coral rim that encircles a lagoon partially or completely), thanks to precipitation across soil, a freshwater lens (FWL) forms, with less denser freshwater floating above (saline water coming from the sea). This FWL constitutes the main source of freshwater for island/atoll inhabitants [1].
The FWL is usually thin and located above a mixing zone between fresh and seawater. The shape and thickness of the FWL and the movement of the mixing zone result from density-dependent flow and transport processes [2] which are influenced by oceanic tides amongst other important factors [3]. The thickness of the FWL also fluctuates according to the succession of rainfall and drought periods [4]. Serious droughts could result in excessive water intake from the freshwater lens causing up-coning [5].
Atolls are generally characterized by the presence of two aquifer formations: the poorly consolidated Holocene sediments at the top and the Pleistocene limestone reef formations at the bottom separated by the Thurber discontinuity or HPU (Holocene Pleistocene Unconformity). The latter is generally located between 15 and 25 m depth below sea level [6].
Pleistocene reef formations have undergone karstification due to eustatic variations. Coral growth resumed with the rise of sea level during the Holocene with the maximum development dated around 8000 years ago [7]. The structure and geometry of these rock aquifers are very important for the dynamics of the FWL and the associated mixing zone. This is also the case for the reef-flat plate, a semi-permeable reef rock that forms within the Holocene aquifer. Reef-flat plates can partially confine the Holocene aquifer, influencing groundwater occurrence and flow [8].
In this paper, we intended to characterize the underground properties of an atoll aquifer in order to propose a hydrogeological conceptual model and define the main processes which guide the size and shape of the FWL.

2. Case Study Description

With an area of 1446 km2 and a lagoon containing nearly 30 km3 of water, Rangiroa Atoll is the second largest atoll in the world after Kwajalein in the Marshall Islands (Figure 1). It is characterized by the presence of two passes located on either side of the Avatoru motu, by an average depth of about 20 m, and a maximum depth of 38 m [9]. Rangiroa Atoll is composed of more than 400 motus that represent a land area of about 170 km2. The widest motus (300–650 m) are located in the northern and northwestern parts of the atoll.
On this atoll, the establishment of coral reefs would have begun at the beginning of the Tertiary era, around 60 Ma. Between 1 and 2 Ma, the atoll would also have undergone a 3 to 4 m rise in connection with the lithospheric flexure generated by the emplacement of Tahiti and Moorea. The recent evolution of Rangiroa atoll has not been studied specifically, but academic work [10] has made it possible to propose an evolution model for the Takapoto atoll (Figure 2), 275 km away, which can be presented as a reference. This model focuses in particular on the consequences of sea level rise between 3000 and 2000 years before present (BP). The dismantling of corals and their cementation between 2000 and 1200 BP when the level has dropped is at the origin of a layer called “conglomerates” on which the motu could develop. In Polynesia, this reef-flat plate is called “daddy’s layer”.
In Rangiroa, this layer of lower porosity and hydraulic conductivity than the rest of the aquifer is crossed by many wells. It is generally reached at depths ranging from 1 to 2.5 m below the ground and its thickness varies from a few tens of centimeters to more than 1.5 m. Several testimonies indicate that wells must be dug through this level to access to the fresh water lense.
As previously indicated, it is on the upper horizon of this conglomeratic layer that motus have been formed by the accumulation of sand, gravel, pebbles, and blocks torn from the outer coral fringe by the strongest swells [9]. On the ocean side, the morphology of the atoll is characterized by the presence of a dune that can reach several meters high, made up of more or less coarse coral sand.

3. Materials and Methods

3.1. Soil Water Budget

Rangiroa atoll is equipped with one meteorological station, located at the airport, in operation since 1 September 1951, but the potential evapotranspiration (PET, Monteith’s method) has only been calculated between 17 October 1971 and 4 February 1988. Over the period 1972–1987, the average annual rainfall P was 1778 mm/year and the potential evapotranspiration PET was 1807 mm/year.
The method for evaluating the soil water budget consists of computing the various components of the water cycle (effective rainfall Peff and actual evapotranspiration AET) in solving the classical water budget equation. This method simply treats the soil as a reservoir in which water is immediately available for evapotranspiration and only generates effective rainfall when the reservoir is filled (water content S > Smax). It can be summarized by the following algorithm, simplified from ref. [11]:
  • At time step k, if precipitation P < potential evapotranspiration PET, the difference (PETP) is taken from the water stock S of the soil, until it is empty if necessary:
    -
    Sk = max (0; Sk-1 + PkPETk)
    -
    AETk = min (PETk; Sk-1 + Pk)
    -
    Peffk = 0
  • If P > PET, the difference PPET first fills the water stock S of the soil. When S reaches Smax, the surplus generates effective rainfall Peff:
    -
    Sk = min (Smax; Sk-1 + PkPETk)
    -
    AETk = PETk
    -
    Peffk = max (0; Sk + PkPETkSmax)
Computations were performed using the ESPERE code [12]. This simple model allows computing both Peff and AET.

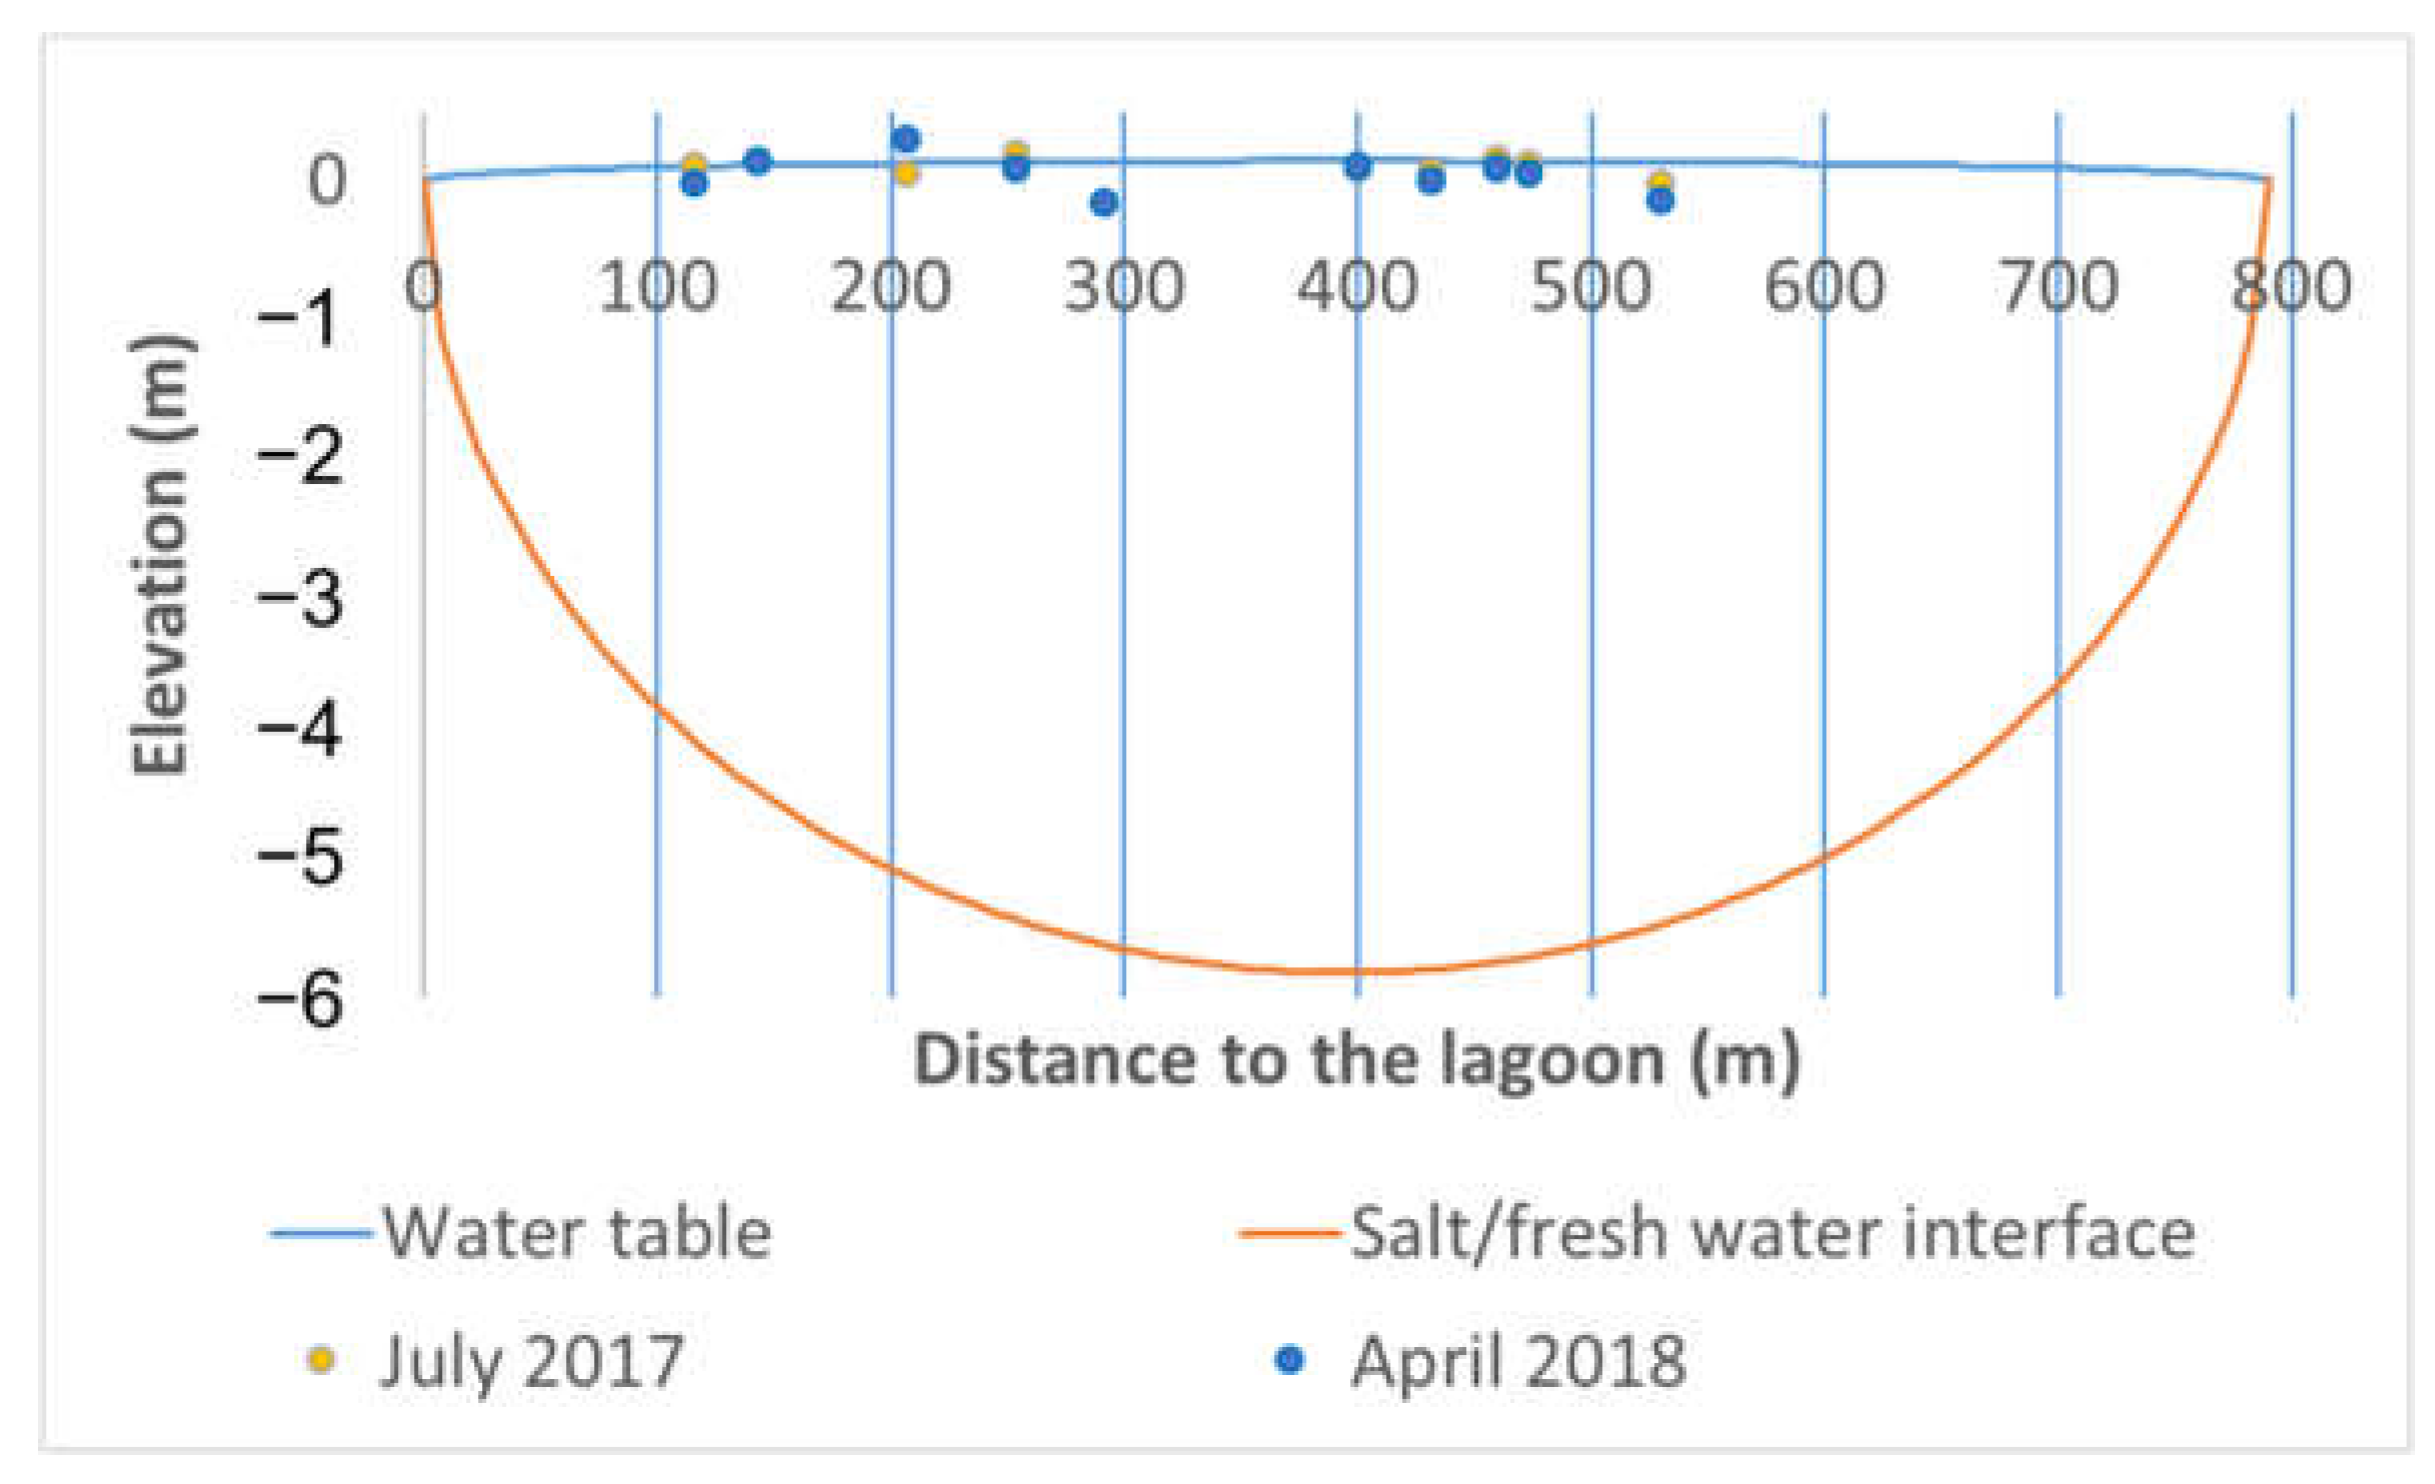
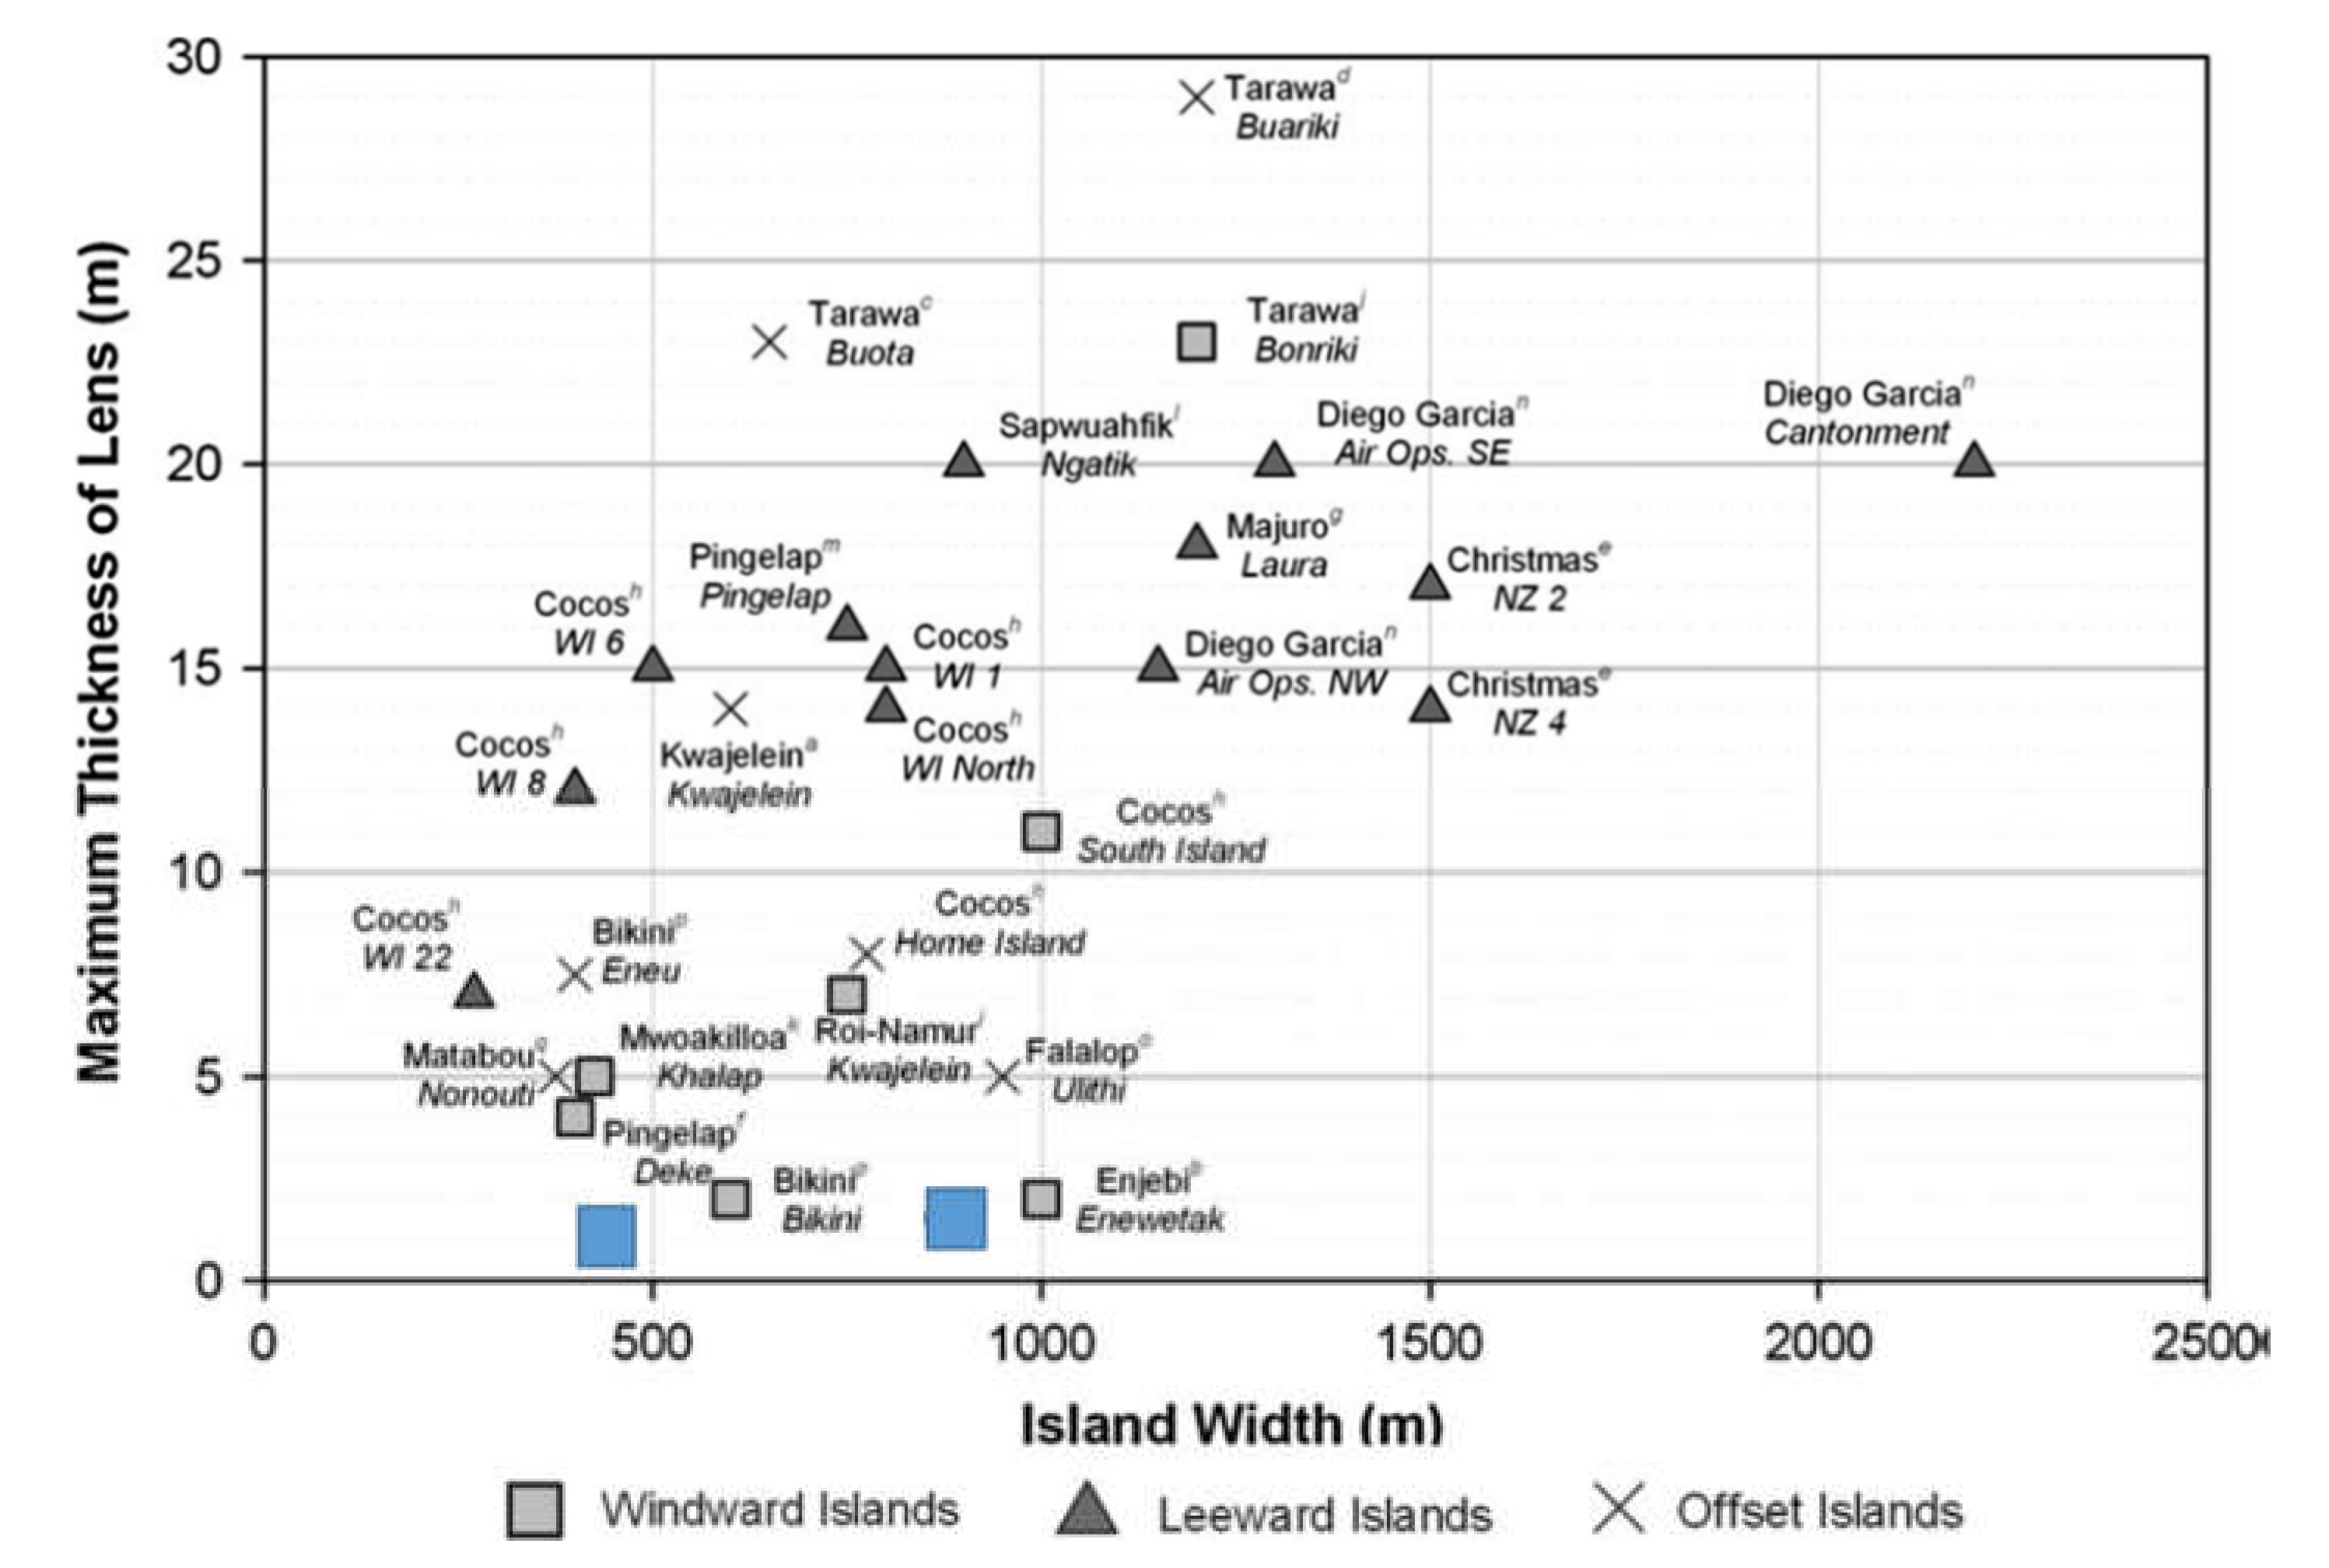
3.2. Freshwater Lense Modeling for Natural Recharge Estimate

Henry’s analytical solution [13] makes it possible to calculate the altitude (h) of the piezometric surface of the aquifer of an atoll at a distance x from the shoreline as a function of the natural recharge (R) and hydraulic conductivity (K) of the aquifer. The result depends on the width L of the atoll (distance between lagoon and ocean) and β = (ρseawater − ρfreshwater)/ρfreshwater.
h x 2 = β R x K 1 + β L x
A simple modification of this relationship makes it possible to establish a relationship between hydraulic conductivity K and recharge R (hereinafter referred to as modified Henry’s solution):
R = h x 2 1 + β K β x L x  
This relationship, therefore, makes it possible to estimate the natural recharge based on the piezometric level and the hydraulic conductivity of the aquifer at a given observation point.

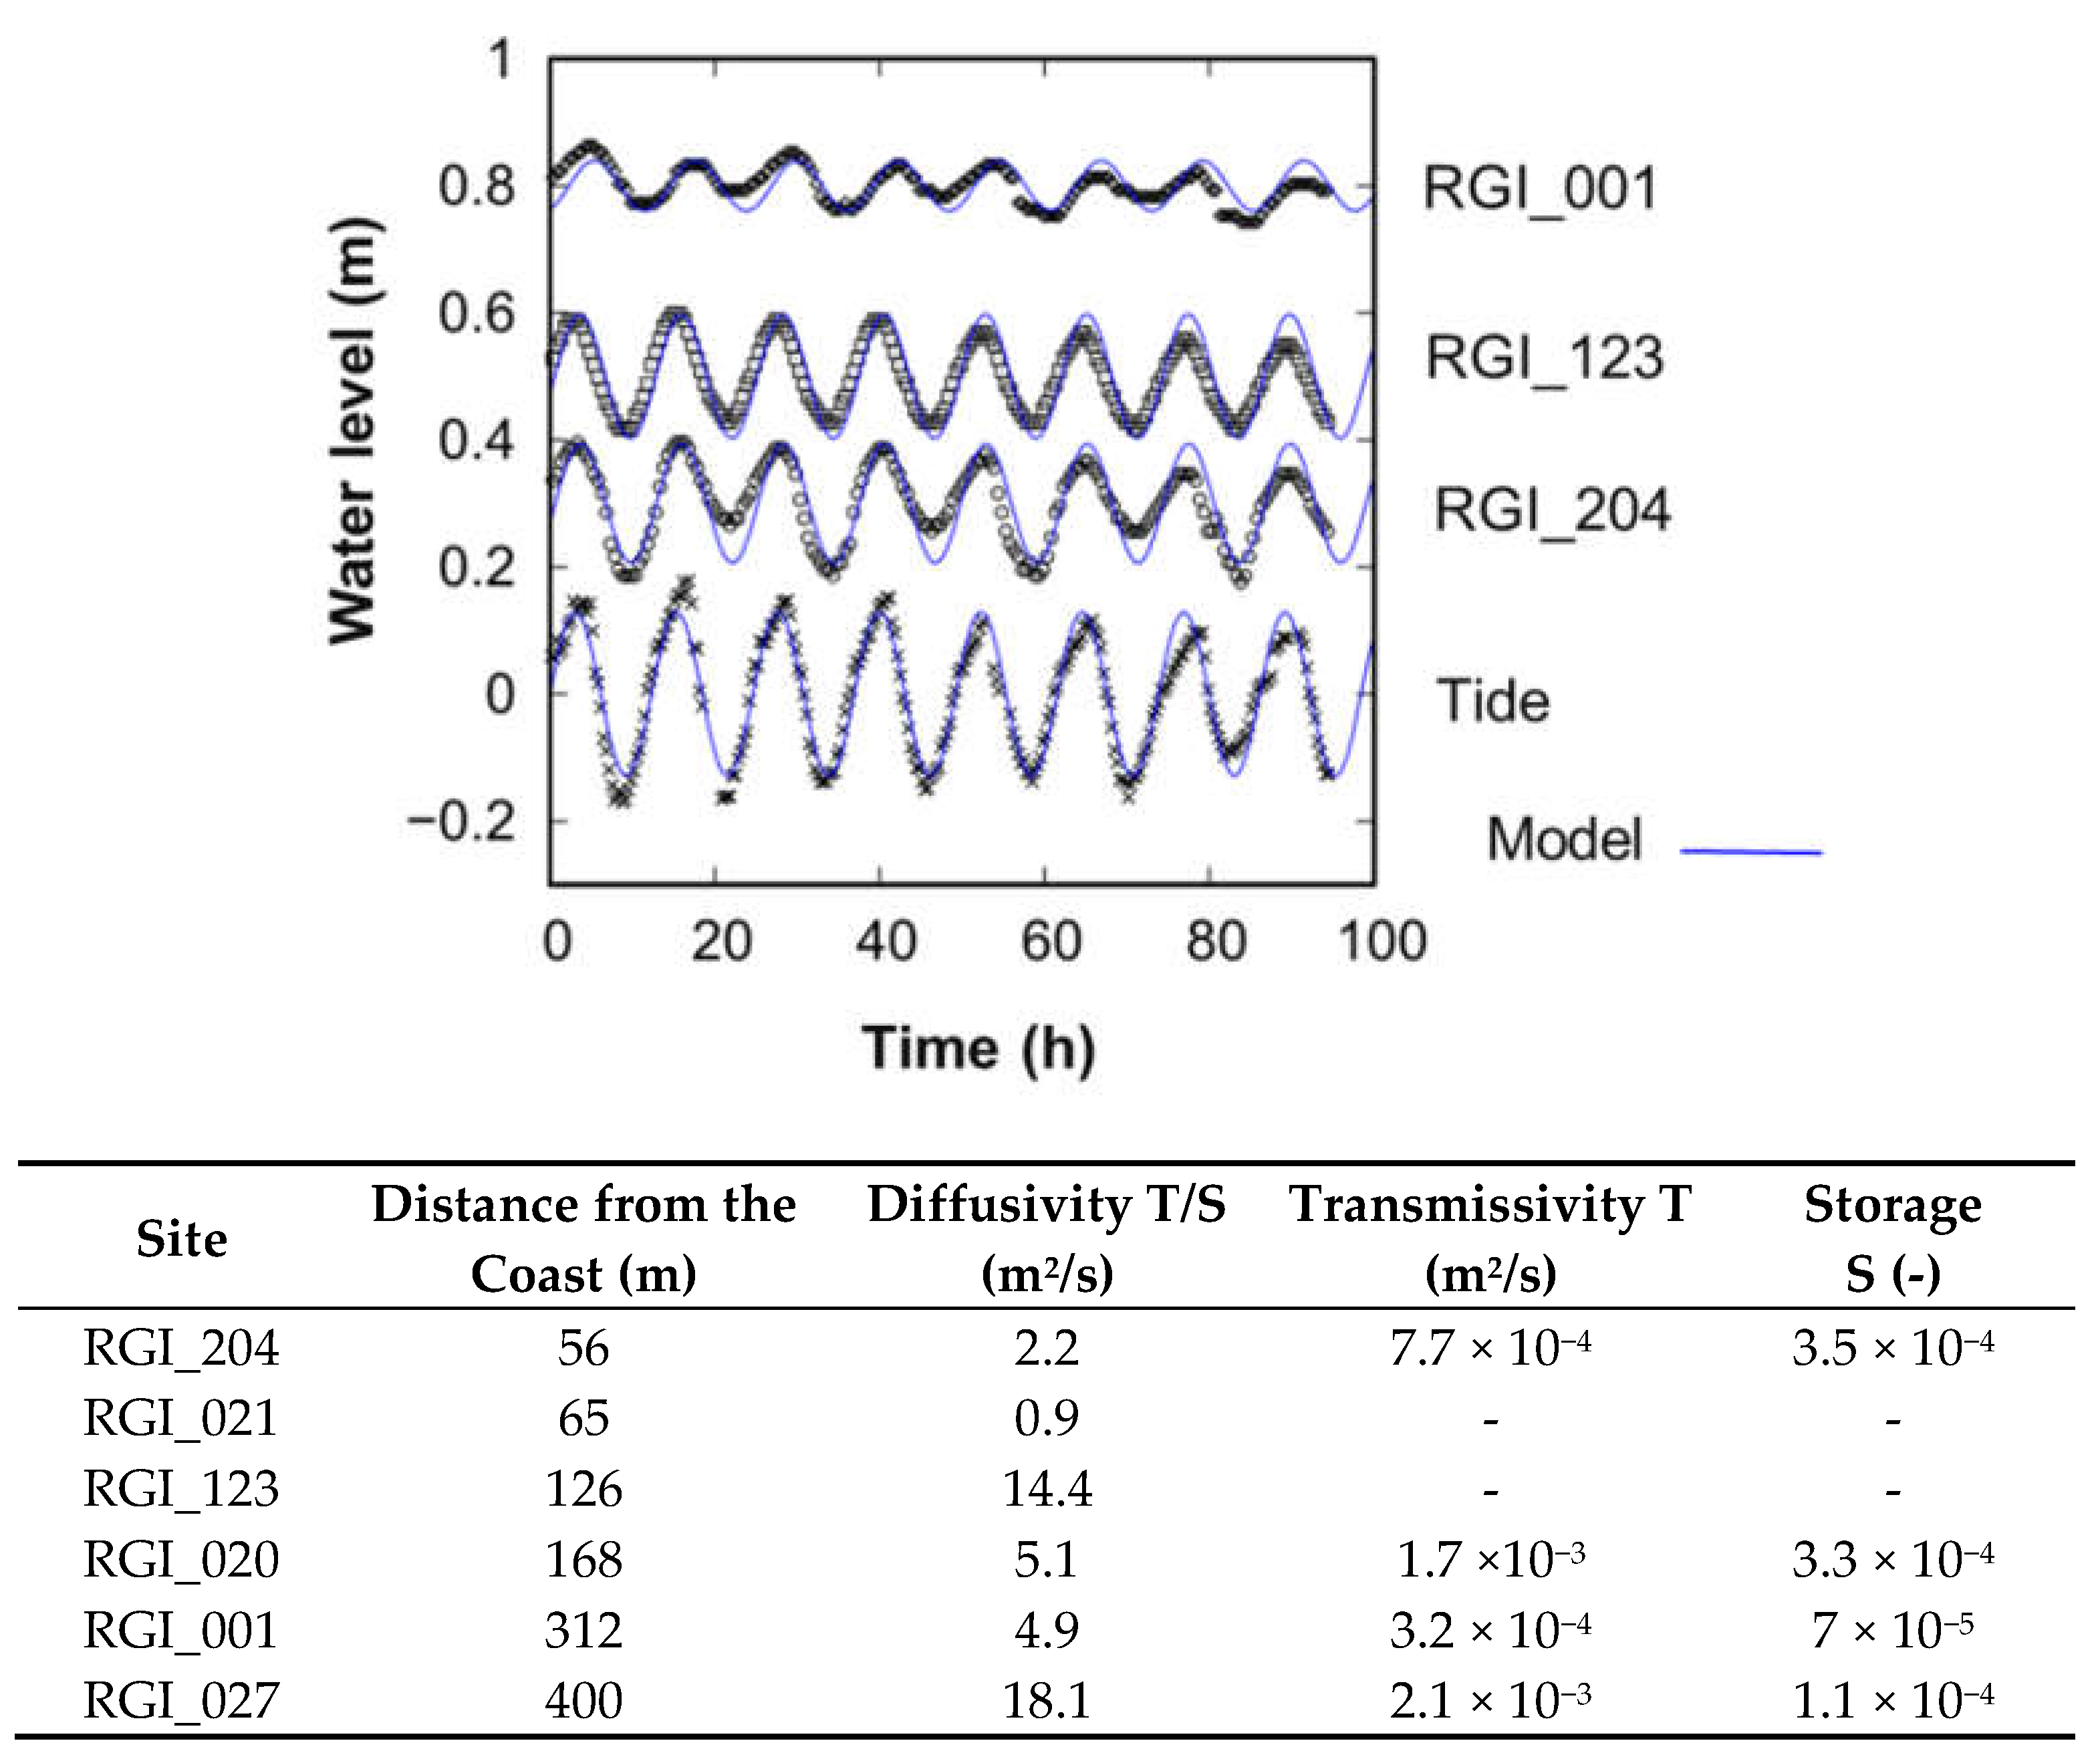
3.3. Tides Modelling for Diffusivity Estimate

The interstitial seawater contained into the atoll aquifer responds to any hydrodynamic forcing or imbalance such as swell or tides with a displacement that can reach m/s [14].
Over short periods of time, the tidal signal can be modeled according to the following unimodal sinusoidal function:
h t = h 0 s i n 2 π t t 0  
where h0 (L) corresponds to the amplitude of the tide and t0 (T) to its period (time between two maxima or two minima). Tidal range corresponds to the difference in water level between high and low water (peak-to-peak amplitude, or 2 h0).
Multi-modal tidal signals can also be considered to take into account the superposition of forcings that impact the tide. In this case, the model with i modes is written:
h t = H + i = 1 n h i s i n 2 π t t i + ϕ i
where H (L) is the mean sea level elevation, hi (L) is the amplitude, ti (T) is the period, and Φi (-) is the phase shift of the tidal mode i.
In a confined aquifer of transmissivity T and storage coefficient S in relation with the ocean, the amplitude of the fluctuation of the tide, h(x) at a distance x from the ocean, is given by the following formula [15]:
h x = h 0   e x p x π S t 0 T
These three equations form the basis for the following analyses.

4. Results

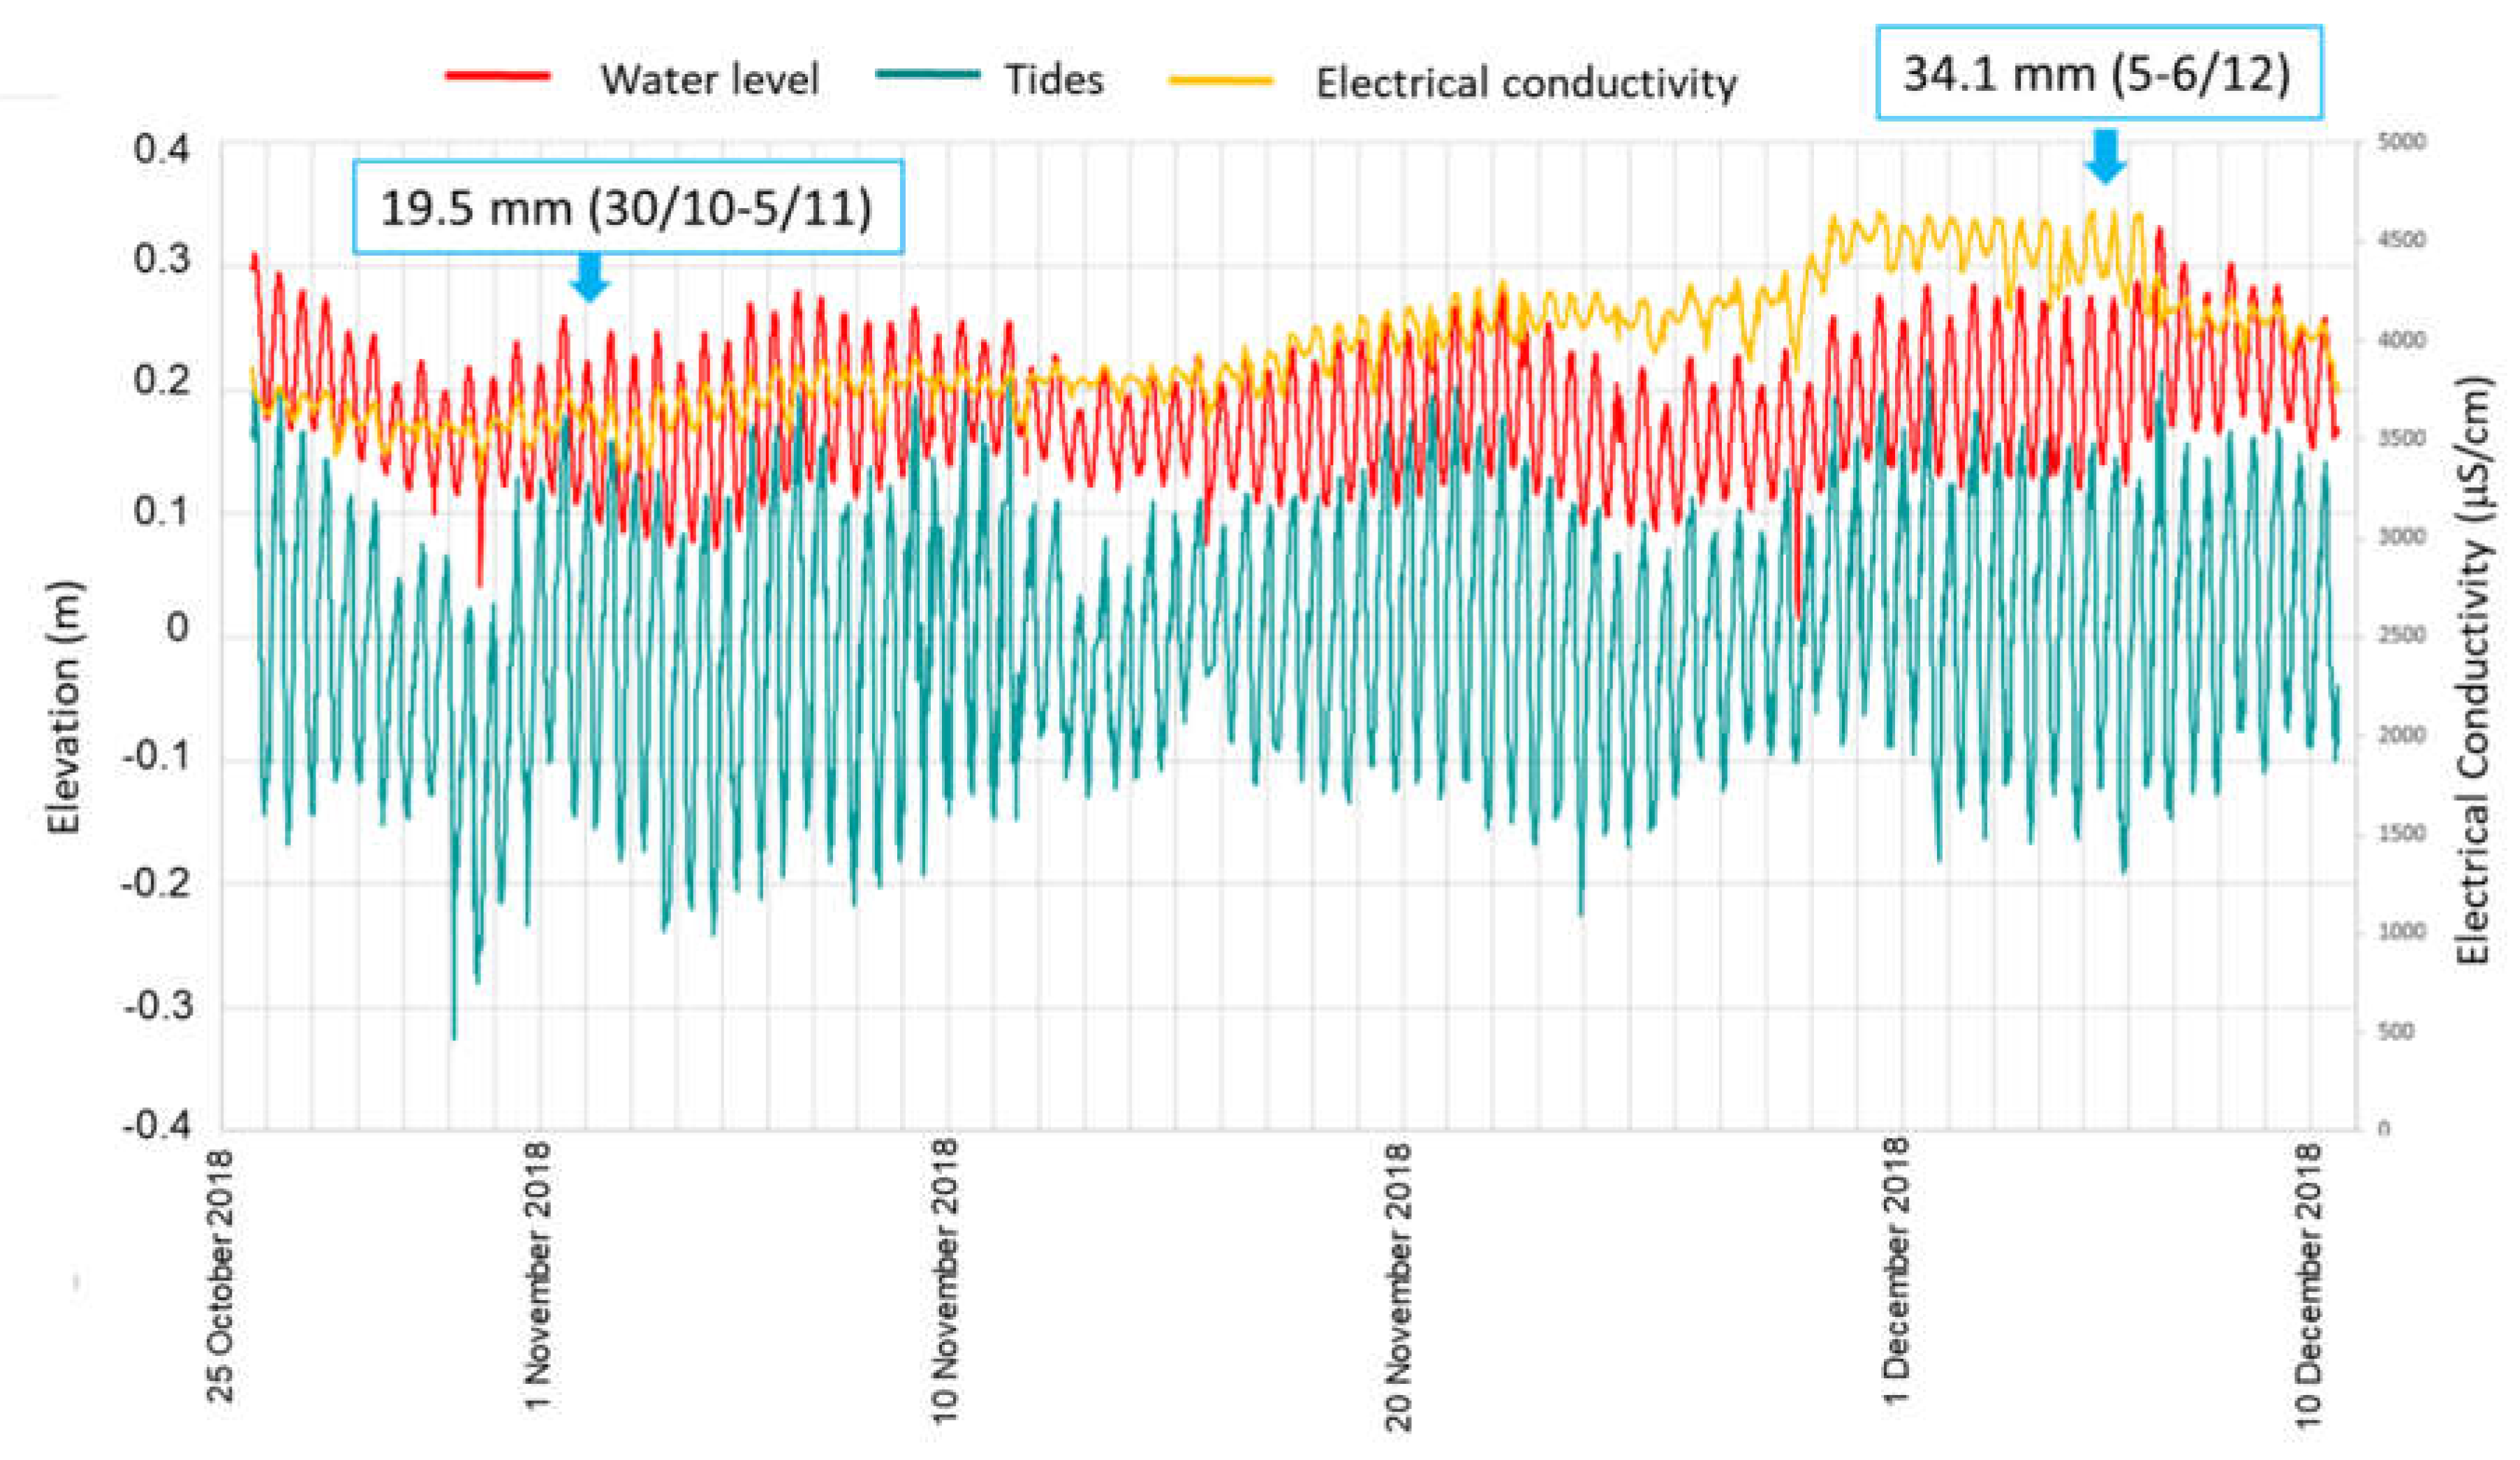
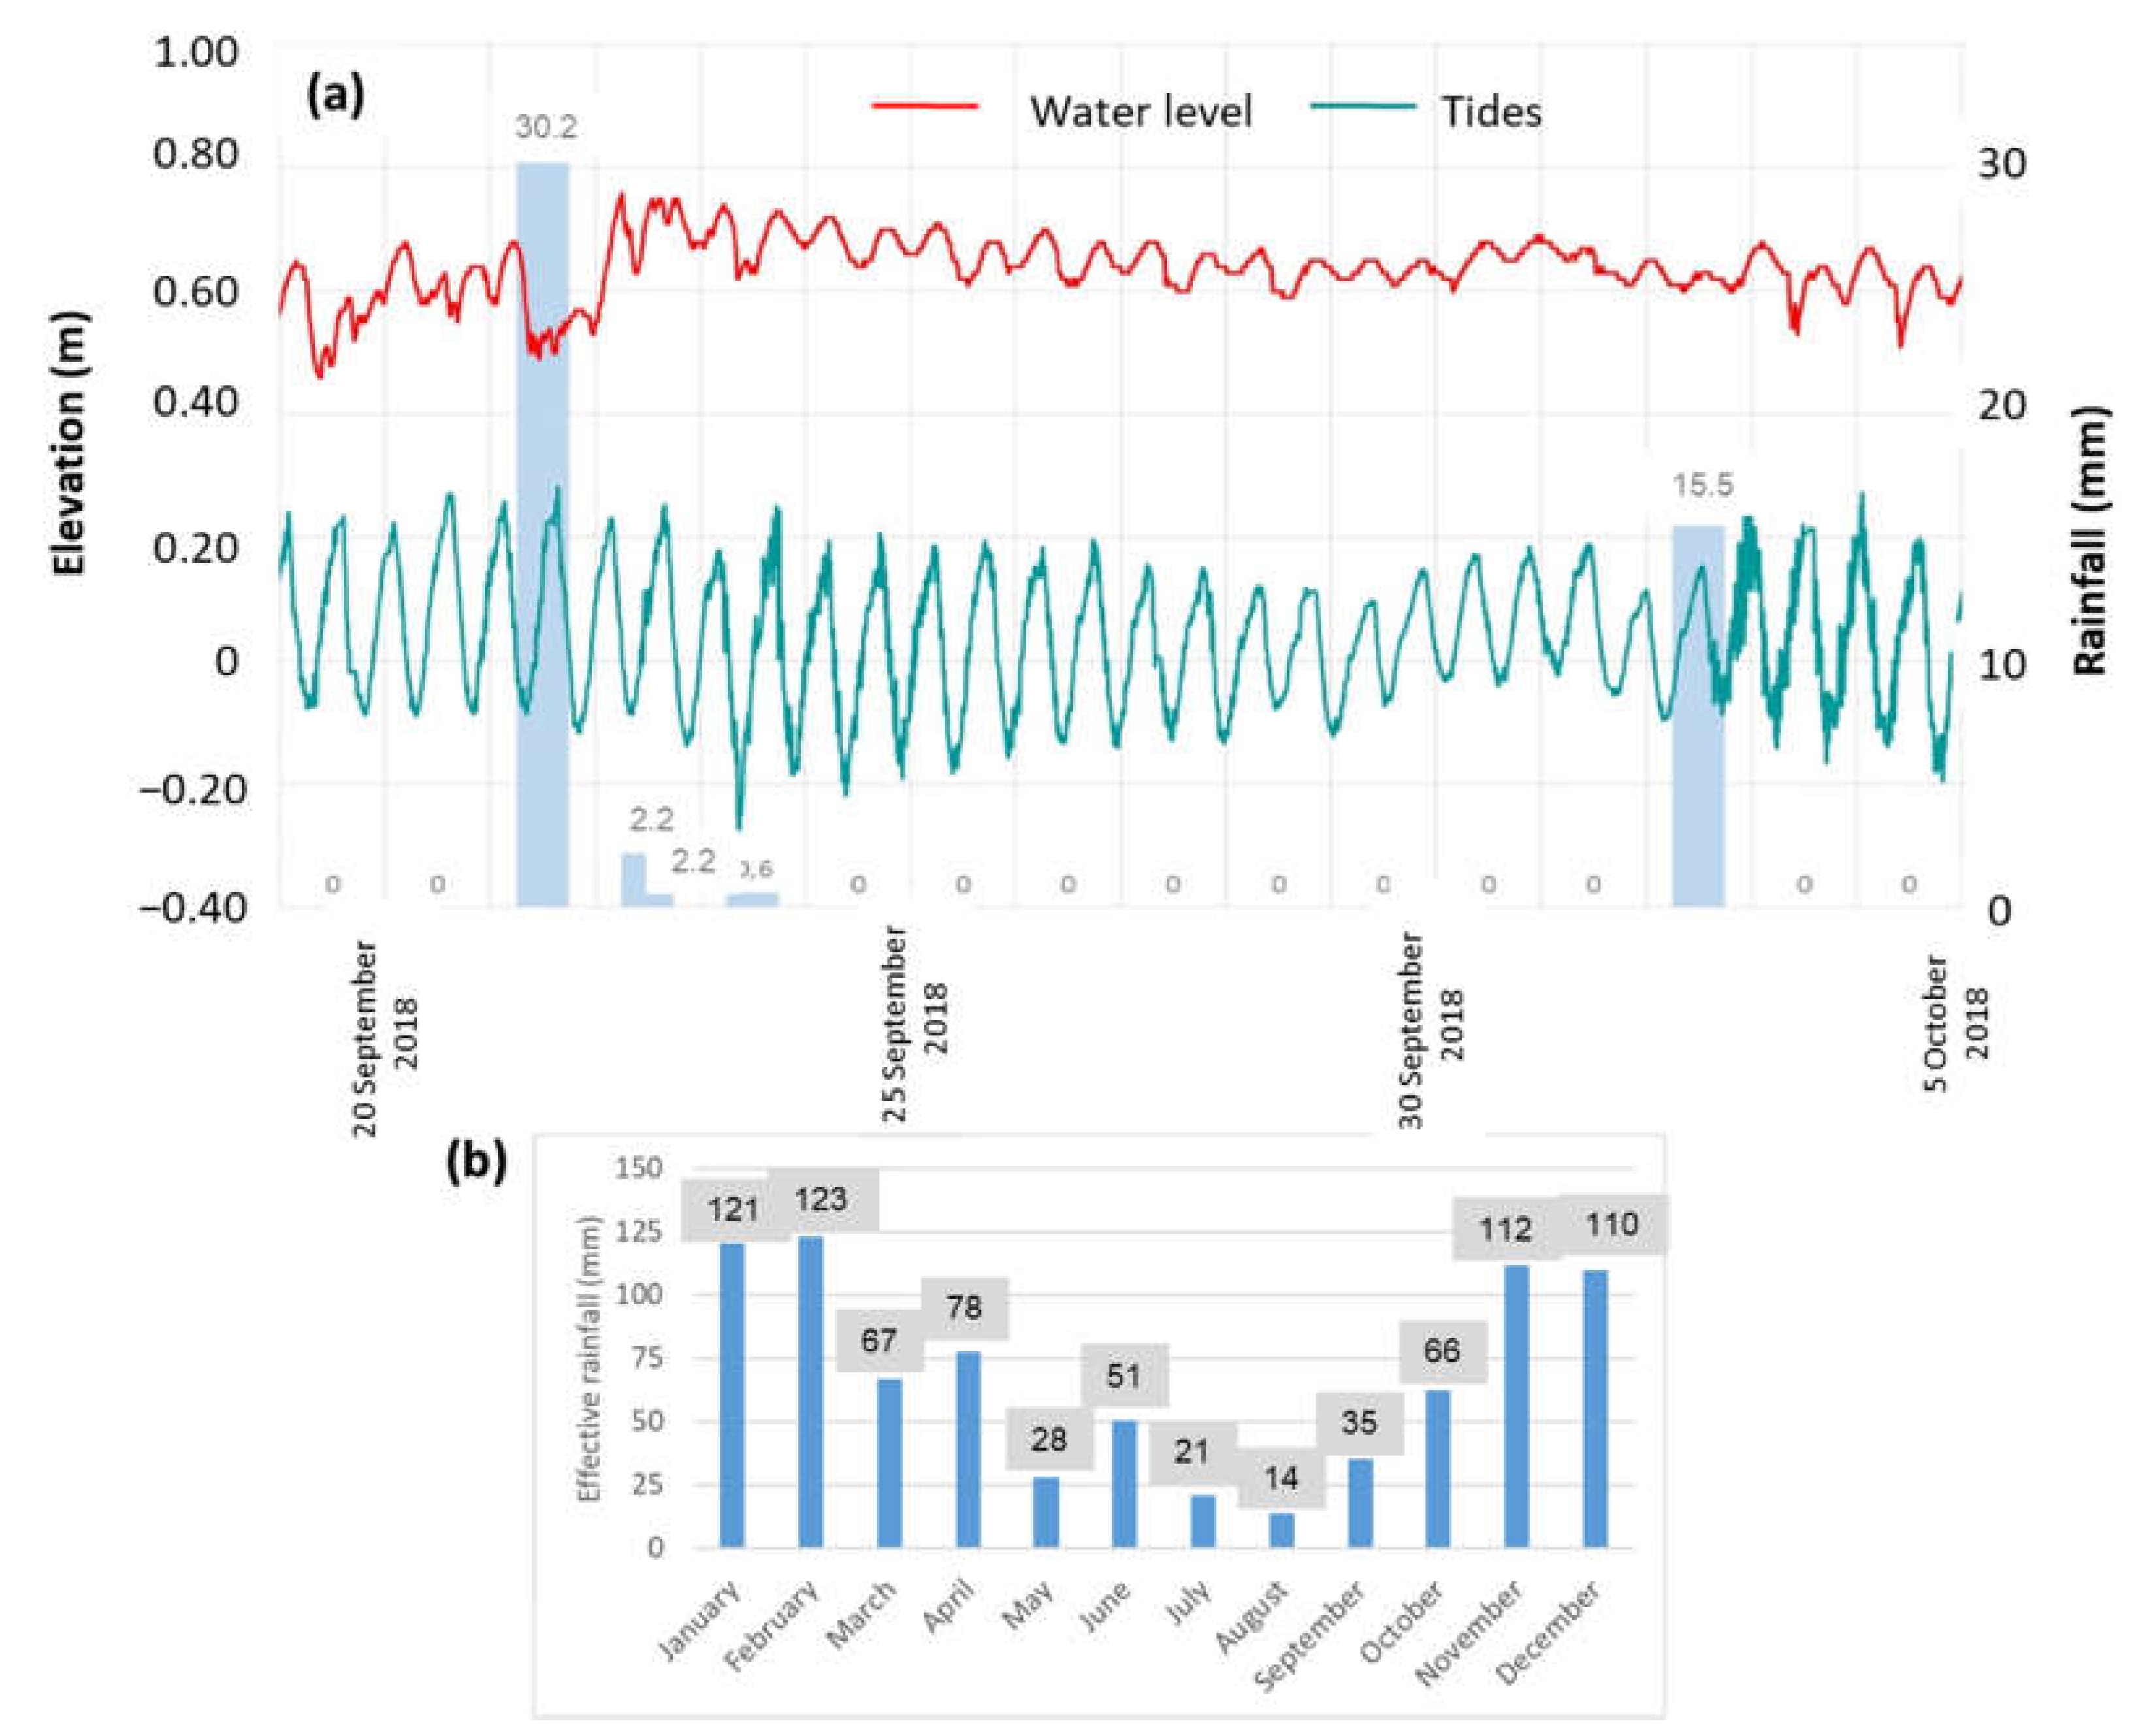
4.1. Data Time Series

Water levels and electrical conductivity were measured in five wells. An example (well RGI_021) is illustrated at Figure 3. The comparison with the sea water level fluctuations due to tides showed a very strong and rapid influence of the boundary conditions (sea water level) on the aquifer. Water mineralization also fluctuates quickly in response to seawater intrusion. These measurements allow computing the tiding efficiency which is used for computing the diffusivity of the aquifer (see the following section). During the observation period, rainy events were rare. Two of them appeared: the 19.5 mm rain event between 30 October and 5 November 2018, which did not induce any change of level, and, contrarily, the 34.1 mm event of December 2018, which induced a water table rise followed by a mineralization decrease after a dilution effect.

4.2. Pumping Tests Interpretation

Five short-duration pumping tests were carried out (Table 1). It appears that the results obtained by their interpretation are similar to the values determined in the past and that the values vary in a ratio of 1 to 8 between the lowest and highest value.
These results are also in line with the results of the correlation analyses which revealed significant discrepancies between the tidal signals and the piezometric level at the well RGI_001 (lowest transmissivity) and almost synchronous reactions at the well RGI_027 (highest transmissivity). The high transmissivity measured in the past at the Club Med site could also explain the synchronous reactions observed on the RGI_123 well located in the same area. The transmissivity results are used in the following sections in order to calculate the natural recharge using Henry’s modified solution.

4.3. Soil Water Budget

Actual evapotranspiration and effective rainfall were computed applying soil water budget equations at a daily time step with the ESPERE code [12]. An unknown parameter of these equations is the maximum soil water content Smax, which is a global reservoir parameter. In order to identify the correct parameter, it is necessary to determine, in the context of undersaturated soils (S = 0), the rainfall threshold for which the piezometric level reacts.
The analysis was carried out on the recordings made at well RGI_001 and particularly on the period from September 19 to 4 October 2018 where two significant rainfall events could be identified (Figure 4a). The analysis of the time data series indicated that an event of 30 mm is able to create a rise of the water table, meaning that such a rainfall event magnitude produces effective rainfall (and recharge). At the opposite side, a rainfall event of 15 mm does not induce any water level fluctuation. We conclude that such an event does not produce any effective rainfall. Therefore, we can conclude that 15 < Smax < 30 mm. We assumed a value Smax = 20 mm for the calculation of the soil water budget. Monthly results of the effective rainfall are represented in Figure 4b. Given the high porosity and hydraulic conductivity of soils on the atoll, and the very low slope, we assumed that most of effective rainfall infiltrates.

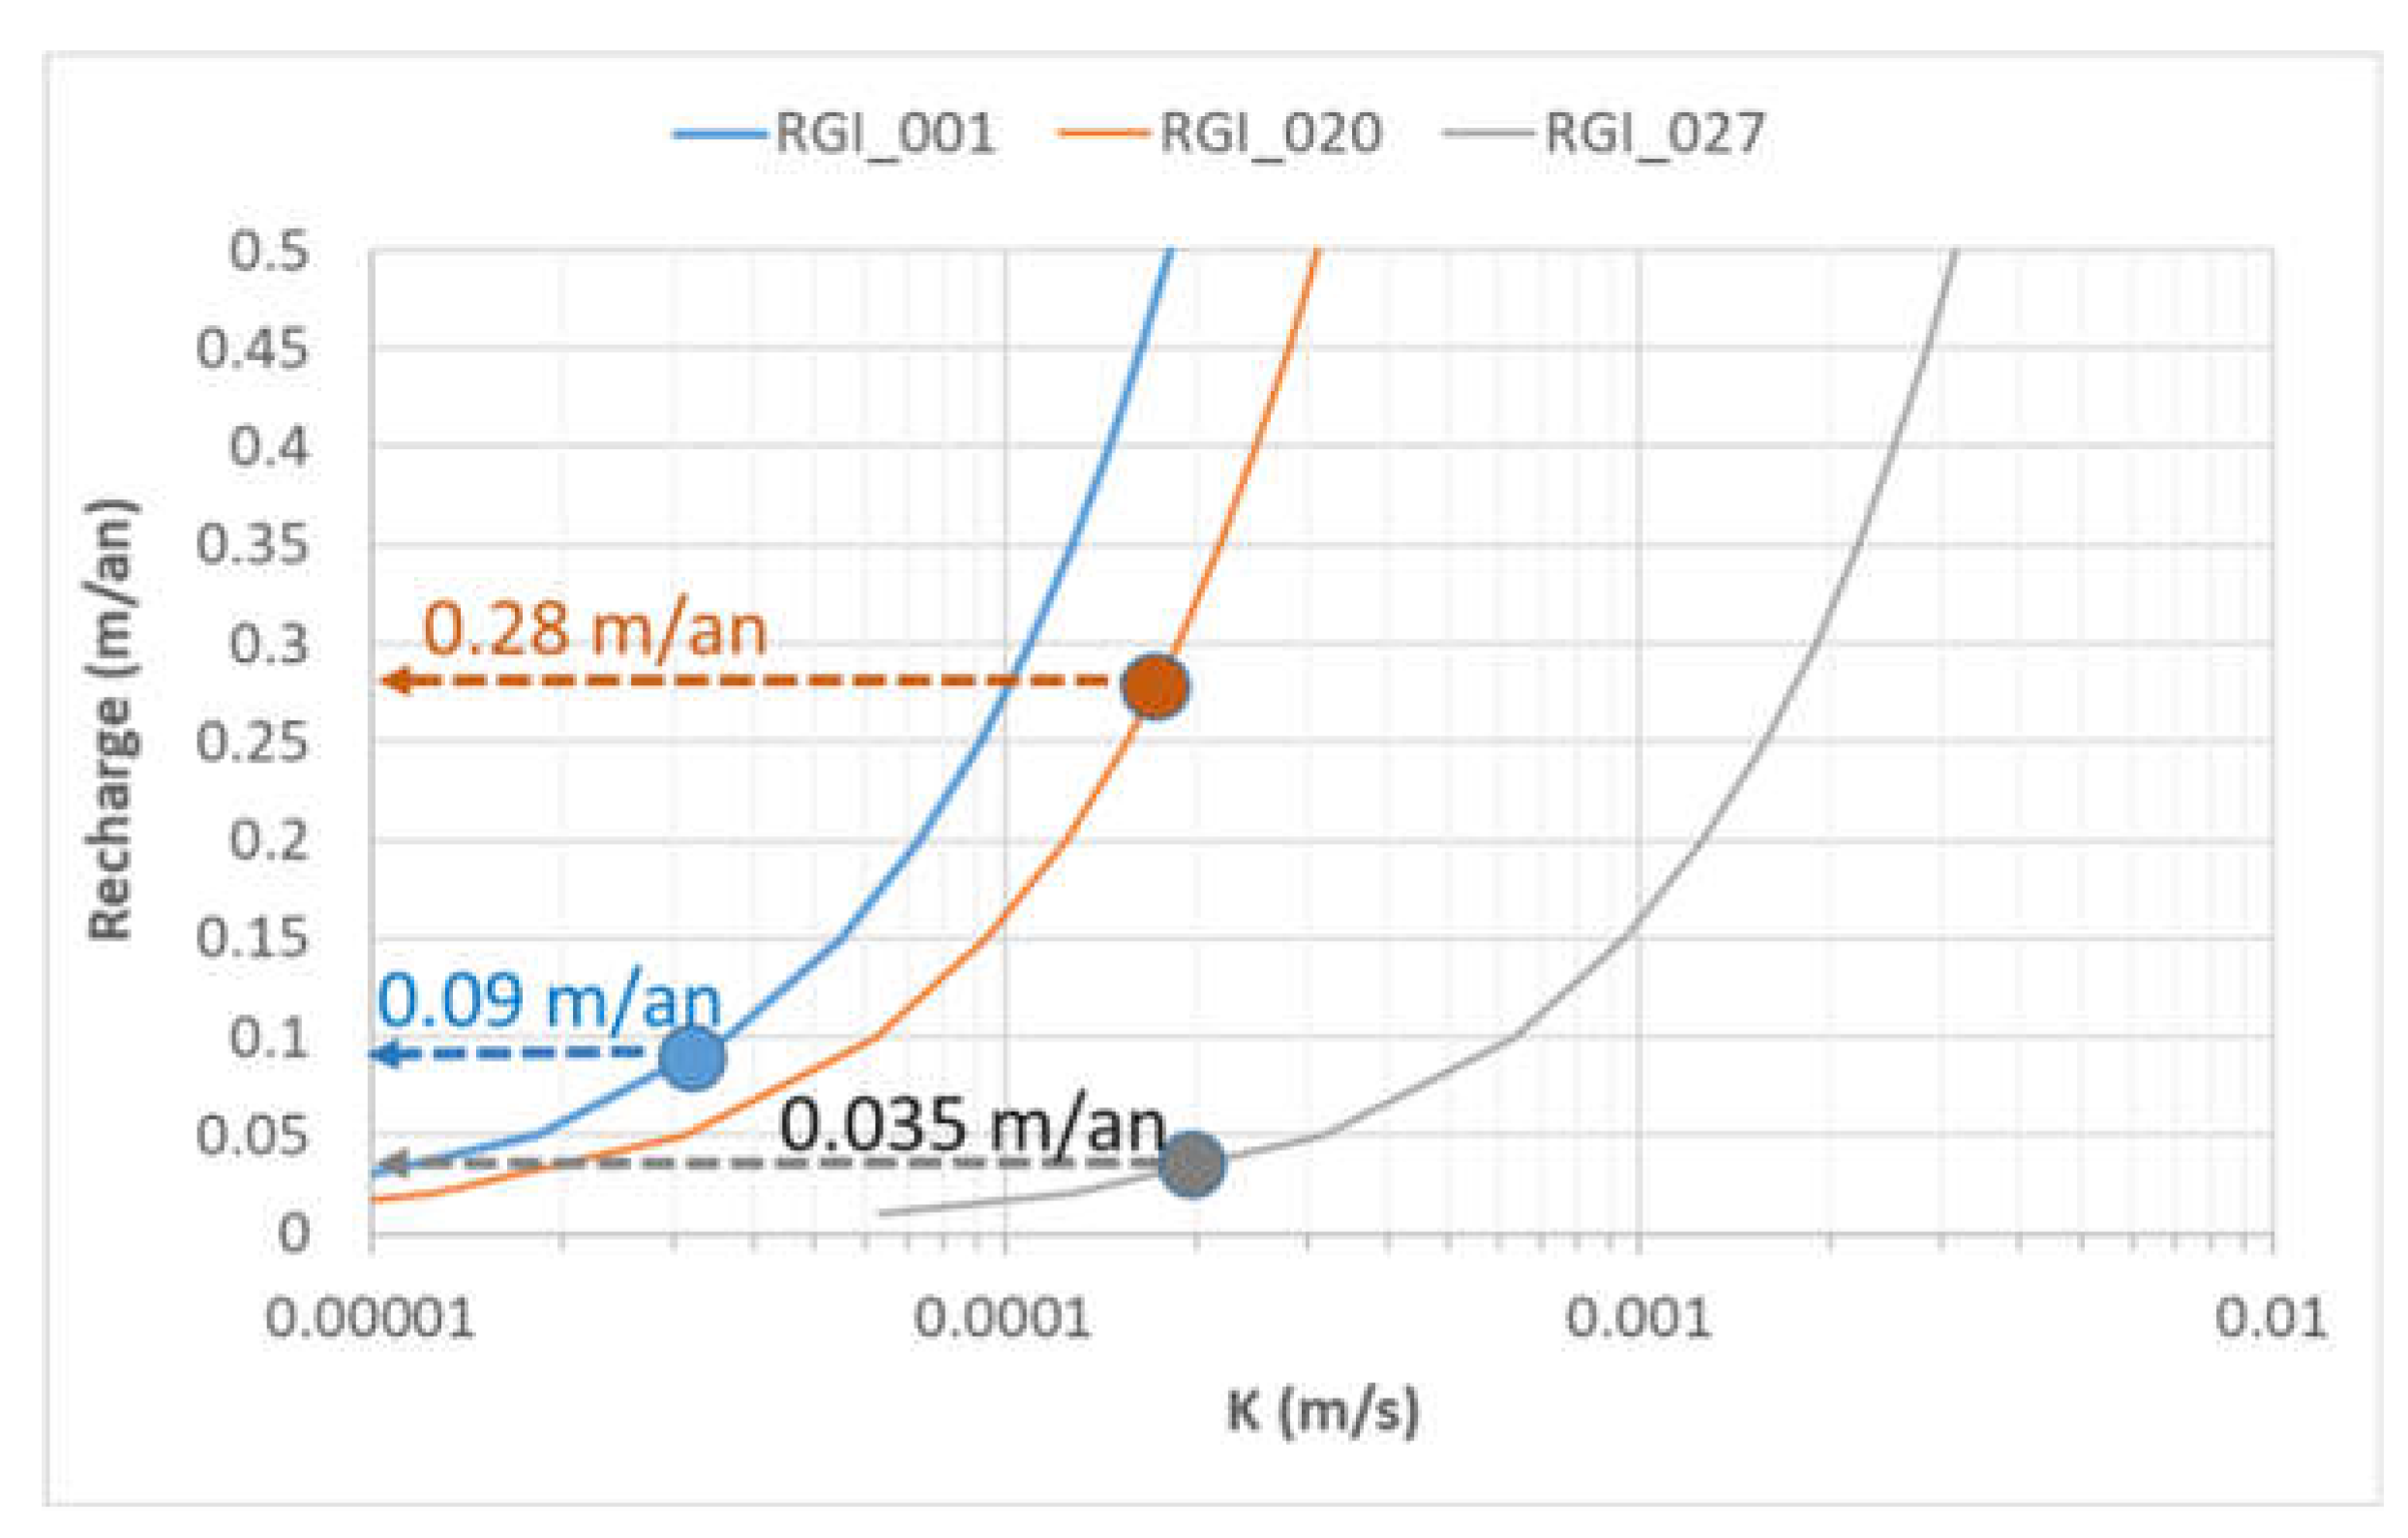
4.4. Natural Recharge Calculation

Henry’s modified equation was applied to the three wells on which hydraulic conductivity could be estimated by pumping test and a water level chronicle was available between mid-September 2018 and February 2019. As the observation conditions were particularly atypical with no effective rainfall during the wet season, these results should be taken with caution. The wells concerned are RGI_001, RGI_020, and RGI_027, the characteristics of which are described in Table 2. Hydraulic conductivities were calculated from the tranmissivity obtained by the pumping test (Table 1) and an assumption of the thickness of the upper aquifer b = 10 m.
The application of Henry’s modified solution to the three wells is presented in Figure 5 in the form of three abacuses. It can be seen that for these three wells, the natural recharge increased from 0 to 500 mm/year for hydraulic conductivities ranging from 10−5 to 3 × 10⁻³ m/s. The hydraulic conductivities obtained by pumping tests (Table 2) made it possible to identify, for each well, a dot (K, R) on this diagram. This exercise thus makes it possible to estimate for each well a natural recharge rate around the well: 35 mm/year around the well RGI_027, 90 mm/year around RGI_020, and 280 mm/year around RGI_001. These values, on average 135 mm/year, are low compared with the effective precipitation estimated above (820 mm/year). Assuming an excess of actual evapotranspiration due to coconut trees equal to 165 mm/year, this value indicates that about 820 − 135 − 165 = 520 mm/year of water is lost and somehow flows to the ocean.
The conventional Henry’s solution was applied to two sections of Rangiroa Atoll, coupled with the Ghyben–Herzberg solution for the estimation of the depth of the freshwater/salt water sharp interface, in particular those surveyed by piezometric surveys in July 2017 and April 2018 (Figure 6) using the values of K and R obtained above.
It is observed that the theoretical sharp freshwater/salt water interface should theoretically be located between 6 and 8 m below the surface of the atoll. The observation of a strong increase in salinity at much shallower depths on the vertical profiles indicates the existence of a transition zone of significant thickness probably related to mixtures created by tides that are not taken into account in this approach.

4.5. Tidal Unimodal Analysis Results

The piezometric monitoring indicates a strong influence of the tide on the fluctuations of the water table. The piezometric variations are sinusoidal and of the same period as the tide. The amplitudes are different on points located at the same distance from the lagoon, which reflects an heterogeneity of the aquifer diffusivities. Tide monitoring in the lagoon has shown a semi-diurnal tidal regime (two high tides and two low tides per day) with a period of 12 h 30 m and amplitudes of 12 and 20 cm. The piezometers showed oscillations with periods similar to the tide but with variable phase shifts.
In a first step, a unimodal tide model was fitted over a 4-day interval with a period of 12.31 h (see Figure 7). It appears that over this short period of time the tide is clearly influenced by the semi-diurnal main harmonic of the moon M2. The piezometric levels follow this dynamic with varying phase and amplitude as shown in the time series.
Amplitude and phase differences between the piezometric records illustrate the mitigating effect of the tidal signal propagation in the aquifer and the influence of the hydraulic properties of the aquifer. The amplitude of the signal decreases and the phase increases with distance.
The diffusivities obtained for all the adjustments are synthesized in the Table of Figure 7. Being particularly high (average of 7.5 m2/s), they suggest a captive hydrodynamic behavior for the aquifer.
For the wells that have been pumped and for which transmissivity has been determined, it was possible to calculate the storage value. The values obtained range from 7 × 10⁻⁵ to 3.5 × 10⁻⁴ and are representative of a confined or semi-confined aquifer. Under these conditions, it is probable that the aquifer is confined under the conglomerate (or daddy) layer described at the beginning of this report and intercepted by many wells.

5. Discussion

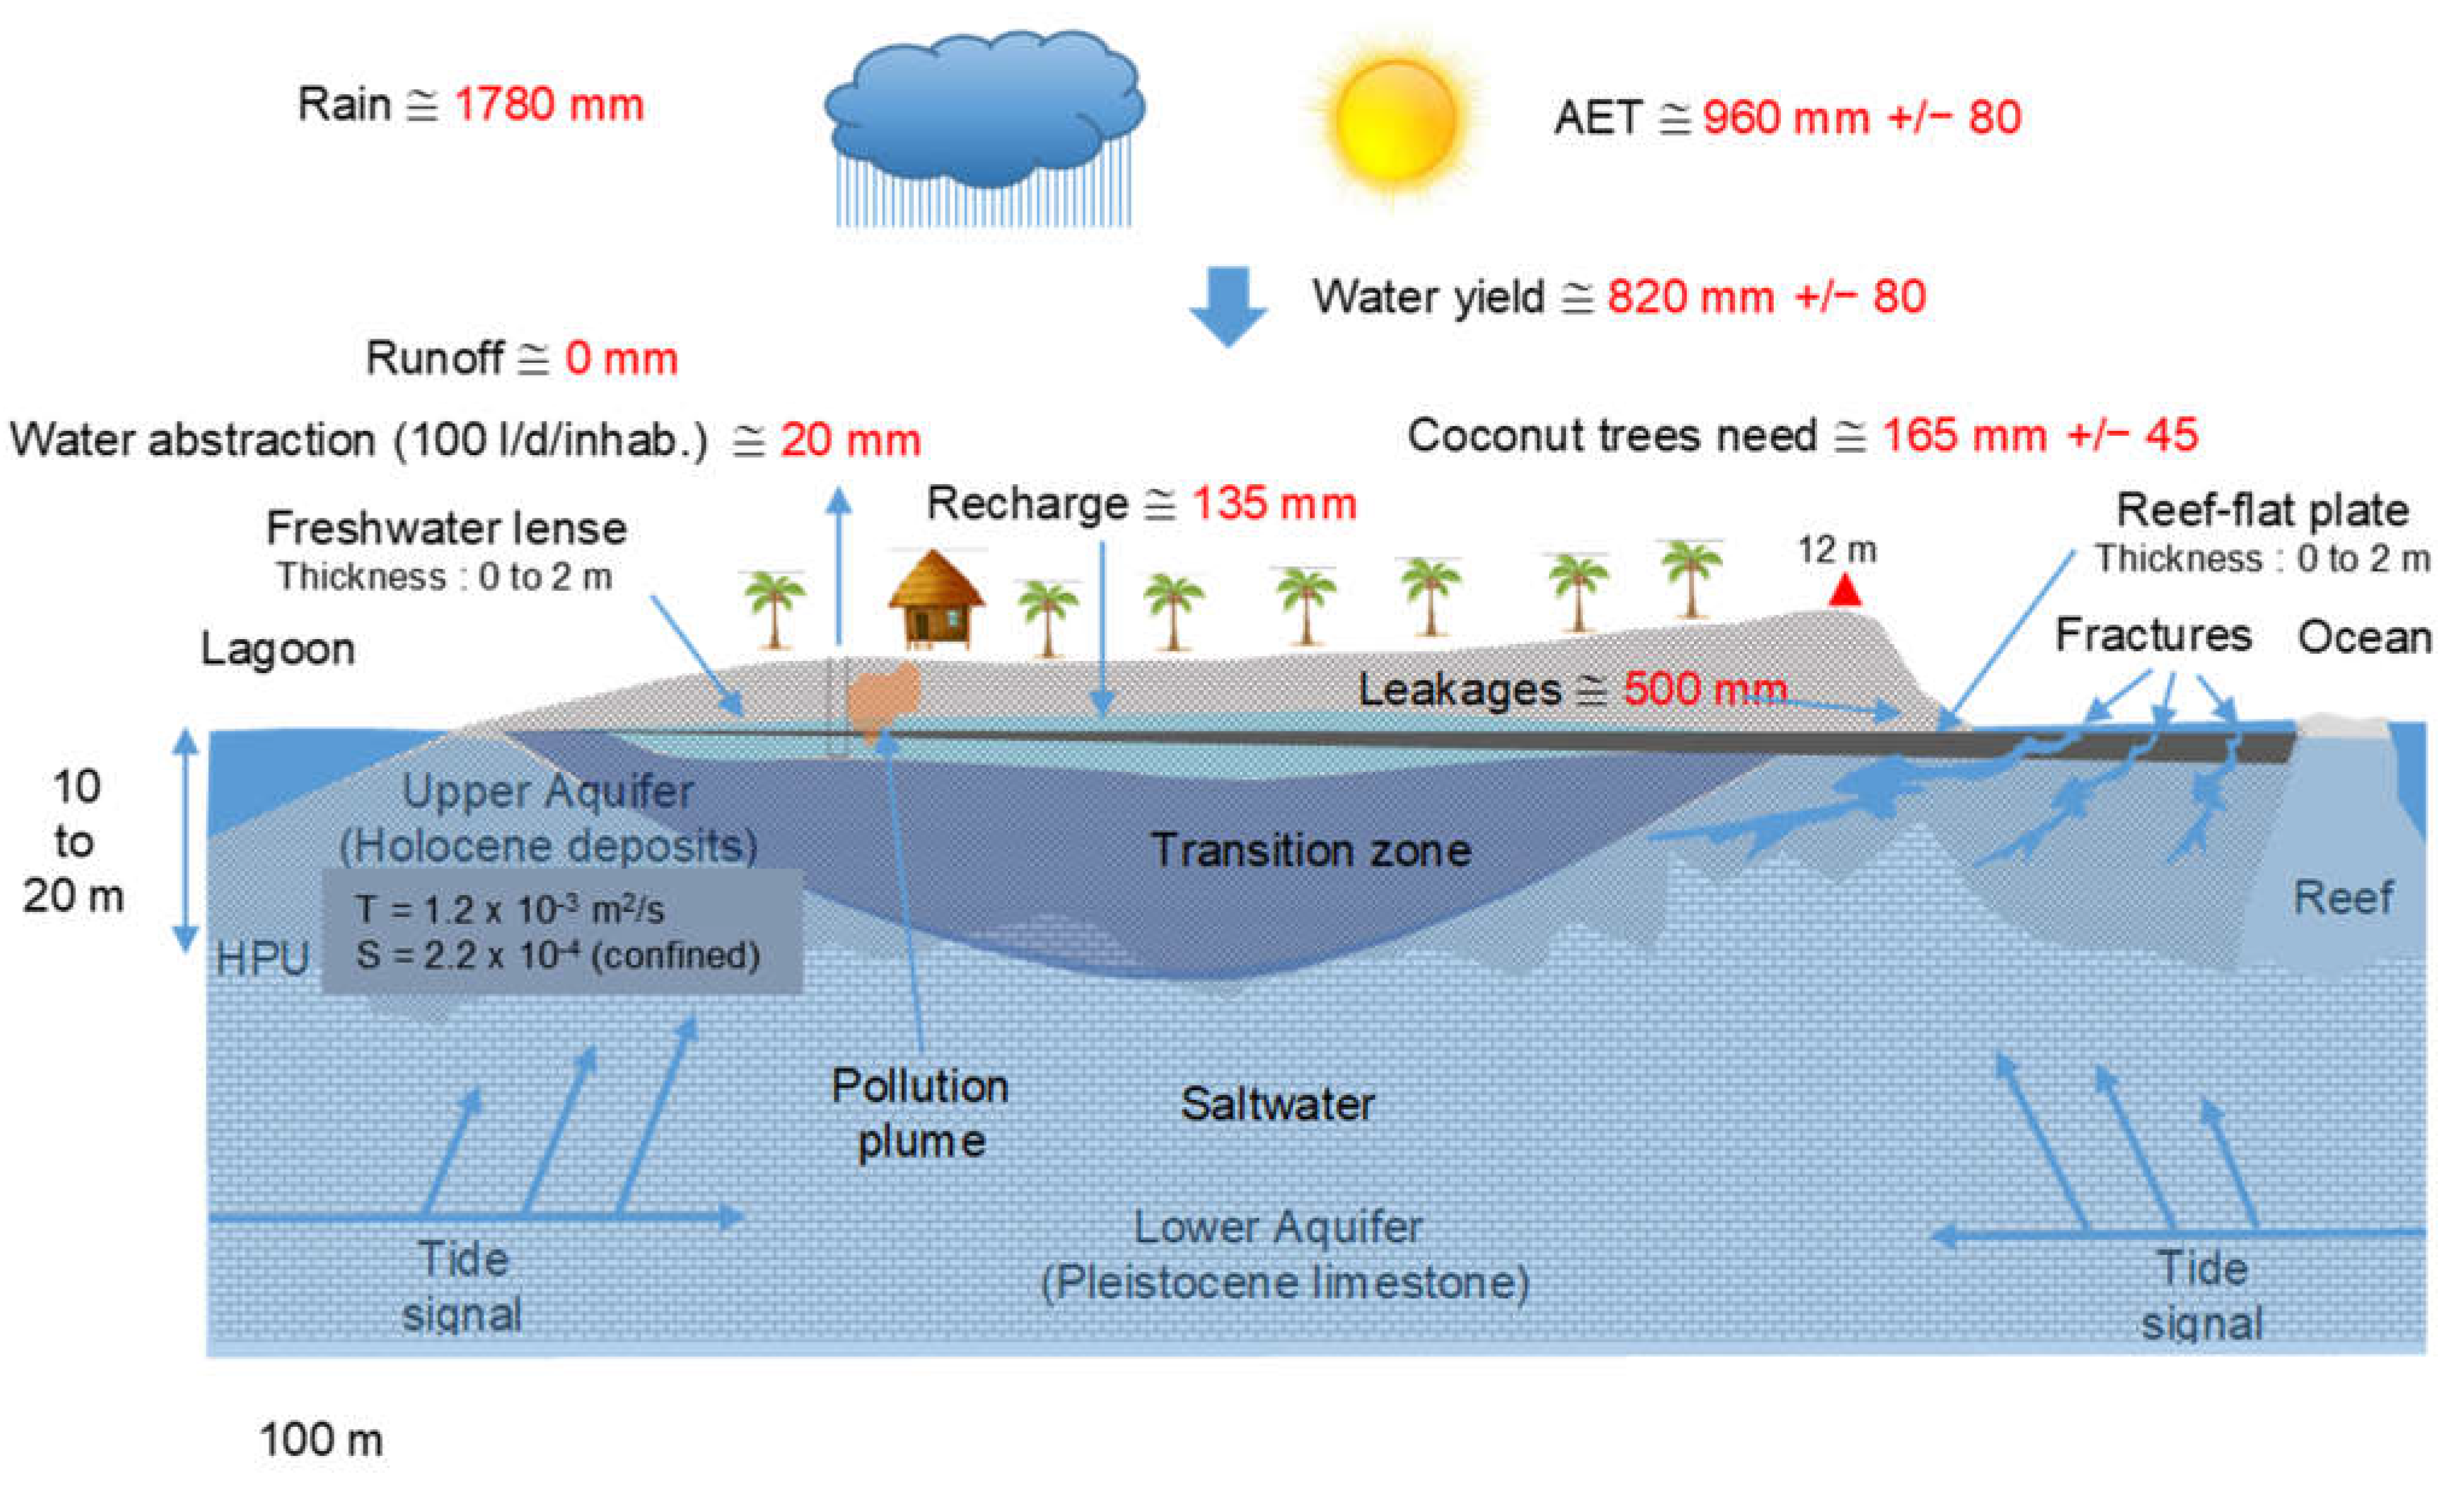
5.1. Hydrogeological Conceptual Model

The elements collected through the different approaches made it possible to develop the following hydrogeological scheme, which is based on the model proposed by ref. [2] (Figure 8). It should be noted that our investigations on Rangiroa focused on the “windward” part of the atoll, whose Holocene formations are considered coarser (and therefore more permeable) than the “leeward” part.
The atoll receives about 1800 mm/year of rainfall, most of it during the period between November and February. The actual evapotranspiration calculated for an assumption of Smax = 20 mm (low value related to the rather coarse soil type with reduced clay fraction) is 1000 ± 80 mm/year. This evapotranspiration corresponds to an assessment made for reference vegetation, but the high density of coconut trees on the atoll probably induces an excess of evapotranspiration estimated at 165 mm/year.
Outside of exceptional rainfall events such as the 2016 one, runoff is likely to be negligible due to the low slope and high hydraulic conductivity of the soil. On the basis of an abstraction rate of 100 l/d/person, a population of 2700 inhabitants and an inhabited area of 5 km2 (4 km2 for the Avatoru motu and 1 km2 for the Tiputa motu), water abstraction for domestic purpose represent 20 mm/year.
Analysis and modeling of the FWL estimated the natural recharge at 135 mm/year. This suggests that a large amount of water (in the order of 520 mm/year) flows at shallow depth (hypodermic flow) laterally over the reef-flat plate to the ocean and lagoon.
The porous and permeable nature of Holocene sediments and the underlying Pleistocene limestones induces the presence of a fresh water lens “floating” on seawater, fed by the infiltration of precipitation. The hydraulic conductivity of the lower aquifer could not be tested in the absence of deep drilling; the literature considers that it is generally one to two orders of magnitude higher than the upper aquifer.
On the Avatoru motu, significant increases in salinity observed at very shallow depth indicate that this lens is underdeveloped (1 to 2 m at most). Its thickness is much lower than expected despite the observed piezometry. It should be noted that the latter only appears to be present in sectors where the motu is quite wide (L > 800 m). On the motu of the wine, the thickness of the fresh water lens seems to be greater, but its lower limit could not be recognized in the absence of deep wells. In general, the thickness of the lens is greater in the center of the motu but its presence has also been occasionally recognized near the lagoon.
Nitrate levels above 10 mg/L observed in about 1/5 of the wells during field investigations testify to the direct impact of wastewater discharge into the natural environment and prove that the protection provided by the conglomerate layer is not optimal.
In terms of hydrodynamic properties, the upper aquifer, located in Holocene sediments, was characterized by a transmissivity between 3.2 × 10⁻⁴ and 2.2 × 10⁻³ m2/s (values determined by pumping tests) and an average value of 1.2 × 10⁻³ m2/s. Storage values ranged from 7 × 10⁻⁵ to 3.5 × 10⁻⁴ for an average of 2.15 × 10⁻⁴. Effective porosity was in the range of 20% to 30% (values obtained by Nuclear Magnetic Resonance).
In the absence of sufficiently deep drilling, the properties of the underlying Pleistocene aquifer could not be determined, but its roof (HPU boundary), which is very irregular due to the karstification phenomena it has undergone, could be revealed by electrical tomography at a depth of about 10 to 20 m.
On the ocean side, the scalloped fractures of the Holocene plain are the preferred routes for seawater penetration, while on the lagoon side, the salt invasion occurs in sediments that are probably finer and more homogeneous.
Finally, it should be noted that the investigations carried out by BRGM took place in a particularly unusual climatic context. The year 2018 was characterized by a cumulative total rainfall of 1096 mm, 38% lower than the average calculated over the period 1972–1987 (1778 mm). The recording period of piezometric levels (from 14 September 2018 to 25 February 2019) was also characterized by a very low cumulation (281.5 mm, or 16% of the average rainfall) while it occurred in the middle of the austral summer, considered to be the rainiest season.
Despite these very unfavorable conditions, there has been no general downward trend in piezometric levels, which suggests that hydraulic heads are essentially controlled by the tidal phenomenon at the atoll. However, it may be considered that the lens observed geometry shown is as unfavorable as possible and that its thickness may be greater in a more humid climatic context.

5.2. Hydrogeological Role of the Reef-Flat Plate

The thickness of the fresh water lens of an atoll is generally positively correlated with the width of the atoll. Similarly, the lens is generally thicker in the “leeward” part of an atoll than in the “windward” part. Figure 9 represents the lens thickness at different Pacific atolls. It appears that observations made at Rangiroa (where the lens thickness probably does not exceed two meters and the width of the motu is less than 1000 m) place this atoll among the areas where the lens is least developed, the part of the atoll that was studied being the windward.
The literature considers that the relative thickness of the transition zone compared with the freshwater lens increases as hydraulic conductivity and pumping rate increase, and as the island’s recharge and width decrease. Some mixing phenomena such as those induced by tides can even virtually eliminate the freshwater lens [2]. In the case of Rangiroa, it is probably the low natural recharge reaching the water table, coupled with the high efficiency of the tides that are at the origin of this thick mixing zone and thin FWL. Ayers and Vacher [6] found that in Deke Island, Pingelap Atoll (Federated States of Micronesia), the reef-flat plate acts as a barrier to recharge, given its low K. The accompanying water ponding above the plate and its subsequent discharge to the sea results in reduced recharge to the FWL. Ayers [17] reported a similar conclusion for Nukuoro Atoll (Federated States of Micronesia), where the presence of the reef-flat plate reduced recharge to the lens compared with the lagoon side.
In Rangiroa atoll island, the presence of a conglomerate layer (locally called “daddy’s layer”) of indurated rock, several decimeters thick at a depth of a few meters and located between 1 and 2 m deep, probably plays a very important role in underground hydraulics by conferring a confined aquifer status to Holocene formations, thus explaining the strong hydraulic diffusivity of the aquifer, attested by the high efficiency of tides.
The consistency of its thickness and continuity is not well known, but it may favor hypodermic flows to the lagoon and ocean, thus reducing the deep natural recharge to the water table. It could also protect the freshwater lens from possible surface pollution and limit water extraction by plants with deep roots.

6. Conclusions

The various methods applied to the hydrogeology of this atoll allow characterizing the water budget of the hydrosystem, better understanding recharge processes, and proposing a conceptual hydrogeological model. The hydrodynamic properties (hydraulic conductivity and storage) were estimated using pumping tests and tides analysis.
The role of the reef-flat plate on the hydrogeology of the atoll is highlighted. Its impermeable nature contributes to reduce the deep infiltration to the aquifer. It also contributes to the confined flow regime of the aquifer, inducing high and fast water level fluctuations due to tide forces, and consequently contributes to increase the thickness of the saline mixing zone. Both phenomena contribute to reduce the thickness of the FWL which is only 2 m-thick in that atoll compared with literature results.
The study illustrates how simple investigation methods (water level measurements, water budget, and small duration pumping tests) allow characterizing the FWL of an island atoll. It shows how the impermeable character of the reef-flat plate contributes to reduce the deep infiltration to the aquifer and the thickness of the FWL.

Author Contributions

Conceptualization, J.-C.M. and P.C.; methodology, J.-C.M.; software, V.H.; validation, P.C.; formal analysis, V.H.; investigation, P.C. and J.-C.M.; resources, P.C.; data curation, P.C.; writing—original draft preparation, J.-C.M.; writing—review and editing, J.-C.M. and V.H.; project administration, P.C. All authors have read and agreed to the published version of the manuscript.

Funding

This research was funded by Ministère de la Culture et de l’Environnement (MCE) de Polynésie - French Polynesia, French Government and BRGM: Grants 1366 (BRGM/MCE) and 055-14 (French Government/French Polynesia/BRGM).

Informed Consent Statement

Not applicable.

Acknowledgments

The authors thank Francine Tsiou-Fouc (French Polynesia Government) for her support to the project.

Conflicts of Interest

The authors declare no conflict of interest.

References

  1. White, I.; Falkland, T. Management of freshwater lenses on small Pacific islands. Hydrogeol. J. 2010, 18, 227–246. [Google Scholar] [CrossRef]
  2. Werner, A.D.; Sharp, H.K.; Galvis, S.C.; Post, V.E.A.; Sinclair, P. Hydrogeology and management of freshwater lenses on atoll islands: Review of current knowledge and research needs. J. Hydrol. 2017, 551, 819–844. [Google Scholar] [CrossRef]
  3. Falkland, A.C.; Custodio, E.; Diaz Arenas, A.; Simler, L. Hydrology and Water Resources of Small Islands: A Practical Guide; Unesco: Paris, France, 1991; Volume 49, ISBN 9231027530. [Google Scholar]
  4. Bailey, R.T.; Jenson, J.W.; Taboroši, D. Estimating the freshwater-lens thickness of atoll islands in the Federated States of Micronesia. Hydrogeol. J. 2013, 21, 441–457. [Google Scholar] [CrossRef]
  5. Koda, K.; Kobayashi, T.; Lorennji, R.; Robert, A.; DeBrum, H.; Lucky, J.; Paul, P. Freshwater Lens Observation: Case Study of Laura Island, Majuro Atoll, Republic of the Marshall Islands. Int. J. Biol. Life Agric. Sci. 2017, 10, 82–85. [Google Scholar] [CrossRef]
  6. Ayers, J.F.; Vacher, H.L. Hydrogeology of an Atoll Island: A Conceptual Model from Detailed Study of a Micronesian Example. Groundwater 1986, 24, 185–198. [Google Scholar] [CrossRef]
  7. Woodroffe, C.D.; Falkland, A.C. Geology and Hydrogeology of the Cocos (Keeling) Islands. Dev. Sedimentol. 2004, 54, 885–908. [Google Scholar] [CrossRef]
  8. Bailey, R.; Jenson, J.; Olsen, A.; Bailey, R.T.; Jenson, J.W.; Olsen, A.E. Estimating the Ground Water Resources of Atoll Islands. Water 2010, 2, 1–27. [Google Scholar] [CrossRef]
  9. Kumar, S.; Kruger, J.; Begg, Z.; Handerson, E.; Alvis, M. Multibeam Bathymetry Survey Rangiroa, French Polynesia; SPC Applied Geoscience and Technology Division (SOPAC): Suva, Fiji, 2013. [Google Scholar]
  10. Montaggioni, L.F.; Salvat, B.; Aubanel, A.; Eisenhauer, A.; Martin-Garin, B. The mode and timing of windward reef-island accretion in relation with Holocene sea-level change: A case study from Takapoto Atoll, French Polynesia. Geomorphology 2018, 318, 320–335. [Google Scholar] [CrossRef]
  11. Thornthwaite, C.W. An Approach toward a Rational Classification of Climate. Geogr. Rev. 1948, 38, 55. [Google Scholar] [CrossRef]
  12. Lanini, S.; Caballero, Y.; Seguin, J.-J.; Maréchal, J.-C. ESPERE—A Multiple-Method Microsoft Excel Application for Estimating Aquifer Recharge. Groundwater 2016, 54, 155–156. [Google Scholar] [CrossRef] [PubMed] [Green Version]
  13. Henry, H.R. Effect of Dispersion on Salt Encroachment in Coastal Aquifers; U.S. Geological Survey Water-Supply, Paper 1613-C; United States Geological Survey: Reston, VA, USA, 1964.
  14. Buddemeier, R.W.; Oberdorfer, J.A. Internal hydrology and geochemistry of coral reefs and atoll islands: Key to diagenetic variations. In Reef Diagenesis; Schroeder, J.H., Purser, B.H., Eds.; Springer: Berlin/Heidelberg, Germany, 1986; pp. 91–111. [Google Scholar]
  15. Jacob, B. Flow of Groundwater—Engineering Hydraulics; John Wiley: New York, NY, USA, 1950. [Google Scholar]
  16. Bailey, R.T.; Jenson, J.W.; Olsen, A.E. Numerical modeling of Atoll Island hydrogeology. Ground Water 2009, 47, 184–196. [Google Scholar] [CrossRef] [PubMed]
  17. Ayers, J.F. Shallow seismic refraction used to map the hydrostratigraphy of Nukuoro Atoll, Micronesia. J. Hydrol. 1990, 113, 123–133. [Google Scholar] [CrossRef]
Figure 1. Location of Rangiroa atoll island; (a) Pacific ocean map; (b) Tuamoto archipelago (c) Rangiroa island; (d) location of RGI_xxx wells on Avatoru and Vignes motus.
Water 14 02695 g001
Figure 2. Geological evolution of the Takapoto atoll according to time: (a) 6000–5500 years BP (b) 3000–2000 years BP (c) 2000–1200 years BP (d) 1000 years BP (e) Recent (modified after ref. [10]).
Water 14 02695 g002
Figure 3. Well RGI_021–fluctuations with time of groundwater level (red), electrical conductivity (yellow), and sea water level due to tides (blue) between October and December 2018.
Water 14 02695 g003
Figure 4. (a) Upper: water level fluctuations at well RGI_001 (red), ocean tides (green), and rainfall (blue histogram); (b) lower: monthly efficient rainfall computed using soil water budget with Smax = 20 mm.
Water 14 02695 g004
Figure 5. Relationship between natural recharge R and hydraulic conductivity K according to the modified Henry’s solution applied to three wells.
Water 14 02695 g005
Figure 6. Calculation of the piezometric surface area of the aquifer using Henry’s solution and the freshwater/salt water interface using the Ghyben–Hezberg solution on the Wine sector.
Water 14 02695 g006
Figure 7. (Upper) Unimodal tidal model fitted over the interval 25–29 September 2018 with a period of 12.31 h (wells are classified according to distance from the coast and the average level is arbitrary) (Lower) Table with diffusivities obtained by unimodal analysis, transmissivities obtained by pumping tests and deduced storages.
Water 14 02695 g007
Figure 8. Hydrogeological conceptual model of Rangiroa atoll (modified after ref. [2]).
Water 14 02695 g008
Figure 9. Evolution of the maximum thickness of the freshwater lens as a function of the atoll width for different Pacific atolls according to ref. [16]. Blue squares correspond to two motus (Vignes motu and Avatoru motu) of the Rangiroa atoll.
Water 14 02695 g009
Table 1. Characteristics of the pumping tests and obtained transmissivity.
Pumping WellWell Radius (m)Duration (min)Pumping Rate (m3/h)Transmissivity (m2/s)
RGI_0010.90601.43.2 × 10−4
RGI_0200.65396/13/16/211.7 × 10−3
RGI_0270.701200.42.1 × 10−3
RGI_1280.603/6/1035/14/181.7 × 10−3
RGI_2040.65451.27.7 × 10−4
Table 2. Characteristics of the wells to which the modified Henry’s relationship has been applied. * Average over the observation period (September 2018–February 2019). ** Hydraulic conductivity calculated from the transmissivity obtained by the pumping test and assumption of a higher aquifer with a thickness b = 10 m.
ParameterSymbol (Unit)RGI_001RGI_020RGI_027
Length of the sectionL (m)840360860
Distance to nearest sea coastx (m)310165400
Average water level *h (m.a.s.l)0.590.20.15
Transmissivity **T (m2/s)3.2 × 10−41.7 × 10−32.1 × 10⁻³
Hydraulic conductivityK (m/s)3.2 × 10−51.7 × 10−42.1 × 10⁻⁴
Publisher’s Note: MDPI stays neutral with regard to jurisdictional claims in published maps and institutional affiliations.

