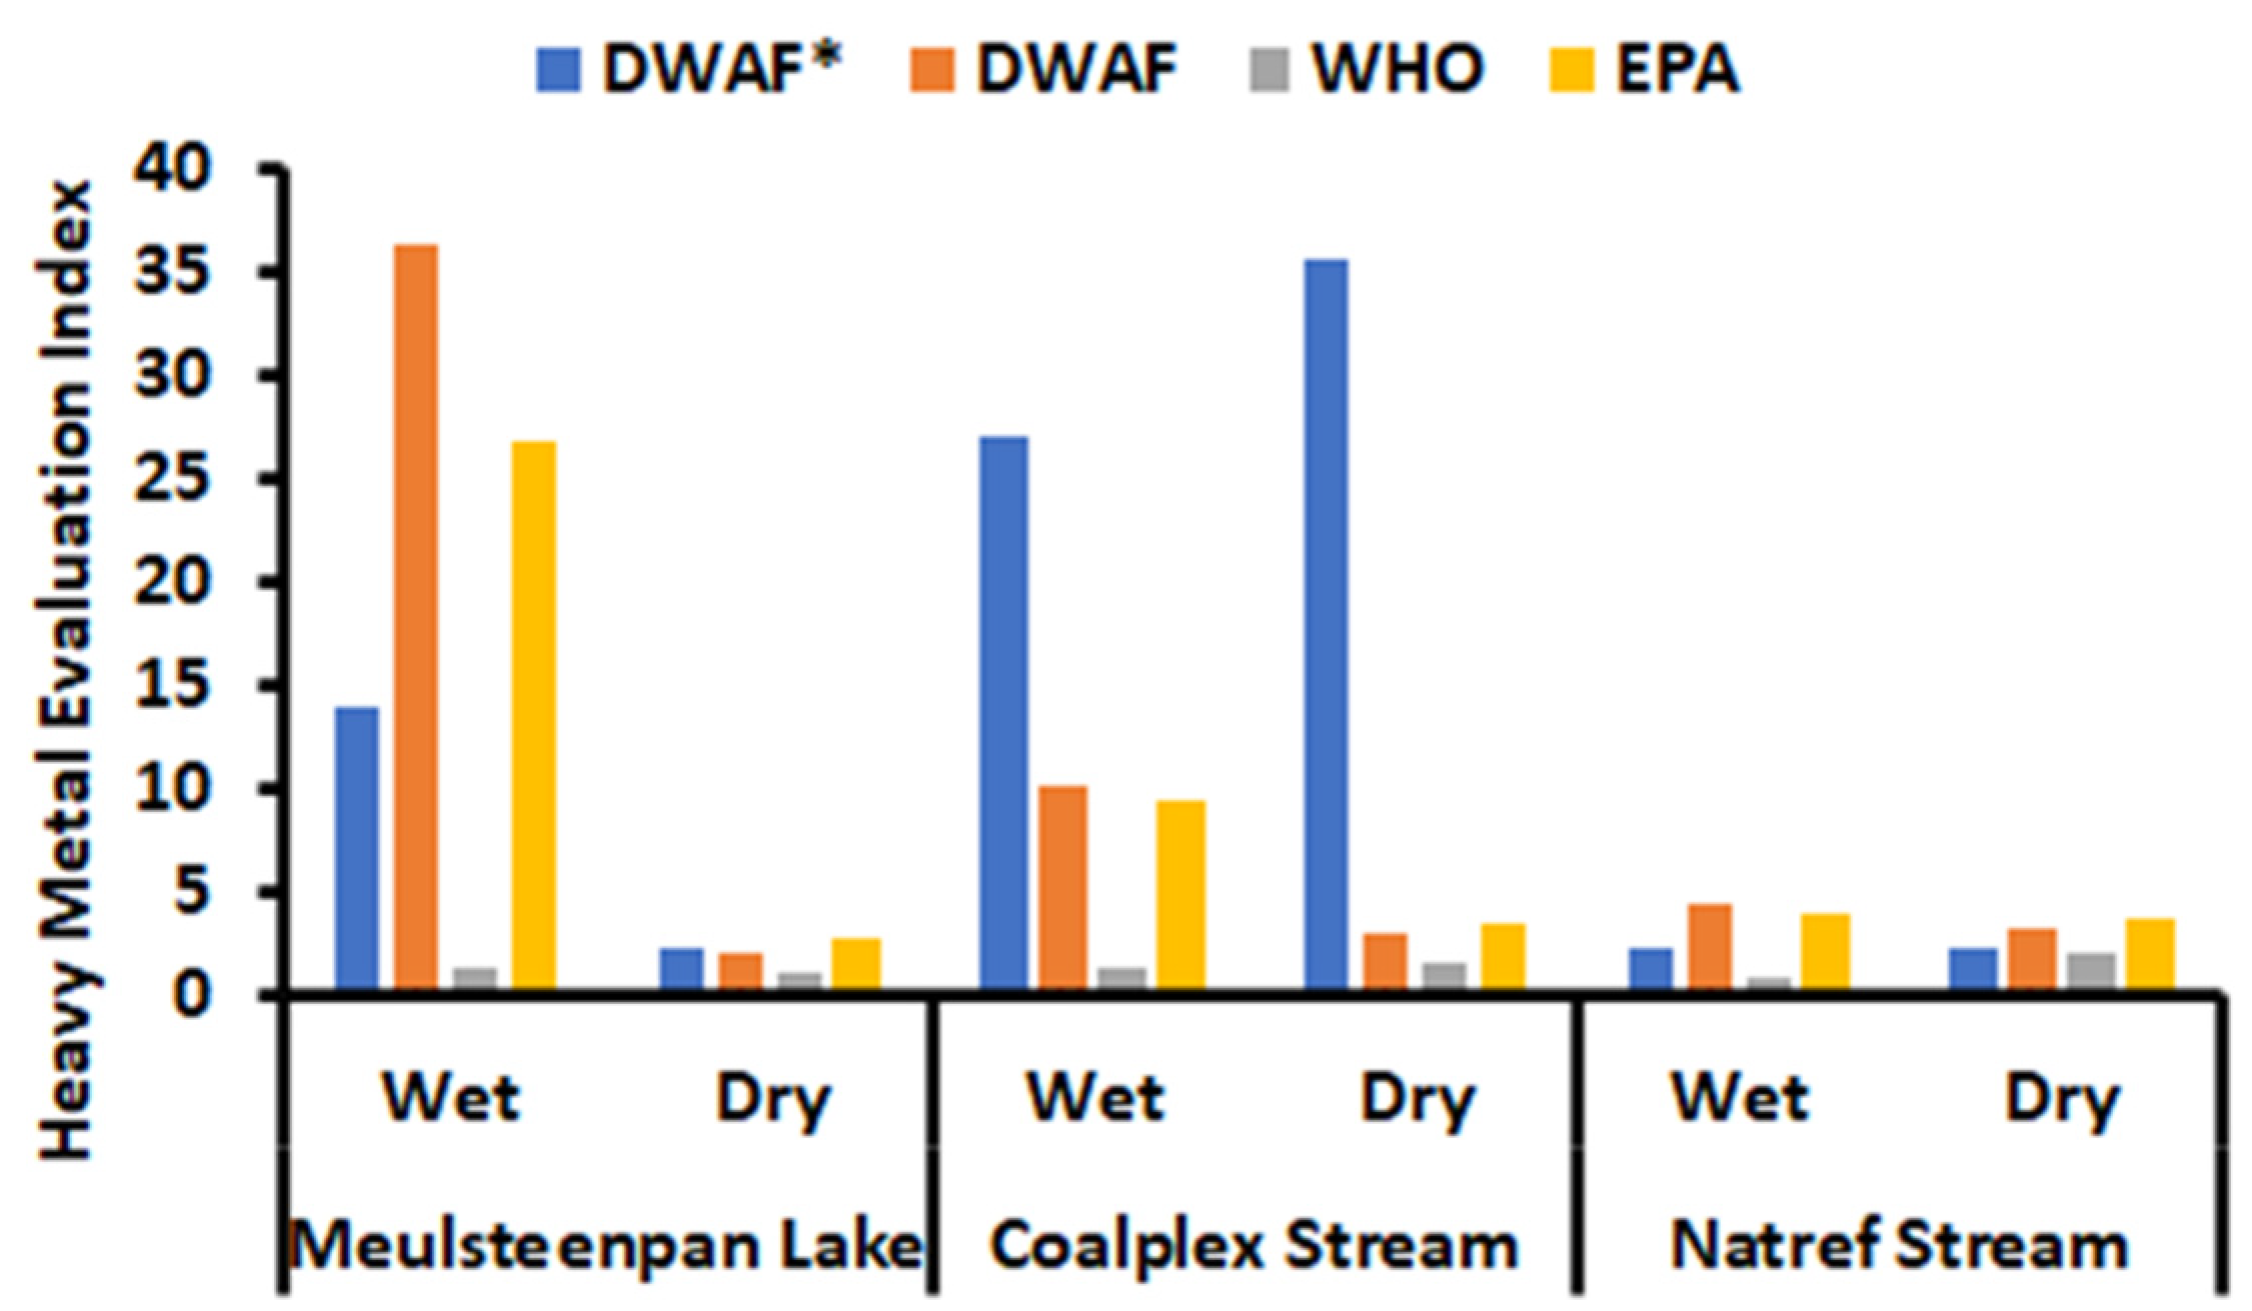
Article

Evaluation of Surface Water Quality Using Various Indices for Heavy Metals in Sasolburg, South Africa

by
Vuyo Moses Mollo
1,2,
Philiswa N. Nomngongo
1,2,* and
James Ramontja
1,*
1
Department of Chemical Sciences, University of Johannesburg, Doornfontein Campus, P.O. Box 17011, Johannesburg 2028, South Africa
2
Department of Science and Innovation-National Research Foundation South African Research Chair Initiative (DSI-NRF SARChI) in Nanotechnology for Water, University of Johannesburg, Doornfontein, Johannesburg 2028, South Africa
*
Authors to whom correspondence should be addressed.
Water 2022, 14(15), 2375; https://doi.org/10.3390/w14152375
Submission received: 28 June 2022 / Revised: 26 July 2022 / Accepted: 28 July 2022 / Published: 31 July 2022
(This article belongs to the Section Water Quality and Contamination)

Abstract

:
The purpose of the study was to determine the concentrations of heavy metals in surface waters used for domestic and farming activities. This study investigated various water quality parameters, including pH, electrical conductivity (EC), total dissolved solids (TDS), and major and trace elements such as Al, As, Cd, Co, Cr, Fe, Mn, Mo, Ni, Pb, Sb, Se, Sr, Tl, and V, which were investigated during the dry and wet seasons from samples collected at Meulsteenpan Lake, Coalplex Stream, and Natref Stream in Sasolburg, Free State, South Africa (2019–2020). The results revealed that the pH of water collected from Meulsteenpan Lake (7.86–7.89) and Coalplex stream (7.13–7.37) were within the Department of Water Affairs and Forestry (DWAF), World Health Organization (WHO), and Environmental Protection Agency (EPA) permissible guideline values for domestic and agricultural use. On the other hand, the pH from Natref stream (6.16–7.68) was within the permissible guideline values set by the DWAF for domestic use but below the permissible guideline values set by the WHO and EPA for domestic use, and the DWAF for agricultural use. The mean TDS and EC values in Meulsteenpan Lake (796–980 mg/L) and (1.20–2.00 mS/m) exceeded permissible guideline values set by the DWAF and WHO domestic use for TDS, Coalplex stream (309–326 mg/L) and (0.65 mS/m), and Natref Stream (269–413 mg/L) and (0.89–0.96 mS/m) were within the permissible guideline values for the DWAF and WHO domestic use for TDS. The results obtained for metal concentration revealed higher mean concentrations for Al, Fe, and Mo, Mn in the study area, which could pose adverse health risks to aquatic life and humans. Various pollution and health assessments (Cf, m-Cd, m-HPI, HEI, NEI, and WQI) were used to evaluate the quality status of the surface water on all sampling sites. WQI revealed that in the wet and dry seasons, surface waters from Coalplex Stream and Natref Stream had “excellent” water quality, while Meulsteenpan Lake had “excellent” water quality in the dry season, but in the wet season, the water quality was “unsuitable for drinking”.

1. Introduction

Water contamination is a huge environmental concern worldwide [1]. Sasolburg is an industrial town in the Free State province not far from the Vaal triangle and has been pointed out as one of the hotspots of pollution due to anthropogenic activities that released wastewaters in some of the water streams and pathways [2]. This, in turn, affects the quality of the water bodies that causes them to depreciate, since large amounts of wastewaters containing different pollutants, including trace heavy metals, are released, and result in the water being unsuitable for domestic use [3]. Surface water (rivers and streams) has several uses such as consumption (drinking), irrigation, and farming to name a few, and is helpful to humans, animals, and the environment. Therefore, there is a need to monitor heavy metal contamination in preventing environmental deterioration and reduction in biodiversity [4].
Natural processes and anthropogenic activities are the two main contributors of heavy metals into the environment. Weathering and atmospheric deposition are regarded as natural processes, while industrial waste and sewage are categorized as anthropogenic activities [5]. Industries such as mining, mineral processing, agricultural activities, fossil fuel processing, plating, battery productions, smelting, and paint industries are responsible for the introduction of heavy metals into water systems [6]. Unfavorable effects are experienced when concentrations of heavy metals exceed environmental water guidelines. The use of contaminated water for agricultural and domestic purposes could be harmful to human and animal health [7]. Some of these heavy metals (cadmium and lead) are toxic even at trace levels, while others are essential (such as copper, iron, cobalt, and zinc, among others) to the biological system of humans and animals [8].
Accumulation of metals in the environment depends on a variety of variables, such as pH, EC, TDS, CO, metal concentration, anthropogenic sources, and other parameters. Heavy metal exposure remains a major concern, particularly in undeveloped countries, despite their awareness to humans and the environment [9]. The studied heavy metals were chosen due to the type of industries and potential health risk they cause towards humans and animal life surrounding Sasolburg. Mercury (Hg) was not available during the initial screening of the surface water samples. Therefore, this emphasizes the need to assess the water quality and contamination of surface water in Sasolburg, which is often used by residents of surrounding areas for domestic and agricultural needs. Therefore, the study aimed to assess the status of water quality from surface waters, quantify heavy metal concentration, and determine possible health risks due to its exposure to heavy metals.

2. Materials and Methods

2.1. Study Area

The study was conducted in the Meulsteenpan Lake (26.8692° S, 27.8806° E), Coalplex stream (26°49′41.4″ S 27°53′45.6″ E), and Natref stream (26°48′18.7″ S 27°52′33.9″ E) in the north of the Free State province of South Africa in Sasolburg—an industrial town which is sub-divided into Sasolburg, Vaalpark and Zamdela. Sasolburg is located on the east side of Taaibosspruit and adjacent to that stream are industrial areas in the Vaal Triangle. Residential areas are south of the stream and farming practices are to the west [10]. Weather patterns from this region can differ significantly from west to east. The highest temperatures are mainly experienced in January and temperatures that are lower are experienced in July [11]. In spring and summer seasons (Oct–Apr) there are extremely high volumes of rainfall experienced, although December and January are the peak months for rainfall [11]. Average rainfall per year ranges around 600 mm and 800 mm, with a likelihood for evaporation between 1300 mm and 1700 mm annually [11].

2.2. Sample Collection

Water samples were collected from selected streams: Meulsteenpan Lake, Coalplex stream, and Natref stream. The procedure for sampling was carried out in the dry and wet seasons of 2019 and 2020. In the process of sampling, 1 L polyethylene bottles were cleaned with detergent and rinsed with water until they were detergent-free. In the field, the bottles were initially rinsed with water from the selected streams before collection. Samples were collected in duplicate for each sampling site and were collected by dipping the polyethylene bottles into water surface streams with an open-end faced to allow the water to flow in for each sample. Samples were placed in an icebox and transported to the laboratory for further analysis and were preserved by the addition of a few drops of nitric acid (HNO3) and stored in a ±4 °C refrigerator before analysis.

2.3. Sample Analysis

Physicochemical parameters (pH, EC, TDS) were measured. Electrical conductivity (EC) and total dissolved solids (TDS) were measured using digital meters (Ohaus, Conductivity pen meter ST20C-B and Ohaus ST20T-B TDS pen meter with temperature), while pH was also measured by using pH meter (Ohaus, ST20 pH pen meter). In the laboratory, samples were filtered with Millipore syringe filter papers (0.22 µm). The concentration of heavy metals was analyzed using the inductively coupled plasma–optical emission spectrometry (ICP-OES) (iCAP 6500 Duo, Thermo Scientific, Manchester, UK). Samples were analyzed in batches, which consisted of a procedural blank. Quality standards were used to assess each calibration curve before the bundle of samples was analyzed. Water samples were initially filtered using 0.22 µm syringe polyvinylidene difluoride membrane filters and elements analyzed were Al, As, Cd, Co, Cr, Cu, Fe, Mn, Mo, Ni, Pb, Sb, Se, Sr, Tl, and V. The precision of the analysis was carried out in a triplicate analysis for each sample.

3. Pollution Indices

To assess heavy metal contamination in water for the study, the following pollution indices were applied: Contamination Factor (Cf) [12]; Modified Degree of Contamination (m-Cd) [13]; Modified Heavy Metal Index (m-HPI) [14]; Heavy Metal Evaluation Index (HEI) [14]; Nemerov Index (NeI) [14]; Weighted Arithmetic Water Quality Index (WQI) [15], Estimated Daily Intake (EDI) [16], Non-Carcinogenic Risk of Water Consumption (HQ) [16], Carcinogenic Risk of Water Consumption (R) [16]. Formulas are presented in Supplementary Information.

4. Results

4.1. Physiochemical Parameters

The pH has an influence on the toxicity of heavy metals, non-metallic ions, and vital metals for metabolic activities in humans. Metals such as aluminum, cadmium, cobalt, copper, manganese, nickel, and lead are most likely to be unfriendly to the environment because of low pH levels in water [17]. Table 1 represents the physiochemical parameters found in surface water collected from Meulsteenpan Lake, Coalplex stream, and Natref stream during the dry and wet season. The mean pH values for Meulsteenpan Lake, Coalplex stream, and Natref stream for the dry season were 7.86, 7.37, and 7.68, while for the wet season, they were 7.89, 7.13, and 6.17, respectively. These results showed that the pH values from all three sampling sites in the dry season were within the neutral range and within the permissible guideline values by the DWAF, WHO, and EPA. While during the wet season, it was noticed that the pH for Natref stream was acidic and below the permissible guideline values for the DWAF agricultural use, WHO domestic use, and EPA domestic use. In the wet season, Meulsteenpan Lake and Coalplex stream had pH values that were slightly alkaline but were within permissible guideline values donated by the DWAF, WHO, and EPA domestic use and the DWAF agricultural use. Alkaline water is considered safe for drinking but has adverse side effects, such as reducing the acidity found in the stomach, which helps remove or destroy bacteria and other unwanted organisms from the bloodstream [18]. For the majority of aquatic life, a pH range of 6.5–8.5 is acceptable, with the acid and alkalinity death levels at pH 4 and 11 [19].
Total dissolved solids (TDS) are mainly made up of inorganic salts dissolved in water. Ions such as Ca2+, Mg2+, Na+, K+, SO42−, Cl, and HCO3 are found in TDS at different concentrations in waters [20]. In Table 1, TDS concentrations from all sampling sites for both dry and wet seasons are listed. The mean TDS concentrations of Meulsteenpan Lake throughout the study were the highest. In the dry and wet seasons, the average TDS concentrations for each sampling area were 796 mg/L and 980 mg/L for Meulsteenpan Lake, 309 mg/L and 326 mg/L for Coalplex stream and 269 mg/L and 413 mg/L for Natref stream. Mean TDS concentrations from Coalplex and Natref streams were both below the maximum permissible guideline value of <450 mg/L for the DWAF domestic use and <600 mg/L for the WHO domestic use in the dry and wet seasons, while Meulsteenpan Lake recorded mean TDS concentrations above the maximum permissible guideline value set by the DWAF and WHO for domestic use for both dry and wet seasons. TDS mean concentrations of these surface waters from all sampling/study areas for the DWAF agricultural use (<40 mg/L) were above the recommended permissible guideline for the entire study period and may not be considered as irrigation water for agricultural purposes. Detrimental health effects on both human and animals are experienced in water with high TDS due to its adverse effect on feed intake, absorption and its utilization [21].
Electrical current (EC) in water is carried out by charged ions. Therefore, the greater the conductivity, the greater the concentration of dissolved solids in most water [22]. High EC values indicate a significant number of ionic compounds in water [23]. Conductivity concentrations for each sampling site are listed in Table 1. Mean EC levels for Meulsteenpan Lake in the dry and wet seasons were 1.20 mS/m and 2.00 mS/m, while for Coalplex stream, they were 0.65 mS/m for both dry and wet seasons, and for Natref stream, they were 0.96 mS/m for the dry season and 0.89 mS/m for the wet season. The highest EC mean concentrations recorded were in the wet season, with Meulsteenpan Lake having concentrations for both dry and wet seasons above the DWAF permissible guideline values for domestic use (<0.7 mS/m). Coalplex stream recorded average EC concentrations below the permissible guideline value for both the DWAF domestic use (<0.7 mS/m) and the EPA domestic use (<2.5 mS/m), while Natref stream had an average EC concentration for the dry and wet season below the permissible guideline value for the EPA domestic use (<2.5 mS/m), with the dry and wet seasons having an average EC concentration above for the DWAF domestic use (<0.7 mS/m).

4.2. Heavy Metal Concentrations in Surface Water

4.2.1. Arsenic (As)

The mean concentrations for arsenic in the dry and wet seasons ranged from 0.62–3.63 ug/L, 4.30–10.2 ug/L, and 2.18–10.6 ug/L in Meulsteenpan Lake, Coalplex stream, and Natref stream, respectively, in Table 2. The concentration of As in all water samples collected from the three study areas was below the guideline values of <100 ug/L donated by the DWAF for agricultural use, as seen in Table 3. For Meulsteenpan Lake, the dry and wet season had low mean concentrations for arsenic in which complied with the permissible guideline values set by the DWAF, WHO, and EPA for domestic use. The dry season for Coalplex stream had a higher mean concentration compared to the wet season for arsenic. The mean concentration for arsenic in the dry season was 10.2 ug/L, which exceeded the domestic guideline limits set by the DWAF, WHO, and EPA. Natref stream recorded high mean concentration in dry season. The average mean of 10.6 ug/L was above the guideline values for domestic use donated by the DWAF, WHO, and EPA. High concentrations of As from these two sites originate from coal combustion and pesticide application [24], since both sites are located next to a coal mine, and agricultural site high levels of As may be expected. Elevated concentrations of arsenic in water have detrimental effects on the environment and humans. Arsenic has no significant contribution to the metabolic system of the human body and studies have shown that multiple cancers are associated with a high intake and accumulation of arsenic through the indigestion of the metal via drinking water [25].

4.2.2. Cadmium (Cd)

The mean concentrations of cadmium in water samples collected from Meulsteenpan Lake, Coalplex stream, and Natref stream in the dry and wet seasons ranged from 0.36–1.03 ug/L, 0.06–0.21 ug/L, 0.07–0.77 ug/L, respectively, in Table 2. The detected concentrations for cadmium in all three sites were below the permissible guideline limits for the WHO, DWAF, and EPA for domestic and agricultural use, as seen in Table 3. Even though the levels were generally below the permissible guideline values, it was observed that during the dry season, relatively high mean concentrations of Cd were observed at Meulsteenpan Lake and Natref stream and need monitoring, because excessive exposure to cadmium has several acute and chronic effects on the human body [26]. When the metal enters the human biological system, it accumulates in the kidney, and this may lead to the development of kidney stones. Other critical effects of cadmium exposure are the ability to interrupt body metabolism and high exposure to the metal may cause cancer [26]. Although the concentrations of Cd were detected in trace levels, long-term exposure affects vital organs such as the liver and kidney cortex because 30–60% of the ingested Cd is deposited in these organs [27]. In addition, the presence of Cd in the environment is detrimental even at low concentrations because it tends to reduce the uptake of zinc by plants and animals [28,29,30].

4.2.3. Cobalt (Co)

Mean concentrations for dry and wet seasons ranged from 2.61–9.01 ug/L, 2.08–10.8 ug/L, and 6.72–8.78 ug/L for water samples collected from Meulsteenpan Lake, Coalplex stream, and Natref stream, respectively, in Table 2. No domestic permissible guidelines values were reported for cobalt by the DWAF, WHO, and EPA for domestic use, as seen in Table 3. For the DWAF agricultural use, the average concentrations in all three sites during the dry and wet seasons were below the guideline value of <50 ug/L, as seen in Table 3. Cobalt compounds are easily dissolvable and far more toxic than those that are difficult to dissolve in water. When the metal enters the human body, it spreads to vital organs such as the liver, kidney, and bones [6].

4.2.4. Chromium (Cr)

The mean concentrations of Cr in surface water samples in the dry and wet seasons ranged from 2.17–3.93 ug/L, 0.30–1.29 ug/L, and 1.86–2.07 ug/L in Meulsteenpan Lake, Coalplex stream, and Natref stream, respectively, in Table 2. The mean concentrations were below the permissible guideline values set by the DWAF, WHO, and EPA of < 50 ug/L for domestic use and <100 ug/L for the DWAF agricultural use, in Table 3. Higher mean concentrations for Meulsteenpan Lake were detected in the wet season, while for Coalplex stream and Natref stream, higher concentrations were witnessed in the dry season. The high concentration of Cr during the wet season could be due to the leaching of metals from the soil to surface waters. It should be noted that Coalplex and Natref streams are located close to fossil fuel operations that might lead to high Cr levels compared to Meulsteenpan Lake. The contribution of industries on the concentration of Cr in surface water has been reported in Greece [31], India [32], and South Africa [33].

4.2.5. Copper (Cu)

Copper is an essential metal for metabolic use and is also considered a contaminant in drinking water. The primary source of copper intake is food and water [8]. The results obtained in this study revealed that water samples in the dry and wet seasons from Meulsteenpan Lake, Coalplex stream, and Natref stream contained average mean Cu concentrations of 3.91–8.25 ug/L, 2.42–4.61 ug/L, and 5.97–7.38 ug/L, respectively, in Table 2. Mean concentrations analyzed on all sites were below the guideline values of <1000 ug/L for the DWAF, <2000 ug/L for the WHO and EPA for domestic use, and <200 ug/L for the DWAF agricultural use, as seen in Table 3. The threshold for the effects of copper in drinking water on the gastrointestinal tract has been delineated in recent research, but there is still some confusion as to the long term effects of copper on susceptible populations, such as Wilson disease gene carriers and other copper homeostasis metabolic disorders [25].

4.2.6. Iron (Fe)

The mean concentrations of Fe throughout the study for Meulsteenpan Lake, Coalplex stream, and Natref stream in the dry and wet seasons ranged from <DL–2077 ug/L, 52.0–279 ug/L, and 4.96–115 ug/L, respectively, in Table 2. Permissible guideline values for the WHO were not documented for Fe. High mean concentrations in the wet season on all three study areas were recorded. No iron concentrations were detected in Meulsteenpan Lake in the dry season, while in the wet season, a mean concentration of 2077 ug/L was analyzed, which exceeded the guideline values set by the DWAF and EPA for domestic use, in Table 3. The high concentration levels from these surface waters may be due to waste released from industrial factories or a non-point source from rainwater runoff. At concentrations greater than 300 ug/L, iron damages laundry and plumbing components [25].

4.2.7. Manganese (Mn)

The results obtained in this study showed that the mean concentrations of manganese in the dry and wet seasons ranged from 10.9–568 ug/L, 34.9–272 ug/L, and 40.7–60.4 ug/L from Meulsteenpan Lake, Coalplex stream and Natref stream, respectively, in Table 2. The permissible guideline values set by WHO domestic use were not available. In the wet season, high mean concentrations of manganese were analyzed from all three sites which exceeded the permissible guideline limits donated by <50 ug/L for the DWAF and EPA domestic use and <20 ug/L for the DWAF agricultural use, as seen in Table 3. While in the dry season, mean concentrations of manganese in Meulsteenpan Lake were within accordance with permissible guideline limits donated by <50 ug/L for the DWAF and EPA domestic use and the DWAF agricultural use, as seen in Table 3. For Coalplex stream and Natref stream, mean concentrations found in the dry season complied with the permissible guideline values set by <50 ug/L for the DWAF and EPA domestic use but exceeded the guideline values set by the DWAF for agricultural use, as seen in Table 3, rendering the surface water not good for irrigational purposes. Although manganese is an essential element, excessive exposure to the metal can be harmful to humans and may cause neurotoxicity. Manganism is a neurological disease caused by a high exposure to manganese with similar symptoms as Parkinson’s disease such as gait disorder, action tremor, rigidity, bradykinesia, memory dysfunction, and mood disorder [8].

4.2.8. Molybdenum (Mo)

Table 2 shows the average mean concentrations of Mo in the surface water collected during the dry and wet seasons were found to be 7.11–7.59 ug/L, 208–341 ug/L, and 3.33–3.38 ug/L for Meulsteenpan Lake, Coalplex stream, and Natref stream respectively. There were no permissible guideline values supplied for molybdenum by the DWAF, WHO, and EPA for domestic use, as seen in Table 3. Coalplex stream had high concentrations of Mo for both dry (341 ug/L) and wet (208 ug/L) seasons, which exceeded the permissible guideline value set by the DWAF of <10 ug/L for agricultural use, in Table 3. The mean concentrations of Mo at Natref stream and Meulsteenpan Lake were within the permissible guideline value of < 10 ug/L for the DWAF agricultural use, Table 3. A high concentration experienced at Coalplex stream owes it to the stream being near mining facilities. The WHO (2017) [25] reported that concentration levels greater than 200 ug/L may be recorded in areas located near to mines.

4.2.9. Nickel (Ni)

As seen on Table 2, the mean concentrations in the dry and wet seasons for nickel in Meulsteenpan Lake were 0.09–0.68 ug/L; for Natref stream, they were <DL–0.67 ug/L; and for Coalplex stream, nickel was not detected throughout the entire study period. Permissible guideline values set by the DWAF for domestic use were not available, as seen in Table 3. Mean concentrations on all three study areas were below the permissible guideline values of <70 ug/L and <20 ug/L for the WHO and EPA domestic use, and <200 ug/L for the DWAF agricultural use, Table 3. Nickel is a very harmful metal and is considered carcinogenic by the International Agency for Research on Cancer (IARC). For non-smokers or people exposed to it occupationally, its main source of exposure is food [25].

4.2.10. Lead (Pb)

The mean concentration of Pb found in Table 2 from Meulsteenpan Lake, Coalplex stream and Natref stream ranged from 2.15–2.66 ug/L, 0.87–3.81 ug/L, and 2.15–3.21 ug/L for both dry and wet seasons, respectively. All water samples throughout the study obtained mean concentrations below the standard guideline values of <10 ug/L set by the DWAF, WHO, and EPA for domestic use, and <200 ug/L set by the DWAF for agricultural water use, as seen in Table 3. Lead is a cumulative metal and exposure to Pb is extremely harmful both on humans and the environment and is of concern to many parts of the world. Symptoms associated with Pb poisoning are headache, irritability, and abdominal pain. When higher concentrations of Pb are found, they may cause kidney dysfunction and brain damage [8].

4.2.11. Antimony (Sb)

Exposure to antimony is primarily through food and water, even though it has minimal contribution compared to occupational exposure. When combined with lead, copper, and tin, the metal forms very hard alloys [25]. Mean concentrations for Sb detected in Meulsteenpan Lake ranged 1.05–4.57 ug/L; while for Coalplex stream they ranged 2.27–3.49 ug/L; and for Natref Stream, they were 0.87–1.57 ug/L, as seen in Table 2. Standard guideline values set by the DWAF were not available for Sb for both domestic and agricultural use, as seen in Table 3. In Meulsteenpan Lake, Coalplex stream, and Natref stream, the mean concentration levels were below the standard guideline values of < 20 ug/L and <5 ug/L set by the WHO and EPA, although seasonal monitoring is still needed.

4.2.12. Selenium (Se)

The mean concentrations of selenium in this study were found to be 15.5–15.6 ug/L for Meulsteenpan Lake, 6.27–7.47 ug/L for Coalplex stream, and 6.47–8.27 ug/L for Natref stream for both dry and wet seasons, respectively, as seen in Table 2. The average mean concentrations of Se on all three sites were below the permissible guideline values of < 20 ug/L set by the DWAF domestic use and agricultural use, as seen in Table 3; Natref stream and Coalplex stream had average concentrations below the permissible value of <10 ug/L set by the EPA except for Meulsteenpan Lake during the dry and wet seasons, which exceeded the guideline value of <10 ug/L set by the EPA domestic use. Se concentrations on all sampling sites were below the permissible guideline value of <40 ug/L donated by the WHO domestic use, Table 3. High concentrations of selenium in these surface waters may be caused by the mobility of selenium compounds dissolved in the wastewater released from industries. Surface waters may also receive large concentrations of selenium from the atmosphere through the rain [34,35]. Exposure to high concentrations of selenium may lead to vomiting, nail change, loss of energy, and irritability [25].

4.2.13. Vanadium (V)

In this study, the mean concentrations for vanadium for Meulsteenpan Lake, Coalplex stream, and Natref stream in the dry and wet seasons ranged from 14.2–22.0 ug/L, 9.22–15.0 ug/L, and 13.1–14.6 ug/L for both dry and wet seasons, respectively, as seen in Table 2. The permissible guideline values for vanadium were not available for the WHO and EPA domestic use, as seen in Table 3. The mean concentrations detected in the water samples for vanadium were all below the standard permissible guideline of <100 ug/L set by the DWAF for domestic and agricultural use, Table 3. Exposure to high concentrations of vanadium may cause respiratory disorders, paralysis, and negative effects on the liver and kidney [36].

4.3. Qualitative Analysis

The analytical performance of the suggested approach, found in Table 4, in terms of limit of detection (LOD), limit of quantification (LOQ), and linearity (LR) were examined under ideal experimental circumstances.
The calibration curves were produced after processing a series of solutions made with multi-element standard (0–6000 ug/L). The following formulas were used to determine the LOD and LOQ:
LOD = 3 × Sd/m
LOQ = 10 × Sd/m
where Sd is the standard deviation and m is the gradient.

4.4. Pollution Assessment on Surface Water

4.4.1. Contamination Factor (Cf)

Table 5, Table 6, Table 7 and Table 8 represent contamination factors (Cf) for all the metals in the surface water collected from Meulsteenpan Lake, Coalplex stream and Natref stream during the dry and wet season. The values were calculated using the DWAF, WHO, and EPA permissible values for domestic and the DWAF agricultural uses. The Cf for the investigated metals differ based on the sampling site. For example, the Cf values for As showed moderate contamination (1≤ Cf ≤ 3) and low contamination (Cf < 1), as seen in Table 5, Table 6, Table 7 and Table 8 for all sampling sites, suggesting that the source of As in surface water comes from industrial activities.
During the wet season, a significant increase in the contamination factor was observed for Meulsteenpan Lake. The Cf for most of the metals was >1, showing that the contamination ranged from moderate to very high (Table 5, Table 6, Table 7 and Table 8). As seen in Table 5, iron and manganese had very high contamination factor values (Cf ≥ 6). These findings suggest that most of the metals leached into the surface water and are not suitable for consumption without treatment.
In Table 8, the DWAF permissible guideline values for agricultural use were used to assess the contamination factor for each metal. Table 8 shows a low contamination factor for most metals Cf < 1, except Mo in the Coalplex stream in both wet and dry seasons had very high Cf ≥ 6. Mn in all three sampling sites was high in the wet season compared to the dry season, suggesting high contamination of Mn being introduced into the surface waters due to rain and wastewater wash-off. Based on the results, this shows that the study area is highly affected by heavy metal contamination and regular assessments should be followed due to bioaccumulation. In general, the decreasing order Cf of sampling sites based on heavy metal contamination was Meulsteenpan Lake > Coalplex Stream > Natref Stream using the DWAF, WHO, and EPA permissible guideline values for domestic use and Coalplex stream > Meulsteenpan Lake > Natref Stream using the DWAF permissible guideline values for agricultural use.

4.4.2. Modified Degree of Contamination (m-Cd)

Results presented in Table 9 show the modified degree of contamination when all metals are taken into consideration. Modified degree of contamination for this study exhibited moderate, low, and nil to a very low degree of contamination. This also shows that the highest contamination was experienced in the wet season. As expected, these results correlated with the contamination factor.

4.4.3. Modified Heavy Metal Pollution (m-HPI)

Modified heavy metal pollution was used to assess the heavy metal pollution in surface water from the study area in both dry and wet seasons. The values for m-HPI are presented in Table 10 and ranged 0.54–10.5. Based on the results obtained, only 8.3% of the samples were unacceptable for domestic and agricultural use, with 91.7% of the samples ranked as excellent to good in the study area. The highest recorded values were 6.73 and 10.56 at Coalplex stream using the DWAF permissible standards set for agricultural use. This high status may be due to the high release of contaminants from industrial wastewater.

4.4.4. Heavy Metal Evaluation Index (HEI)

Figure 1 represents HEI results for the study area for the dry and wet seasons. HEI results ranged 0.74–36.3 with seventy-five percent (75%) of the results falling into category one (low < 10). Meulsteenpan Lake (wet season), on average, had the highest contamination throughout the entire study period.

4.4.5. Nemerow Index (NeI)

Figure 2 represents Nemerow index (NeI) results. Results obtained from the study area of all three sites showed that low contamination was experienced throughout the study period. All results were in category one and results ranged 0.019–0.47.

4.5. Water Quality Index (WQI)

As seen in Figure 3, WQI for all surface waters was determined for both wet and dry seasons using permissible guideline values set by the DWAF for domestic use, for Coalplex Stream, and Natref Stream based on the classification of WQI standards, the water quality was good for drinking purposes for both wet and dry seasons. For the dry season, Meulsteenpan Lake had “good for drinking” water quality and had “unsuitable for drinking purposes” water quality for the wet season, which is due to the high concentrations of Fe detected.

4.6. Health Risk Assessment

According to our findings on water quality for Meulsteenpan Lake, Coalplex stream, and Natref Stream in the wet and dry seasons, it was revealed that surface water from this region was contaminated with trace and heavy metals. Although there are no legal control studies of water quality from the investigated source, health risk assessment was used to assess the quality of these waters as they are still consumed.

4.6.1. Estimated Daily Intakes (EDI)

EDI values of water consumption for all three sampling sites are presented in Table 11, Table 12 and Table 13. EDI values were calculated using the metal concentrations analyzed from water samples. Evaluation of EDI values were conducted for men, women, and children. Calculated EDI values were compared to Minimal Risk Levels (MRLs) derived by the Agency for Toxic Substances and Disease Registry (ATSDR) [37] for chronic or intermediate oral exposure. MRL values for Fe, Ni, Pb, and Tl were not available. In Meulsteenpan Lake and Coalplex stream, MRL values for men, women, and children were exceeded for majority of metal parameters in wet and dry seasons, except for Al in the dry season for men and women which was below the prescribed MRL values. For Natref stream, MRL values for men, women, and children were exceeded in all metal parameters for both wet and dry seasons.

4.6.2. Non-Carcinogenic Risk of Water Consumption (HQ)

Calculated values of Non-Carcinogenic Risk (HQ) are presented in Table 14. The evaluated risk values showed existing risk, using concentrations of the elements measured in water (HQ > 1) for As and Tl. For As, the HQ values were high at Coalplex and Natref stream for men, women, and children in the dry season because the concentrations determined in the water samples were above the permissible guideline values set by the DWAF, WHO, and EPA for domestic use. Although no permissible guideline values were available for Tl, the HQ values for the element were very high in all sampling sites for men, women, and children in both wet and dry seasons, showing large contamination from the heavy metal in surface waters.

4.6.3. Carcinogenic Risk of Water Consumption (R)

Carcinogenic risk values (R) are presented in Table 15 and are listed in the following order: Meulsteenpan Lake men (wet): As > Cr > Pb (dry) As ≥ Cr > Pb, women (wet): As > Cr > Pb (dry) Cr > As > Pb, children (wet): As > Cr > Pb (dry) As ≥ Cr > Pb. Coalplex stream men (wet): As > Cr ≥ Pb (dry) As > Cr > Pb, women (wet): As > Cr > Pb (dry) As > Cr > Pb, children (wet): As > Cr > Pb (dry) As > Cr > Pb. Natref stream men, women, children for both wet and dry season: As > Cr > Pb. Based on USEPA, (1989) [38] carcinogenic risk (R) values for As, Cr, and Pb all exceeded the prescribed risk level (R > 1 × 10⁻³) for all sampling sites except for Pb in Coalplex stream in the dry season for men, women, and children.

5. Conclusions

In this study, physiochemical parameters (pH, EC, TDS), heavy metals, and pollution assessments were applied to assess the surface water quality/contamination. Physiochemical parameters for the study area were measured and Meulsteenpan Lake had high pH, TDS, and EC as compared to Coalplex stream and Natref stream. The lowest pH results recorded at Natref stream suggested that the surface water was acidic due to industrial waste, and they were found to be above the permissible guideline limits. The heavy metal results revealed that Al, Fe, Mo, and Mn were detected in high concentrations in all sites as compared to other investigated metals. In a study conducted by [39], it was determined that high heavy metal concentrations of Fe, Co, Ni, Cu, Zn, Cd, and Pb were found next to Bonab Industrial Estate. A study by [40] found high heavy metal concentrations of Mn, Fe, and As on the sites they conducted studies on. Additionally, the mean concentrations for the three study areas in all heavy metals exhibited high concentrations, especially in the wet season, which exceeded the permissible guideline values donated by the DWAF, WHO, and EPA. Pollution indices showed that the surface water was exposed to heavy metal contamination. The contamination factor (Cf) revealed the effect of contamination posed by each metal to these surface waters, with iron and manganese having very high contamination Cf >6. The degree of contamination exhibited moderate, low, and nil to a very low degree of contamination. Modified heavy metal pollution index, heavy metal evaluation index, and Nemerow index showed that the majority of the investigated surface water had low contamination. Water Quality Index showed that Meulsteenpan Lake had poor water for drinking in the wet season. Estimate Daily Intake (EDI), Non-Carcinogenic Risk of Water Consumption (HQ), and Carcinogenic Risk of Water Consumption (R) were used to help determine the health risk to adults and children. EDI revealed that men, women, and children are high exposed to toxic heavy metals from these waters, as they exceeded the minimal risk levels for each heavy metal. Coalplex stream was found to have a high and unacceptable ranking for m-HPI and HEI, suggesting that the mining activity around this area has affected the water quality. Based on the evaluation of the results obtained from this study area, these surface waters are highly impacted by anthropogenic activities. Heavy metal pollution indices showed the importance of grouping surface water contamination to heavy metals. This research presented a vital problem and showed that surface waters located next to industrial facilities are under pressure in many parts of the world.

Supplementary Materials

The following supporting information can be downloaded at: https://www.mdpi.com/article/10.3390/w14152375/s1, Section S1: Pollution indices; Table S1: Quality status for environmental and health parameters.

Author Contributions

Conceptualization and methodology, V.M.M., P.N.N. and J.R.; formal analysis, investigation, and data collection, V.M.M.; Writing of the original manuscript, V.M.M.; supervision, P.N.N. and J.R. All authors have read and agreed to the published version of the manuscript.

Funding

This research was supported by the National Research Foundation South Africa (DSI-NRF SARChI funding instrument), grant number 91230 (P.N.N.) and National Research Foundation (NRF) Thuthuka grant number 117791 (J.R.). We also acknowledge Centre for Nanomaterials Science Research (CNSR).

Data Availability Statement

The data presented in this study are available on request from the first author.

Acknowledgments

The authors further appreciate the Department of Chemical Sciences, University of Johannesburg for allowing us to utilize their laboratory facilities to make this study possible. A special thank you to Masixole Sihlahla for guardians and helping with calculations.

Conflicts of Interest

The authors declare no conflict of interest with the work submitted.

References

  1. Biswas, P.K.; Uddin, N.; Alam, S.; Sultana, S.; Ahmed, T. Evaluation of heavy metal pollution indices in irrigation and drinking water systems of Barapukuria coal mine area, Bangladesh. Am. J. Water Resour. 2017, 5, 146–151. [Google Scholar]
  2. Maponya, P.; Rampedi, I.T. Impact of Air Pollution on Maize Production in the Sasolburg Area, South Africa. J. Agric. Sci. 2013, 5, 181. [Google Scholar] [CrossRef] [Green Version]
  3. Saleem, M.; Iqbal, J.; Shah, M.H. Seasonal variations, risk assessment and multivariate analysis of trace metals in the freshwater reservoirs of Pakistan. Chemosphere 2019, 216, 715–724. [Google Scholar] [CrossRef] [PubMed]
  4. Edokpayi, J.N.; Odiyo, J.O.; Popoola, E.O.; Msagati, T.A.M. Evaluation of temporary seasonal variation of heavy metals and their potential ecological risk in Nzhelele River, South Africa. Open Chem. 2017, 15, 272–282. [Google Scholar] [CrossRef]
  5. Yao, H.; Qian, X.; Gao, H.; Wang, Y.; Xia, B. Seasonal and Spatial Variations of Heavy Metals in Two Typical Chinese Rivers: Concentrations, Environmental Risks, and Possible Sources. Int. J. Environ. Res. Public Health 2014, 11, 11860–11878. [Google Scholar] [CrossRef] [Green Version]
  6. Nyamukamba, P.; Moloto, M.J.; Tavengwa, N.; Ejidike, I.P. Evaluating Physicochemical Parameters, Heavy Metals, and Antibiotics in the Influents and Final Effluents of South African Wastewater Treatment Plants. Pol. J. Environ. Stud. 2019, 28, 1305–1312. [Google Scholar] [CrossRef] [Green Version]
  7. Banzi, F.P.; Msaki, P.K.; Mohammed, N.K. Assessment of heavy metal concentration in water around the proposed Mkuju River Uranium Project in Tanzania. Tanzan. J. Sci. 2015, 41, 8–18. [Google Scholar]
  8. Obasi, P.N.; Akudinobi, B.B. Potential health risk and levels of heavy metals in water resources of lead—zinc mining communities of Abakaliki, southeast Nigeria. Appl. Water Sci. 2020, 10, 184. [Google Scholar] [CrossRef]
  9. Edokpayi, J.N.; Odiyo, J.O.; Popoola, O.E.; Msagati, T.A.M. Assessment of Trace Metals Contamination of Surface Water and Sediment: A Case Study of Mvudi River, South Africa. Sustainability 2016, 8, 135. [Google Scholar] [CrossRef] [Green Version]
  10. De Klerk, L.P. The Bioaccumulation of Mercury and Other Metals in the Taaibosspruit System, Sasolburg, South Africa; University of Johannesburg: Johannesburg, South Africa, 2012. [Google Scholar]
  11. Malaka, M.T. Internal Strategic Perspective; 2004. Available online: https://www.dws.gov.za/Documents/Other/WMA/8/VaalOverarchingISPintro.pdf (accessed on 20 June 2022).
  12. Shakeri, A.; Afrasiabian, A.; Rezaei, M.; Karimi, M. Assessment of trace elements contamination in surface sediments of the Bakhtegan lake, Iran. Iran. J. Sci. Technol. 2014, 38, 76–85. [Google Scholar] [CrossRef]
  13. Sivakumar, S.; Chandrasekaran, A.; Balaji, G.; Ravisankar, R. Assessment of heavy metal enrichment and the degree of contamination in coastal sediment from South East Coast of Tamilnadu, India. J. Heavy Met. Toxic. Dis. 2016, 1, 11. [Google Scholar]
  14. Maskooni, E.K.; Naseri-Rad, M.; Berndtsson, R.; Nakagawa, K. Use of Heavy Metal Content and Modified Water Quality Index to Assess Groundwater Quality in a Semiarid Area. Water 2020, 12, 1115. [Google Scholar] [CrossRef] [Green Version]
  15. Akter, T.; Jhohura, F.T.; Akter, F.; Chowdhury, T.R.; Mistry, S.K.; Dey, D.; Barua, M.K.; Islam, A.; Rahman, M. Water Quality Index for measuring drinking water quality in rural Bangladesh: A cross-sectional study. J. Health Popul. Nutr. 2016, 35, 4. [Google Scholar] [CrossRef] [PubMed] [Green Version]
  16. Janoska, O.; Gruszecka-Kosowska, A. Water quality and Human Health Risk Assessment: A case study of the Czarna Przemsza River source in Zawiercie, Poland. Hum. Ecol. Risk Assess. Int. J. 2018, 26, 757–781. [Google Scholar] [CrossRef]
  17. Department of Water Affairs and Forestry. South African Water Quality Guidelines: Aquatic Ecosystems, 1st ed.; 1996; Volume 7. Available online: https://www.dws.gov.za/iwqs/wq_guide/edited/Pol_saWQguideFRESH_vol7_Aquaticecosystems.pdf (accessed on 20 June 2022).
  18. Healthline. Alkaline Water: Benefits and Risks. 2019. Available online: https://www.healthline.com/health/food-nutrition/alkaline-water-benefits-risks#risk-factors (accessed on 11 June 2020).
  19. Boyd, C.E. pH, Carbon Dioxide, and Alkalinity, in Water Quality; Springer: Berlin/Heidelberg, Germany, 2015; pp. 153–178. [Google Scholar]
  20. Baker, J.A.; Elphick, J.R.; McPherson, C.A.; Chapman, P.M. Effect of Total Dissolved Solids on Fertilization and Development of Two Salmonid Species. Bull. Environ. Contam. Toxicol. 2015, 95, 488–493. [Google Scholar] [CrossRef]
  21. Sharma, H.; Rawal, N.; Mathew, B.B. The characteristics, toxicity and effects of cadmium. Int. J. Nanotechnol. Nanosci. 2015, 3, 1–9. [Google Scholar]
  22. Li, D.; Liu, S. Chapter 1-Sensors in Water Quality Monitoring. In Water Quality Monitoring and Management; Academic Press: Cambridge, MA, USA, 2019; pp. 1–54. [Google Scholar]
  23. Kabir, E.S.; Kabir, M.; Islam, S.M.; Mia, C.M.; Begum, N.; Chowdhury, D.A.; Sultana, S.M.; Rahman, S.M. Assessment of effluent quality of Dhaka export processing zone with special emphasis to the textile and dying industries. Jahangirnagar Uni. J. Sci. 2002, 25, 137–138. [Google Scholar]
  24. Agency for Toxic Substances and Disease Registry. Arsenic. 2021. Available online: https://www.atsdr.cdc.gov/toxprofiles/tp2-c6.pdf (accessed on 11 June 2021).
  25. World Health Organisation. 2017 WHO guidelines for drinking water quality: First addendum to the fourth edition. J. Am. Water Work. Assoc. 2017, 109, 44–51. [Google Scholar] [CrossRef] [Green Version]
  26. Council, N. Nordic Council of Ministers Cadmium Review Nordic Council of Ministers Cadmium Review; WHO: Geneva, Switzerland, 2003. [Google Scholar]
  27. Sampels, S.; Kroupova, H.K.; Linhartova, P. Effect of cadmium on uptake of iron, zinc and copper and mRNA expression of metallothioneins in HepG2 cells in vitro. Toxicol. Vitr. 2017, 44, 372–376. [Google Scholar] [CrossRef]
  28. Cheng, M.; Kopittke, P.M.; Wang, A.; Sale, P.W.G.; Tang, C. Cadmium reduces zinc uptake but enhances its translocation in the cadmium-accumulator, Carpobrotus rossii, without affecting speciation. Plant Soil 2018, 430, 219–231. [Google Scholar] [CrossRef]
  29. Driessnack, M.K.; Jamwal, A.; Niyogi, S. Effects of chronic waterborne cadmium and zinc interactions on tissue-specific metal accumulation and reproduction in fathead minnow (Pimephales promelas). Ecotoxicol. Environ. Saf. 2017, 140, 65–75. [Google Scholar] [CrossRef]
  30. Rizwan, M.; Ali, S.; Rehman, M.Z.U.; Maqbool, A. A critical review on the effects of zinc at toxic levels of cadmium in plants. Environ. Sci. Pollut. Res. 2019, 26, 6279–6289. [Google Scholar] [CrossRef]
  31. Kazakis, N.; Kantiranis, N.; Kalaitzidou, K.; Kaprara, E.; Mitrakas, M.; Frei, R.; Vargemezis, G.; Tsourlos, P.; Zouboulis, A.; Filippidis, A. Origin of hexavalent chromium in groundwater: The example of Sarigkiol Basin, Northern Greece. Sci. Total Environ. 2017, 593-594, 552–566. [Google Scholar] [CrossRef]
  32. Manoj, S.; RamyaPriya, R.; Elango, L. Long-term exposure to chromium contaminated waters and the associated human health risk in a highly contaminated industrialised region. Environ. Sci. Pollut. Res. 2021, 28, 4276–4288. [Google Scholar] [CrossRef]
  33. Coetzee, J.J.; Bansal, N.; Chirwa, E.M.N. Chromium in Environment, Its Toxic Effect from Chromite-Mining and Ferrochrome Industries, and Its Possible Bioremediation. Expo. Health 2020, 12, 51–62. [Google Scholar] [CrossRef] [Green Version]
  34. Engwa, G.A.; Ferdinand, P.U.; Nwalo, F.N.; Unachukwu, M.N. Mechanism and Health Effects of Heavy Metal Toxicity in Humans. In Poisoning in the Modern World-New Tricks for an Old Dog? IntechOpen: London, UK, 2019; pp. 77–100. [Google Scholar] [CrossRef] [Green Version]
  35. Garvey, G.J.; Hahn, G.; Lee, R.V.; Harbison, R.D. Heavy metal hazards of Asian traditional remedies. Int. J. Environ. Health Res. 2001, 11, 63–71. [Google Scholar] [CrossRef]
  36. Lenntech. Vanadium-V, Chemical Properties of Vanadium—Health Effects of Vanadium—Environmental Effects of Vanadium. Available online: https://www.lenntech.com/periodic/elements/v.htm (accessed on 24 October 2020).
  37. Agency for Toxic Substances and Disease Registry. Minimal Risk Levels (MRLs). 2021. Available online: https://wwwn.cdc.gov/TSP/MRLS/mrlsListing.aspx (accessed on 29 September 2021).
  38. Environmental Protection Agency; Office of Emergency, Remedial Response. Risk Assessment Guidance for Superfund; Office of Emergency and Remedial Response, US Environmental Protection Agency: Washington, DC, USA, 1989. [Google Scholar]
  39. Zamani, A.A.; Yaftian, M.R.; Parizanganeh, A. Multivariate statistical assessment of heavy metal pollution sources of groundwater around a lead and zinc plant. Iran. J. Environ. Health Sci. Eng. 2012, 9, 29. [Google Scholar] [CrossRef] [PubMed] [Green Version]
  40. Dhal, R. Ground Water Quality Analysis of an Industrial Area of Baddi-Brotiwala-Nalagarh (Himachal Pradesh). Int. J. Res. Appl. Sci. Eng. Technol. 2020, 8, 1134–1140. [Google Scholar] [CrossRef]
Figure 1. Heavy Metal Evaluation Index (HEI) results based on WHO, EPA, and DWAF: DWAF*, WHO = World Health Organization; EPA = Domestic use; DWAF* = Agricultural use.
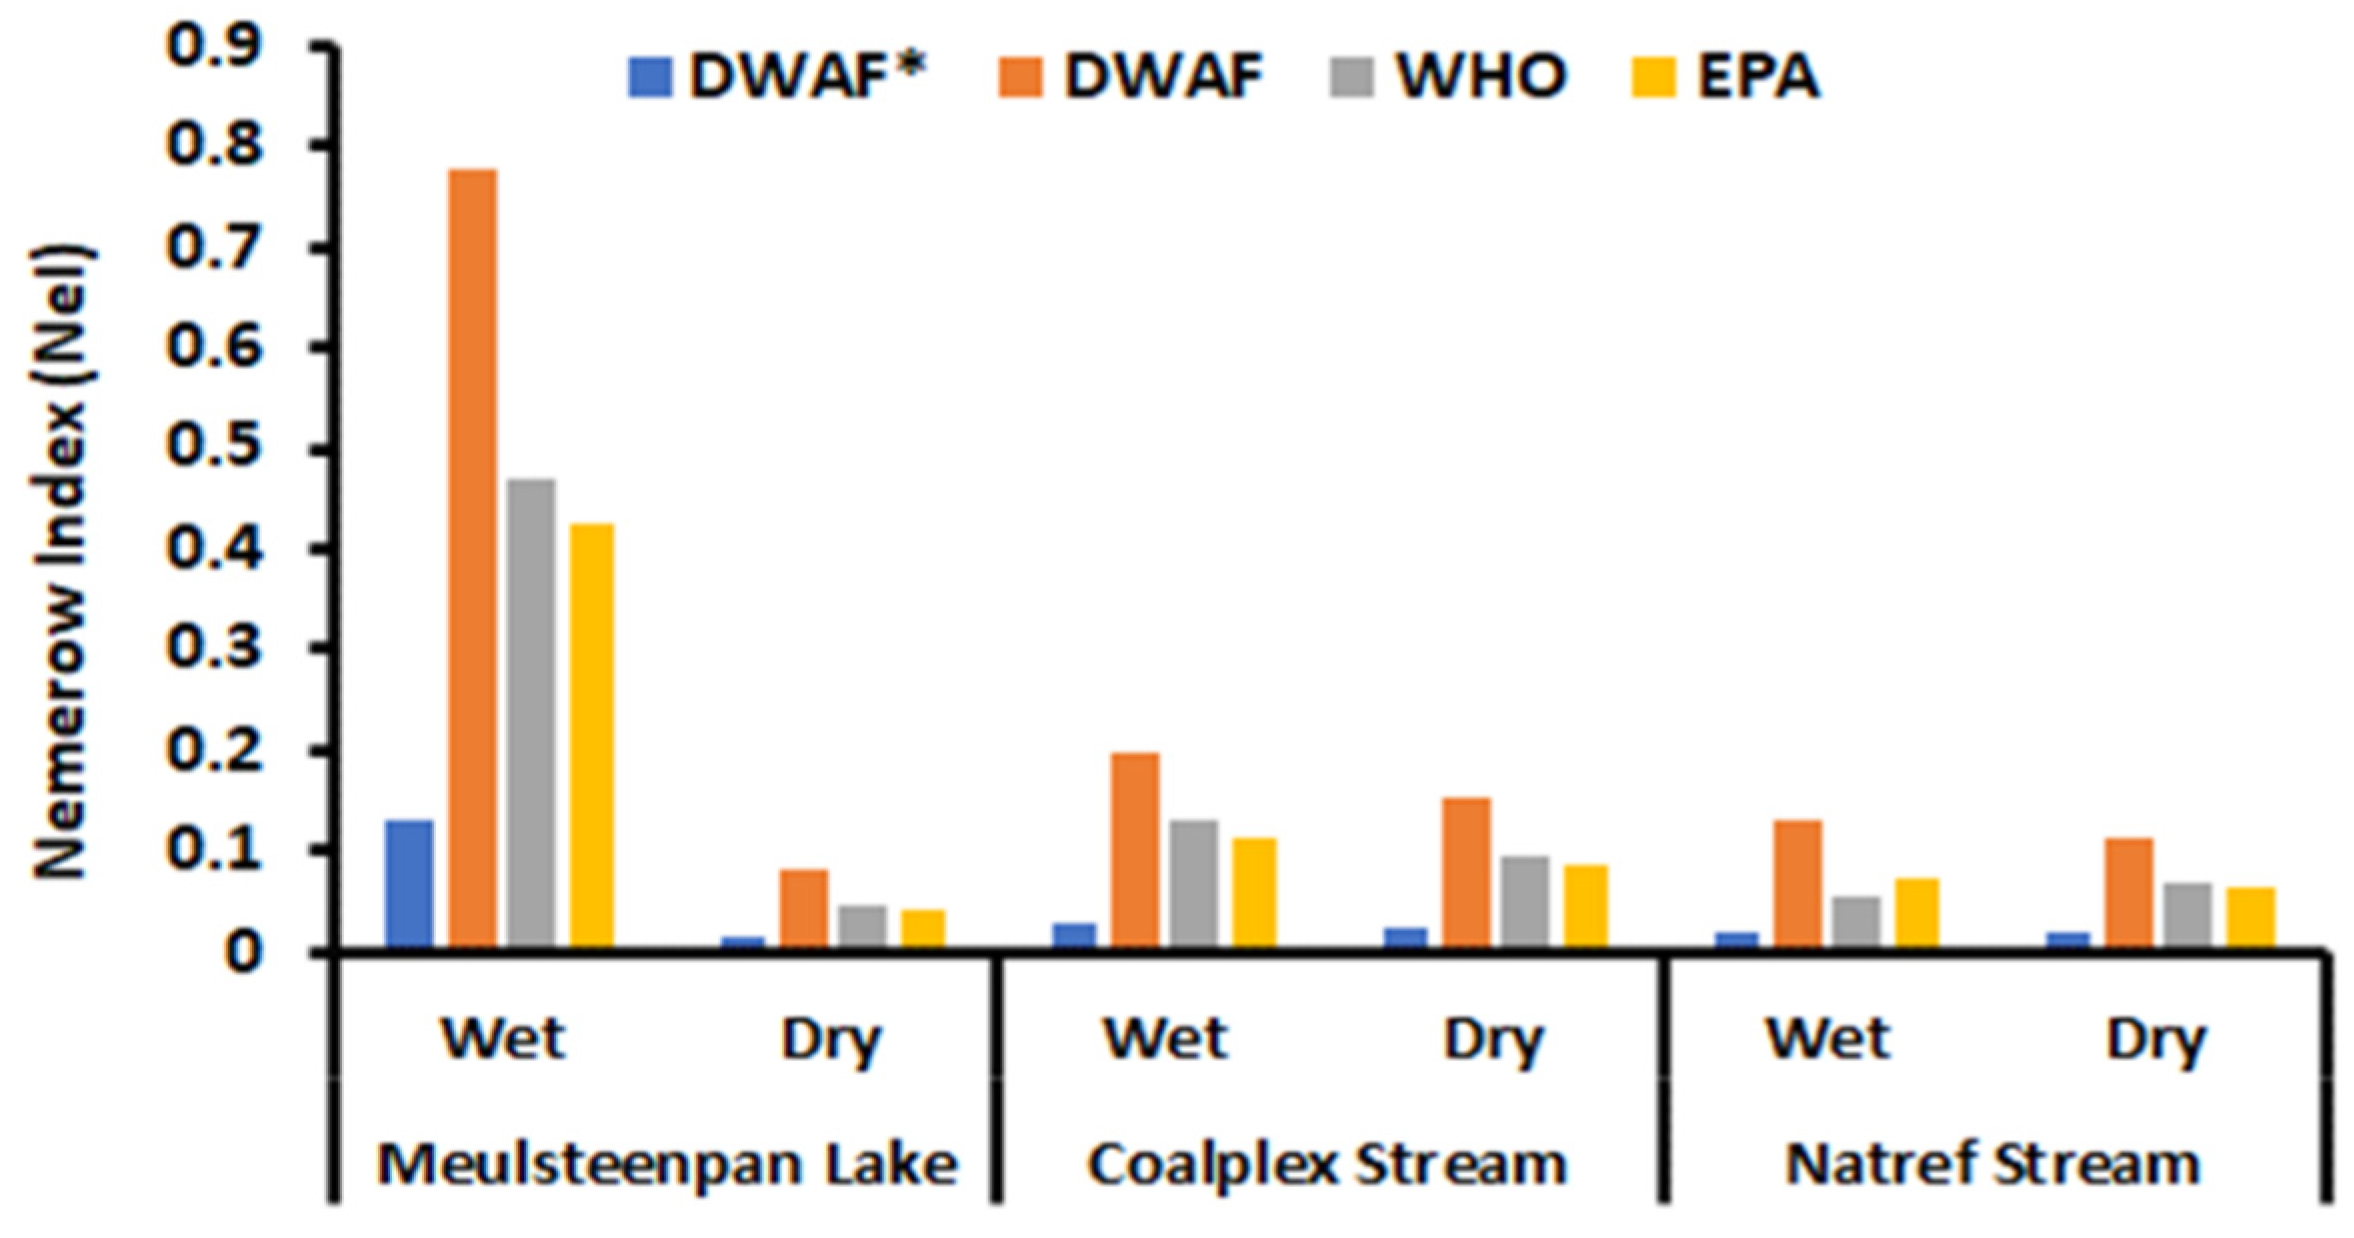
Water 14 02375 g001
Figure 2. Nemerow Index (NeI) results using the WHO, EPA, and DWAF permissible: DWAF, WHO, and EPA = Domestic use and DWAF* = Agricultural use.
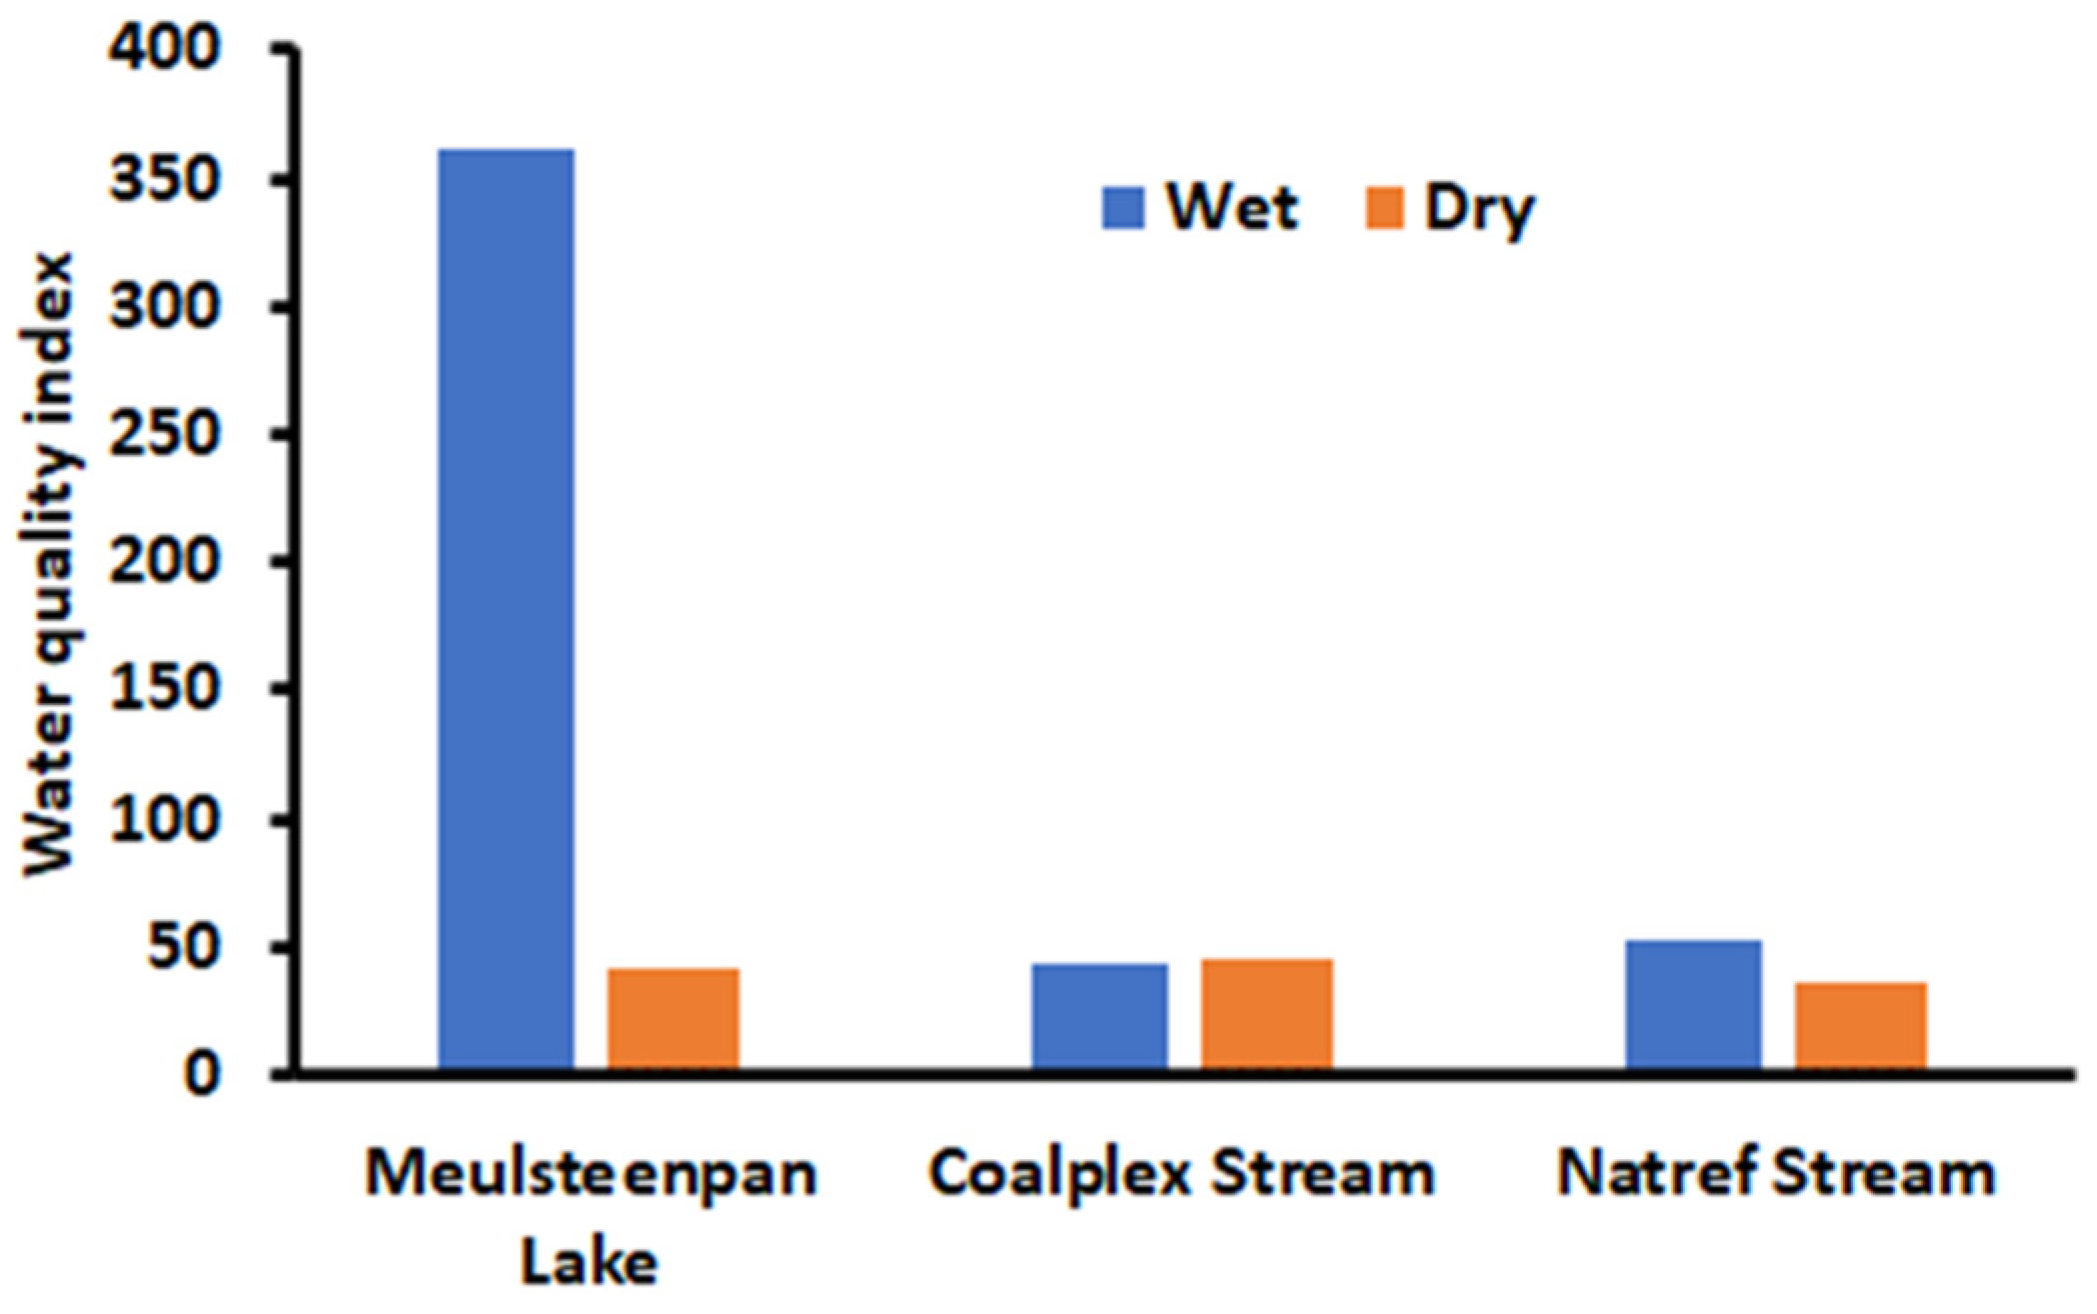
Water 14 02375 g002
Figure 3. Water quality index (WQI) for all Meulsteenpan Lake, Coalplex Stream, and Natref Stream using permissible guideline values set by the DWAF domestic use.
Water 14 02375 g003
Table 1. Average physiochemical parameters (pH, TDS, EC) for Meulsteenpan Lake, Coalplex Stream, and Natref Stream.
pHTDS (mg/L)EC (mS/m)
WetDryWetDryWetDry
Meulsteenpan Lake7.897.8698079621.2
Coalplex Stream7.137.373263090.650.65
Natref Stream6.167.684132690.890.96
Permissible water standards
pHTDS (mg/L)EC (mS/m)
DWAF*6.5–8.440N.A.
DWAF6.0–9.04500.7
WHO6.5–9.5600N.A.
EPA6.5–9.5N.A.2.5
Notes: DWAF, WHO, and EPA = Domestic use and DWAF* = Agricultural use; N.A. = Not available.
Table 2. Minimum, maximum, and mean concentrations of surface water from Meulsteenpan Lake, Coalplex Stream, and Natref Stream (ug/L).
Meulsteenpan LakeCoalplex StreamNatref Stream
MetalsWetDryWetDryWetDry
MinMaxMeanMinMaxMeanMinMaxMeanMinMaxMeanMinMaxMeanMinMaxMean
Al17.7138136321.734.927.344.114394.414.151.327.310.649514521.758.941.1
As<DL12.73.63<DL1.850.621.727.104.30<DL30.310.2<DL6.412.18<DL31.9210.6
Cd0.120.780.360.052.271.030.10.380.21<DL0.130.06<DL0.170.07<DL2.270.77
Co0.235.572.610.5923.99.011.3336.610.8<DL4.682.080.422.46.72<DL23.98.78
Cr0.7310.13.930.733.682.17<DL1.130.30<DL3.881.290.333.251.86<DL4.132.07
Cu1.597.433.91<DL17.38.251.564.002.42<DL8.754.611.5518.07.58<DL17.35.97
Fe<DL60272077<DL<DL<DL<DL550279<DL96.852.0<DL426115<DL14.94.96
Mn0.9310925680.9318.410.90.406752722.9351.934.90.2722760.418.475.340.7
Mo0.6813.57.593.5313.537.1132.54702082443973410.456.003.382.624.283.33
Ni<DL0.350.09<DL2.050.68<DL<DL<DL<DL<DL<DL<DL<DL<DL<DL2.020.67
Pb0.225.352.151.383.482.662.156.953.81<DL1.570.870.205.252.151.005.503.21
Sb1.657.784.57<DL1.701.051.577.843.49<DL4.622.27<DL2.51.520.301.450.87
Se2.6028.115.6<DL28.115.5<DL22.06.27<DL20.77.47<DL23.46.470.1518.58.27
Sr291492360145291222145251201201301240167332272145599316
Tl<DL18.511.46.1220.114.0<DL15.74.484.8328.920.84.0018.49.593.7330.518.1
V3.4743.522.0<DL22.014.2<DL20.39.22<DL24.715.03.0020.313.1<DL22.014.6
Note: <DL = below detection limit.
Table 3. Permissible guideline values for surface water applied for domestic and agricultural use.
Permissible Guideline Water Standards (ug/L)
MetalsDWAF*DWAFWHOEPA
Al5000150N.A.200
As100101010
Cd10535
Co50N.A.N.A.N.A.
Cr100505050
Cu200100020002000
Fe5000100N.A.200
Mn5050N.A.50
Mo10N.A.N.A.N.A.
Ni200N.A.7020
Pb200101010
SbN.A.N.A.205
Se20204010
SrN.A.N.A.N.A.N.A.
TlN.A.N.A.N.A.N.A.
V100100N.A.N.A.
Notes: DWAF, WHO, and EPA = Domestic use and DWAF* = Agricultural use; N.A. = Not available.
Table 4. Analytical figures of merit.
MetalLinearity (ug/L)R2LOD (ug/L)LOQ (ug/L)
Al0.3–20000.99510.0990.33
As0.3–5000.99130.0650.22
Cd0.05–5000.99210.0140.05
Co0.1–5000.99890.0280.09
Cr0.2–5000.99820.0380.13
Cu0.05–20000.99620.0140.05
Fe0.1–65000.99290.0400.13
Mn0.1–15000.99590.0430.14
Mo0.1–7500.99230.0200.07
Ni0.1–15000.99500.0200.07
Pb0.1–5000.99500.0200.07
Sb0.05–5000.99350.0120.04
Se0.1–4500.99810.0320.11
Sr0.1–15000.99520.0330.11
Tl0.3–3500.99520.100.34
V0.1–5000.99040.0350.12
Table 5. Contamination factor (Cf) for each metal calculated using the DWAF permissible guideline values for domestic use from Meulsteenpan Lake, Coalplex stream, and Natref stream during the wet and dry seasons.
Meulsteenpan LakeCoalplex StreamNatref Stream
MetalsWetDryWetDryWetDry
Al2.420.180.630.180.970.27
As0.360.060.431.020.221.06
Cd0.070.210.040.010.020.15
CoN.A.N.A.N.A.N.A.N.A.N.A.
Cr0.080.040.0060.030.040.04
Cu0.0040.0080.0020.0050.0080.006
Fe20.80.002.790.521.150.05
Mn11.40.225.430.701.210.81
MoN.A.N.A.N.A.N.A.N.A.N.A.
NiN.A.N.A.N.A.N.A.N.A.N.A.
Pb0.220.270.380.090.220.32
SbN.A.N.A.N.A.N.A.N.A.N.A.
Se0.780.780.310.370.320.41
SrN.A.N.A.N.A.N.A.N.A.N.A.
TlN.A.N.A.N.A.N.A.N.A.N.A.
V0.220.140.090.150.130.15
Note: N.A. = Not Available (permissible guideline value).
Table 6. Contamination factor (Cf) for each metal calculated using the EPA permissible guideline values for domestic use from Meulsteenpan Lake, Coalplex stream, and Natref stream during the wet and dry seasons.
Meulsteenpan LakeCoalplex StreamNatref Stream
MetalsWetDryWetDryWetDry
Al0.650.140.470.140.720.21
As1.970.060.431.020.221.06
Cd2.880.210.040.010.010.15
CoN.A.N.A.N.A.N.A.N.A.N.A.
Cr0.160.040.010.030.040.04
Cu0.320.000.000.000.000.00
Fe2.420.001.390.260.580.02
Mn4.500.225.430.701.210.81
MoN.A.N.A.N.A.N.A.N.A.N.A.
Ni0.000.030.000.000.000.03
Pb1.770.270.380.090.220.32
Sb2.300.210.700.450.300.17
Se1.001.550.630.750.650.83
SrN.A.N.A.N.A.N.A.N.A.N.A.
TlN.A.N.A.N.A.N.A.N.A.N.A.
VN.A.N.A.N.A.N.A.N.A.N.A.
Note: N.A. = Not Available (permissible guideline value).
Table 7. Contamination factor (Cf) for each metal calculated using the WHO permissible guideline values for domestic use from Meulsteenpan Lake, Coalplex stream, and Natref stream during the wet and dry seasons.
Meulsteenpan LakeCoalplex StreamNatref Stream
MetalsWetDryWetDryWetDry
AlN.A.N.A.N.A.N.A.N.A.N.A.
As1.970.060.431.020.221.06
Cd2.880.340.070.020.020.26
CoN.A.N.A.N.A.N.A.N.A.N.A.
Cr0.160.040.010.030.040.04
Cu0.320.000.000.000.000.00
FeN.A.N.A.N.A.N.A.N.A.N.A.
MnN.A.N.A.N.A.N.A.N.A.N.A.
MoN.A.N.A.N.A.N.A.N.A.N.A.
Ni0.000.010.000.000.000.01
Pb1.770.270.380.090.220.32
Sb2.300.050.170.110.080.04
Se0.970.390.160.190.160.21
SrN.A.N.A.N.A.N.A.N.A.N.A.
TlN.A.N.A.N.A.N.A.N.A.N.A.
VN.A.N.A.N.A.N.A.N.A.N.A.
Note: N.A. = Not Available (permissible guideline value).
Table 8. Contamination factor (Cf) for each metal calculated using the DWAF permissible guideline values for agricultural use from Meulsteenpan Lake, Coalplex stream, and Natref stream during the wet and dry seasons.
Meulsteenpan LakeCoalplex StreamNatref Stream
MetalsWetDryWetDryWetDry
Al0.070.010.020.010.030.01
As0.040.010.040.100.020.11
Cd0.040.100.020.010.010.08
Co0.050.180.220.040.130.18
Cr0.040.020.000.010.020.02
Cu0.020.040.010.020.040.03
Fe0.420.000.060.010.020.00
Mn11.40.225.430.701.210.81
Mo0.760.7120.834.10.340.33
Ni0.000.000.000.000.000.00
Pb0.010.010.020.000.010.02
SbN.A.N.A.N.A.N.A.N.A.N.A.
Se0.780.780.310.370.320.41
SrN.A.N.A.N.A.N.A.N.A.N.A.
TlN.A.N.A.N.A.N.A.N.A.N.A.
V0.220.140.090.150.130.15
Note: N.A. = Not Available (permissible guideline value).
Table 9. Modified Degree of Contamination (m-Cd) results based on the WHO, EPA, and DWAF permissible standards.
SiteMeulsteenpan LakeCoalplex StreamNatref Stream
DWAF*Wet1.062.080.18
Dry0.172.730.17
DWAFWet3.631.010.43
Dry0.190.310.33
WHOWet0.180.150.09
Dry0.150.180.24
EPAWet2.430.860.36
Dry0.250.130.33
Notes: DWAF, WHO, and EPA = Domestic use and DWAF* = Agricultural use.
Table 10. m-HPI results using WHO, EPA, and DWAF permissible standards.
SiteMeulsteenpan LakeCoalplex StreamNatref Stream
DWAF*Wet1.196.730.79
Dry0.6110.50.75
DWAFWet1.510.800.79
Dry0.770.710.54
WHOWet0.810.820.91
Dry0.750.810.71
EPAWet0.910.710.75
Dry0.790.630.62
Notes: DWAF, WHO, and EPA = Domestic use and DWAF* = Agricultural use.
Table 11. Estimated daily intake (EDI) (mg/kg bw/day) of heavy metals for adults and children due to surface water in Meulsteenpan Lake.
MenWomenChildrenMRLs (mg/kg bw/day)
MetalsWetDryWetDryWetDry
Al11.170.8412.10.9118.151.371
As0.110.020.120.020.180.030.0003
Cd0.010.030.010.030.020.050.0001
Co0.080.280.090.30.130.450.01
Cr0.120.070.130.070.20.110.0009
Cu0.120.250.130.280.20.410.01
Fe63.94069.270103.90N.A.
Mn17.510.3418.970.3628.450.550.16
Mo0.230.220.250.240.380.360.008
Ni00.0200.0200.03N.A.
Pb0.070.080.070.090.110.13N.A.
Sb0.140.030.150.040.230.050.0006
Se0.490.480.530.520.790.780.005
Sr11.086.83127.41811.10.3
Tl0.350.430.380.470.570.7N.A.
V0.680.4412.10.471.11.420.01
Notes: MRLs: Minimal risk levels; N.A. = Not Available.
Table 12. Estimated daily intake (EDI) (mg/kg bw/day) of heavy metals for adults and children due to surface water in Coalplex Stream.
MenWomenChildrenMRLs (mg/kg bw/day)
MetalsWetDryWetDryWetDry
Al2.910.843.150.914.721.371
As0.130.310.140.340.210.510.0003
Cd0.010.0020.010.0020.010.0030.0001
Co0.330.060.360.070.540.10.01
Cr0.010.040.010.040.020.070.0009
Cu0.070.140.080.150.120.230.01
Fe8.591.69.31.7313.952.6N.A.
Mn8.371.079.071.1613.61.750.16
Mo6.410.496.9311.3710.417.050.008
Ni000000N.A.
Pb0.120.030.130.030.190.04N.A.
Sb0.110.070.120.080.180.110.0006
Se0.190.230.210.250.310.370.005
Sr6.197.396.7810.05120.3
Tl0.140.640.150.690.221.04N.A.
V0.280.460.310.50.461.50.01
Notes: MRLs: Minimal risk levels; N.A. = Not Available.
Table 13. Estimated daily intake (EDI) (mg/kg bw/day) of heavy metals for adults and children due to surface water in Natref Stream.
MenWomenChildrenMRLs (mg/kg bw/day)
MetalWetDryWetDryWetDry
Al4.4621.2654.8331.377.252.0551
As0.0670.3260.0730.3530.1090.530.0003
Cd0.0020.0240.0020.0260.0040.0390.0001
Co0.2070.270.2240.2930.3360.4390.01
Cr0.0570.0640.0620.0690.0930.1040.0009
Cu0.2330.1840.2530.1990.3790.2990.01
Fe3.5380.1533.8330.1655.750.248N.A.
Mn1.8581.2522.0131.3573.022.0350.16
Mo0.1040.1020.1130.1110.1690.1670.008
Ni00.02100.02200.034N.A.
Pb0.0660.0990.0720.1070.1080.161N.A.
Sb0.0470.0270.0510.0290.0760.0440.0006
Se0.1990.2540.2160.2760.3240.4140.005
Sr8.3699.7549.06710.56713.615.850.3
Tl0.2950.5570.320.6030.480.905N.A.
V0.4030.4490.4370.4870.6551.460.01
Notes: MRLs: Minimal risk levels; N.A. = Not Available.
Table 14. HQ values of heavy metals for adults and children due to surface water contamination.
Meulsteenpan LakeCoalplex StreamNatref Stream
MenWomenChildrenMenWomenChildrenMenWomenChildren
MetalsWetDryWetDryWetDryWetDryWetDryWetDryWetDryWetDryWetDry
As0.370.060.400.070.610.100.441.050.481.130.711.700.221.090.241.180.361.77
Cd0.020.060.020.070.040.100.010.0030.010.0040.020.0060.0040.050.0050.050.0070.08
Co0.0040.010.0040.020.0070.020.020.0030.020.0030.030.0050.010.010.010.020.020.02
Cr0.040.020.040.020.070.040.0030.010.0030.010.0050.020.020.020.020.020.030.04
Cu0.0030.0060.0030.0070.0050.010.0020.0040.0020.0040.0030.0060.0060.0050.0060.0050.0090.007
Mn0.130.0020.140.0030.200.0040.060.0080.070.0080.100.010.010.0090.010.010.020.02
Pb0.020.020.020.030.030.040.030.0070.040.0080.050.010.020.030.020.030.030.05
Sb0.350.080.380.090.570.130.270.180.290.190.440.280.120.070.130.070.190.11
Se0.100.100.110.100.160.160.040.050.040.050.060.080.040.050.040.060.070.08
Tl4.395.394.755.837.138.751.728.001.878.672.8013.03.696.964.007.545.9911.3
V0.100.060.110.070.180.200.040.070.040.070.070.210.060.060.060.070.090.21
Table 15. Carcinogenic Risk of Water Consumption (R).
Meulsteenpan LakeCoalplex StreamNatref Stream
MenWomenChildrenMenWomenChildrenMenWomenChildren
WetDryWetDryWetDryWetDryWetDryWetDryWetDryWetDryWetDry
As0.170.030.180.030.270.050.20.470.220.510.320.770.10.490.110.530.160.8
Cr0.060.030.070.040.20.050.0050.020.0050.020.0080.030.030.030.030.040.050.05
Pb0.0010.0010.0010.0010.0010.0010.00100.00100.00200.0010.0010.0010.0010.0010.001
Publisher’s Note: MDPI stays neutral with regard to jurisdictional claims in published maps and institutional affiliations.

