
Nonstationary Analyses of the Maximum and Minimum Streamflow in Tamsui River Basin, Taiwan


Abstract
:1. Introduction
2. Methodology
2.1. The Generalized Additive Models for Location, Scale, and Shape (GAMLSS)
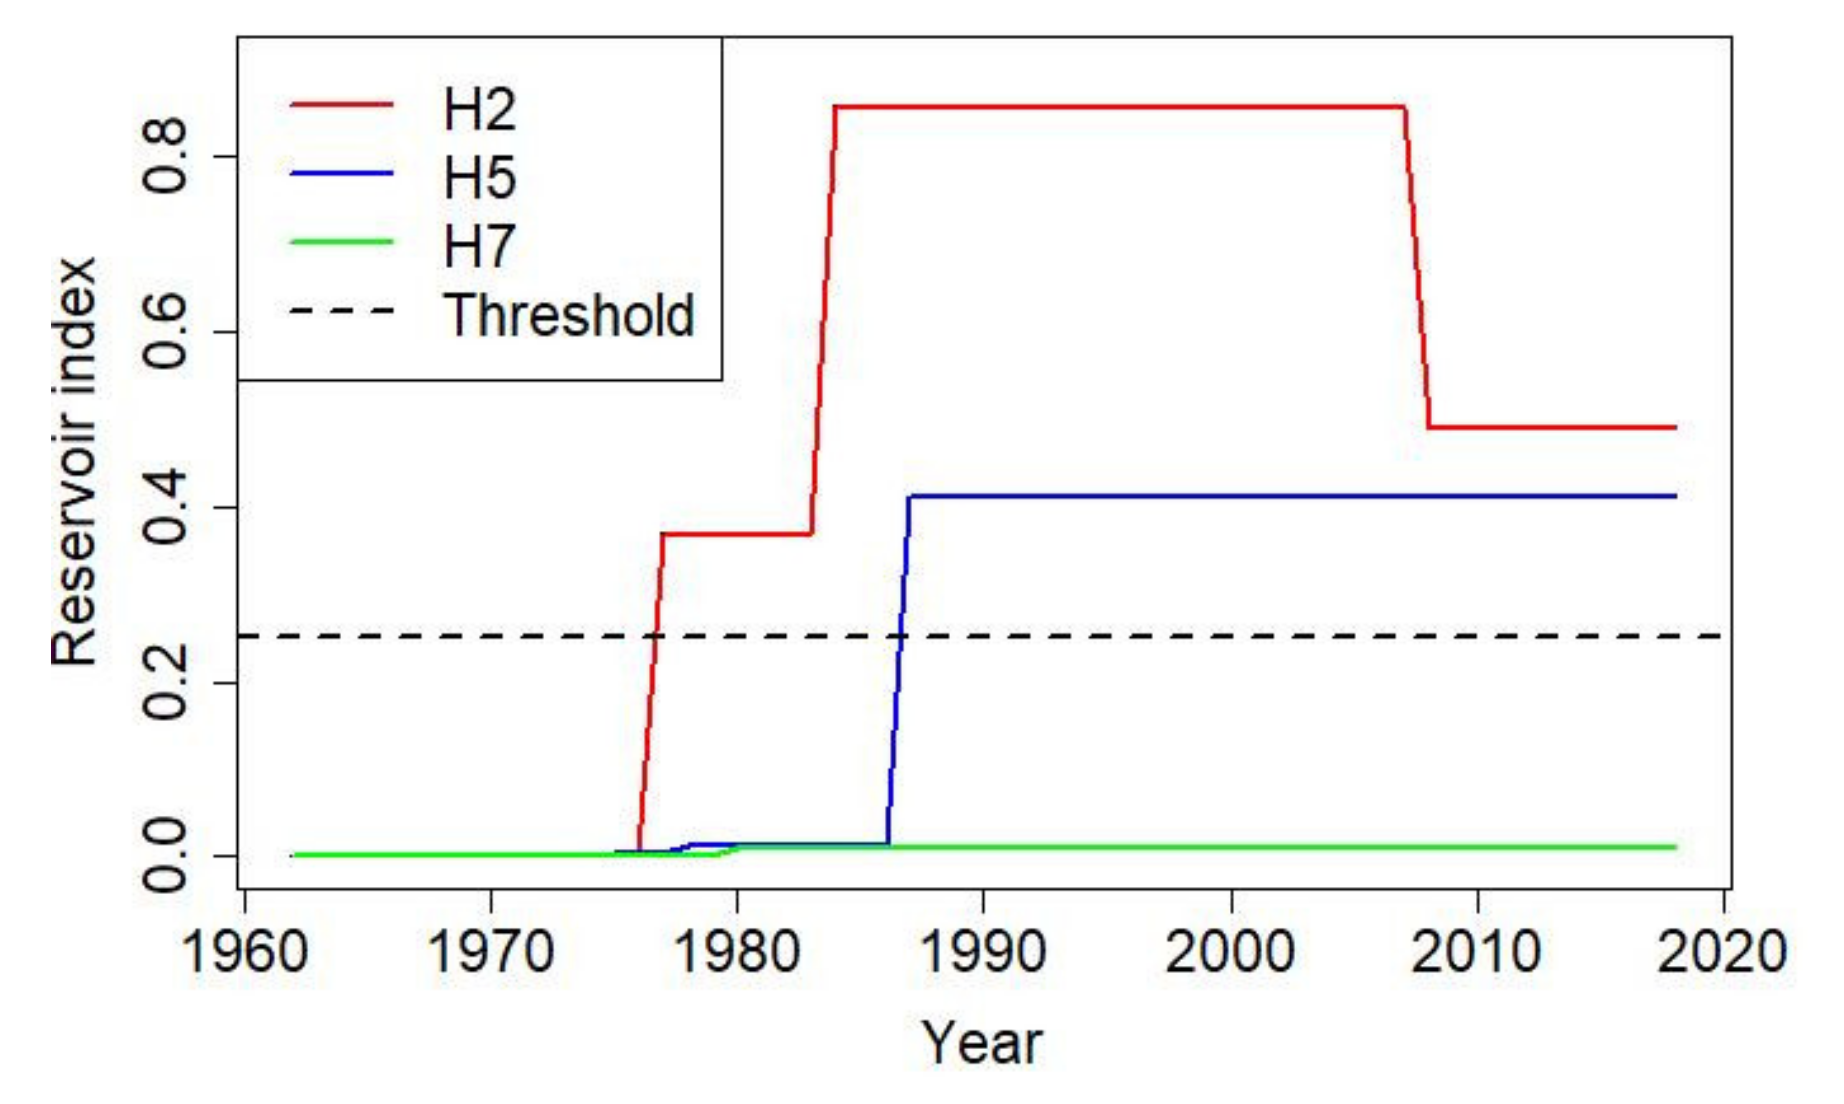
2.2. Reservoir Index
3. Data Used
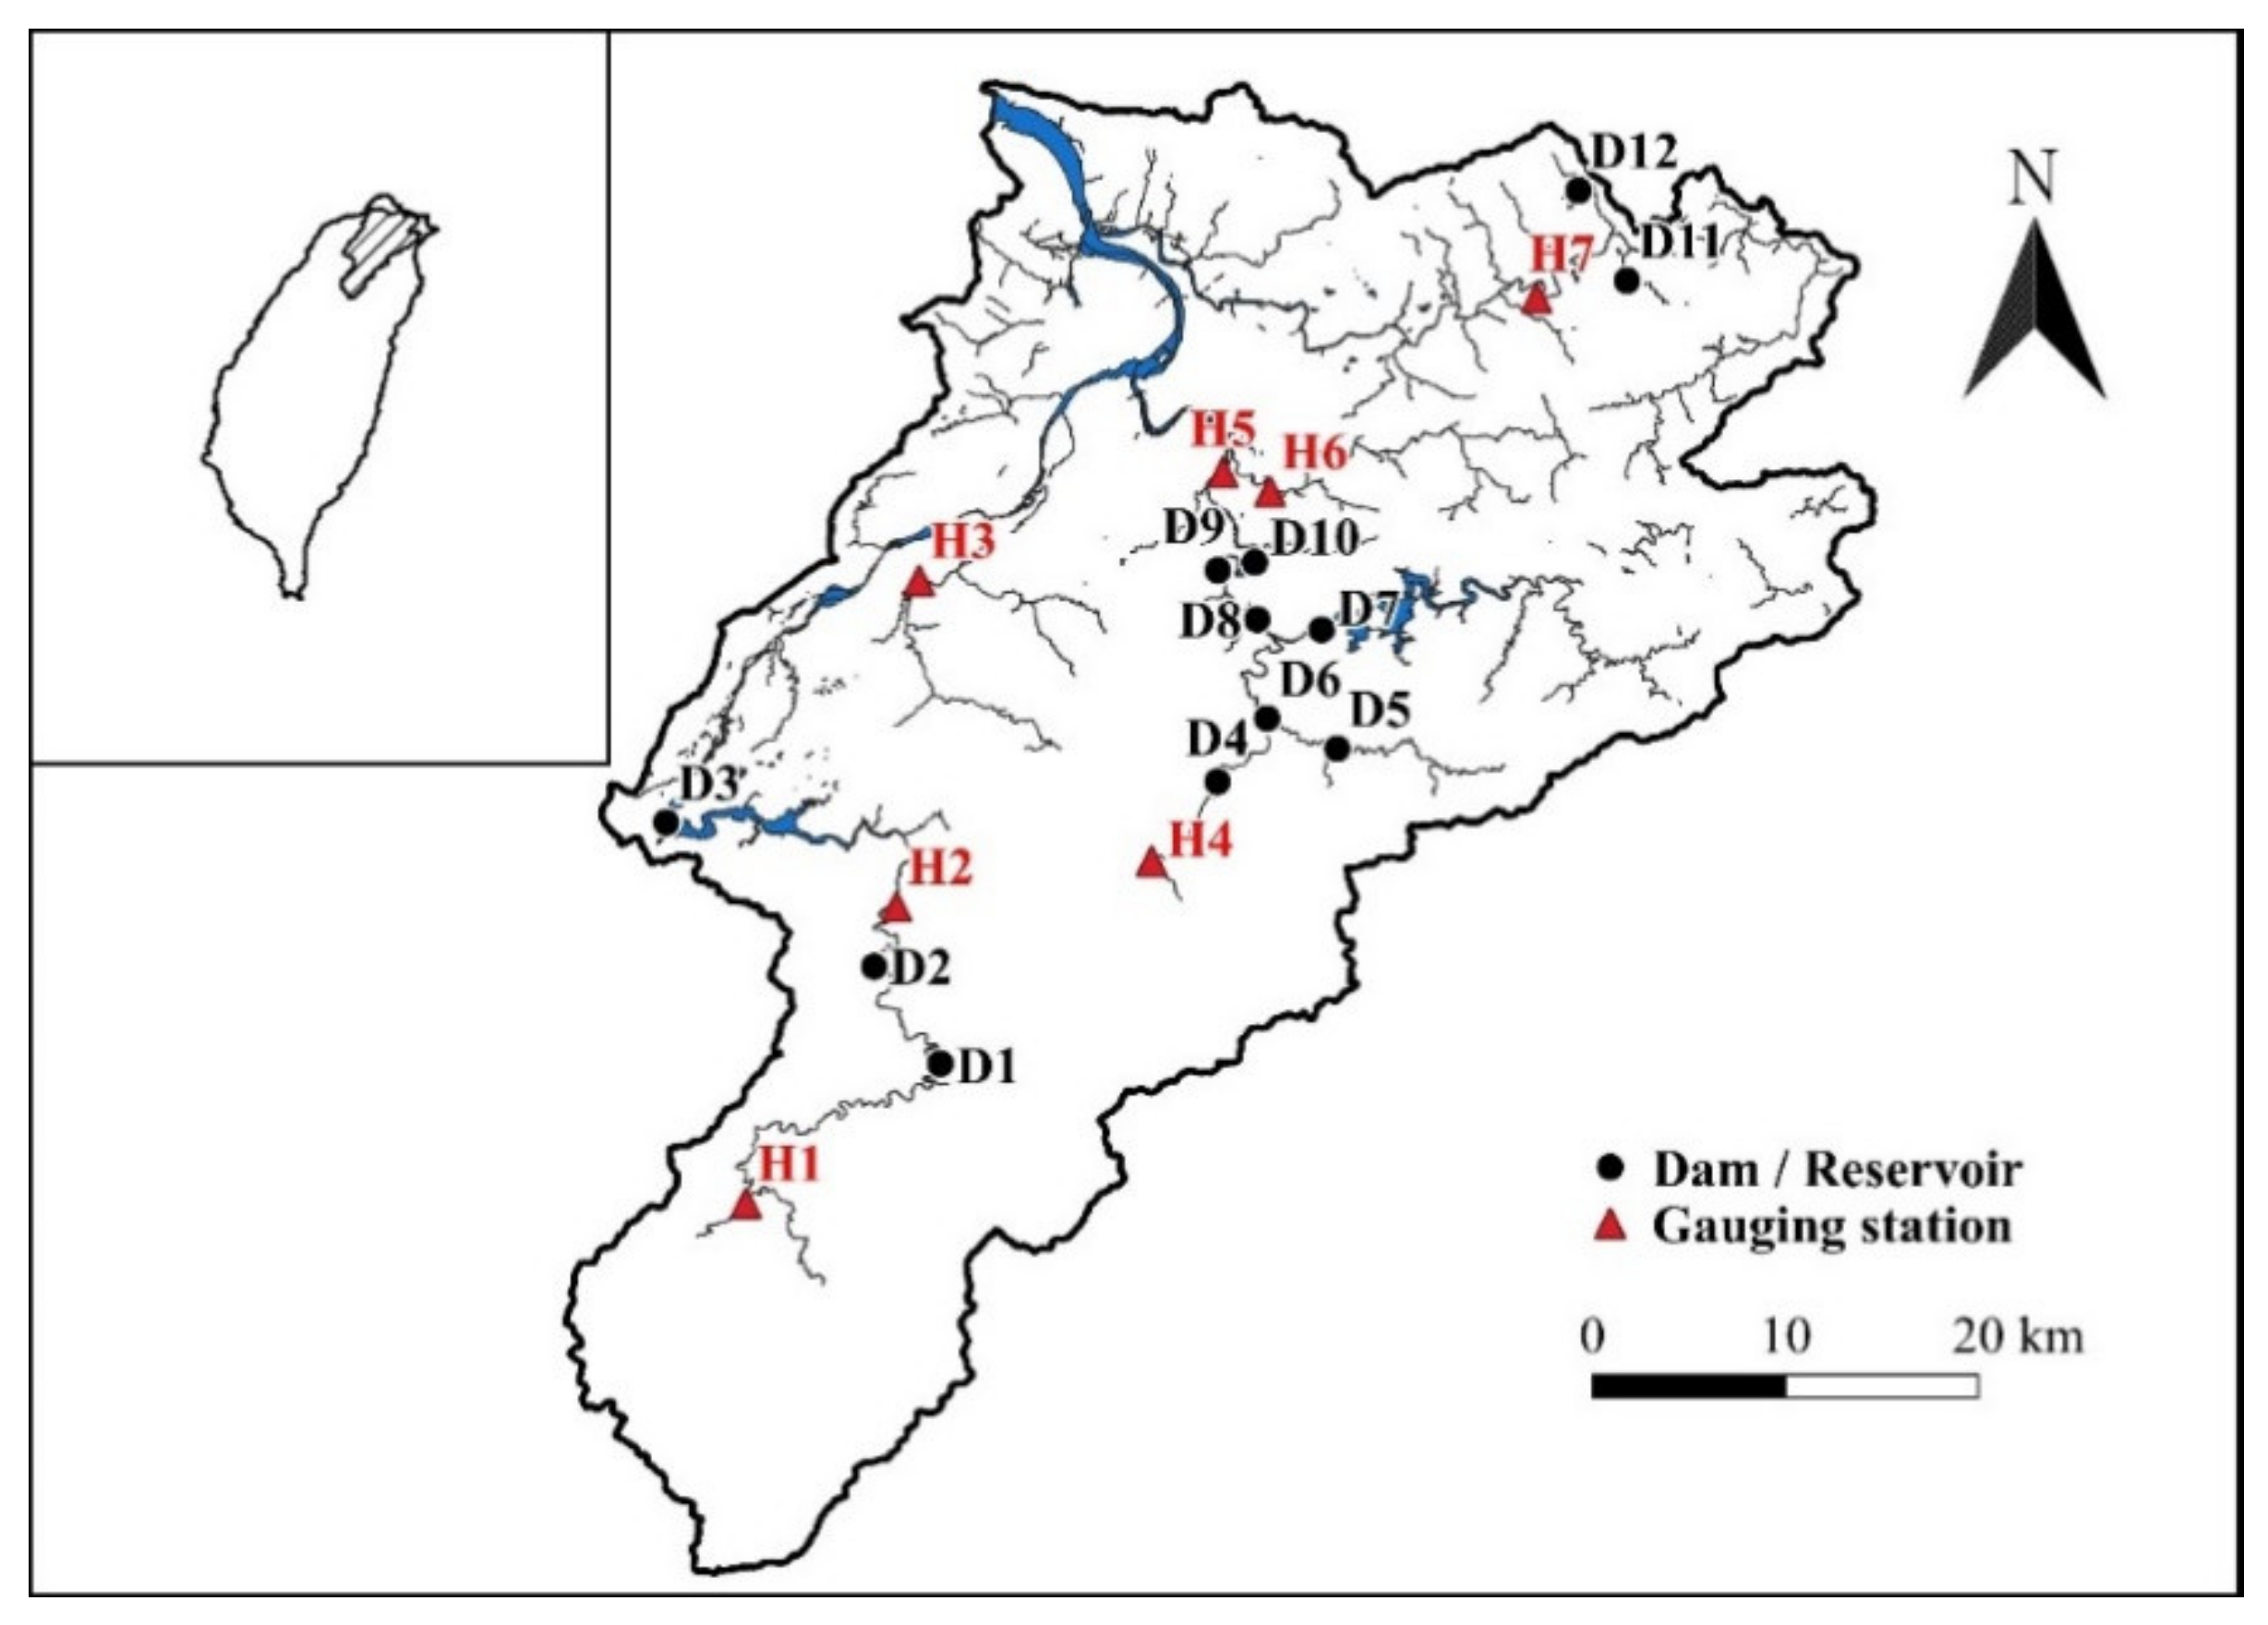
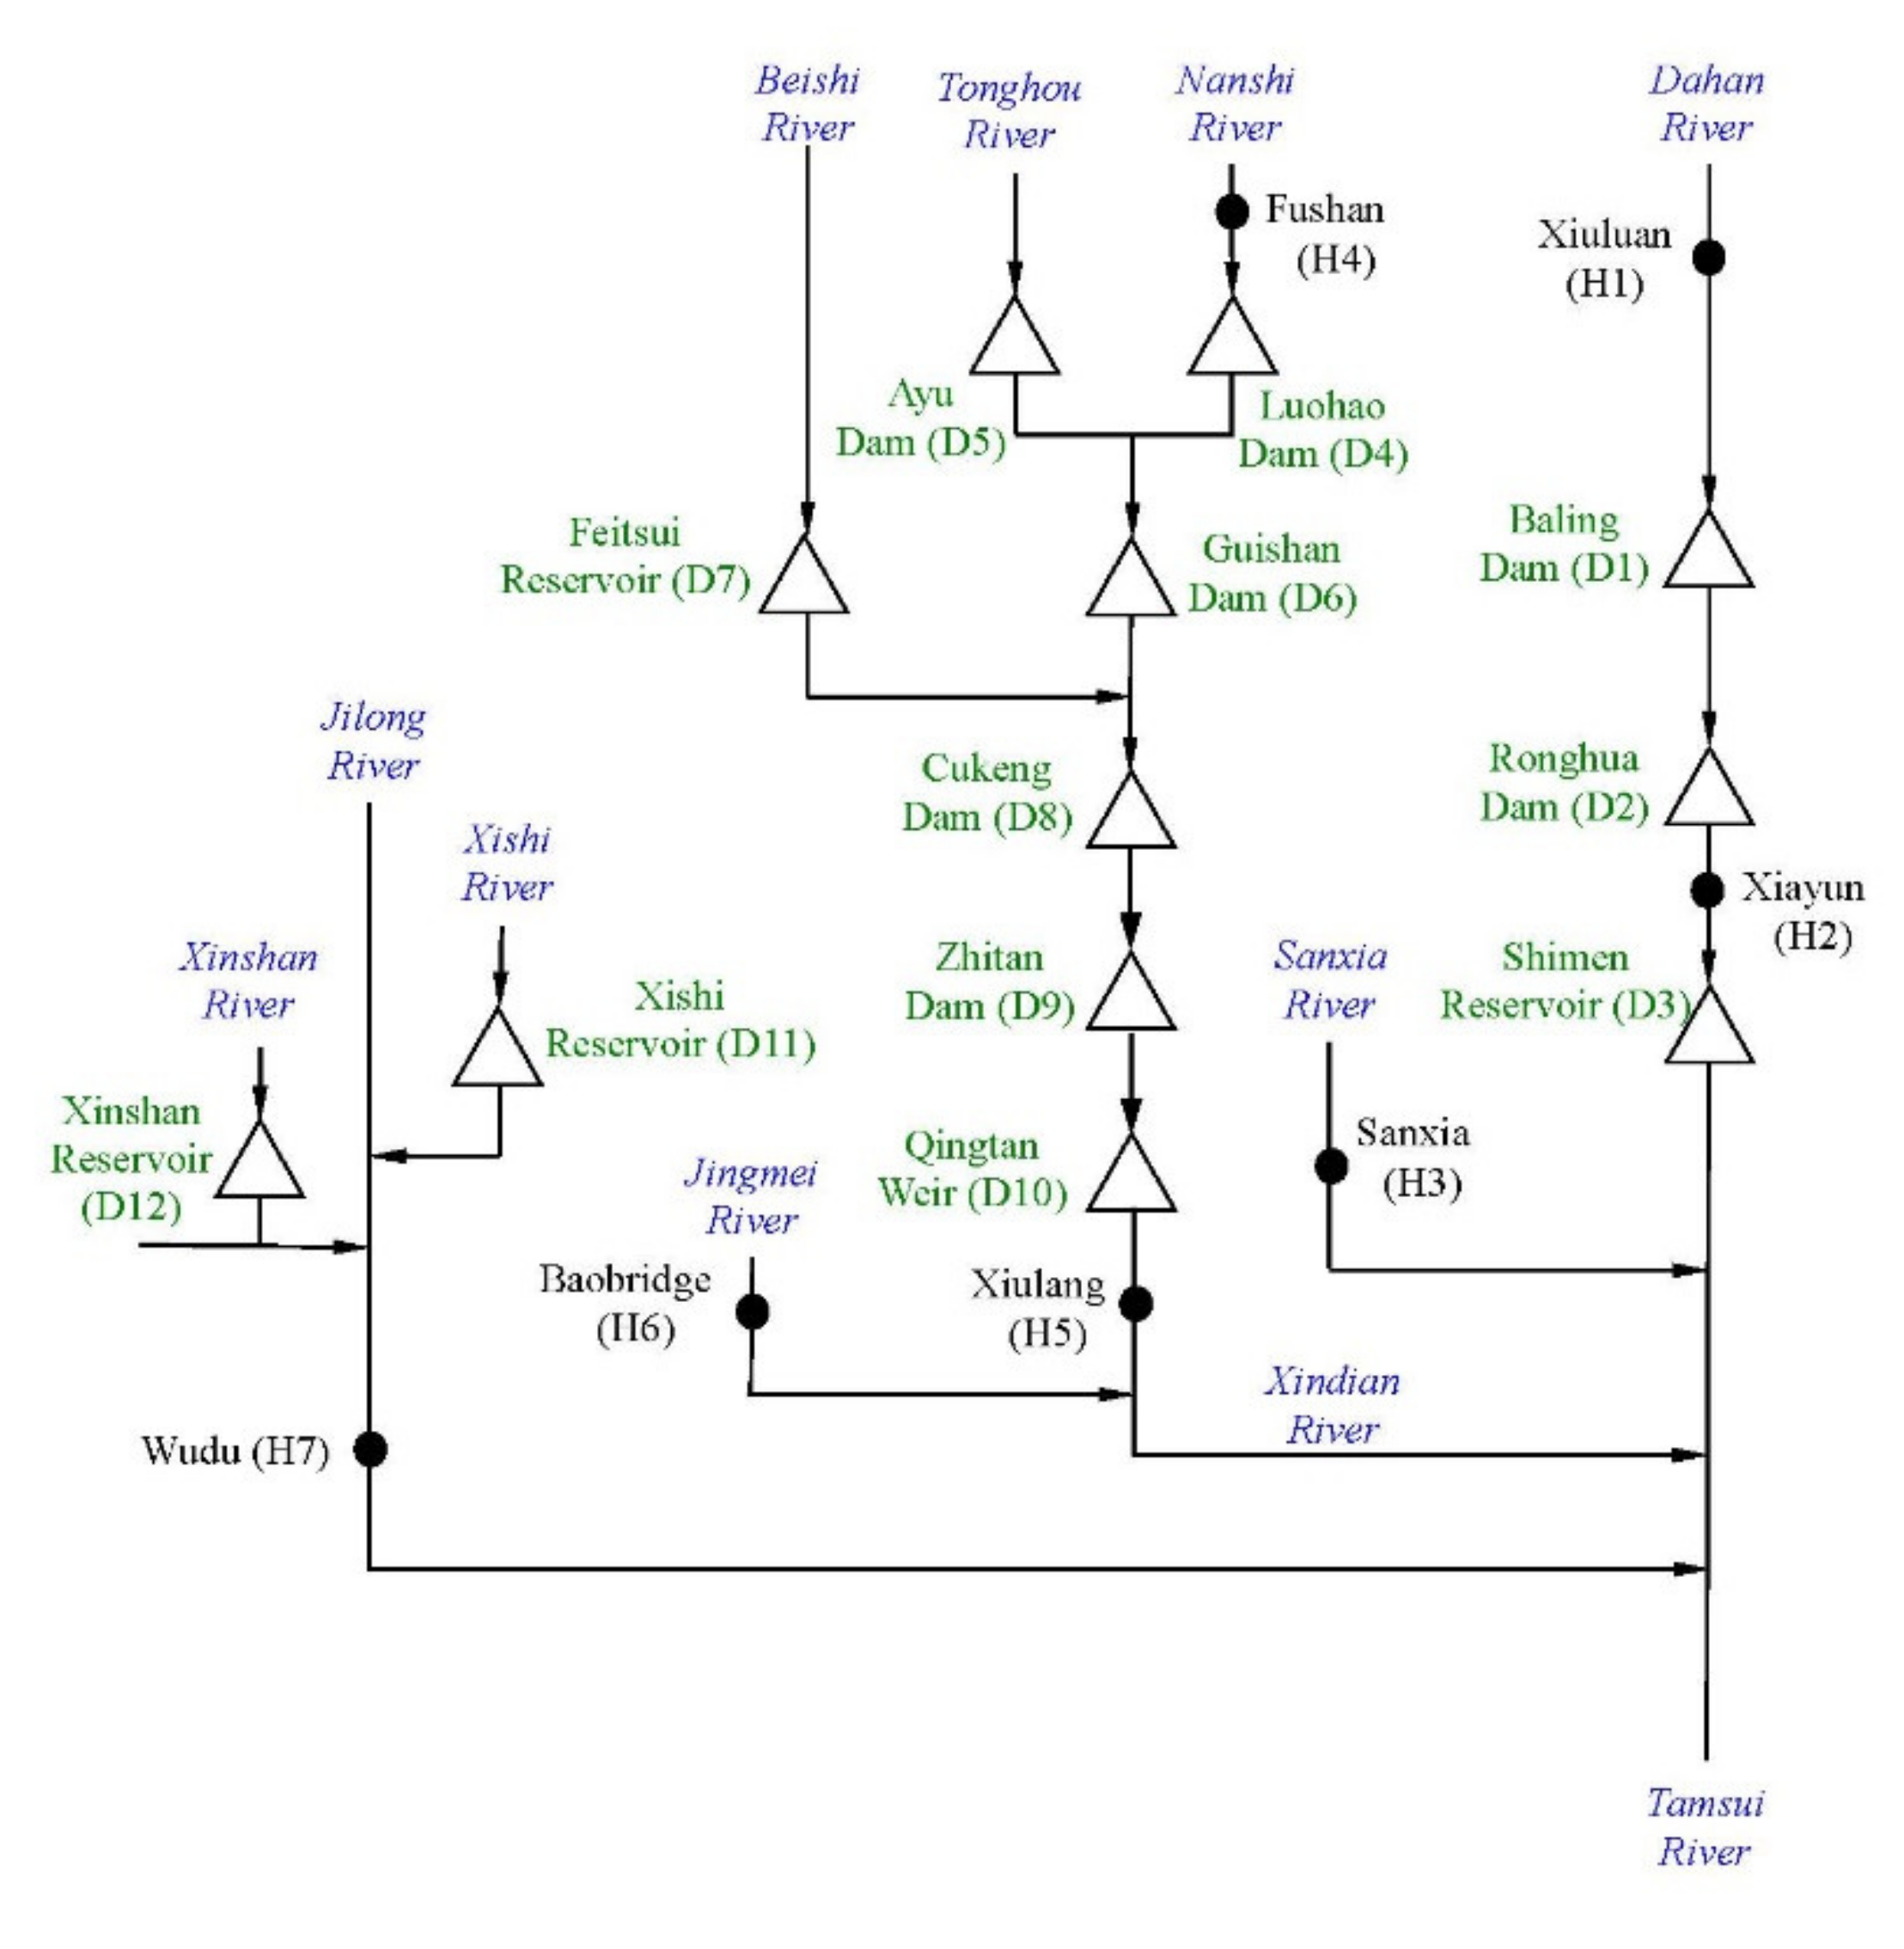
3.1. Overview of the Tamsui River Basin
3.2. Streamflow Data
3.3. Reservoir Index
4. Results and Discussion
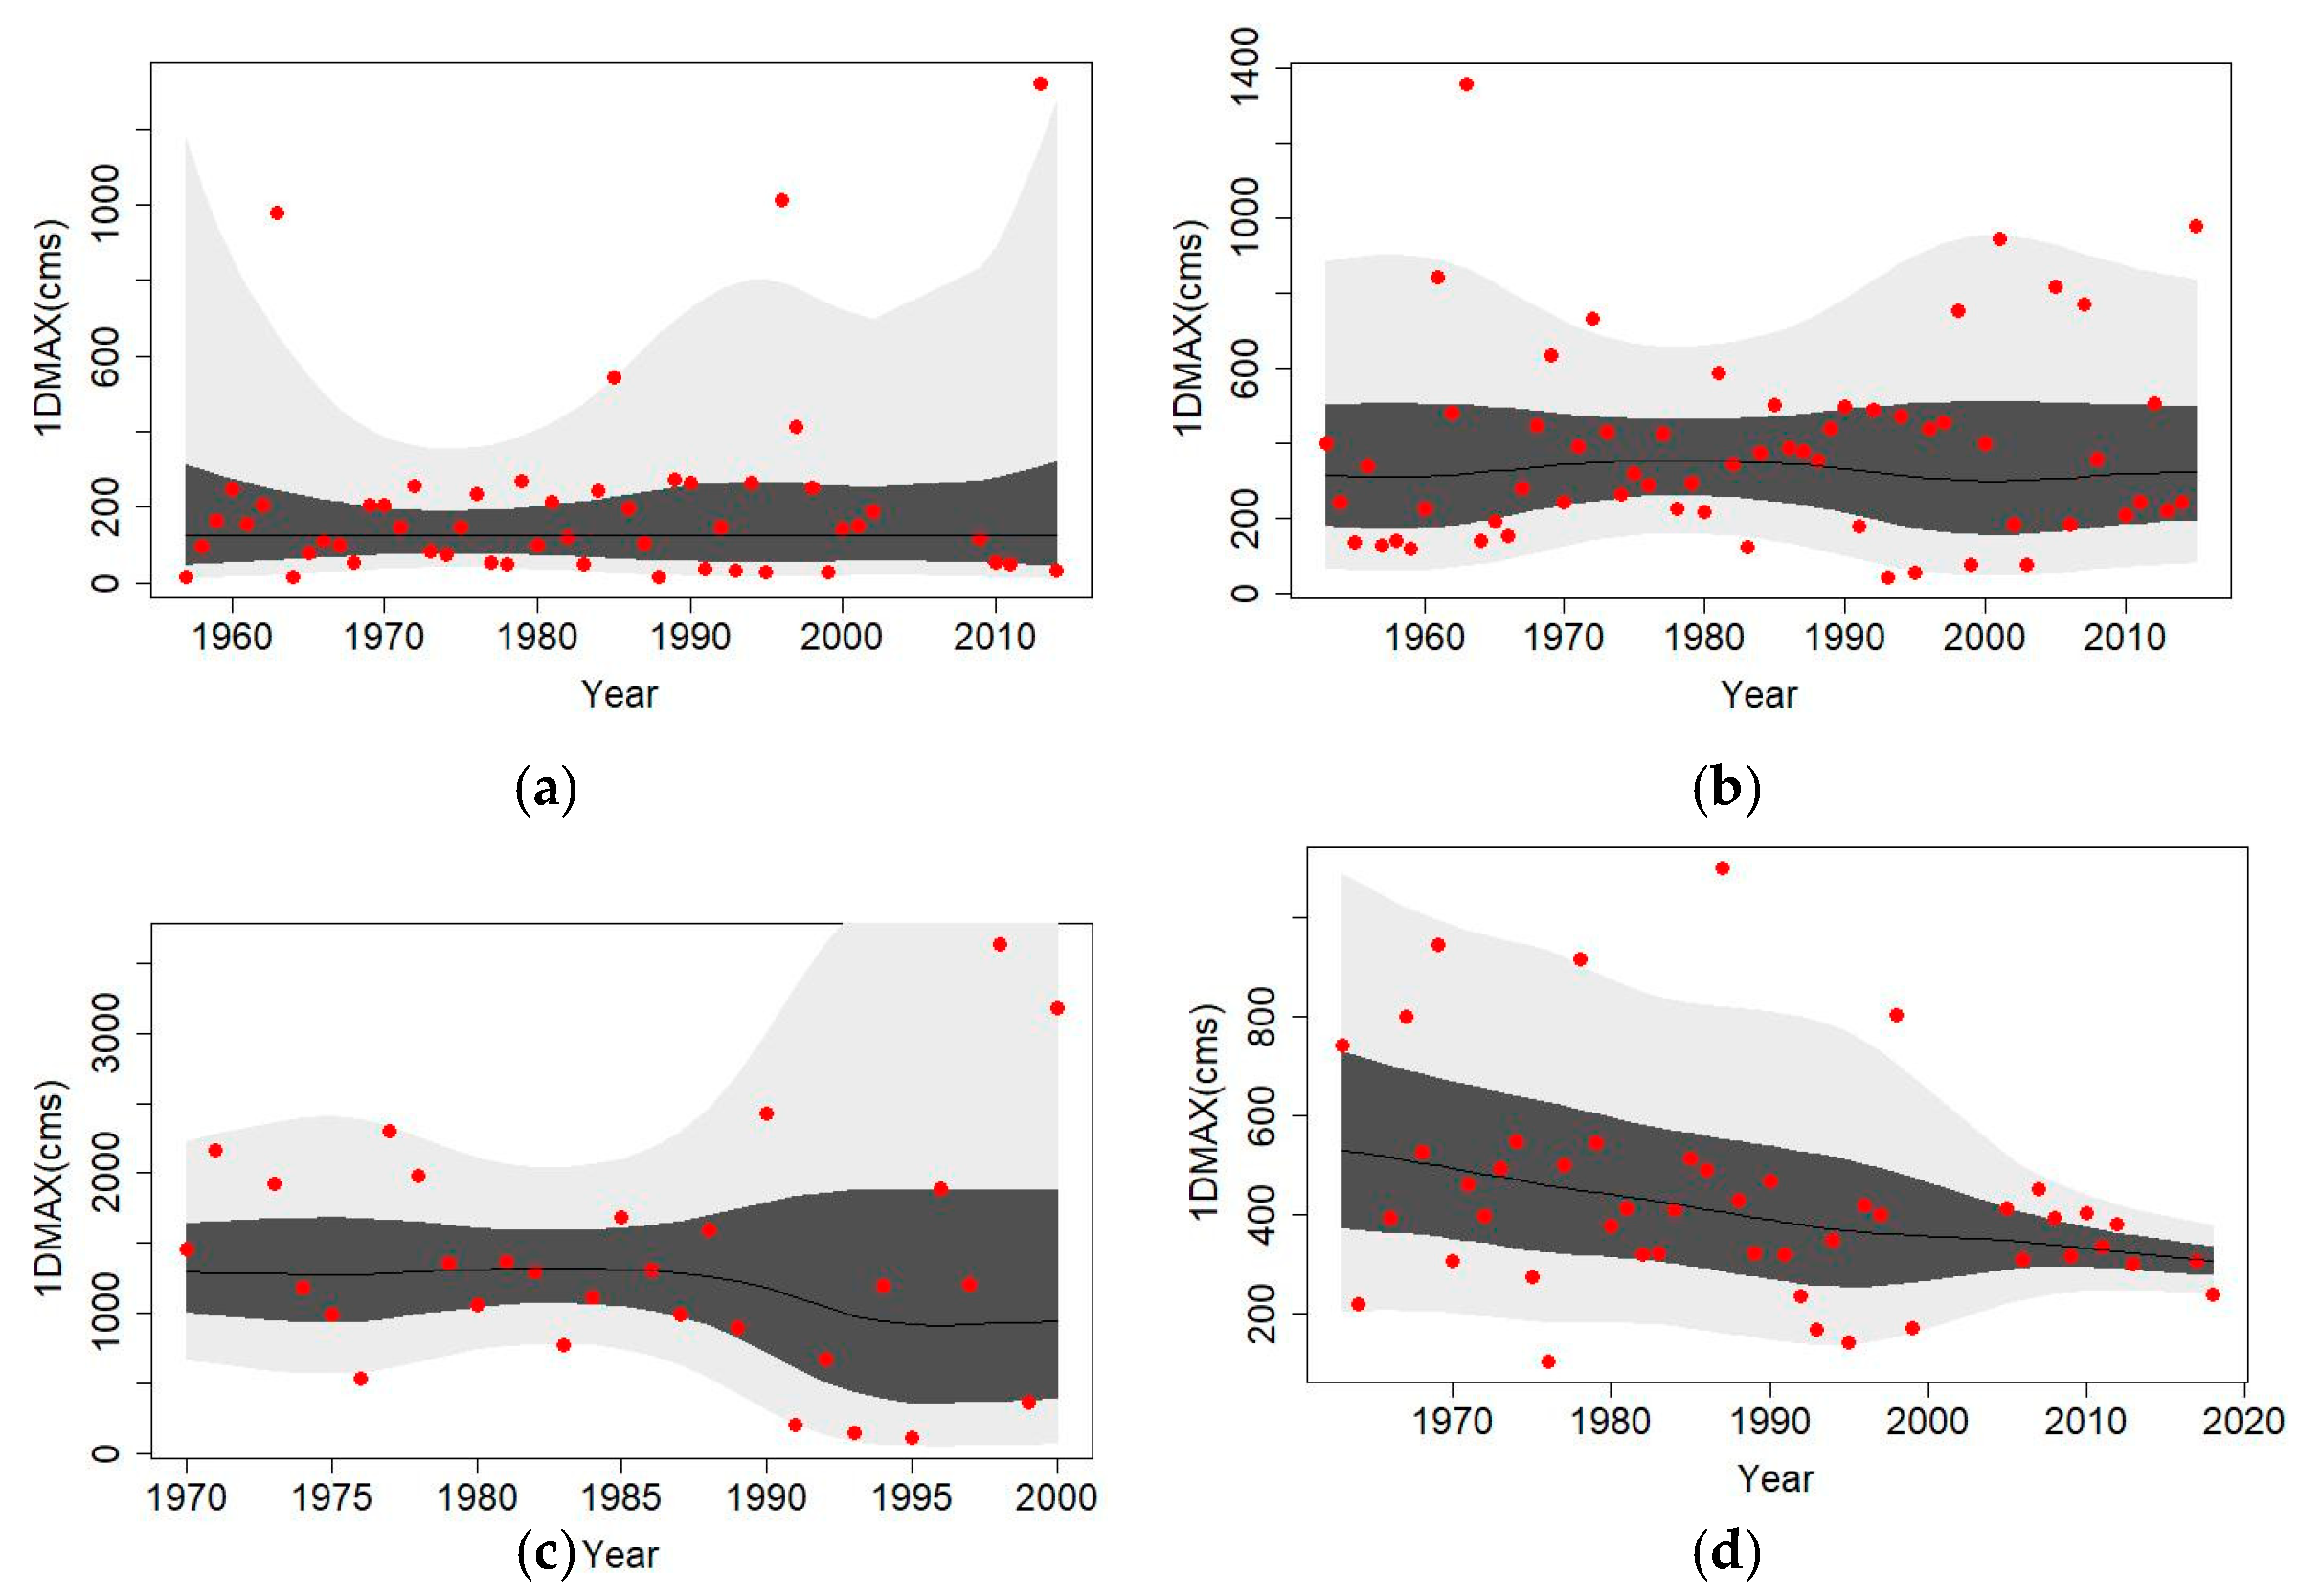
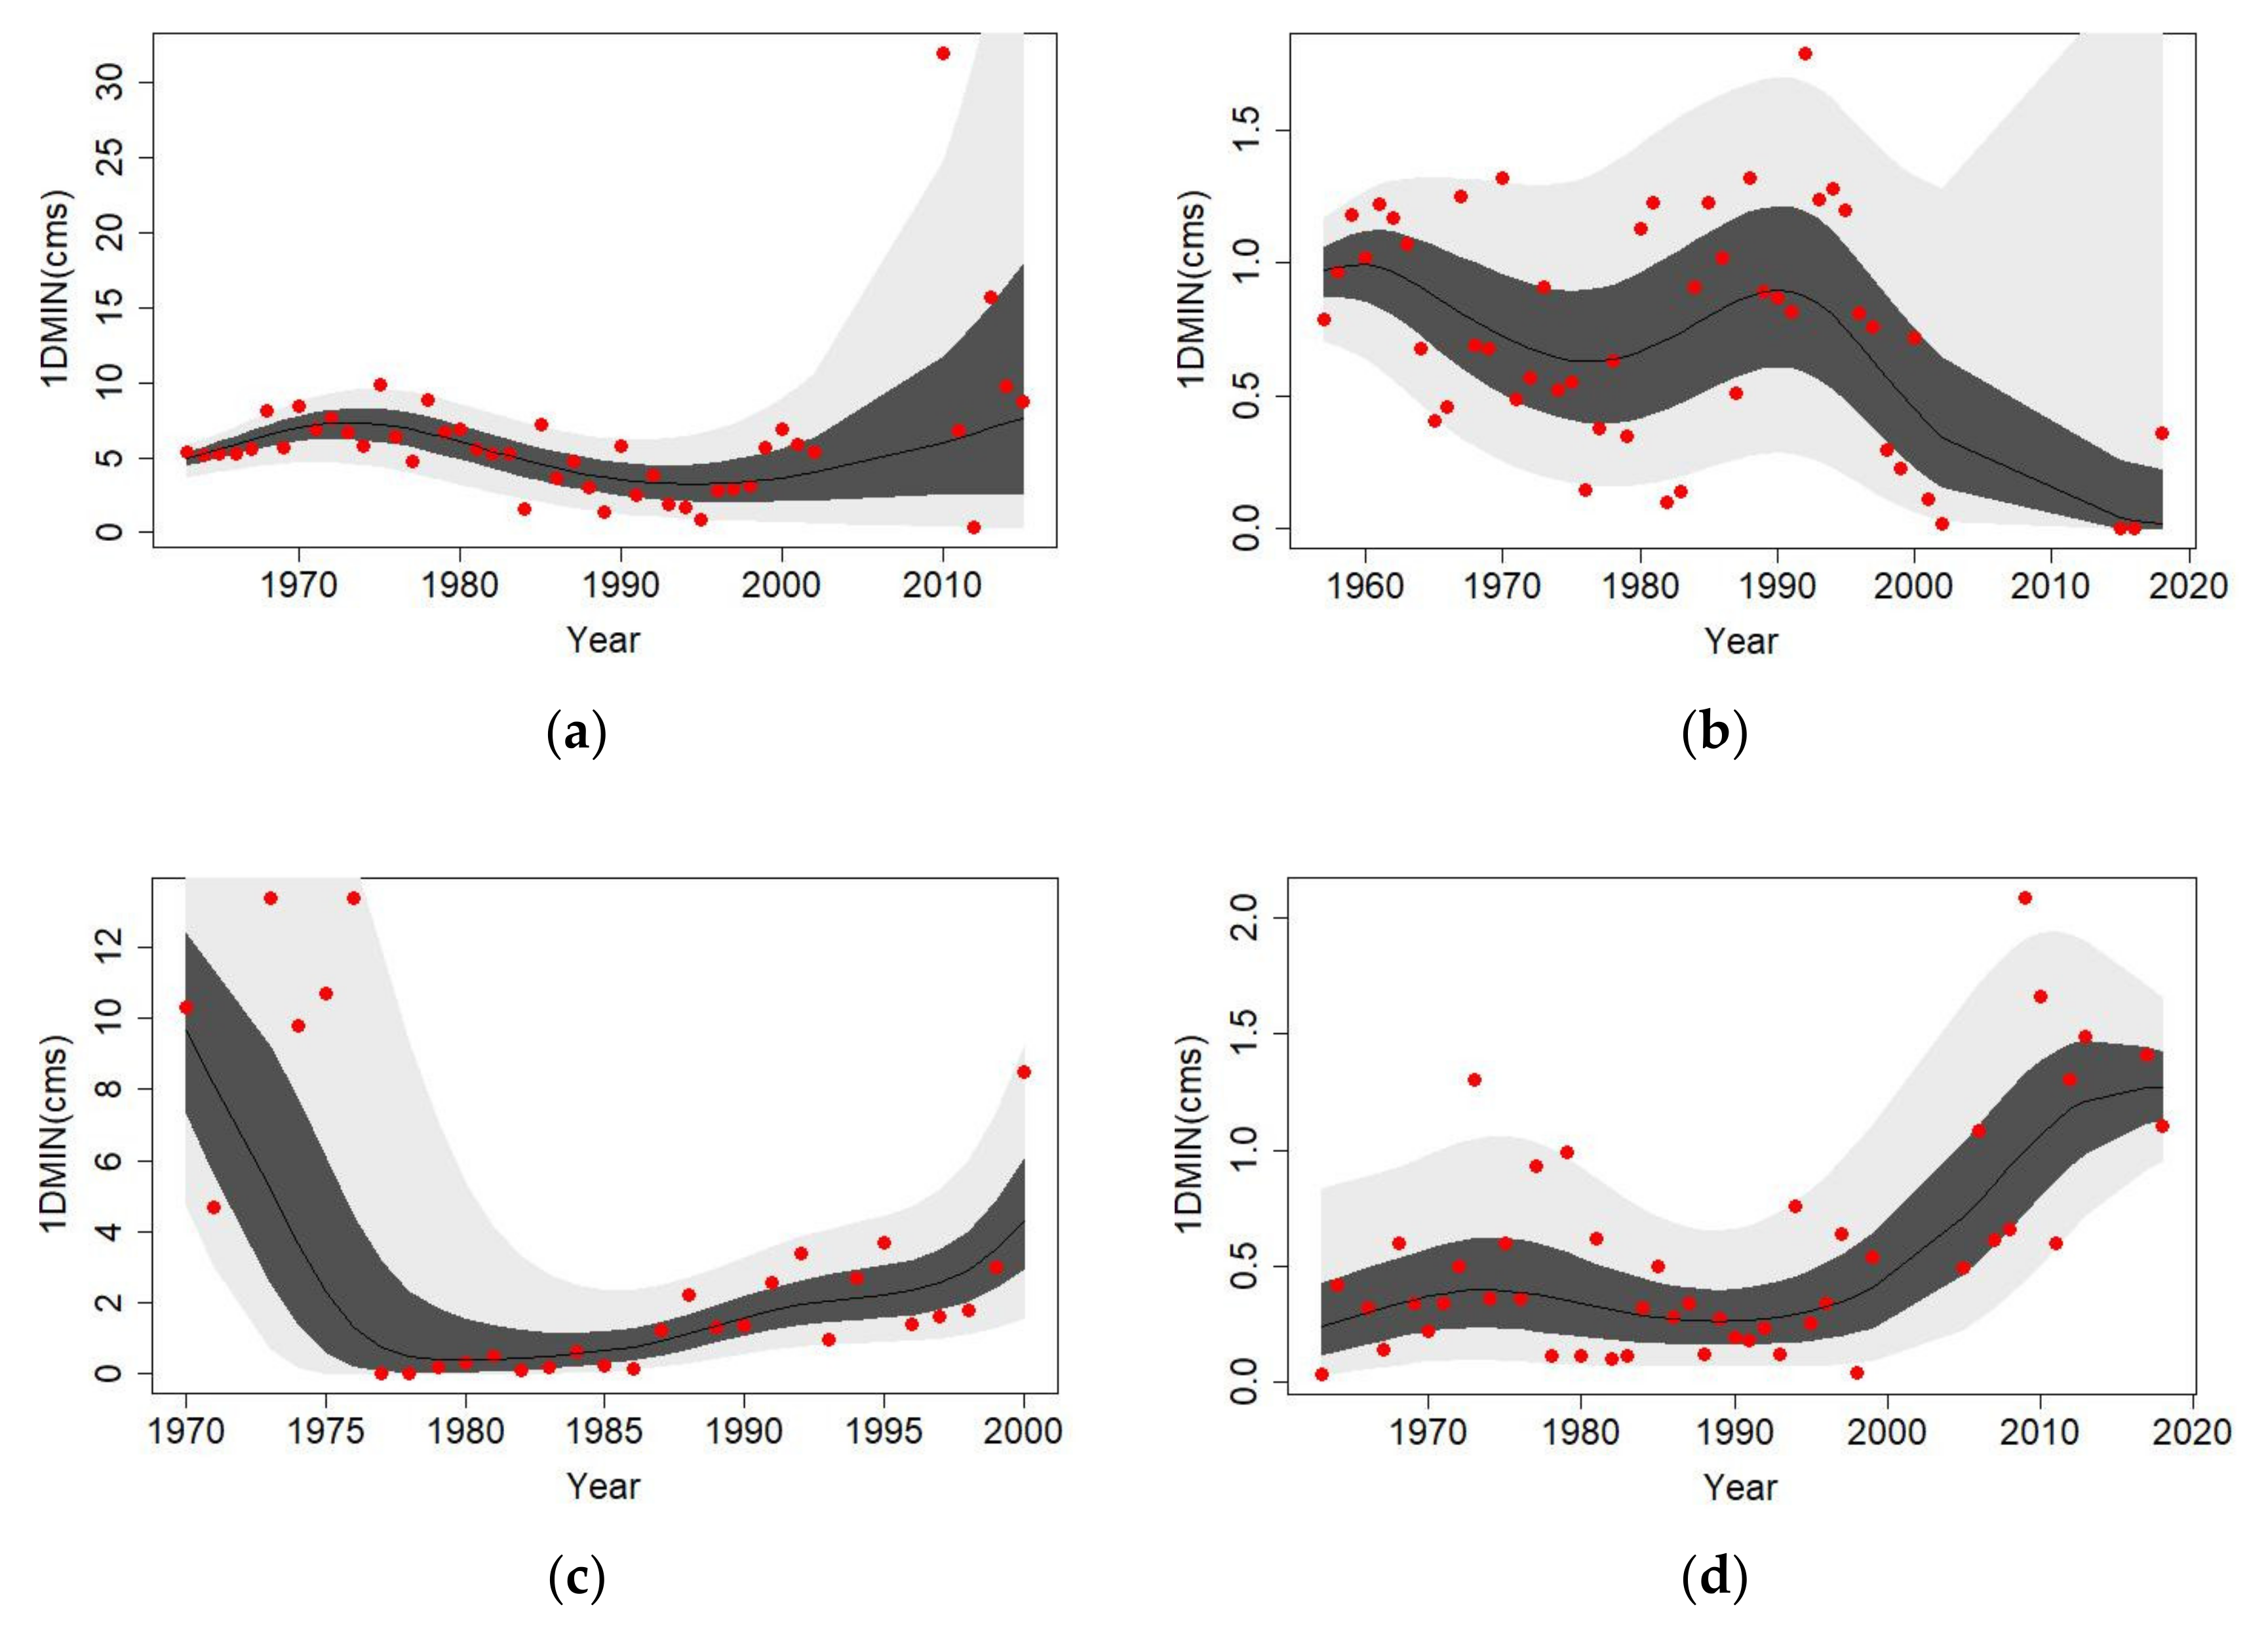
4.1. Time-Covariate Nonstationary Models of the Maximum and Minimum Flow Indices
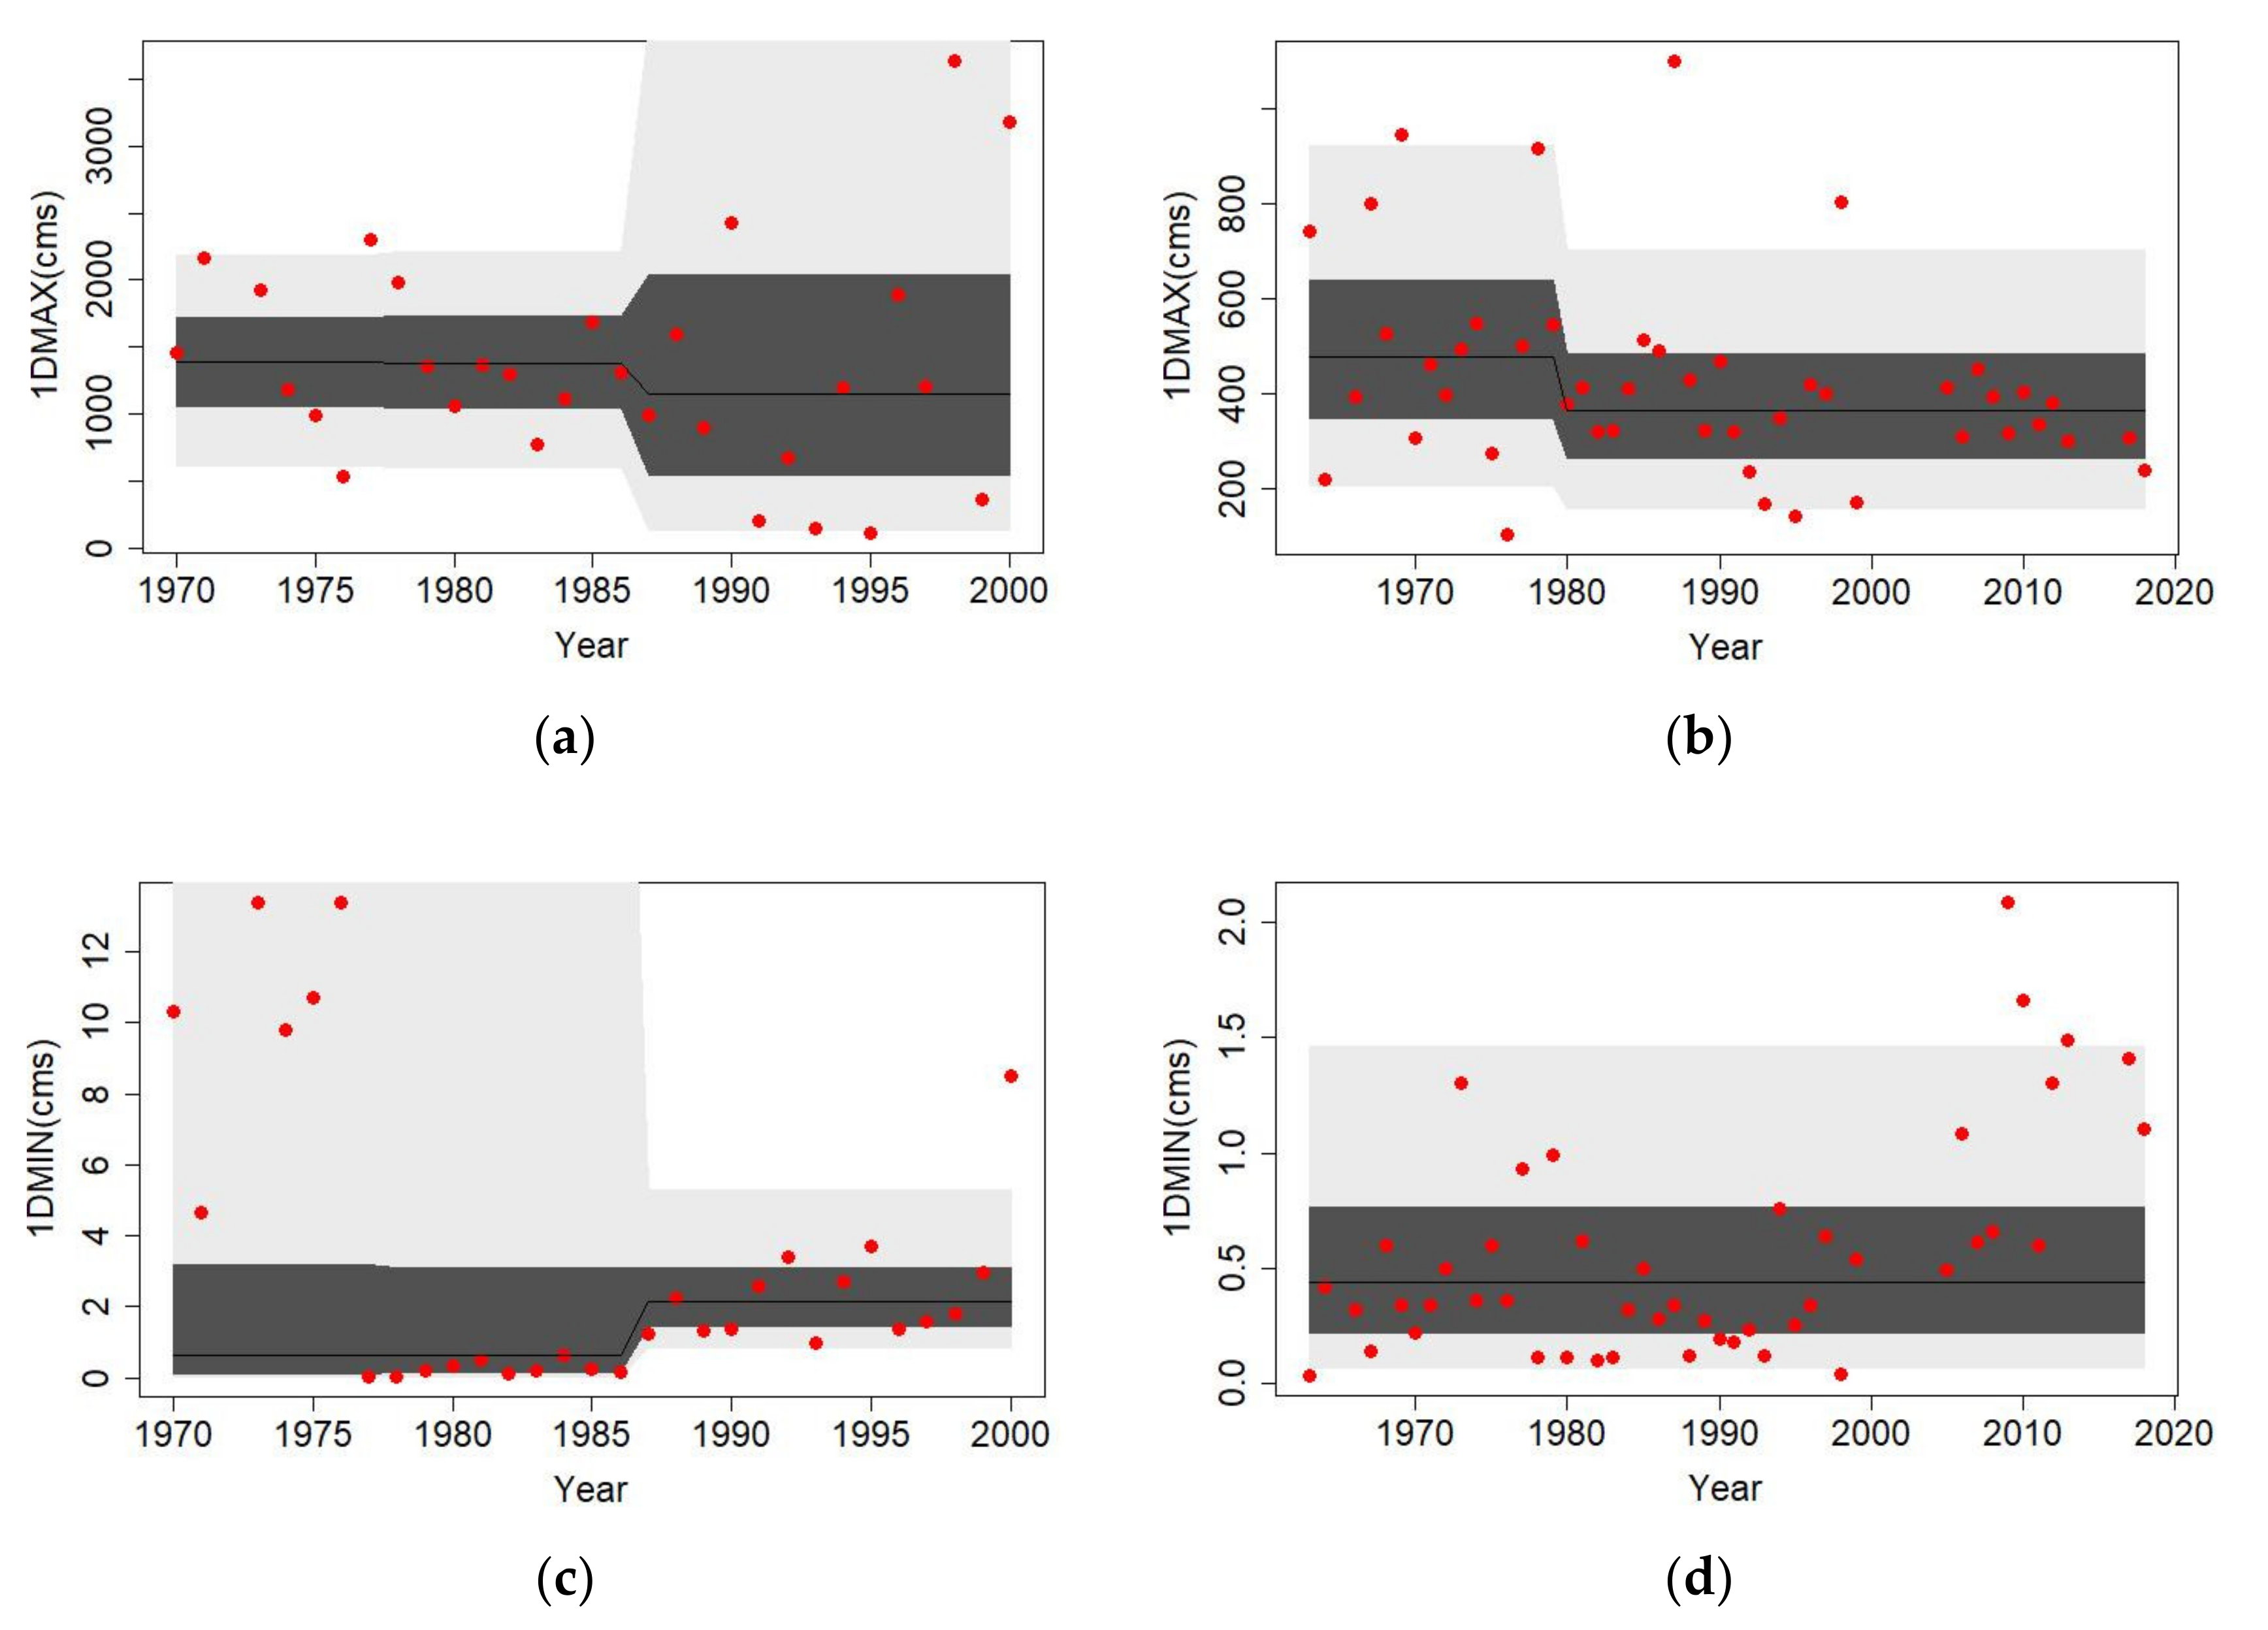
4.2. RI-Covariate Nonstationary Models of Maximum and Minimum Flow Indices
4.3. Discussion
5. Conclusions
Author Contributions
Funding
Institutional Review Board Statement
Informed Consent Statement
Data Availability Statement
Acknowledgments
Conflicts of Interest
References
- Salas, J.D.; Obeysekera, J. Revisiting the Concepts of Return Period and Risk for Nonstationary Hydrologic Extreme Events. J. Hydrol. Eng. 2014, 19, 554–568. [Google Scholar] [CrossRef] [Green Version]
- Read, L.K.; Vogel, R.M. Reliability, return periods, and risk under nonstationarity. Water Resour. Res. 2015, 51, 6381–6398. [Google Scholar] [CrossRef]
- Milly, P.C.D.; Betancourt, J.; Falkenmark, M.; Hirsch, R.M.; Kundzewicz, Z.W.; Lettenmaier, D.P.; Stouffer, R.J. Stationarity Is Dead: Whither Water Management? Sci. 2008, 319, 573–574. [Google Scholar] [CrossRef] [PubMed]
- Cancelliere, A. Nonstationary Analysis of Extreme Events. Water Resour. Manag. 2017, 31, 3097–3110. [Google Scholar] [CrossRef] [Green Version]
- Li, J.; Ma, Q.; Tian, Y.; Lei, Y.; Zhang, T.; Feng, P. Flood scaling under nonstationarity in Daqinghe River basin, China. Nat. Hazards 2019, 98, 675–696. [Google Scholar] [CrossRef]
- Kalai, C.; Mondal, A.; Griffin, A.; Stewart, E. Comparison of Nonstationary Regional Flood Frequency Analysis Techniques Based on the Index-Flood Approach. J. Hydrol. Eng. 2020, 25, 06020003. [Google Scholar] [CrossRef]
- Zhou, L.; Meng, Y.; Lu, C.; Yin, S.; Ren, D. A frequency-domain nonstationary multi-site rainfall generator for use in hydrological impact assessment. J. Hydrol. 2020, 585, 124770. [Google Scholar] [CrossRef]
- Donat, M.G.; Lowry, A.L.; Alexander, L.V.; O’Gorman, P.A.; Maher, N. More extreme precipitation in the world’s dry and wet regions. Nat. Clim. Chang. 2016, 6, 508–513. [Google Scholar] [CrossRef]
- Prein, A.F.; Pendergrass, A.G. Can We Constrain Uncertainty in Hydrologic Cycle Projections? Geophys. Res. Lett. 2019, 46, 3911–3916. [Google Scholar] [CrossRef] [Green Version]
- Markonis, Y.; Papalexiou, S.M.; Martinkova, M.; Hanel, M. Assessment of Water Cycle Intensification Over Land using a Multisource Global Gridded Precipitation DataSet. J. Geophys. Res. Atmos. 2019, 124, 11175–11187. [Google Scholar] [CrossRef]
- Liu, B.; Tan, X.; Gan, T.Y.; Chen, X.; Lin, K.; Lu, M.; Liu, Z. Global atmospheric moisture transport associated with precipitation extremes: Mechanisms and climate change impacts. Wiley Interdiscip. Rev. Water 2020, 7, 1412. [Google Scholar] [CrossRef]
- Tabari, H. Climate change impact on flood and extreme precipitation increases with water availability. Sci. Rep. 2020, 10, 13768. [Google Scholar] [CrossRef]
- Konapala, G.; Mishra, A.K.; Wada, Y.; Mann, M.E. Climate change will affect global water availability through compounding changes in seasonal precipitation and evaporation. Nat. Commun. 2020, 11, 1–10. [Google Scholar] [CrossRef] [PubMed]
- Dong, Q.; Wang, W.; Kunkel, K.E.; Shao, Q.; Xing, W.; Wei, J. Heterogeneous response of global precipitation concentration to global warming. Int. J. Clim. 2021, 41, 2347–2359. [Google Scholar] [CrossRef]
- Gbode, I.E.; Ogunjobi, K.O.; Dudhia, J.; Ajayi, V.O.; Liu, C. Impacts of global warming on West African monsoon rainfall: Downscaling by pseudo global warming method. Atmos. Res. 2021, 249, 105334. [Google Scholar] [CrossRef]
- Li, X.; Zhang, K.; Gu, P.; Feng, H.; Yin, Y.; Chen, W.; Cheng, B. Changes in precipitation extremes in the Yangtze River Basin during 1960–2019 and the association with global warming, ENSO, and local effects. Sci. Total Environ. 2021, 760, 144244. [Google Scholar] [CrossRef]
- Ge, F.; Zhu, S.; Luo, H.; Zhi, X.; Wang, H. Future changes in precipitation extremes over Southeast Asia: insights from CMIP6 multi-model ensemble. Environ. Res. Lett. 2021, 16, 024013. [Google Scholar] [CrossRef]
- Hirpa, F.A.; Alfieri, L.; Lees, T.; Peng, J.; Dyer, E.; Dadson, S.J. Streamflow response to climate change in the Greater Horn of Africa. Clim. Chang. 2019, 156, 341–363. [Google Scholar] [CrossRef] [Green Version]
- Jahandideh-Tehrani, M.; Zhang, H.; Helfer, F.; Yu, Y. Review of climate change impacts on predicted river streamflow in tropical rivers. Environ. Monit. Assess. 2019, 191, 752. [Google Scholar] [CrossRef] [PubMed]
- Kazemi, H.; Sarukkalige, R.; Badrzadeh, H. Evaluation of streamflow changes due to climate variation and human activities using the Budyko approach. Environ. Earth Sci. 2019, 78, 713. [Google Scholar] [CrossRef]
- Li, S.; Zhang, L.; Du, Y.; Zhuang, Y.; Yan, C. Anthropogenic Impacts on Streamflow-Compensated Climate Change Effect in the Hanjiang River Basin, China. J. Hydrol. Eng. 2020, 25, 04019058. [Google Scholar] [CrossRef]
- Gulakhmadov, A.; Chen, X.; Gulahmadov, N.; Liu, T.; Anjum, M.N.; Rizwan, M. Simulation of the Potential Impacts of Projected Climate Change on Streamflow in the Vakhsh River Basin in Central Asia under CMIP5 RCP Scenarios. Water 2020, 12, 1426. [Google Scholar] [CrossRef]
- Sönmez, A.Y.; Kale, S. Climate change effects on annual streamflow of Filyos River (Turkey). J. Water Clim. Chang. 2020, 11, 420–433. [Google Scholar] [CrossRef]
- Xiong, B.; Xiong, L.; Xia, J.; Xu, C.-Y.; Jiang, C.; Du, T. Assessing the impacts of reservoirs on downstream flood frequency by coupling the effect of scheduling-related multivariate rainfall with an indicator of reservoir effects. Hydrol. Earth Syst. Sci. 2019, 23, 4453–4470. [Google Scholar] [CrossRef] [Green Version]
- Ray, L.K.; Goel, N.K. Flood Frequency Analysis of Narmada River Basin in India under Nonstationary Condition. J. Hydrol. Eng. 2019, 24, 05019018. [Google Scholar] [CrossRef]
- Lu, F.; Song, X.; Xiao, W.; Zhu, K.; Xie, Z. Detecting the impact of climate and reservoirs on extreme floods using nonstationary frequency models. Stoch. Environ. Res. Risk Assess. 2020, 34, 169–182. [Google Scholar] [CrossRef]
- Wang, Y.; Duan, L.; Liu, T.; Li, J.; Feng, P. A Non-stationary Standardized Streamflow Index for hydrological drought using climate and human-induced indices as covariates. Sci. Total Environ. 2020, 699, 134278. [Google Scholar] [CrossRef]
- Osipova, N.V.; Bolgov, M.V. Assessing the Characteristics of the Maximal Spring Flood Runoff in the Don Basin under Nonstationary Conditions. Water Resour. 2020, 47, 945–952. [Google Scholar] [CrossRef]
- Zhou, Y. Exploring multidecadal changes in climate and reservoir storage for assessing nonstationarity in flood peaks and risks worldwide by an integrated frequency analysis approach. Water Res. 2020, 185, 116265. [Google Scholar] [CrossRef] [PubMed]
- Xiong, B.; Xiong, L.; Guo, S.; Xu, C.; Xia, J.; Zhong, Y.; Yang, H. Nonstationary Frequency Analysis of Censored Data: A Case Study of the Floods in the Yangtze River from 1470 to 2017. Water Resour. Res. 2020, 56, e2020WR027112. [Google Scholar] [CrossRef]
- Yan, L.; Xiong, L.H.; Luan, Q.H.; Jiang, C.; Yu, K.X.; Xu, C.Y. On the applicability of the expected waiting time method in nonstationary flood design. Water Resour. Manag. 2020, 34, 2585–2601. [Google Scholar] [CrossRef]
- Chu, P.-S.; Zhang, H.; Chang, H.-L.; Chen, T.-L.; Tofte, K. Trends in return levels of 24-hr precipitation extremes during the typhoon season in Taiwan. Int. J. Clim. 2018, 38, 5107–5124. [Google Scholar] [CrossRef]
- Huang, W.-R.; Wang, S.-Y.S.; Guan, B.T. Decadal fluctuations in the western Pacific recorded by long precipitation records in Taiwan. Clim. Dyn. 2018, 50, 1597–1608. [Google Scholar] [CrossRef] [Green Version]
- Kao, P.-K.; Hung, C.-W.; Hong, C.-C. Increasing influence of central Pacific El Niño on the inter-decadal variation of spring rainfall in northern Taiwan and southern China since 1980. Atmos. Sci. Lett. 2018, 19, e864. [Google Scholar] [CrossRef]
- Wu, Y.; Wang, S.S.; Yu, Y.; Kung, C.; Wang, A.; Los, S.A.; Huang, W. Climatology and change of extreme precipitation events in Taiwan based on weather types. Int. J. Clim. 2019, 39, 5351–5366. [Google Scholar] [CrossRef] [Green Version]
- Shiau, J.-T.; Chiu, Y.-F. Wavelet-Based Detection of Time-Frequency Changes for Monthly Rainfall and SPI Series in Taiwan. Asia-Pac. J. Atmos. Sci. 2019, 55, 657–667. [Google Scholar] [CrossRef]
- Li, C.-Y.; Lin, S.-S.; Chuang, C.-M.; Hu, Y.-L. Assessing future rainfall uncertainties of climate change in Taiwan with a bootstrapped neural network-based downscaling model. Water Environ. J. 2020, 34, 77–92. [Google Scholar] [CrossRef]
- Tung, Y.; Wang, S.S.; Chu, J.; Wu, C.; Chen, Y.; Cheng, C.; Lin, L. Projected increase of the East Asian summer monsoon (Meiyu) in Taiwan by climate models with variable performance. Meteorol. Appl. 2020, 27, e1886. [Google Scholar] [CrossRef] [Green Version]
- Yeh, C.-F.; Wang, J.; Yeh, H.-F.; Lee, C.-H. Spatial and Temporal Streamflow Trends in Northern Taiwan. Water 2015, 7, 634–651. [Google Scholar] [CrossRef] [Green Version]
- Rigby, R.A.; Stasinopoulos, D.M. Generalized additive models for location, scale and shape. Appl. Stat. 2005, 54, 507–554. [Google Scholar] [CrossRef] [Green Version]
- Shiau, J.-T.; Wu, P.-S. Nonstationary Distributional Changes of Annual Rainfall Indices in Taiwan. Asia-Pac. J. Atmos. Sci. 2020, 1–16. [Google Scholar] [CrossRef]
- Khaliq, M.; Ouarda, T.; Ondo, J.-C.; Gachon, P.; Bobée, B. Frequency analysis of a sequence of dependent and/or non-stationary hydro-meteorological observations: A review. J. Hydrol. 2006, 329, 534–552. [Google Scholar] [CrossRef]
- Yu, J.; Kim, T.-W.; Park, D.-H. Future Hydrological Drought Risk Assessment Based on Nonstationary Joint Drought Management Index. Water 2019, 11, 532. [Google Scholar] [CrossRef] [Green Version]
- De Medeiros, E.S.; de Lima, R.R.; de Olinda, R.A.; Dantas, L.G.; dos Santos, C.A.C. Space-time kriging of precipitation: Modeling the large-scale variation with model GAMLSS. Water 2019, 11, 2368. [Google Scholar] [CrossRef] [Green Version]
- Shiau, J.-T. Effects of Gamma-Distribution Variations on SPI-Based Stationary and Nonstationary Drought Analyses. Water Resour. Manag. 2020, 34, 2081–2095. [Google Scholar] [CrossRef]
- Qu, C.; Li, J.; Yan, L.; Yan, P.; Cheng, F.; Lu, D. Non-Stationary Flood Frequency Analysis Using Cubic B-Spline-Based GAMLSS Model. Water 2020, 12, 1867. [Google Scholar] [CrossRef]
- Stasinopoulos, D.M.; Rigby, R.A. Generalized additive models for location scale and shape (GAMLSS) in R. J. Stat. Softw. 2007, 23, 1–46. [Google Scholar] [CrossRef] [Green Version]
- Lopez, J.J.; Frances, F.C. Non-stationary flood frequency analysis in continental Spanish rivers, using climate and reservoir indices as external covariates. Hydrol. Earth Syst. Sci. 2013, 17, 3189–3203. [Google Scholar] [CrossRef] [Green Version]
- Li, J.; Tan, S. Nonstationary Flood Frequency Analysis for Annual Flood Peak Series, Adopting Climate Indices and Check Dam Index as Covariates. Water Resour. Manag. 2015, 29, 5533–5550. [Google Scholar] [CrossRef]
- Jiang, C.; Xiong, L.; Xu, C.-Y.; Guo, S. Bivariate frequency analysis of nonstationary low-flow series based on the time-varying copula. Hydrol. Process. 2015, 29, 1521–1534. [Google Scholar] [CrossRef]
- Villarini, G.; Smith, J.A.; Serinaldi, F.; Bales, J.; Bates, P.D.; Krajewski, W.T. Flood frequency analysis for the nonstationary annual peak records in an urban drainage basin. Adv. Water Resour. 2009, 32, 1255–1266. [Google Scholar] [CrossRef]


| Distribution | Probability Density Function | Range of Parameters | Types of Link Function | |
|---|---|---|---|---|
| θ1 | θ2 | |||
| Lognormal (LNO) | θ1>0, θ2>0 | identity() | ln() | |
| Logistic (LO) | −∞<θ1<∞, θ2>0 | identity() | ln() | |
| Gamma (GA) | θ1>0, θ2>0 | ln() | ln() | |
| Gumbel (GU) | −∞<θ1<∞, θ2>0 | identity() | ln() | |
| Weibull (WEI) | θ1>0, θ2>0 | identity() | ln() | |
| Distribution | Mean | Variance | Note |
|---|---|---|---|
| Lognormal (LNO) | |||
| Logistic (LO) | |||
| Gamma (GA) | |||
| Gumbel (GU) | |||
| Weibull (WEI) |
| Code | Station Name | Station Number | Catchment Area (km2) | Record Years | Data Length (Years) |
|---|---|---|---|---|---|
| H1 | Xiuluan | 1140H041 | 115.93 | 1957–2002, 2009–2011, 2013–2014 | 51 |
| H2 | Xiayun | 1140H054 | 622.80 | 1963–2002, 2010–2015 | 46 |
| H3 | Sanxia | 1140H048 | 125.34 | 1957–2002, 2015–2018 | 49 |
| H4 | Fushan | 1140H010 | 160.40 | 1953–2003, 2005–2008, 2010–2015 | 61 |
| H5 | Xiulang | 1140H066 | 750.76 | 1970–1971, 1973–2000 | 32 |
| H6 | Baobridge | 1140H082 | 109.22 | 1987–2002, 2008–2018 | 27 |
| H7 | Wudu | 1140H058 | 204.41 | 1963–1964, 1966–1999, 2005–2013, 2017–2018 | 47 |
| Code | 1DMAX | 2DMAX | 1DMIN | 7DMIN | 30DMIN | |||||
|---|---|---|---|---|---|---|---|---|---|---|
| Mean (m3/s) | STD (m3/s) | Mean (m3/s) | STD (m3/s) | Mean (m3/s) | STD (m3/s) | Mean (m3/s) | STD (m3/s) | Mean (m3/s) | STD (m3/s) | |
| H1 | 202.7 | 253.9 | 138.8 | 157.9 | 0.80 | 0.32 | 0.85 | 0.33 | 1.04 | 0.37 |
| H2 | 1201.4 | 1092.5 | 845.5 | 747.4 | 6.07 | 4.79 | 7.27 | 4.48 | 8.72 | 4.99 |
| H3 | 230.9 | 169.0 | 161.1 | 114.7 | 0.74 | 0.43 | 0.97 | 0.50 | 1.58 | 0.66 |
| H4 | 378.8 | 255.5 | 279.0 | 174.1 | 4.20 | 1.20 | 4.53 | 1.27 | 5.54 | 1.52 |
| H5 | 1366.6 | 829.6 | 972.7 | 535.1 | 3.34 | 4.16 | 4.92 | 5.76 | 9.10 | 9.44 |
| H6 | 234.5 | 134.8 | 171.9 | 92.2 | 0.75 | 0.49 | 0.94 | 0.49 | 1.66 | 0.79 |
| H7 | 428.5 | 208.6 | 334.1 | 187.3 | 0.56 | 0.47 | 0.69 | 0.54 | 1.55 | 1.05 |
| Code | Dams | Dam Height (m) | Total Capacity (×104 m3) | Catchment Area (km2) | Finished Year |
|---|---|---|---|---|---|
| D1 | Baling Dam | 38.0 | 1047 | 499.5 | 1977 |
| D2 | Ronghua Dam | 82.0 | 1240 | 561.6 | 1984 |
| D3 | Shimen Reservoir | 133.1 | 39120 | 763.4 | 1964 |
| D4 | Luohao Dam | 16.0 | 30.8 | 210.0 | 1954 |
| D5 | Ayu Dam | 9.5 | 10.5 | 72.8 | 1947 |
| D6 | GuiShan Dam | 10.0 | 42.3 | 312.7 | 1941 |
| D7 | Feitsui Reservoir | 122.5 | 40600 | 303.0 | 1987 |
| D8 | CuKeng Dam | 3.6 | 24.0 | 645.7 | 1909 |
| D9 | Zhitan Dam | 40.0 | 417.7 | 679.8 | 1978 |
| D10 | Qingtan Weir | 3.0 | 83.2 | 716.8 | 1975 |
| D11 | Xishi Reservoir | 29.6 | 45.0 | 6.7 | 1926 |
| D12 | Xinshan Reservoir | 66.0 | 1000 | 1.6 | 1980 |
| Index | Parameter | H1 | H2 | H3 | H4 | H5 | H6 | H7 |
|---|---|---|---|---|---|---|---|---|
| 1DMAX | Dist. | Lognormal (LNO) | Gamma (GA) | LNO | GA | GA | Weibull (WEI) | GA |
| θ1 | c | c | c | c | c | c | t | |
| θ2 | cs(t) | c | c | cs(t) | cs(t) | c | cs(t) | |
| E(Y) | nt | c | c | c | c | c | T↓ | |
| VAR(Y) | nt | c | c | nt | nt↑ | c | nt↓ | |
| Catgry. | XVI | VI | VI | VIII | V | VI | XI | |
| 2DMAX | Dist. | LNO | GA | LNO | GA | GA | WEI | LNO |
| θ1 | c | c | c | c | c | cs(t) | t | |
| θ2 | cs(t) | cs(t) | c | cs(t) | cs(t) | c | cs(t) | |
| E(Y) | nt | c | c | c | c | nt | nt↓ | |
| VAR(Y) | nt | nt | c | nt | nt↑ | nt | nt↓ | |
| Catgry. | XVI | VIII | VI | VIII | V | XVI | XI | |
| 1DMIN | Dist. | LO | WEI | WEI | WEI | GA | WEI | GA |
| θ1 | cs(t) | cs(t) | cs(t) | cs(t) | cs(t) | cs(t) | cs(t) | |
| θ2 | c | t | cs(t) | c | cs(t) | c | cs(t) | |
| E(Y) | nt↑ | nt↑ | nt | nt | nt | nt | nt↑ | |
| VAR(Y) | c | nt↑ | nt↑ | nt | nt | nt | nt | |
| Catgry. | II | I | XIII | XVI | XVI | XVI | IV | |
| 7DMIN | Dist. | LO | GA | WEI | GA | GA | LNO | GA |
| θ1 | cs(t) | cs(t) | cs(t) | cs(t) | cs(t) | cs(t) | cs(t) | |
| θ2 | c | cs(t) | cs(t) | c | cs(t) | cs(t) | c | |
| E(Y) | nt↑ | nt↑ | nt | nt | nt | nt | nt↑ | |
| VAR(Y) | c | nt↑ | nt | nt | nt | nt | nt↑ | |
| Catgry. | II | I | XVI | XVI | XVI | XVI | I | |
| 30DMIN | Dist. | LO | GA | WEI | GA | LNO | GA | GA |
| θ1 | cs(t) | cs(t) | cs(t) | cs(t) | cs(t) | cs(t) | c | |
| θ2 | c | cs(t) | c | t | t | cs(t) | cs(t) | |
| E(Y) | nt↑ | nt↑ | nt↓ | nt | nt↓ | nt | c | |
| VAR(Y) | c | nt↑ | nt↓ | nt | nt↓ | nt | nt↓ | |
| Catgry. | II | I | XI | XVI | XI | XVI | VII |
| Variation in mean | Variation in Variance | ||||
| Increasing | No-Change | Decreasing | Complex Variation | ||
| Increasing | I (4) | II (3) | III (0) | IV (1) | |
| No-change | V (2) | VI (4) | VII (1) | VIII (2) | |
| Decreasing | IX (0) | X (0) | XI (4) | XII (0) | |
| Complex variation | XIII (2) | XIV (0) | XV (0) | XVI (12) | |
| Index | Parameter | H2 | H5 | H7 |
|---|---|---|---|---|
| 1DMAX | Dist. | GA | WEI | GA |
| θ1 | c | c | ri | |
| θ2 | c | ri | c | |
| 2DMAX | Dist. | GA | WEI | LNO |
| θ1 | c | c | ri | |
| θ2 | c | ri | ri | |
| 1DMIN | Dist. | GA | LNO | GA |
| θ1 | ri | ri | c | |
| θ2 | ri | ri | c | |
| 7DMIN | Dist. | LNO | GA | LNO |
| θ1 | c | c | c | |
| θ2 | c | ri | c | |
| 30DMIN | Dist. | LNO | LNO | GA |
| θ1 | c | c | c | |
| θ2 | c | ri | c |
| Index | Station | Time-Covariate | RI-Covariate |
|---|---|---|---|
| 1DMAX | H2 | 744.60 | 744.60 |
| H5 | 478.72 | 477.75 | |
| H7 | 617.12 | 624.26 | |
| 2DMAX | H2 | 709.21 | 710.39 |
| H5 | 456.06 | 455.39 | |
| H7 | 594.85 | 600.60 | |
| 1DMIN | H2 | 198.29 | 237.73 |
| H5 | 95.84 | 111.85 | |
| H7 | 17.35 | 39.02 | |
| 7DMIN | H2 | 198.44 | 235.51 |
| H5 | 120.31 | 135.32 | |
| H7 | 32.42 | 48.53 | |
| 30DMIN | H2 | 225.70 | 249.64 |
| H5 | 176.10 | 184.60 | |
| H7 | 123.95 | 125.58 |
Publisher’s Note: MDPI stays neutral with regard to jurisdictional claims in published maps and institutional affiliations. |
© 2021 by the authors. Licensee MDPI, Basel, Switzerland. This article is an open access article distributed under the terms and conditions of the Creative Commons Attribution (CC BY) license (http://creativecommons.org/licenses/by/4.0/).
Share and Cite
Shiau, J.-T.; Liu, Y.-T. Nonstationary Analyses of the Maximum and Minimum Streamflow in Tamsui River Basin, Taiwan. Water 2021, 13, 762. https://doi.org/10.3390/w13060762
Shiau J-T, Liu Y-T. Nonstationary Analyses of the Maximum and Minimum Streamflow in Tamsui River Basin, Taiwan. Water. 2021; 13(6):762. https://doi.org/10.3390/w13060762
Chicago/Turabian StyleShiau, Jenq-Tzong, and Yi-Ting Liu. 2021. "Nonstationary Analyses of the Maximum and Minimum Streamflow in Tamsui River Basin, Taiwan" Water 13, no. 6: 762. https://doi.org/10.3390/w13060762