
Temporal/Spatial Variation of Terrestrial Water Storage and Groundwater Storage in Typical Inland River Basins of Central Asia

Abstract
:1. Introduction
2. Materials and Methods
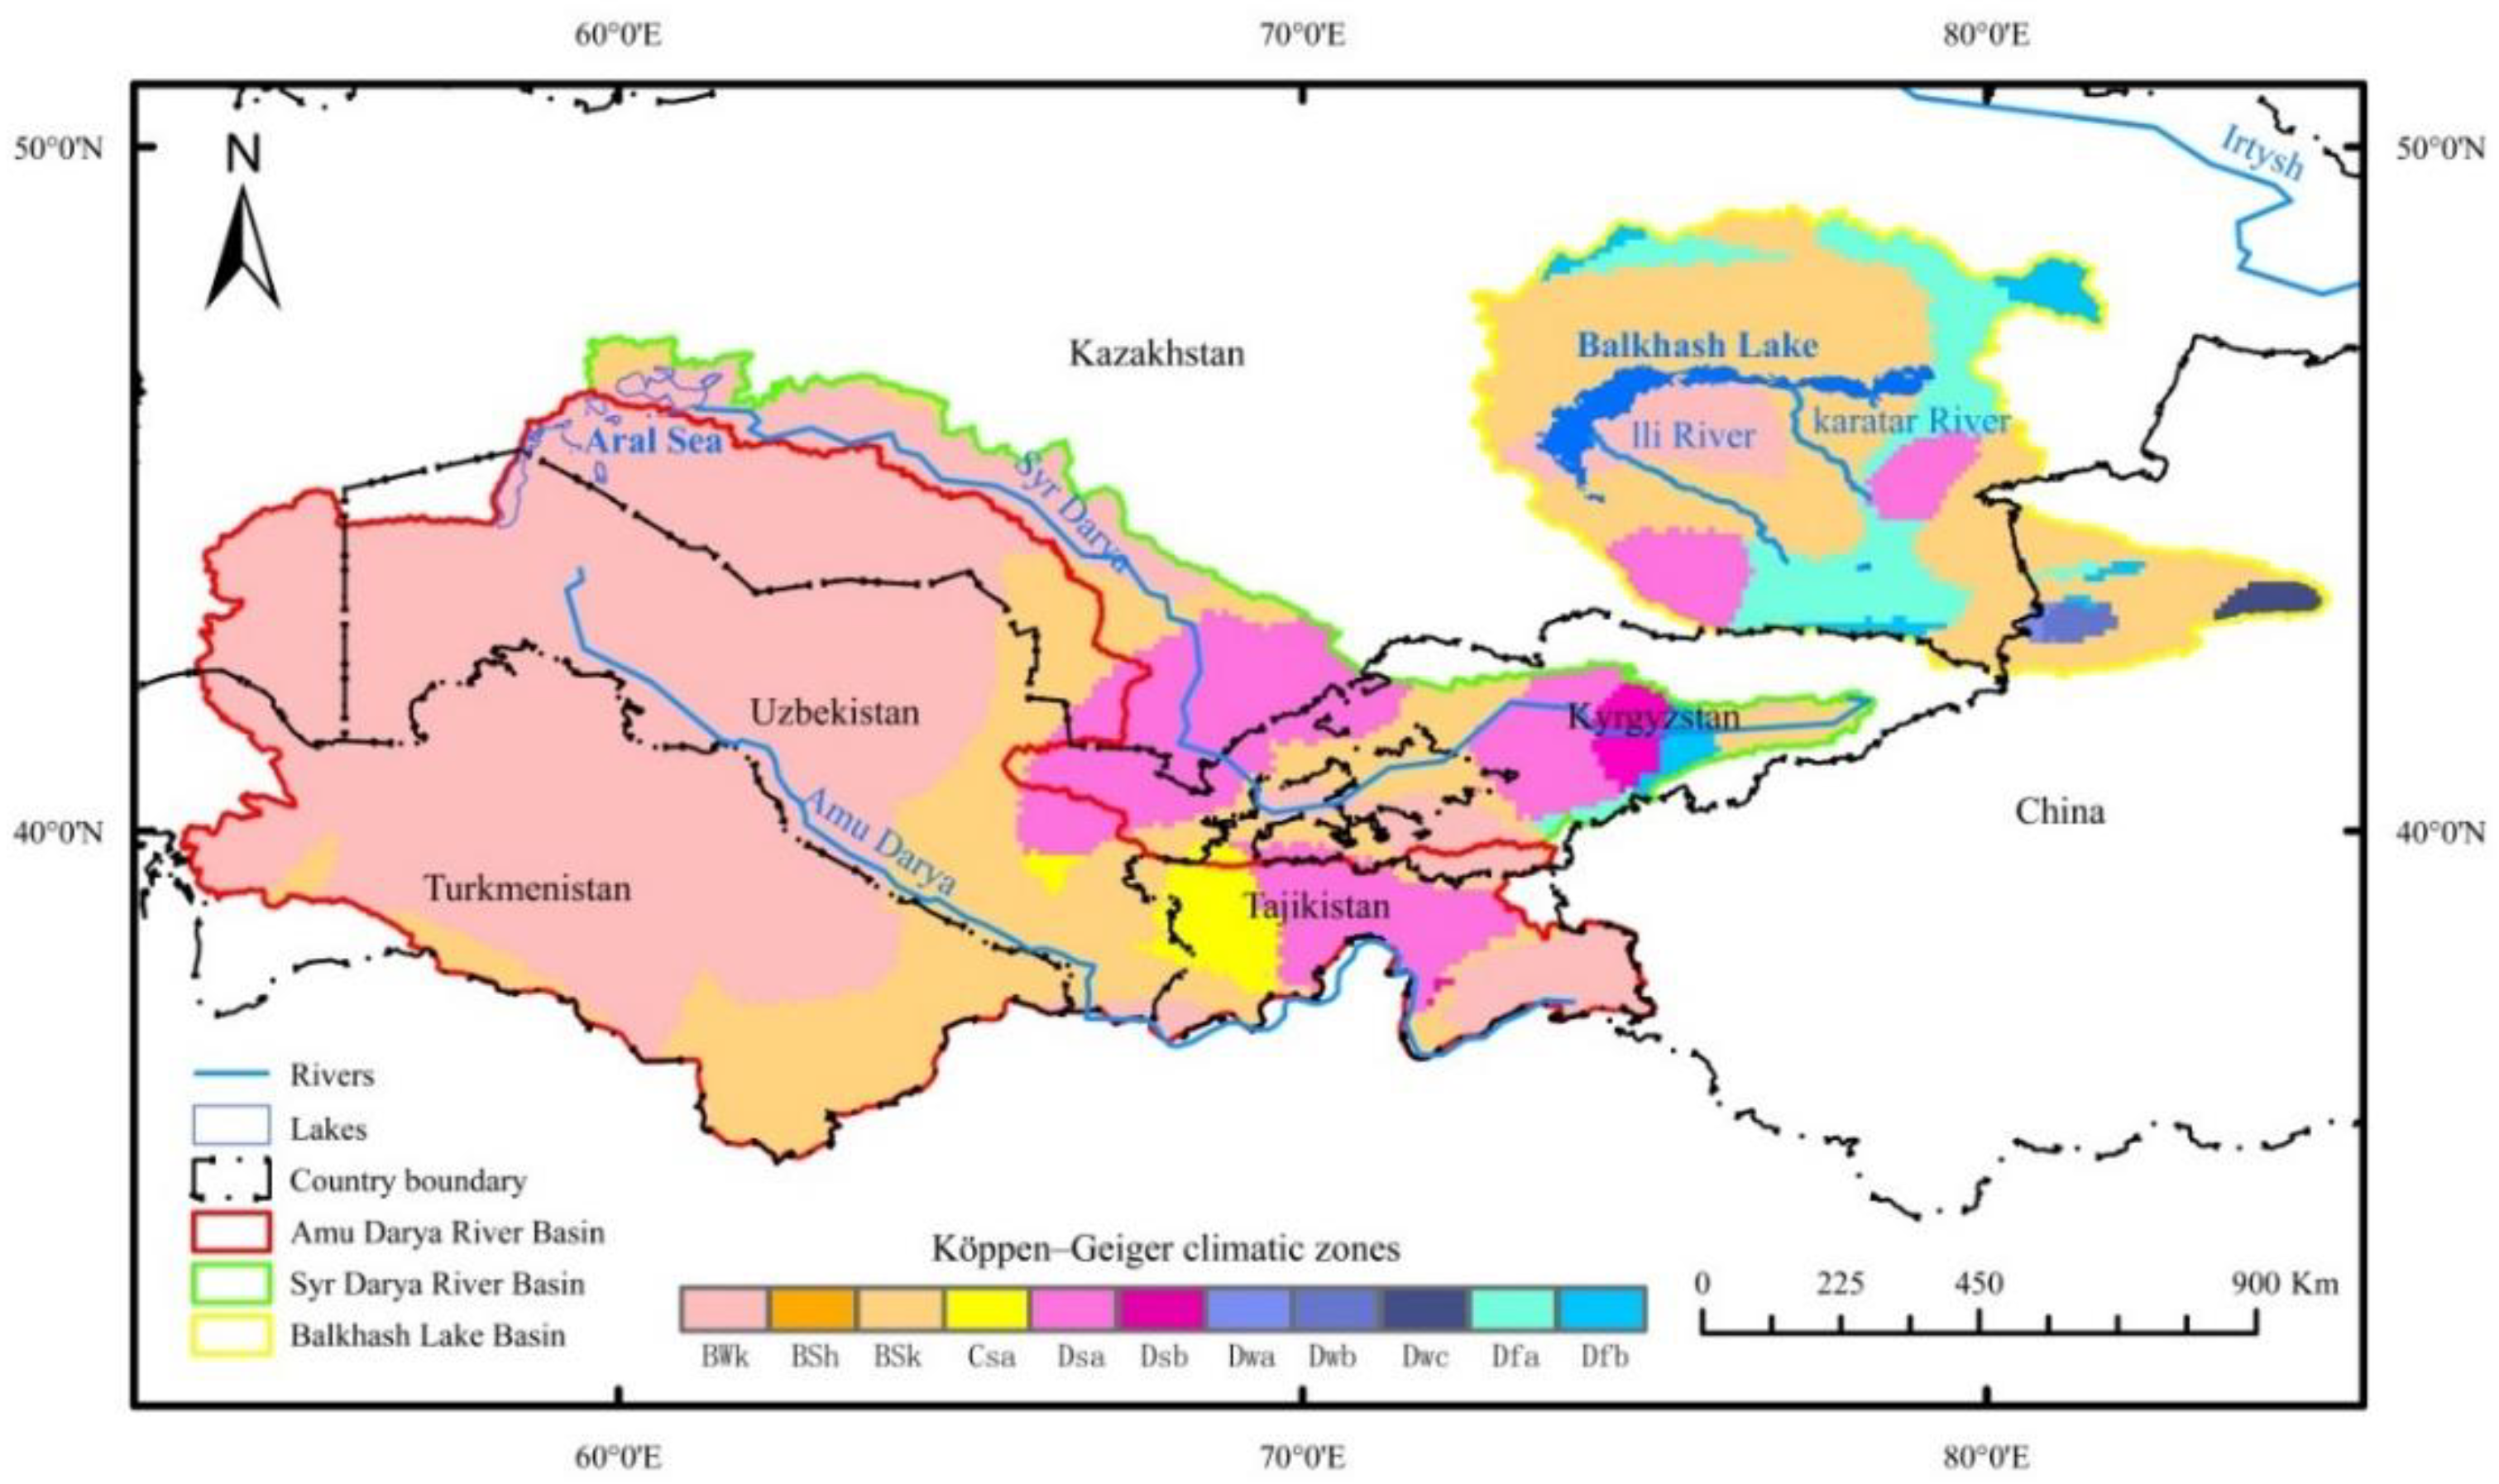
2.1. Study Area
2.2. Dataset
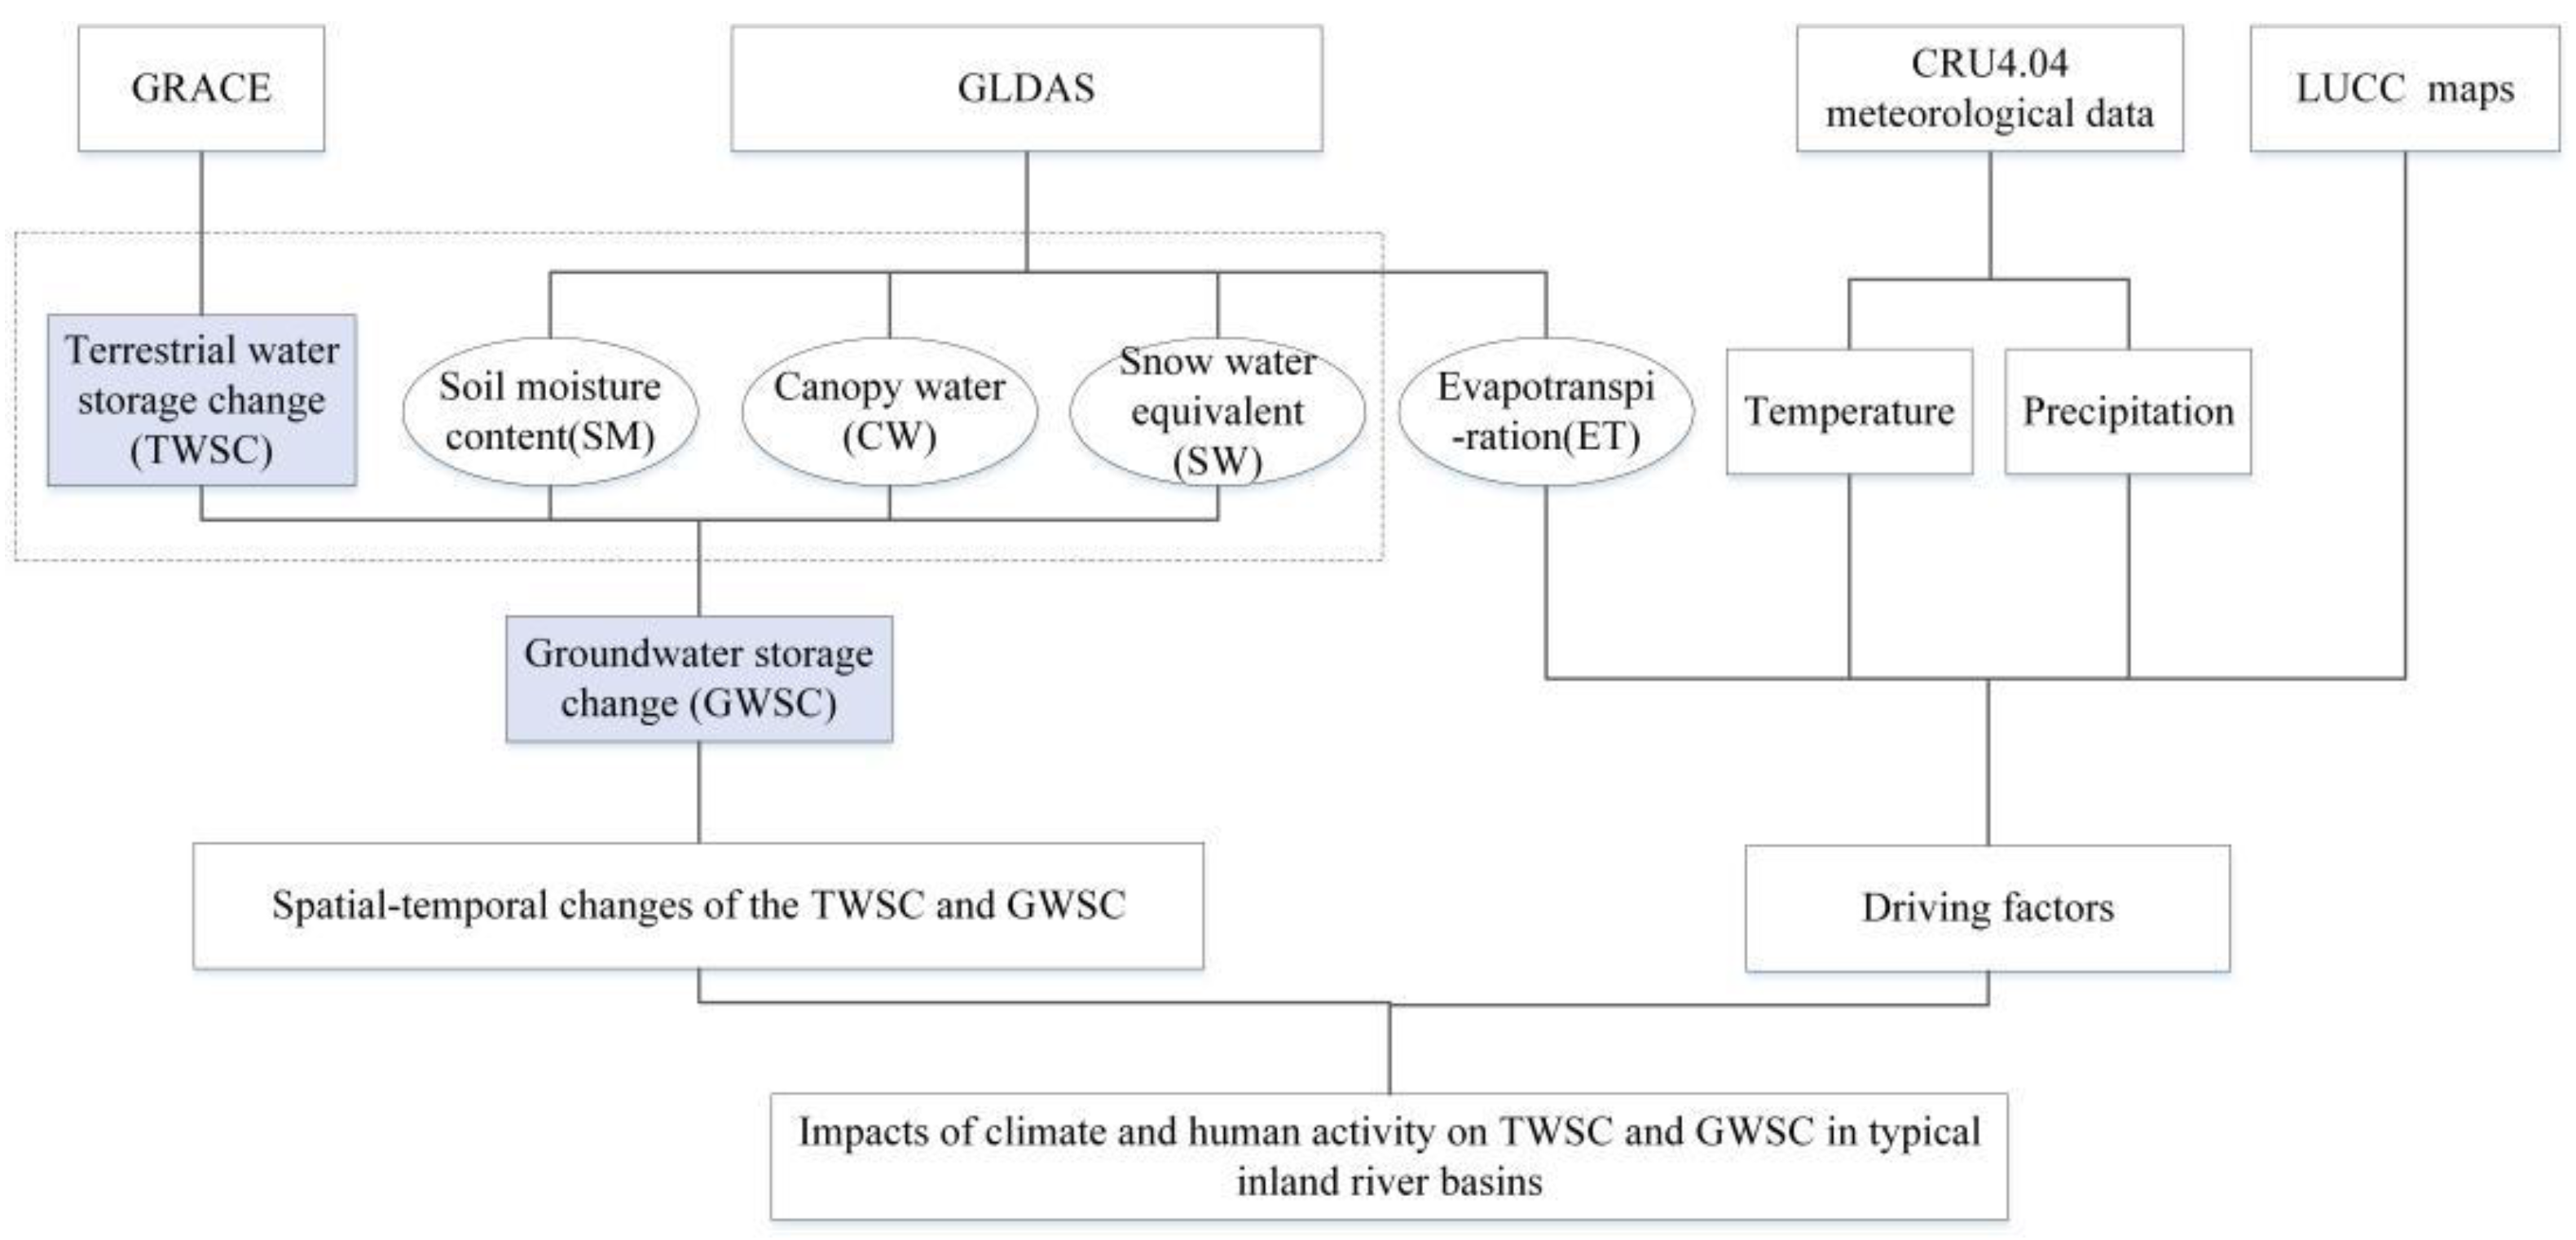
2.3. Methods
2.3.1. Inversion of TWSC by the GRACE Time-Varying Gravity Field
2.3.2. Estimation of the GWSC
2.3.3. Raster-Based Spatial Trend Analysis
2.3.4. Spatial Correlation Analysis
2.3.5. Mann–Kendall Trend Test
3. Results
3.1. Spatiotemporal Variation of the TWSC
3.1.1. Comparison of TWSC Derived from GRACE and GLDAS–Noah
3.1.2. Time Variation of the TWSC
3.1.3. Spatial Variations in Terrestrial Water Storage
3.2. Analysis of Dynamic Change in Groundwater Storage
3.2.1. Time Variation in Groundwater Storage
3.2.2. Spatial Variations in Groundwater Storage
3.3. Impact of Changing Environment Factors on the TWSC and the GWSC in Three Typical River Basins
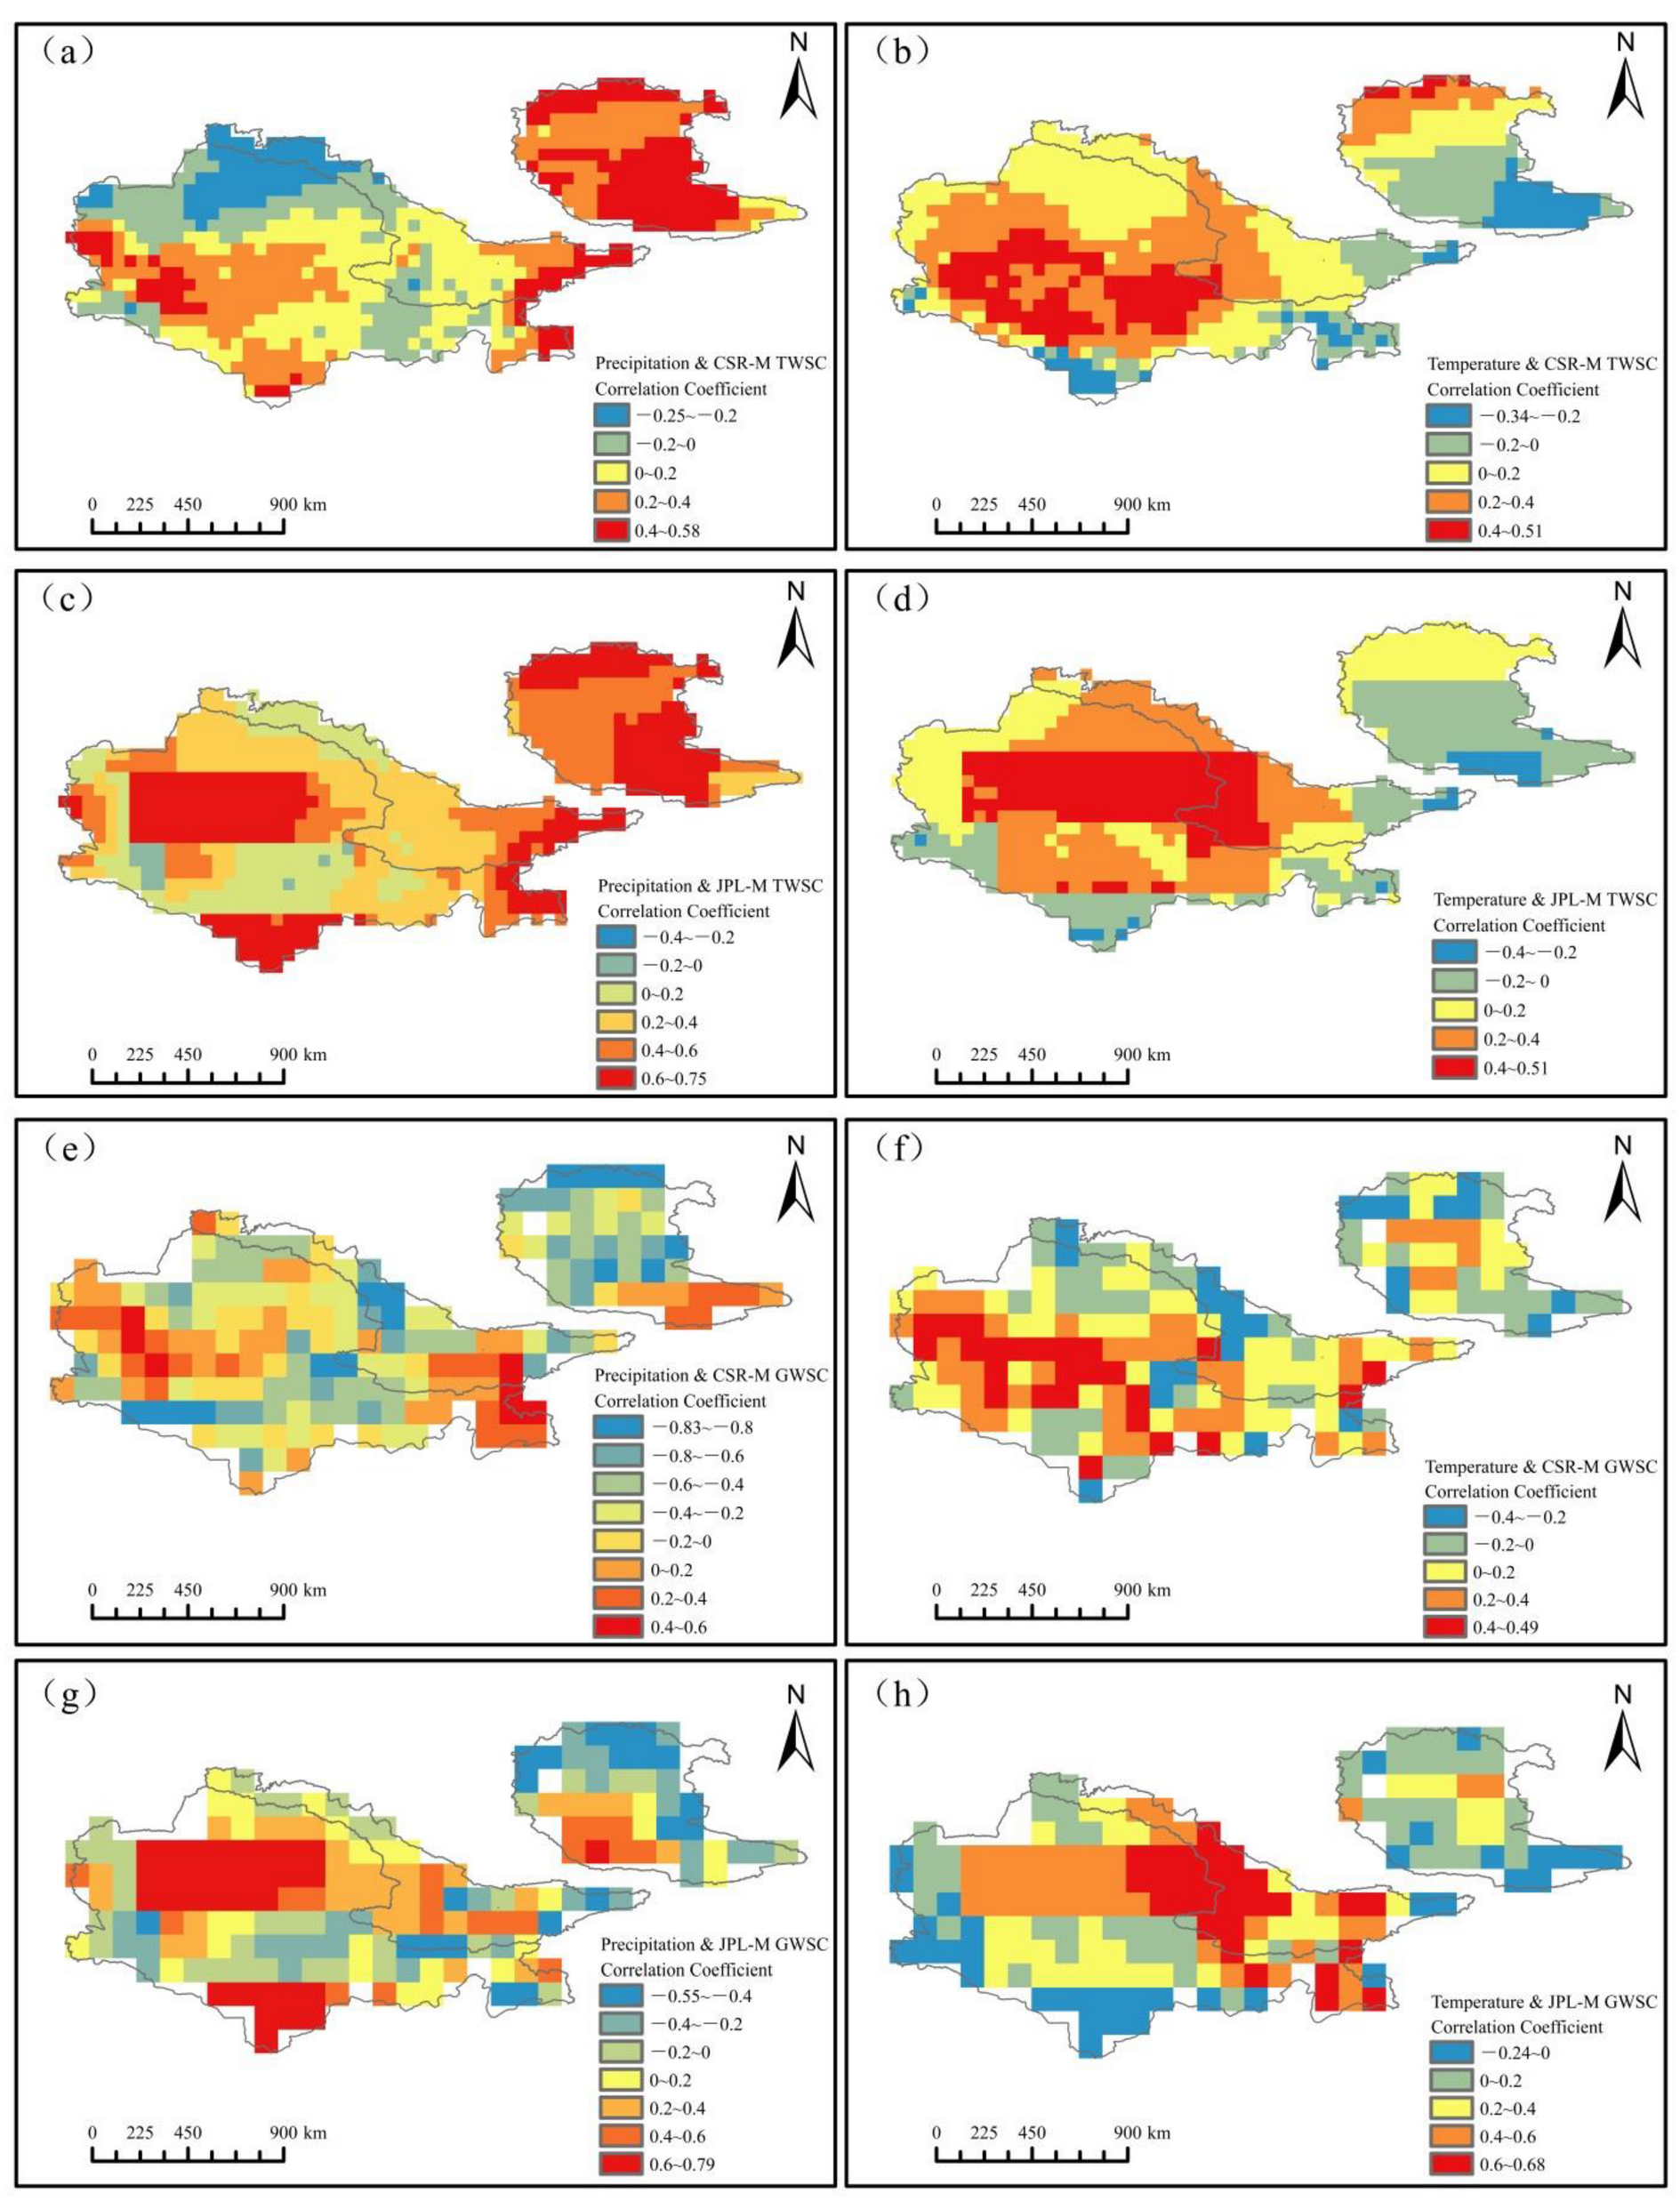
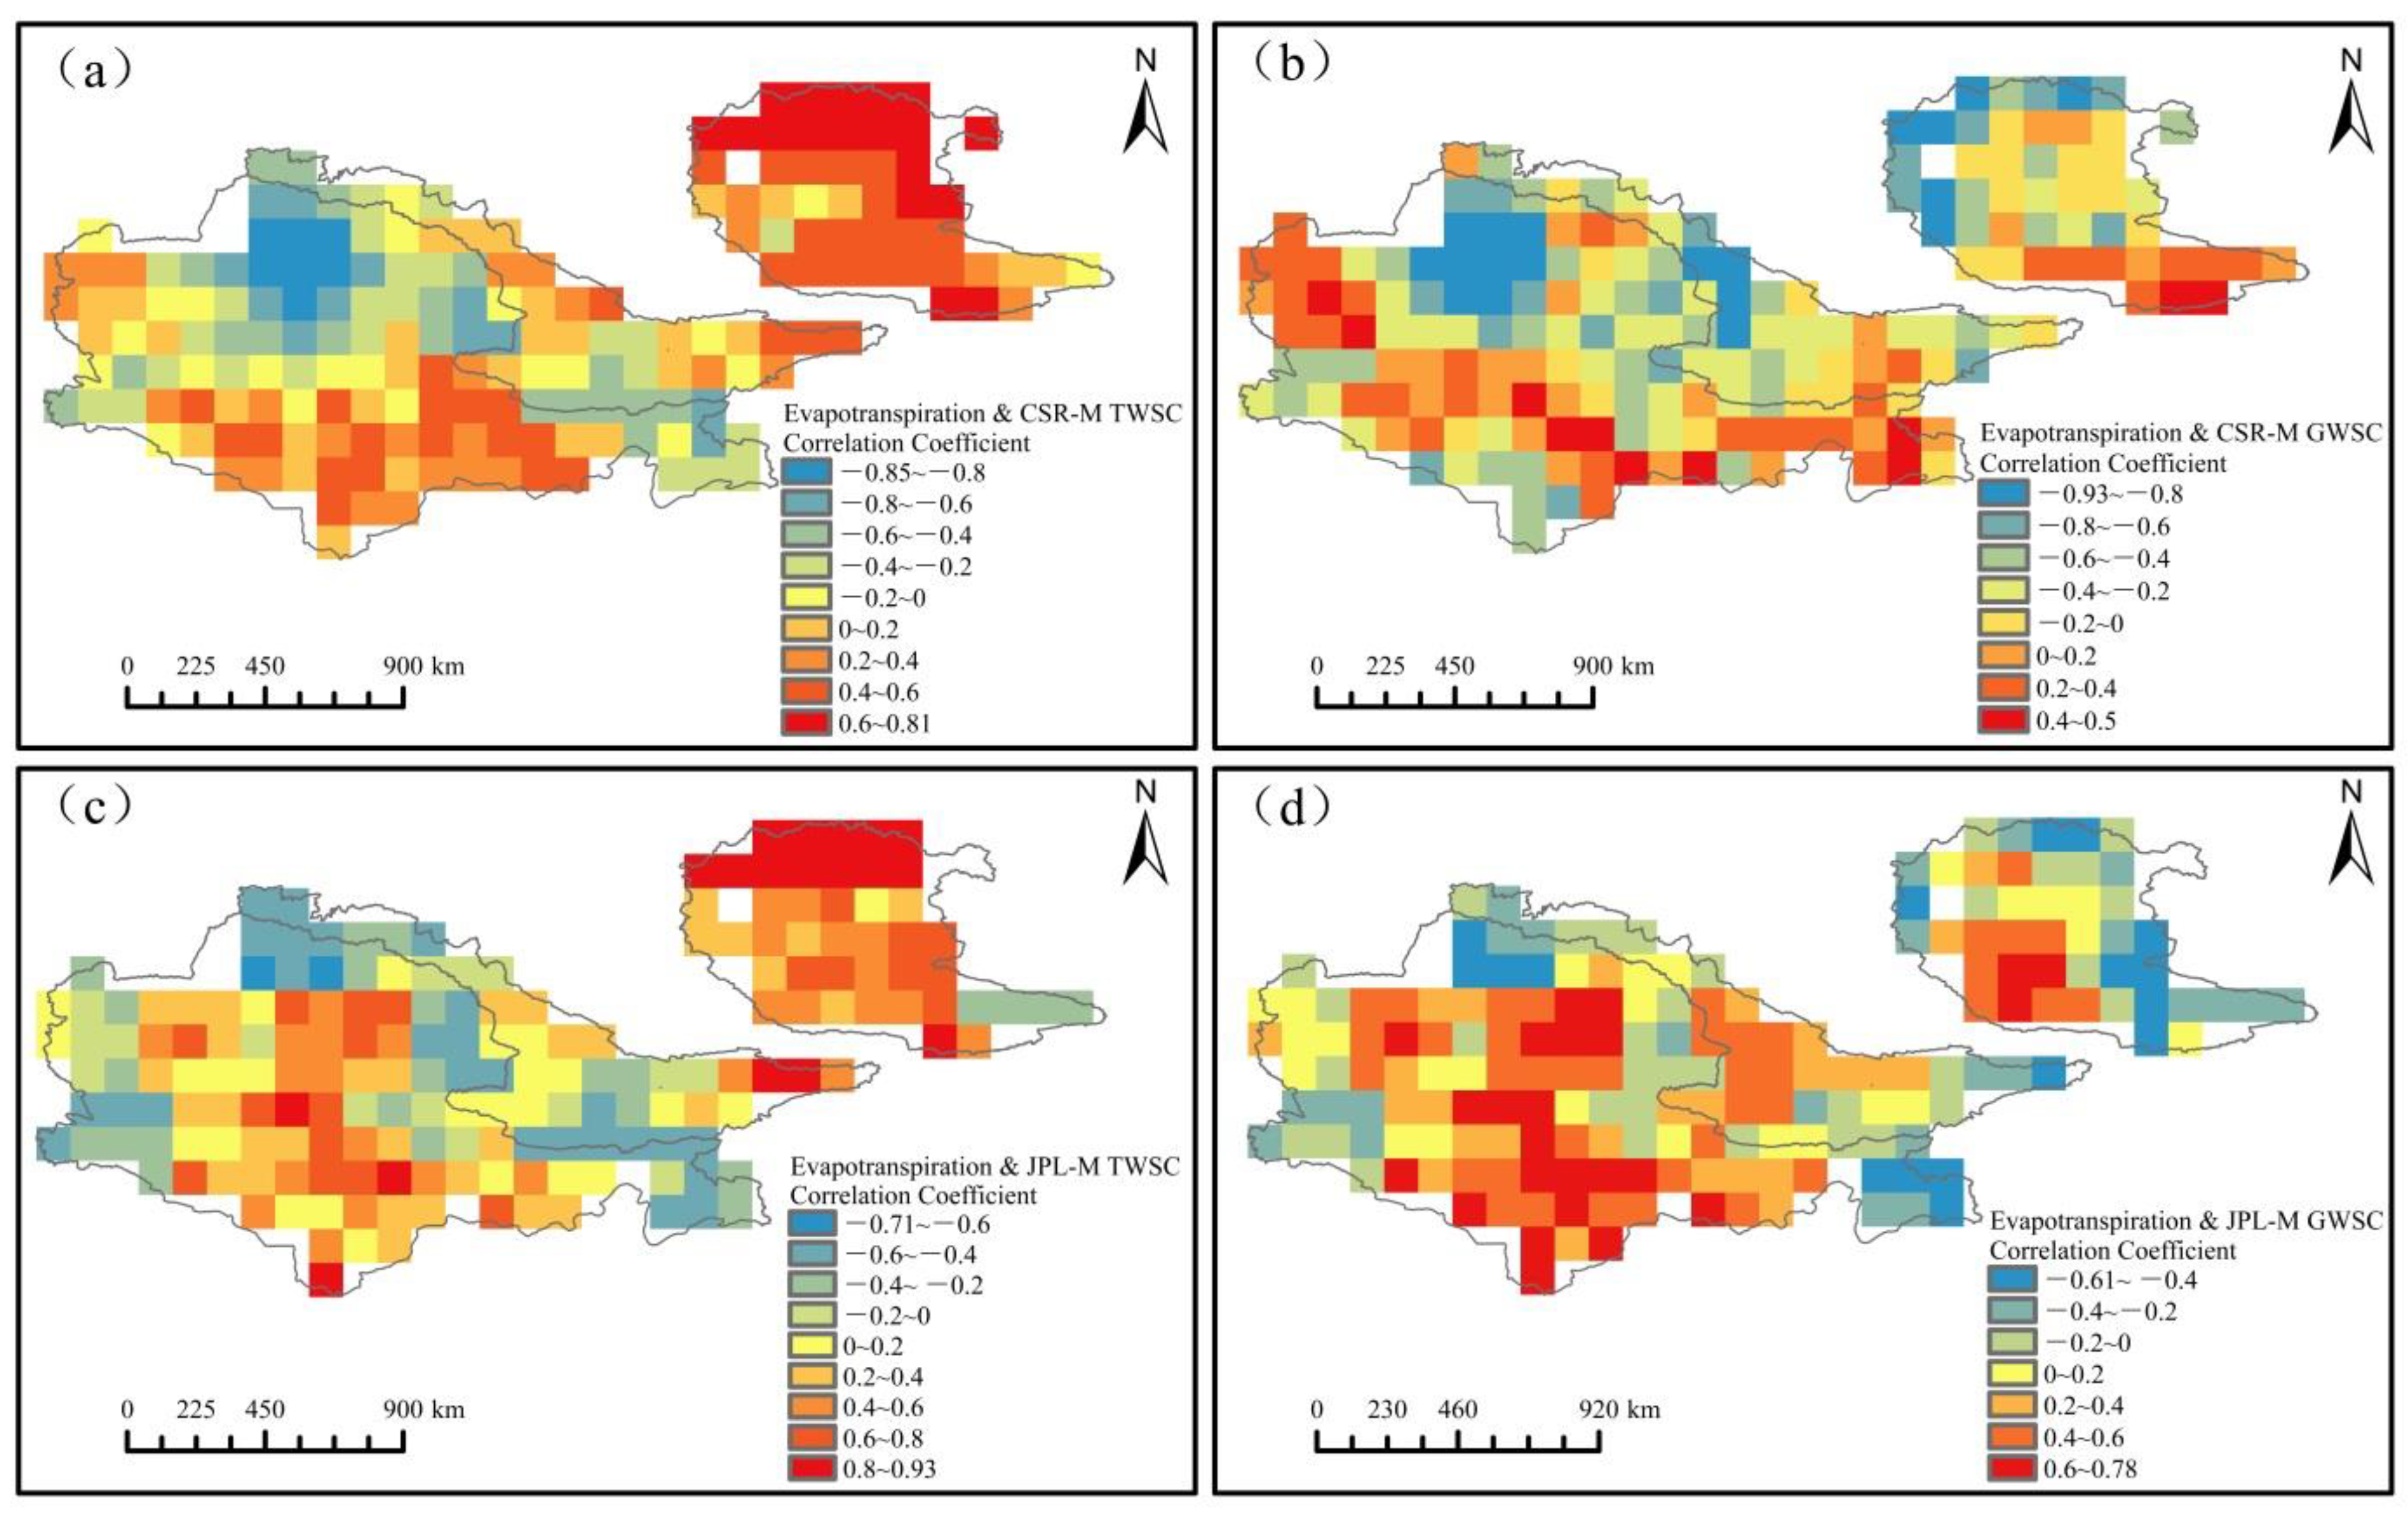
3.3.1. Sensitivity of the TWSC and GWSC in Typical River (Lake) Basins to Climatic Factors
3.3.2. Impact of Land Use Change on Water Storage in the Basin
4. Discussion
5. Conclusions
- (1)
- From the perspective of interannual variation, the terrestrial water storage inverted by CSR and JPL decreased at the rates of −4.66 mm/year and −2.88 mm/year, respectively, in the Amu Darya river basin; at the rates of −6.10 mm/year and −5.13 mm/year, respectively, in the Syr Darya river basin; and at the rates of −5.23 mm/year and −0.60 mm/year, respectively, in the Balkhash lake basin. The annual change in terrestrial water storage in the three basins met the characteristics of maximum surplus in spring (March to May) and maximum deficit in autumn (September to November). From the spatial perspective, the maximum surplus of CSR-M and JPL-M inversion was concentrated in the north and northwest of the Balkhash lake basin, with a surplus of 2.53~12.42 mm and 13.03~25.99 mm, respectively. The largest loss was −144.83~−35.86 mm in the eastern part of the Balkhash lake basin and −61.83~−55.44 mm in the northwestern part of the Amu Darya river basin, respectively.
- (2)
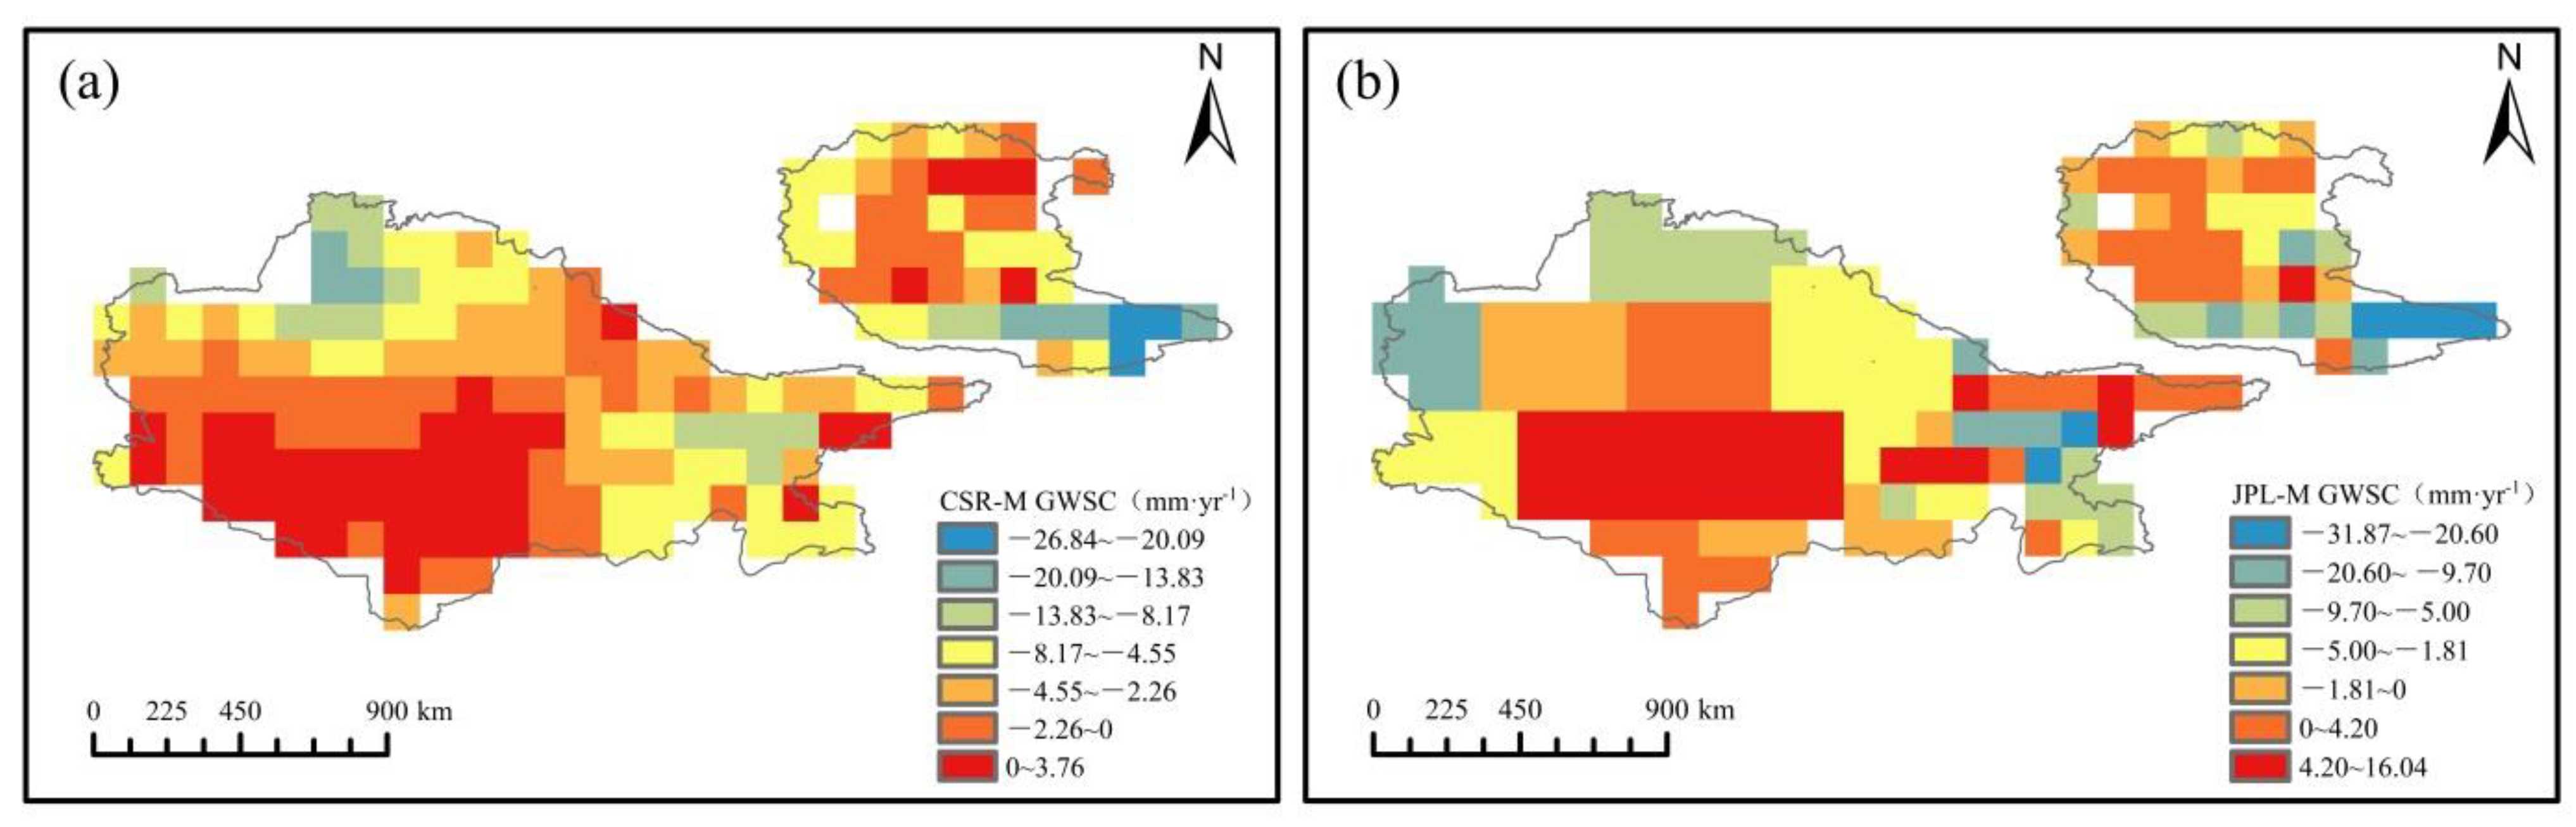
- The estimated decreasing rates of JPL-M and CSR-M groundwater storage in the Amu Darya river basin were −2.17 mm/year and −3.90 mm/year, respectively. The decreasing rates of groundwater storage in the Syr Darya river basin were −3.72 mm/year and −4.96 mm/year, respectively. The groundwater storage of the two groups in the Balkhash lake basin showed a large difference in the decreasing range, with decreasing rates of −1.74 mm/year and −3.36 mm/year, respectively. In terms of spatial variation, the surplus areas of groundwater storage were concentrated in the central and southern part of the Amu Darya river basin and scattered areas in the northwest of the Balkhash lake basin. The groundwater storage in the Syr Darya river basin showed a decreasing trend at different rates; the decreasing range was least at the boundary of the middle and lower reaches. The difference between CSR-M and JPL-M was mainly concentrated in the Balkhash lake basin, and the area with an increasing trend in the northwest of the Balkhash lake basin, as estimated by JPL-M, was bigger than that estimated by CSR-M. In the upper reaches of the Syr Darya river basin, the groundwater storage identified by JPL-M showed an increasing trend, while the groundwater storage identified by CSR-M showed a decreasing trend.
- (3)
- Compared with temperature and precipitation, evapotranspiration has a stronger correlation with the TWSC. In the case of the Amu Darya river basin, the water storage decrease mainly resulted from a decrease in precipitation and an increase in evapotranspiration, caused by rising temperatures. The reasons for the increase in water storage in the middle reaches may be that for a bigger cultivated land area, flood irrigation and reservoir storage increase the water income, which leads to an increase in regional water storage. In the results of JPL-M, the rising temperature in the upper reaches of the Syr Darya river basin led to the recharge of groundwater coming from the melting snow of mountain glaciers, which led to an increase in water storage. The frequent human activities and the increase in cultivated land area in the middle reaches of the Syr Darya river basin resulted in an increase in water resource consumption, which is the main reason for the decrease in terrestrial water and groundwater storage in the middle reaches of the Syr Darya river basin. The increase in evapotranspiration in the lower reaches of the Syr Darya river basin may be the cause of the decrease in terrestrial water and groundwater storage. The increase in precipitation, decrease in temperature and increase in farmland irrigation water in the northwest of the Balkhash lake basin led to the increase in land water storage in the northwest of the Balkhash lake basin, and the higher and lower terrain in the southeast and northwest of the Balkhash lake basin led to the surplus of groundwater storage in the northwest of the Balkhash lake basin. As for the whole Balkhash lake basin area, with an increase in precipitation and a decrease in temperature, the overall land water and groundwater reserves still showed a decreasing trend, which can be explained by the increase in evapotranspiration in the whole basin.
Author Contributions
Funding
Institutional Review Board Statement
Informed Consent Statement
Data Availability Statement
Conflicts of Interest
References
- Chen, Y.N.; Li, Z.; Fang, G.H.; Deng, H.J. Impact of climate change on water resources in the Tianshan Mountians, Central Asia. Acta Geogr. Sin. 2017, 72, 18–26. [Google Scholar]
- Immerzeel, W.W.; Van Beek, L.P.H.; Bierkens, M.F.P. Climate change will affect the Asian Water Towers. Science 2010, 328, 1382–1385. [Google Scholar] [CrossRef]
- Yang, X.P. Desertification and land use in the Arid areas of Central Asia. Quat. Sci. 1998, 2, 119–127. [Google Scholar]
- Bai, J.; Shi, H.; Yu, Q.; Xie, Z.Y.; Li, L.H.; Luo, G.P.; Jin, N.; Li, J. Satellite-observed vegetation stability in response to changes in climate and total water storage in Central Asia. Sci. Total. Environ. 2019, 659, 862–871. [Google Scholar] [CrossRef] [PubMed]
- Yang, S.T.; Yu, X.Y.; Ding, J.L.; Zhang, F.; Wang, F.; Ma, Y.G. A review of water issues research in Central Asia. Acta Geogr. Sin. 2017, 72, 79–93. [Google Scholar]
- Han, Z.M.; Huang, S.Z.; Huang, Q.; Leng, G.Y.; Wang, H.; He, L.; Fang, W.; Li, P. Assessing GRACE-based terrestrial water storage anomalies dynamics at multi-timescales and their correlations with teleconnection factors in Yunnan Province, China. J. Hydrol. 2019, 574, 836–850. [Google Scholar] [CrossRef]
- Guo, H.; Bao, A.M.; Ndayisaba, F.; Liu, T.; Jiapaer, G.; Tantawi, M.E.; Maeyer, P.D. Space-time characterization of drought events and their impacts on vegetation in Central Asia. J. Hydrol. 2018, 564, 1165–1178. [Google Scholar] [CrossRef]
- Yao, J.Q.; Hu, W.F.; Chen, Y.N.; Huo, W.; Zhao, Y.; Mao, W.Y.; Yang, Q. Hydro-climatic changes and their impacts on vegetation in Xinjiang, Central Asia. Sci. Total. Environ. 2019, 660, 724–732. [Google Scholar] [CrossRef] [PubMed]
- Seyoum, W.M. Characterizing water storage trends and regional climate influence using GRACE observation and satellite altimetry data in the Upper Blue Nile River Basin. J. Hydrol. 2018, 566, 274–284. [Google Scholar] [CrossRef]
- Ramillien, G.; Frappart, F.; Cazenave, A.; Güntner, A. Time variations of land water storage from an inversion of 2 years of GRACE geoids. Earth Planet Sci. Lett. 2005, 235, 283–301. [Google Scholar] [CrossRef] [Green Version]
- Yang, P.; Chen, Y.N. An analysis of terrestrial water storage variations from GRACE and GLDAS: The Tianshan Mountains and its adjacent areas, Central Asia. Quatern Int. 2015, 358, 106–112. [Google Scholar] [CrossRef]
- Zhang, P.F. Temporal and Spatial Variation of Water Resource in Central Asian Inland. Doctoral Dissertation, University of Chinese Academy of Sciences, Beijing, China, 2017. [Google Scholar]
- Hu, W.J.; Liu, H.L.; Bao, A.M.; EI-Tantawi, A.M. Influences of environmental changes on water storage variations in Central Asia. J. Geogr. Sci. 2018, 28, 985–1000. [Google Scholar] [CrossRef] [Green Version]
- Deng, H.J.; Chen, Y.N. Influences of recent climate change and human activities on water storage variations in Central Asia. J. Hydrol. 2017, 544, 46–57. [Google Scholar] [CrossRef]
- Hu, Z.Y.; Zhang, Z.Z.; Sang, Y.F.; Qian, J.; Feng, W.; Chen, X.; Zhou, Q.M. Temporal and spatial variations in the terrestrial water storage across Central Asia based on multiple satellite datasets and global hydrological models. J. Hydrol. 2021, 596, 126013. [Google Scholar] [CrossRef]
- Yang, P.; Zhang, Y.Y.; Xia, J.; Sun, S.X. Identification of drought events in the major basins of Central Asia based on a combined climatological deviation index from GRACE measurements. Atmos. Res. 2020, 244, 105105. [Google Scholar] [CrossRef]
- Zmijewski, K.; Becker, R. Estimating the Effects of Anthropogenic Modification on Water Balance in the Aral Sea Watershed Using GRACE: 2003–12. Earth Interact. 2014, 18, 1–16. [Google Scholar] [CrossRef]
- Chen, T.; Bao, A.M.; Guo, H.; Zheng, G.X.; Yuan, Y.; Yu, T. Ecological vulnerability assessment for a transboundary basin in Central Asia and its spatiotemporal characteristics analysis: Taking Amu Darya River Basin as an example. J. Nat. Resour. 2019, 34, 2643–2657. [Google Scholar]
- Tian, X.R.; Wang, G.Y.; Fan, Y.F. Aral Sea Basin Transboundary Water Cooperation: History, Present Situation and Reflections. J. Bound. Ocean. Stud. 2017, 2, 90–104. [Google Scholar]
- White, C.J.; Tanton, T.W.; Rycroft, D.W. The impact of climate change on the water resources of the Amu Darya Basin in Central Asia. Water Resour. Manag. 2017, 28, 5267–5281. [Google Scholar] [CrossRef]
- Yao, J.Q.; Chen, Y.N. Trend analysis of temperature and precipitation in the Syr Darya Basin in Central Asia. Theor. Appl. Climatol. 2015, 120, 521–531. [Google Scholar] [CrossRef]
- Zhou, W.J.; Xia, Z.Q.; Huang, F.; Chen, Q.C.; Zhao, P. Variation Characteristics of precipitation and its annual distribution in Balkhash Lake Basin. Water Resour. Power 2013, 31, 10–13. [Google Scholar]
- Song, Y.G.; Shi, Z.T. Distribution and Compositions of Loess Sediments in Yili Basin, Central Asia. Sci. Geogr. Sin. 2010, 30, 267–272. [Google Scholar]
- Xuekelaiti, B.; Long, A.H.; Deng, M.J.; Li, X.Q.; Kadeer, M. Disquisition for water resources development and utilization in middle-lower reaches of Balkhash Basin on Google Earth. Arid. Land Geogr. 2012, 35, 388–398. [Google Scholar]
- Hao, J.S.; Zhang, F.Y.; Zhao, X.; Liu, Y.X. Spatiotemporal Chang of water storage and its influencing fators in the Ili-Balkhash Basin based on GRACE data. Remote Sens. Technol. Appl. 2017, 32, 883–892. [Google Scholar]
- Wahr, J.; Zhong, S. Computations of the viscoelastic response of a 3-D compressible Earth to surface loading: An application to glacial isostatic adjustment in Antarctica and Canada. Geophys. J. Int. 2012, 192, 557–572. [Google Scholar]
- Wang, L.S.; Chen, C.; Ma, X.; Fu, Z.Y.; Zheng, Y.H.; Peng, Z.R. Evaluation of GRACE mascon solutions using in-situ geodetic data: The case of hydrologic-induced crust displacement in the Yangtze River Basin. Sci. Total Environ. 2019, 707, 135606. [Google Scholar] [CrossRef] [PubMed]
- Watkins, M.M.; Wiese, D.N.; Yuan, D.N.; Boening, C.; Landerer, F.W. Improved methods for observing Earth’s time variable mass distribution with GRACE using spherical cap mascons. J. Geophys. Res. Soild Earth 2015, 120, 2648–2671. [Google Scholar] [CrossRef]
- Li, A.H.; Cui, S.Y.; Wang, H.R.; Yu, C. Water storage changes in the middle reaches of the Yellow River Basin based on GRACE time variable gravitation model. J. Nat. Resour. 2017, 32, 461–473. [Google Scholar]
- Seoane, L.; Ramillien, G.; Frappart, F.; Leblanc, M. Regional GRACE-based estimates of water mass variations over Australia: Validation and interpretation. Hydrol. Earth Syst. Sci. 2013, 17, 4925–4939. [Google Scholar] [CrossRef] [Green Version]
- Thomas, A.C.; Reager, J.T.; Famiglietti, J.S.; Rodell, M. A GRACE—Based water storage deficit approach for hydrological drought characterization. Geophys. Res. Lett. 2014, 41, 1537–1545. [Google Scholar] [CrossRef] [Green Version]
- Hamed, K.H. Trend detection in hydrologic data: The Mann—Kendall trend test under the scaling hypothesis. J. Hydrol. 2008, 349, 350–363. [Google Scholar] [CrossRef]
- Yu, Y.S.; Chen, X.W. Division of variation process of high and low runoff based on Mann—Kendall method. J. Water Resour. Water Eng. 2013, 24, 60–63. [Google Scholar]
- Cao, Y.P.; Nan, Z.T.; Cheng, G. GRACE Gravity Satellite Observations of Terrestrial Water Storage Changes for Drought Characterization in the Arid Land of Northwestern China. Remote Sens. 2015, 7, 1021–1047. [Google Scholar] [CrossRef] [Green Version]
- Ehsan Bhuiyan, M.A.; Nikolopoulos, E.I.; Anagnostou, E.N.; Polcher, J.; Albergel, C.; Dutra, E.; Fink, G.; Martínez-de la Torre, A.; Munier, S. Assessment of precipitation error propagation in multi-model global water resource reanalysis. Hydrol. Earth Syst. Sci. 2019, 23, 1973–1994. [Google Scholar] [CrossRef] [Green Version]
- Mei, Y.W.; Nikoloulos, E.; Anagnostous, E.; Borga, M. Evaluating satellite precipitation error propagation in runoff simulations of mountainous basins. J. Hydrometeorol. 2016, 17, 1407–1423. [Google Scholar] [CrossRef]
- Zhou, Y.; Zhang, L.; Xiao, J.F.; Williams, C.A.; Vitkovskaya, I.; Bao, A.M. Spatiotemporal transition of institutional and socioeconomic impacts on vegetation productivity in Central Asia over last three decades. Sci. Total Environ. 2019, 658, 922–935. [Google Scholar] [CrossRef]
- Mueller, L.; Suleimenov, M.; Karimov, A.; Qadir, M.; Saparov, A.; Balgabayev, N.; Helming, K.; Lischeid, G. Land and Water Resources of Central Asia, Their Utilization and Ecological Status; Springer International Publishing: New York, NY, USA, 2014. [Google Scholar] [CrossRef]
- Ibrayev, T.; Badjanov, B.; Li, M. Long-Term Monitoring and Water Resource Management in the Republic of Kazakhstan; Springer International Publishing: New York, NY, USA, 2014. [Google Scholar] [CrossRef]
- Ruan, H.W.; Yu, J.J. Changes in land cover and evapotranspiration in the five Central Asian countries from 1992 to 2015. Acta Geogr. Sin. 2019, 74, 1292–1304. (In Chinese) [Google Scholar]
- Liu, Z.B.; Huang, Y.; Liu, T.; Li, J.L.; Xing, W.; Akmalov, S.; Peng, J.B.; Pan, X.H.; Guo, C.Y.; Duan, Y.C. Water balance analysis based on quantitative evapotranspiration (ET) inversion in NUKUS irrigation area, Lower Amu River Basin. Remote Sens. 2020, 12, 2317. [Google Scholar] [CrossRef]
- Swenson, S.; Wahr, J. Post-processing removal of correlated errors in GRACE data. Geophys. Res. Lett. 2006, 33, L08402. [Google Scholar] [CrossRef]
- Bhanja, S.N.; Mukherjee, A.; Saha, D.; Velicogna, I.; Famiglietti, J.S. Validation of GRACE based groundwater storage anomaly using in-situ groundwater level measurements in India. J. Hydrol. 2016, 543, 729–738. [Google Scholar] [CrossRef]


| Metrics | GRACE | GLDAS–NOAH | ||
|---|---|---|---|---|
| Amu Darya River Basin | Syr Darya River Basin | Balkhash Lake Basin | ||
| CC | RL06M-CSR | 0.75 ** | 0.80 ** | 0.63 ** |
| RL06M-JPL | 0.82 ** | 0.77 ** | 0.79 ** | |
| MRE | RL06M-CSR | 1.07 | 0.57 | 0.14 |
| RL06M-JPL | 1.06 | 0.62 | 0.67 | |
| CRMSE | RL06M-CSR | 0.79 | 0.48 | 1.86 |
| RL06M-JPL | 0.70 | 0.49 | 0.44 | |
| KGE | RL06M-CSR | 0.45 | 0.69 | 0.59 |
| RL06M-JPL | 0.32 | 0.66 | 0.84 | |
| Cultivated Land | Forest | Grassland | Bare Land | Water Area | Urban Industrial and Residential Land | ||
|---|---|---|---|---|---|---|---|
| Amu Darya river basin | 2000 | 7.94 | 1.70 | 12.49 | 80.61 | 4.07 | 1.14 |
| 2015 | 9.13 | 1.74 | 11.52 | 81.64 | 2.45 | 1.40 | |
| Variation | 1.19 | 0.04 | −0.97 | 1.03 | −1.62 | 0.26 | |
| Syr Darya river basin | 2000 | 4.98 | 1.12 | 10.37 | 13.72 | 1.28 | 0.80 |
| 2015 | 5.43 | 1.28 | 9.82 | 13.46 | 1.345 | 1.00 | |
| Variation | 0.46 | 0.08 | −0.55 | −0.26 | 0.07 | 0.20 | |
| Balkhash lake basin | 2000 | 1.97 | 1.02 | 12.48 | 18.31 | 2.00 | 0.15 |
| 2015 | 2.27 | 1.05 | 12.29 | 18.15 | 2.0 | 0.20 | |
| Variation | 0.30 | 0.03 | −0.20 | −0.17 | −0.01 | 0.05 |
Publisher’s Note: MDPI stays neutral with regard to jurisdictional claims in published maps and institutional affiliations. |
© 2021 by the authors. Licensee MDPI, Basel, Switzerland. This article is an open access article distributed under the terms and conditions of the Creative Commons Attribution (CC BY) license (https://creativecommons.org/licenses/by/4.0/).
Share and Cite
Lyu, Y.; Huang, Y.; Bao, A.; Zhong, R.; Yang, H. Temporal/Spatial Variation of Terrestrial Water Storage and Groundwater Storage in Typical Inland River Basins of Central Asia. Water 2021, 13, 3385. https://doi.org/10.3390/w13233385
Lyu Y, Huang Y, Bao A, Zhong R, Yang H. Temporal/Spatial Variation of Terrestrial Water Storage and Groundwater Storage in Typical Inland River Basins of Central Asia. Water. 2021; 13(23):3385. https://doi.org/10.3390/w13233385
Chicago/Turabian StyleLyu, Ye, Yue Huang, Anming Bao, Ruisen Zhong, and Han Yang. 2021. "Temporal/Spatial Variation of Terrestrial Water Storage and Groundwater Storage in Typical Inland River Basins of Central Asia" Water 13, no. 23: 3385. https://doi.org/10.3390/w13233385