Article

Decoupling the Monitoring of Solar Water Heaters and their Usage Profiles

Fort Hare Institute of Technology, University of Fort Hare, Alice 5700, South Africa
*
Author to whom correspondence should be addressed.
Water 2021, 13(22), 3186; https://doi.org/10.3390/w13223186
Submission received: 23 September 2021 / Revised: 17 October 2021 / Accepted: 19 October 2021 / Published: 11 November 2021
(This article belongs to the Section Water-Energy Nexus)

Abstract

:
South Africa is the most technologically advanced nation in Africa. However, the country is plagued with constant load shedding. The country receives about 2500 sunshine hours annually, with daily average irradiation levels of 4.5–6.5 kWh/m2. Despite these potentials, the use of electricity for domestic water heating is still prevalent in the country. The mass rollout of solar water heating (SWH) technologies in the low-cost housing sector across the country were met with massive failures. This study aims to assess the energy yield of a passive flat plate and an evacuated tube solar water heating system by evaluating the performance of these systems to address the energy crisis in South Africa. The flat plate (FP) and evacuated tube (ET) solar water heating systems were monitored for four days, characterised by varying sky conditions through instantaneous data measurement at 5 s. The parameters measured were water temperature, ambient temperature, irradiance at the plane of array, relative humidity, wind speed and direction. The results obtained show that a maximum irradiance of 1050 W/m2 was obtained on a clear day and corresponded to a hot water temperature of about 58 °C and 65 °C for the FP and ET, respectively. However, a cloudy day with a maximum irradiance of 400 W/m2 produced about 22 °C and 29 °C of hot water for the FP and ET, respectively. The results obtained in this study will guide stakeholders in the renewable energy sector towards employing SWH systems to replace or augment the electric geyser. Solar water heaters (SWH) can be used in the low-cost housing sector to provide hot water. Hence, the assessments in this study offer essential information for the deployment of these systems to reduce demand on the ailing South African electricity utility, Eskom, and mitigate climate change.

1. Introduction

The International Energy Agency (IEA), from a global point of view, described solar heating and cooling technologies as “the sleeping giant of renewable energy potential” [1]. The IEA’s roadmap projects that by 2050, the installed solar water heaters’ (SWH) capacity could reach about 3200 GWth with 7.2 EJ produced annually [2]. Solar energy is utilised to generate electricity, hot water and space heating. A brief policy report for South Africa on solar water heating technologies affirms three ways of converting harvested solar energy: electricity, hot water and space heating [3]. Furthermore, the report shows that solar water heaters and solar air collectors convert incident irradiance hot water and space heating, respectively, while photovoltaic modules convert solar irradiance to electricity.
The development of a technology for hot water generation ensures the sun’s irradiance is adequately utilised [4]. Hirbodi et al. [5] simulated and analysed the techno-economic performance of two solar heating technologies. In their work, two concentrating solar power collectors’ (CSP) efficiency reduced significantly under low irradiance. The authors also showed that utilising solar technologies reduces greenhouse gas emissions considerably while saving about 193 × 106 m3 of natural gas in south-central Iran. Lim et al. [6] evaluated the performance of passive concentrator and reflective systems in Malaysia. Their work showed that partial shading impacts the performance of the systems as extremely cloudy conditions characterise the study area. Hence, solar thermal equipment performs better in summer than in winter and is attributed to solar irradiation [7].
A study in Ethiopia by Endale [8] showed that implementing SWH could reduce wide-scale deforestation for heating water. Furthermore, the study revealed that about 1480 GWh of electric energy could be saved by using SWH. Roberts and Forbes [9] reported that the majority of the solar heating industries are for water heating for domestic use. Their work showed that the prevalent type of collector used is the flat plate. However, environmental conditions and seasons limit the hot water production of flat plate and evacuated tube collectors, as water may freeze on frigid days for passive systems [10]. Furthermore, the collector’s pipe diameter, absorber, orientation, size and storage tank’s capacity influences the performance of solar water heating systems [11].
A review of the performance of various absorber designs for a fluid-based solar collector was conducted by Abdullah et al. [12]. Their study showed that the spiral flow absorber performed best. The overall energy produced by the system increased by 3.5%. Investigations by Duffie et al. [13] revealed that the ideal pipe diameter to minimise heat losses is 19–25 mm. Their findings show that the pipe diameters used in their study did not impact the hot water generated. However, the flow condition was faster for the 25 mm pipe and slower for the 19 mm pipe. Smaller tube diameters (4–25 mm) offer several advantages, as seen in Tanase et al. [14]. However, the collector’s performance may be significantly reduced if the pipes corrode [10].
Salgado-Conrado and Lopez-Montelongo [15] reported that 65% of the electricity used in the domestic sector is for water heating. As illustrated in Figure 1, the domestic sector in South Africa accounts for 27% of electricity demand, with 40–60% of the electricity consumed in the domestic sector attributed to water heating [16]. The agricultural sector has the least energy demand of 2% while the industrial sector is the highest with 36%.
Part of the efforts made by the South African government in encouraging the use of solar water heating systems is the massive rollout of SHW in the low-cost housing sector in 2008. The programme was halted due to the enormous failure of the installed SWH systems [17]. Thobejane et al. [17] noted that the collapse of the installed SWH is majorly a social problem as most installers had inadequate training and expertise. The authors recommended that the government provide quality training and ensures that only accredited installers handle solar water heater installation. Netshiozwi [18] revealed that the failures resulted from inadequate community sensitisation, faulty installation and poor craftsmanship. Hence, it has impacted the ability of the national power utility to reach its load reduction target. The author recommended that responsible agencies should intensify the efforts towards bridging the educational divide in the country as the failure of SWH is a social problem. About thirteen years later, the programme, with an estimated 50–70% savings on energy consumption, remains in the shadows, unlike other renewable energy technologies.
In recent years, consumer energy demand in South Africa has put an enormous burden on the already struggling coal-fired national utility. Hence, there is a need to provide alternative means of providing hot water on demand. South Africa, at the moment, has the most significant carbon footprint in Africa [19]. The South African government has made much effort to encourage renewable and sustainable energy technologies to combat climate change and reduce its carbon emission as a party of the Kyoto Protocol [20]. The report by the International Energy Agency [21] shows the commitment of the South African government in the renewable sector with an investment of USD 140 million (ZAR 2 billion) in credit facilities. Jain and Jain [22] showed that South Africa has enormous potential for using renewable energy technologies. It boasts of receiving annually about 2500 sunshine hours, with daily average irradiation levels in the range of 4.5–6.5 kWh/m2. Despite these potentials, the use of electricity for domestic water heating is still prevalent in the country [23]. The situation is further compounded by the inability of the national utility, Eskom, to service its existing customers. Hence, South Africa is plagued with incessant load shedding, as reported by Apeh et al. [24].
Solar water heaters’ performance is usually monitored through parameters such as irradiance, inlet and outlet water temperatures, ambient temperature, wind speed and direction. An experiment carried out by Lizama-Tzec et al. [25] on the electrodeposition of selected coatings on three flat plate collectors revealed that the system’s thermal efficiency was determined by measuring the incident irradiance and the water temperature of the collector. In agreement with the parameters measured by the authors Lizama-Tzec et al. [25], Budea and Bǎdescu [26] worked on improving the performance of solar collectors for producing hot water. This was done through the measurement of global irradiance and water temperature. Furthermore, Roberts [27] showed that irradiance, inlet water temperature and ambient temperature are vital parameters for determining the merit for absorbers used in solar water heating systems.
The massive failures of solar water heating systems installed in the low-cost housing sector in South Africa have left many wondering about the efficacy of these systems as a result of these failures and the unavailability of a detailed report about the causes of these failures. The foregoing pose a significant barrier to the utilisation of SWH in South Africa. Hence, the study seeks to unravel the durability of solar water heating systems through a comprehensive analysis of the performance of flat plate and evacuated tube solar heating systems and their usage profiles. The installed systems will provide hot water in the low-cost housing sector in South Africa, thereby reducing the country’s carbon footprint and reducing demand on the ailing national power plant.

2. Material and Methods
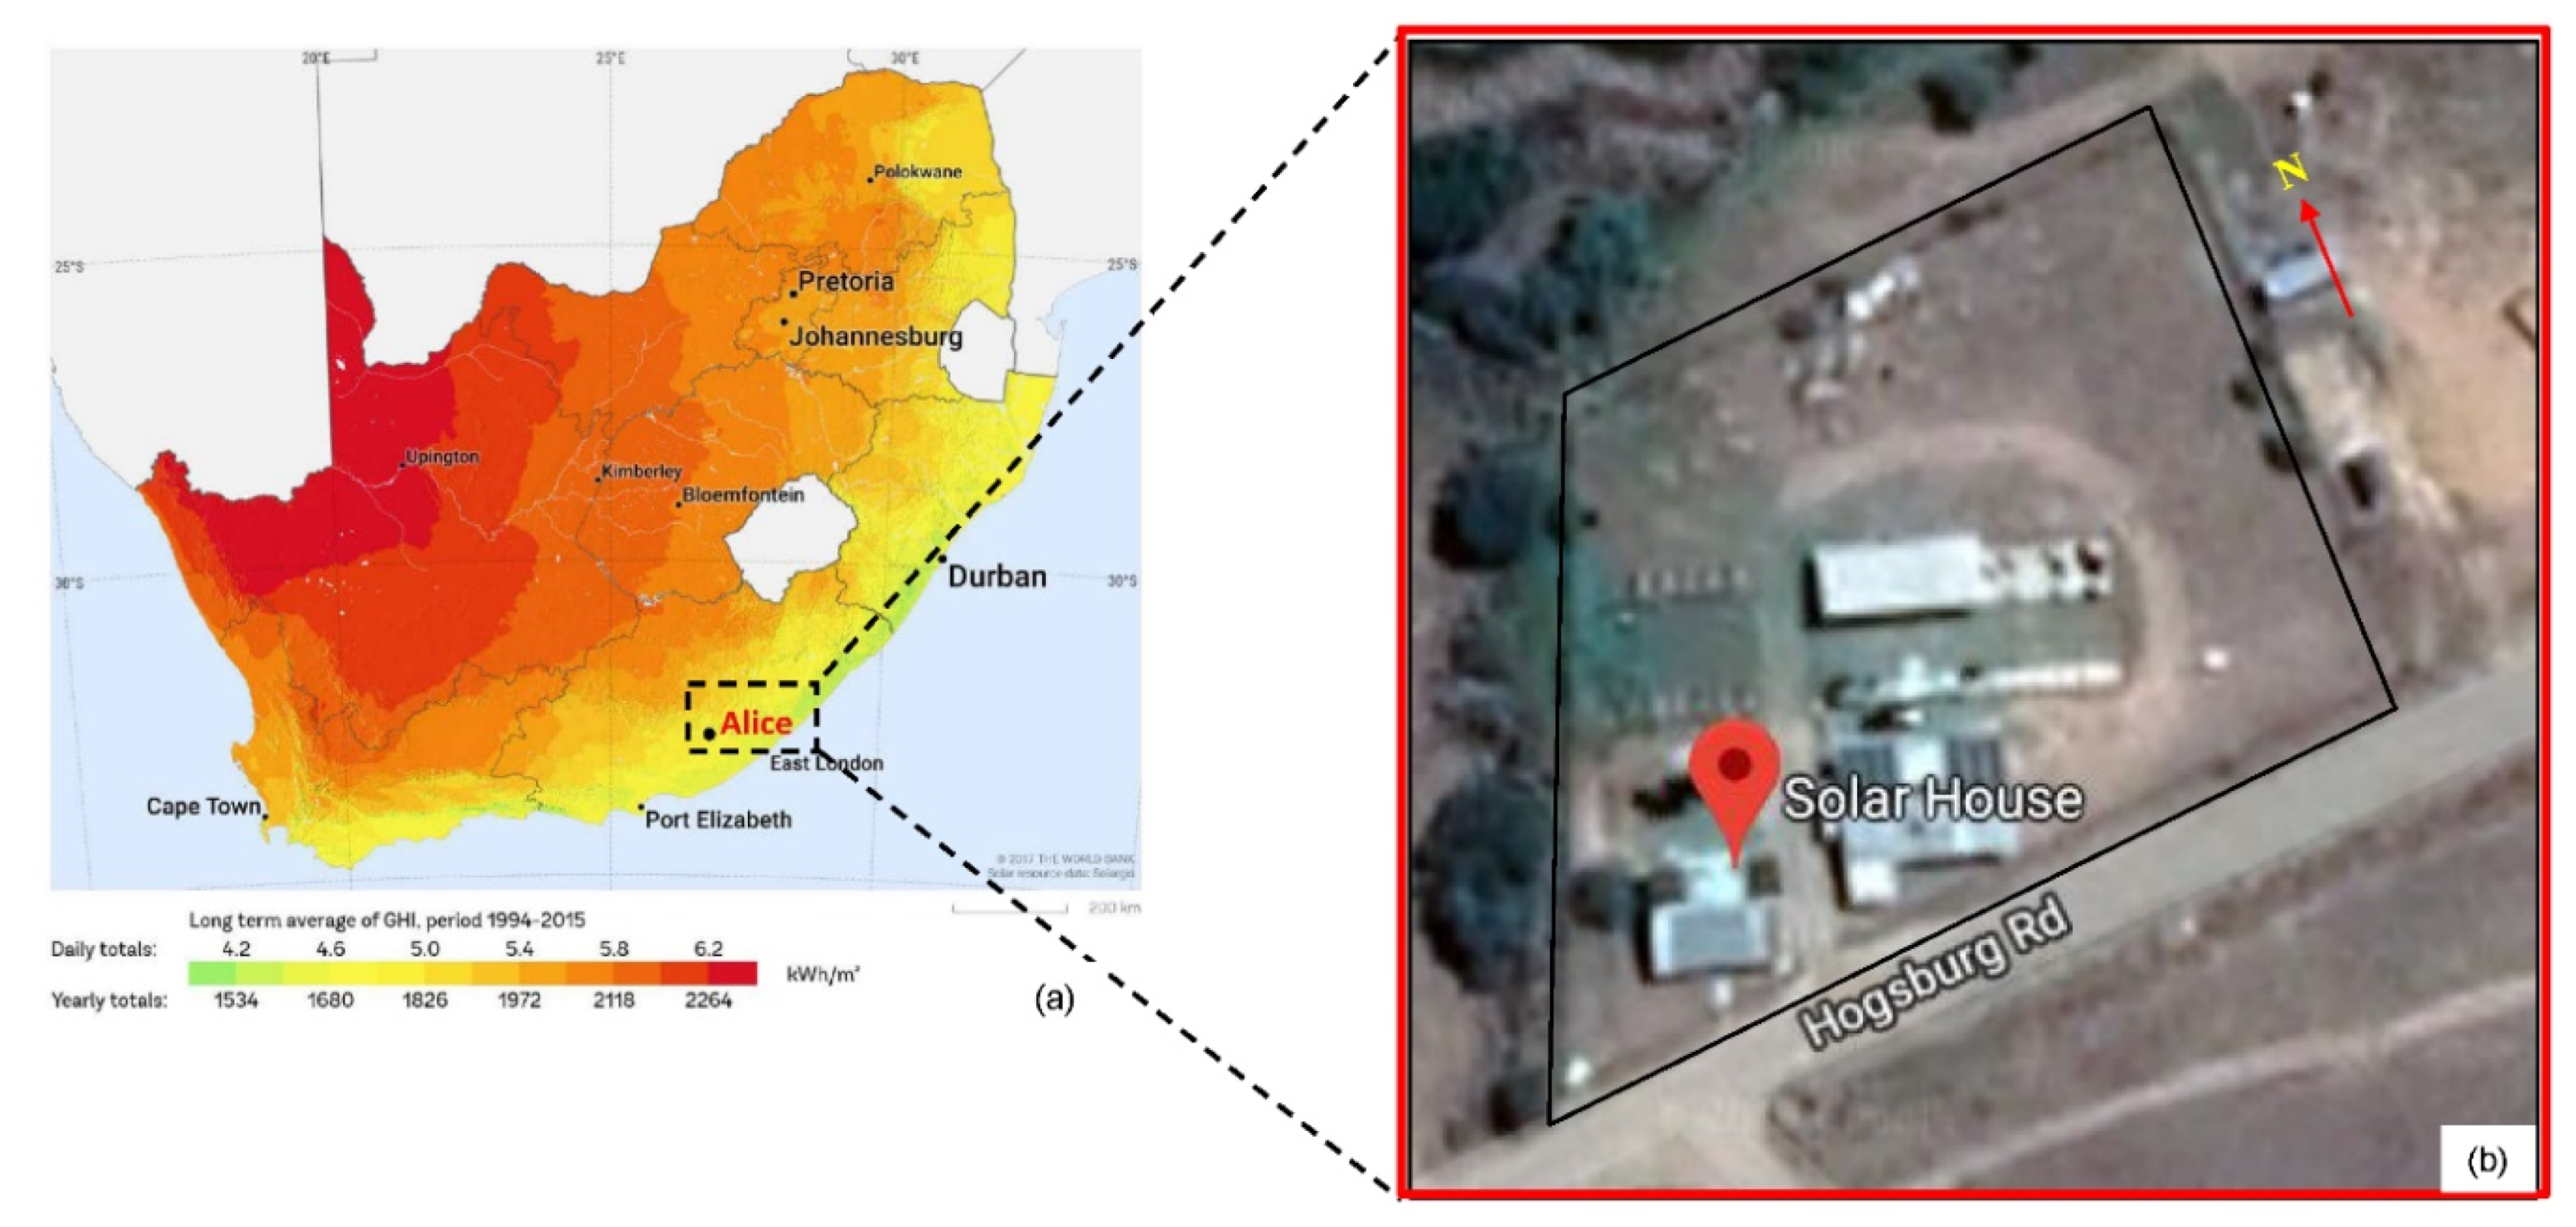
2.1. The Study Area

The study site (SolarWatt Park) is located at the University of Fort Hare, Alice, Eastern Cape Province of South Africa, at latitude 32.8° south and longitude 26.8° east at an altitude of 540 m [28].
Figure 2 presents the long-term daily and yearly global horizontal irradiation (GHI) for South Africa. The GHI is utilised by solar energy technologies and is the summation of the direct normal irradiance (DNI), diffuse horizontal irradiance (DHI) and ground reflected radiation. As shown in Figure 2, South Africa experiences an annual average GHI of 2264 kWh/m2, comparable to China with 2118 kWh/m2 and Europe with 2100 kWh/m2, where SWH systems are predominantly used [29]. It is also evident that GHI availability decreases toward the coastal area. Upington in the Northern Cape, inland, has the highest annual average GHI between 2118–2264 kWh/m2, while Durban, a typical coastal city, experiences 1534–1680 kWh/m2. However, Alice, located at the peripheries of inland regions, has a daily and yearly average GHI between 4.6–5.0 kWh/m2 and 1620–1826 kWh/m2, respectively [30]. According to Kelvin et al. [31], Alice falls under the temperate interior zone, characterised by a hot summer and mild winter. The average dry-bulb temperature for the summer study area is 29 °C and 15 °C in winter [32].

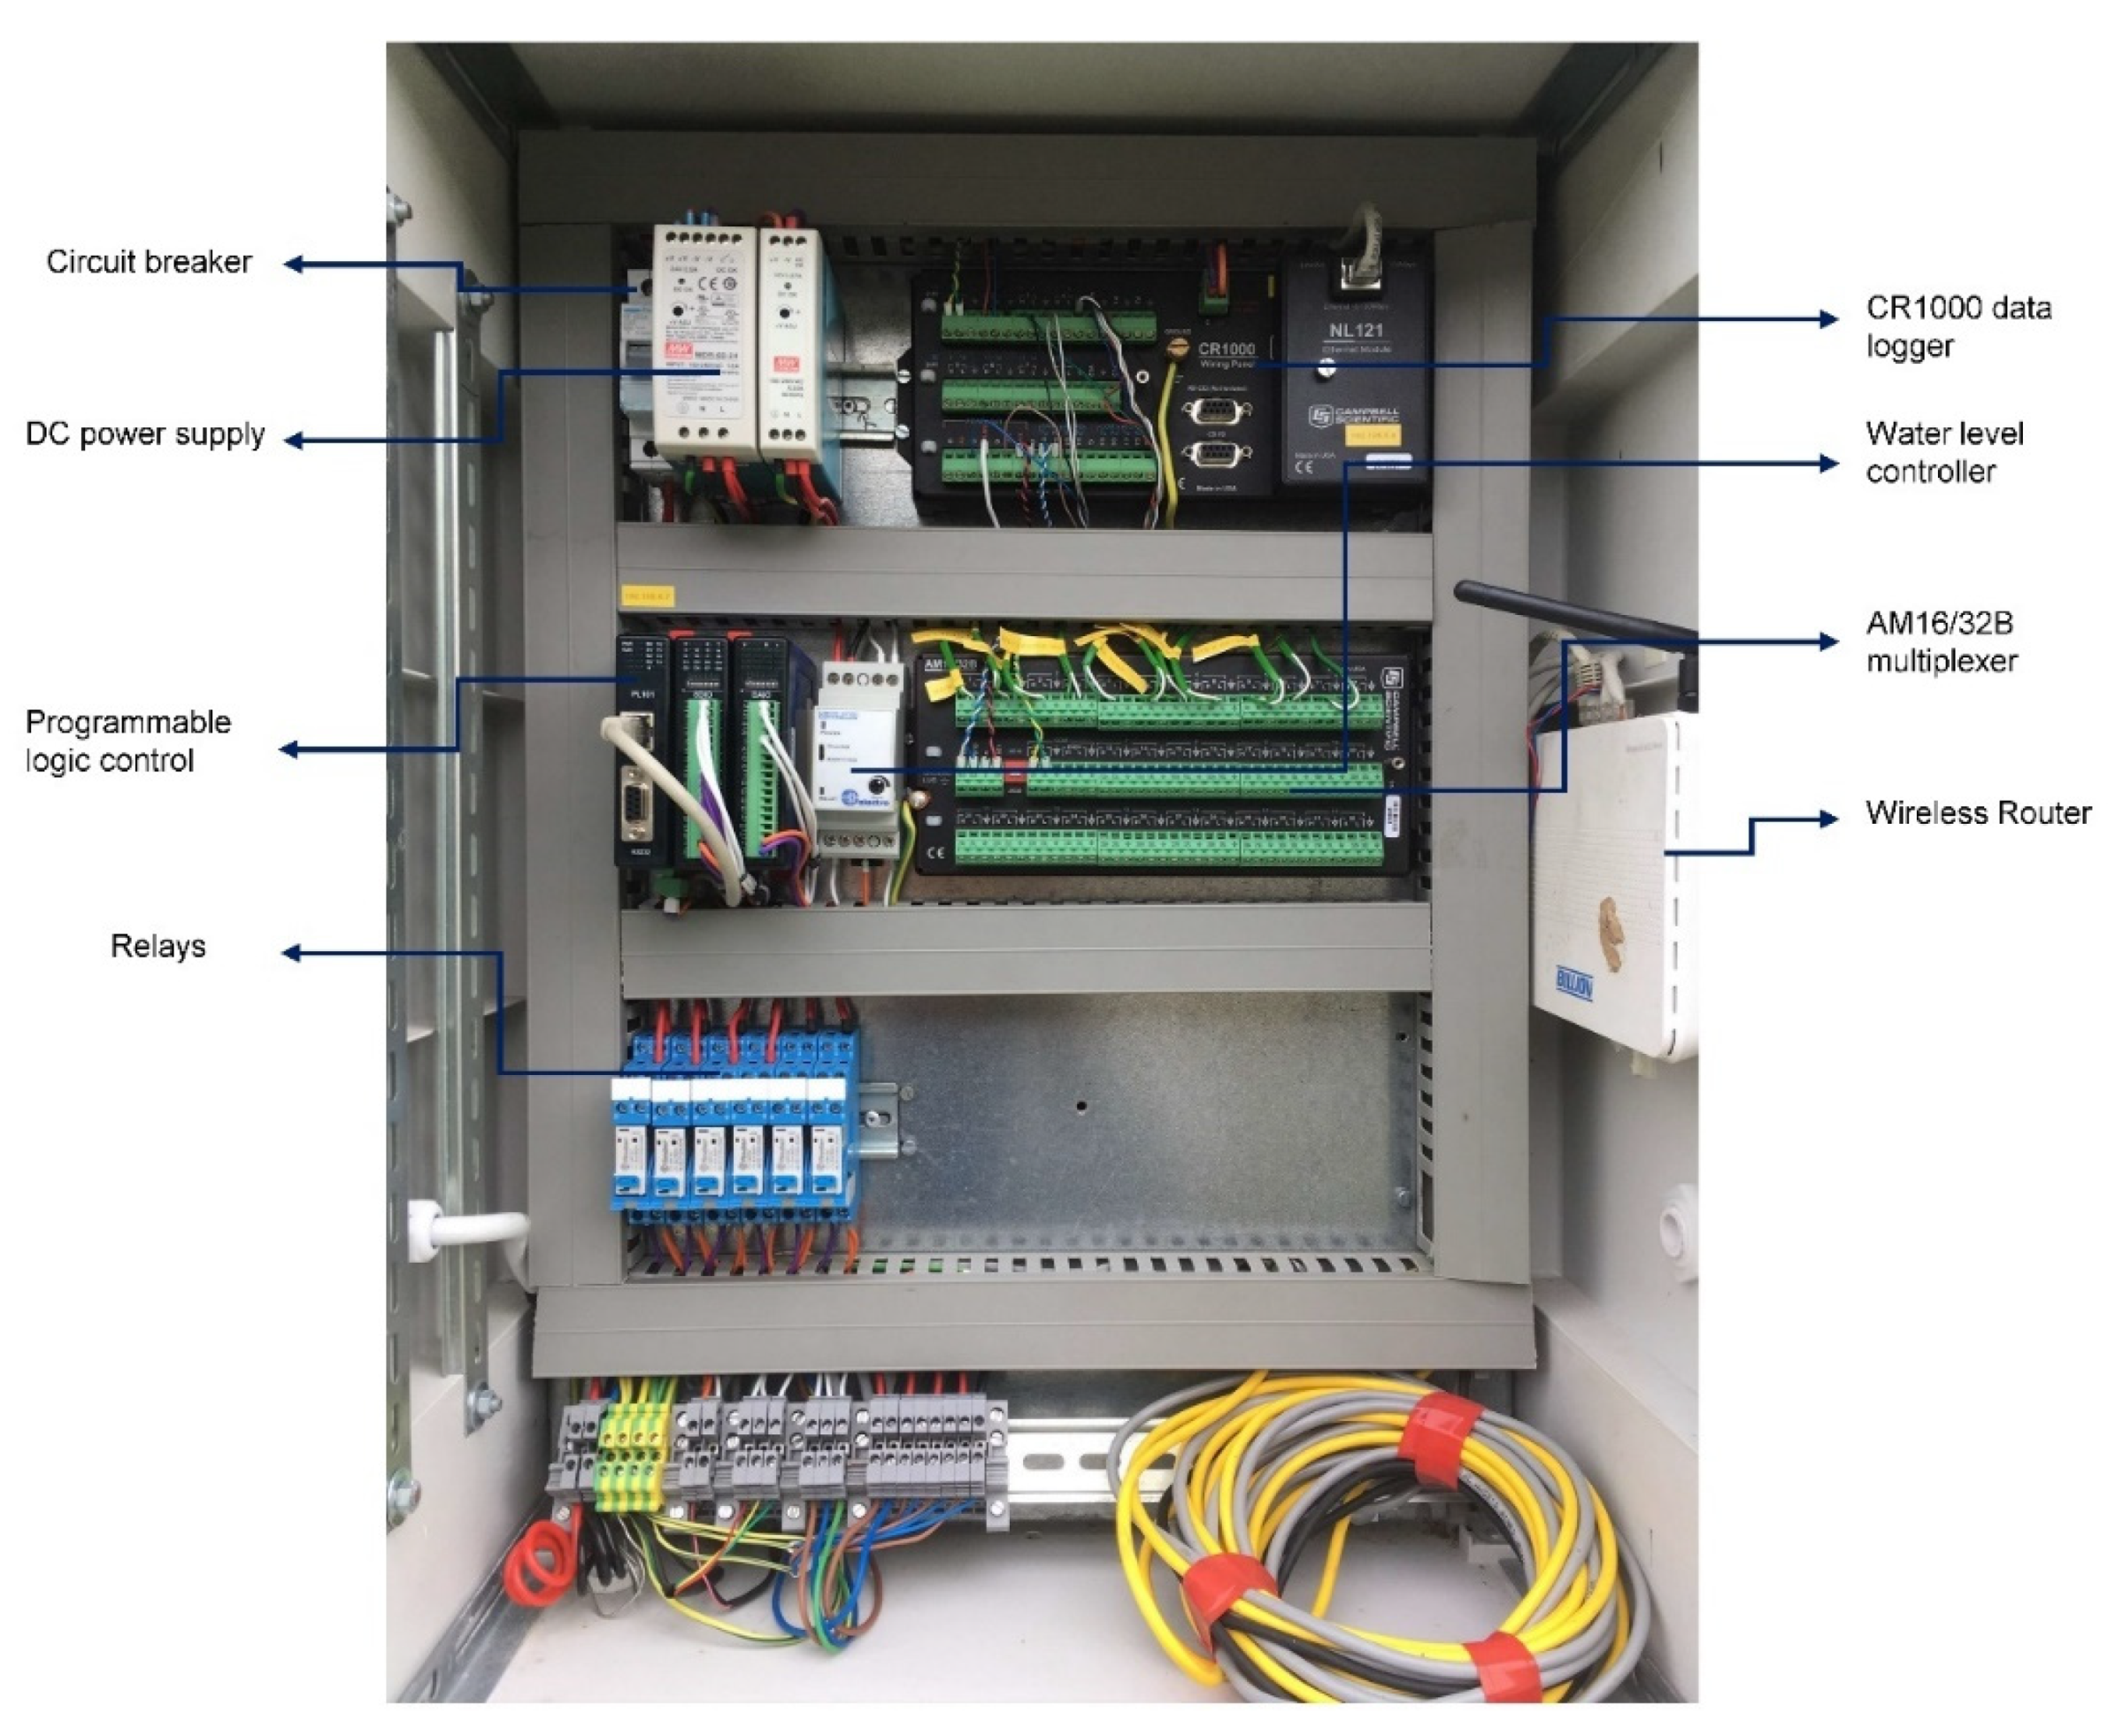
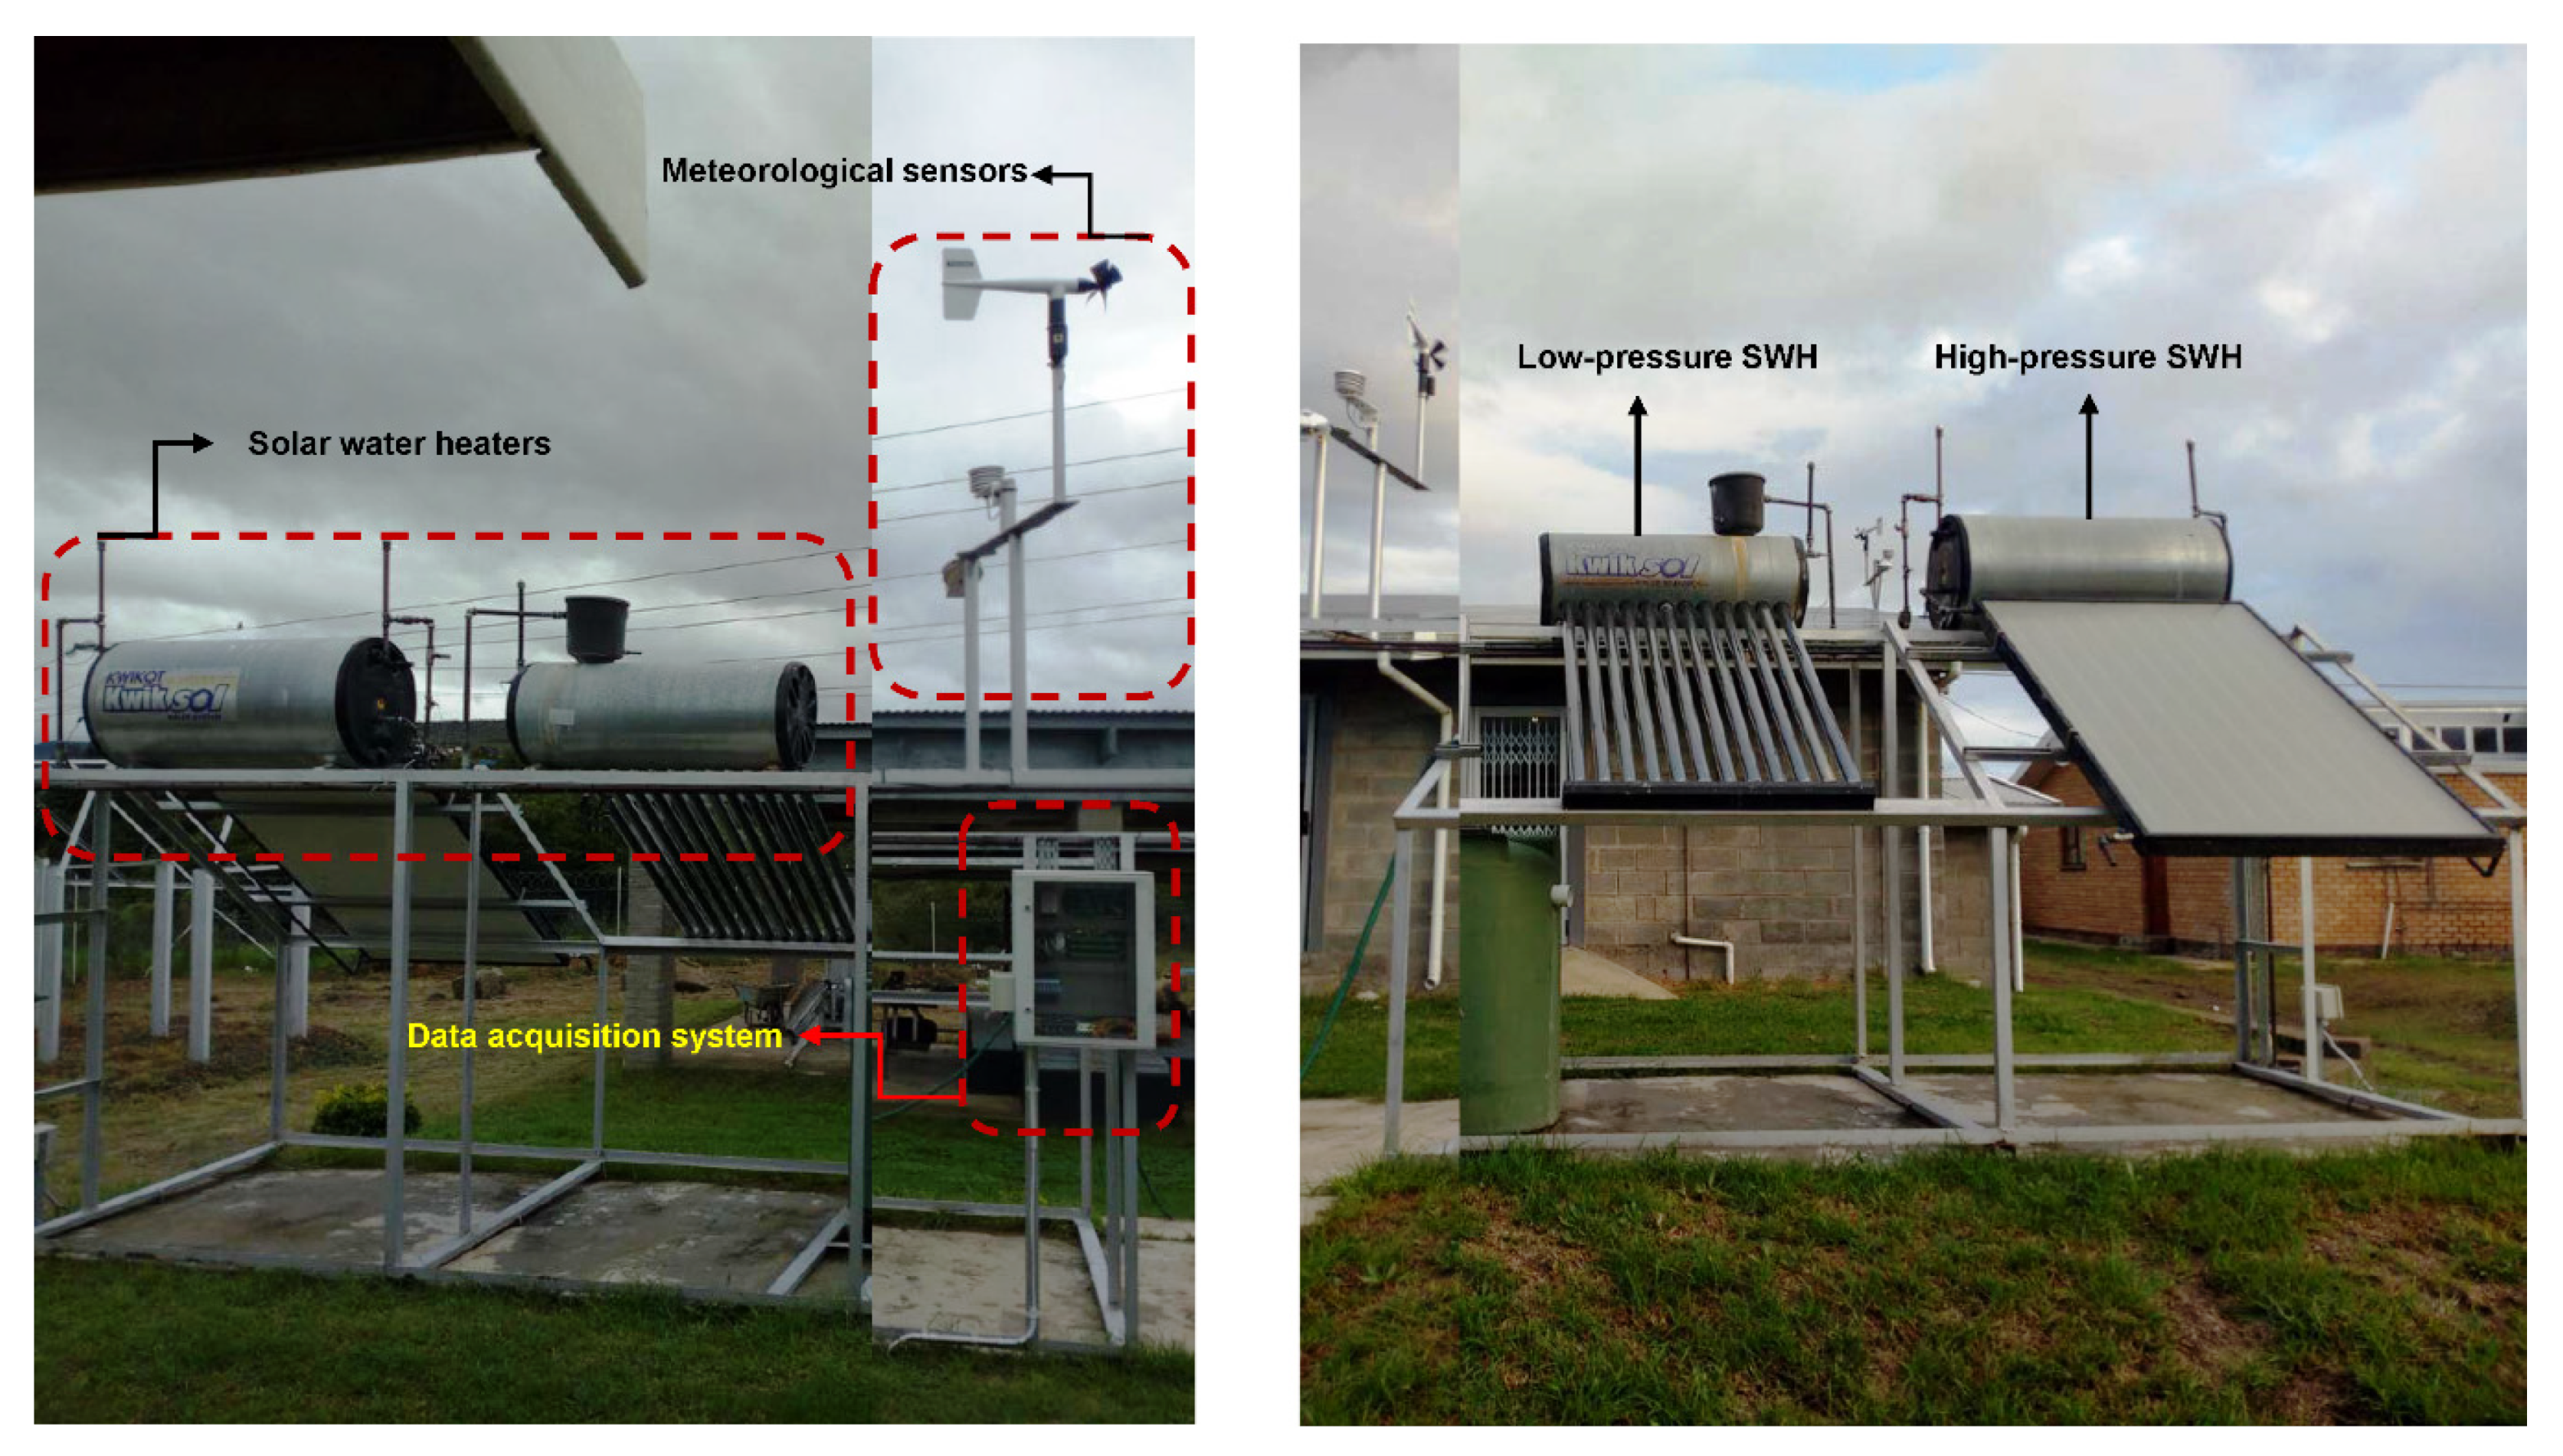
2.2. Solar Water Heater Outdoor Test Rig

Two commercially available solar water heater (SWH) systems, a high-pressure flat plate (FP) and a low-pressure evacuated tube (ET), were used. The FP and ET systems were installed outdoors on a test rig inclined at 34° facing north, as seen in Figure 3.
The flat plate system’s capacity is 200 litres, while the evacuated tube system is 150 litres. The temperatures of both solar water heater systems were monitored using type K thermocouples. The thermocouples were retrofitted at strategic points within the system to measure water temperature. The vital points mentioned earlier are the inlet mains, inlet and outlet of both collectors, the storage tanks for both systems and the water tank where hot water is discharged. “The South African standard (SANS 6211-2:2003) recommend one-day outdoor thermal performance tests for SWHs” [17]. Naghavi et al. [33] reveal that one-day outdoor performance test characterised by high and low solar intensities is sufficient to determine the performance of a solar water heater. The specifications of the solar water technologies used in this study obtained from the manufacturer’s datasheet [34] are presented in Table 1.
The meteorological data were measured using an HMP60 relative humidity/temperature probe and Young’s wind vane. Furthermore, the incident solar irradiance on the two systems listed in Table 1 was measured with a CMP10 pyranometer inclined at 34°. All of the sensors mentioned were connected to a custom data acquisition and control (DAC) system with all of the parameters measured at 5 s. The specifications of the devices used to measure the meteorological data and the water temperature of the solar water heating systems is presented in Table 2. All of the sensors listed in Table 2 are connected to a custom data acquisition and control system shown in Figure 4.
The custom DAC system designed and coupled at the SolarWatt Park, Alice, South Africa shown in Figure 4 was designed to measure irradiance, water temperature, relative humidity/temperature, wind speed and direction. Additionally, the DAC system is automated to drain hot water and refill the geyser with cold water at any point in time. The essence of draining hot water and filling it with cold water is to mimic hot water usage in a typical residential setup. Two solenoid valves were retrofitted on the FP and ET storage tank outlets, and this allows the programmable logic control unit in Figure 4 to initiate the draining of both geysers. All of the sensors used were connected to a CR1000 datalogger and an AM16/32b relay multiplexer. The multiplexer was used to support other sensors since all of the physical ports on the CR1000 were exhausted. The wireless router in Figure 4 allows for remote monitoring, control and data retrieval from the DAC system via a supervisory control and data acquisition (SCADA) interface.

3. Results and Discussion

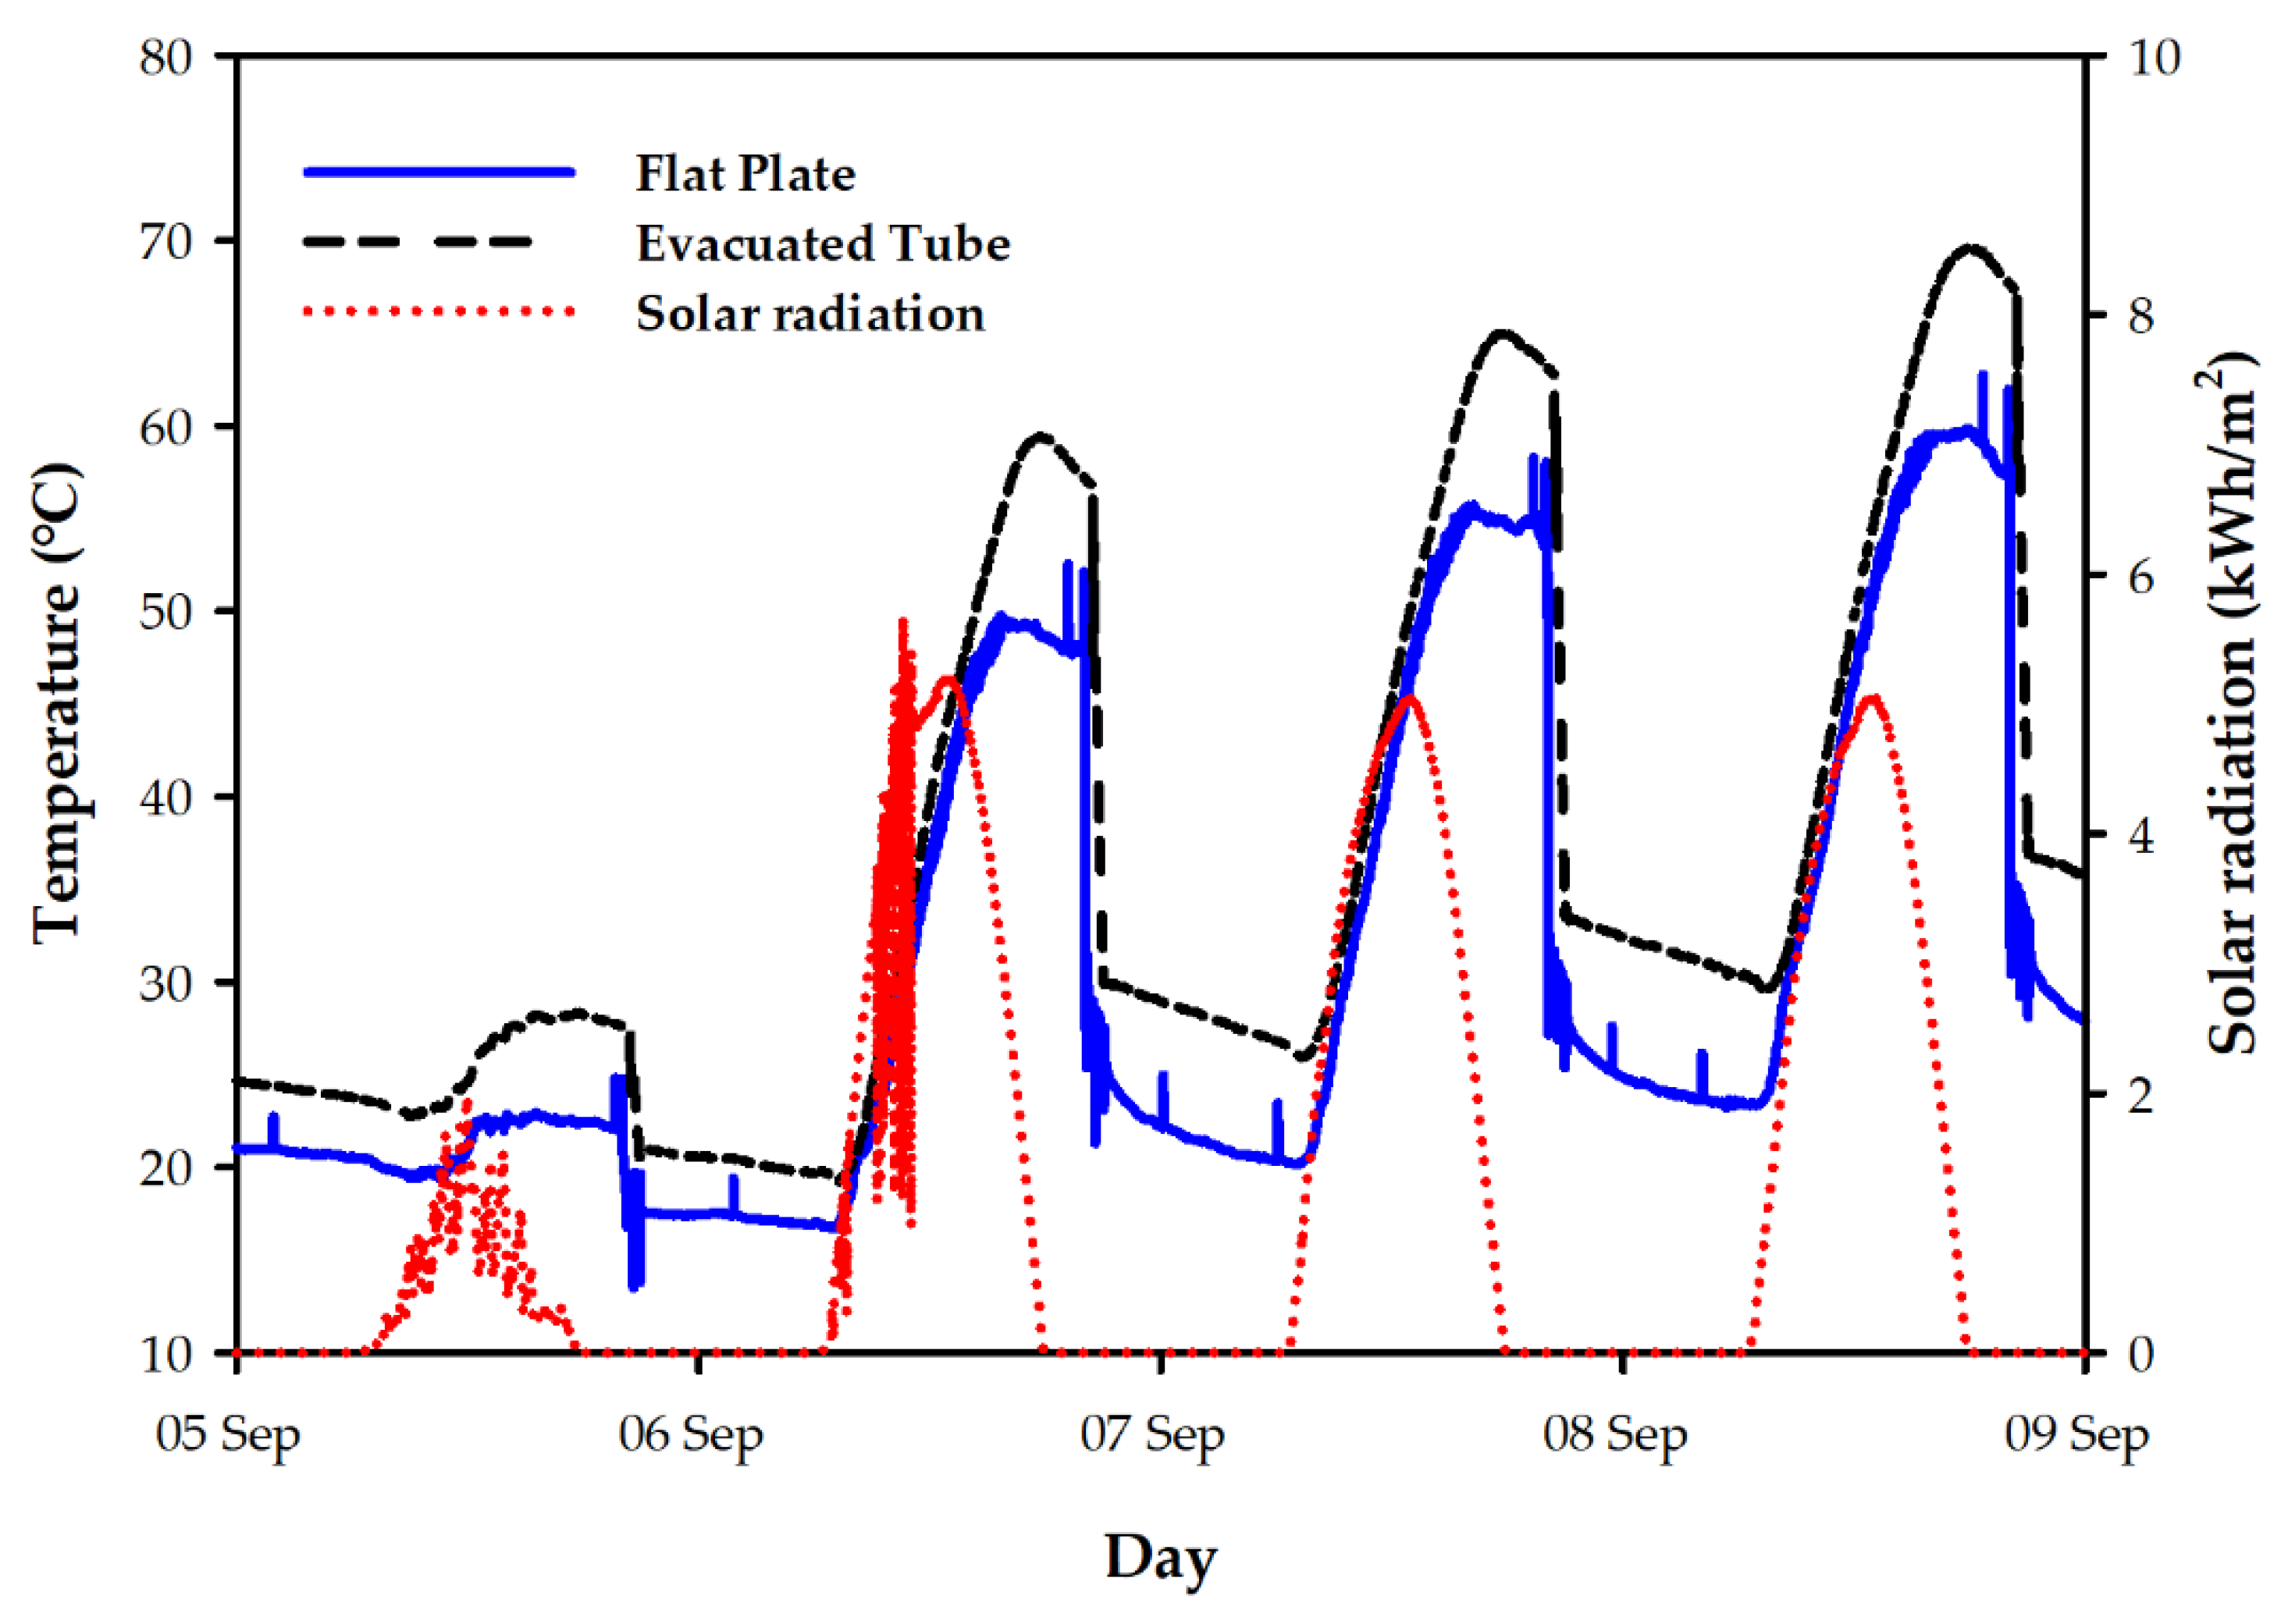
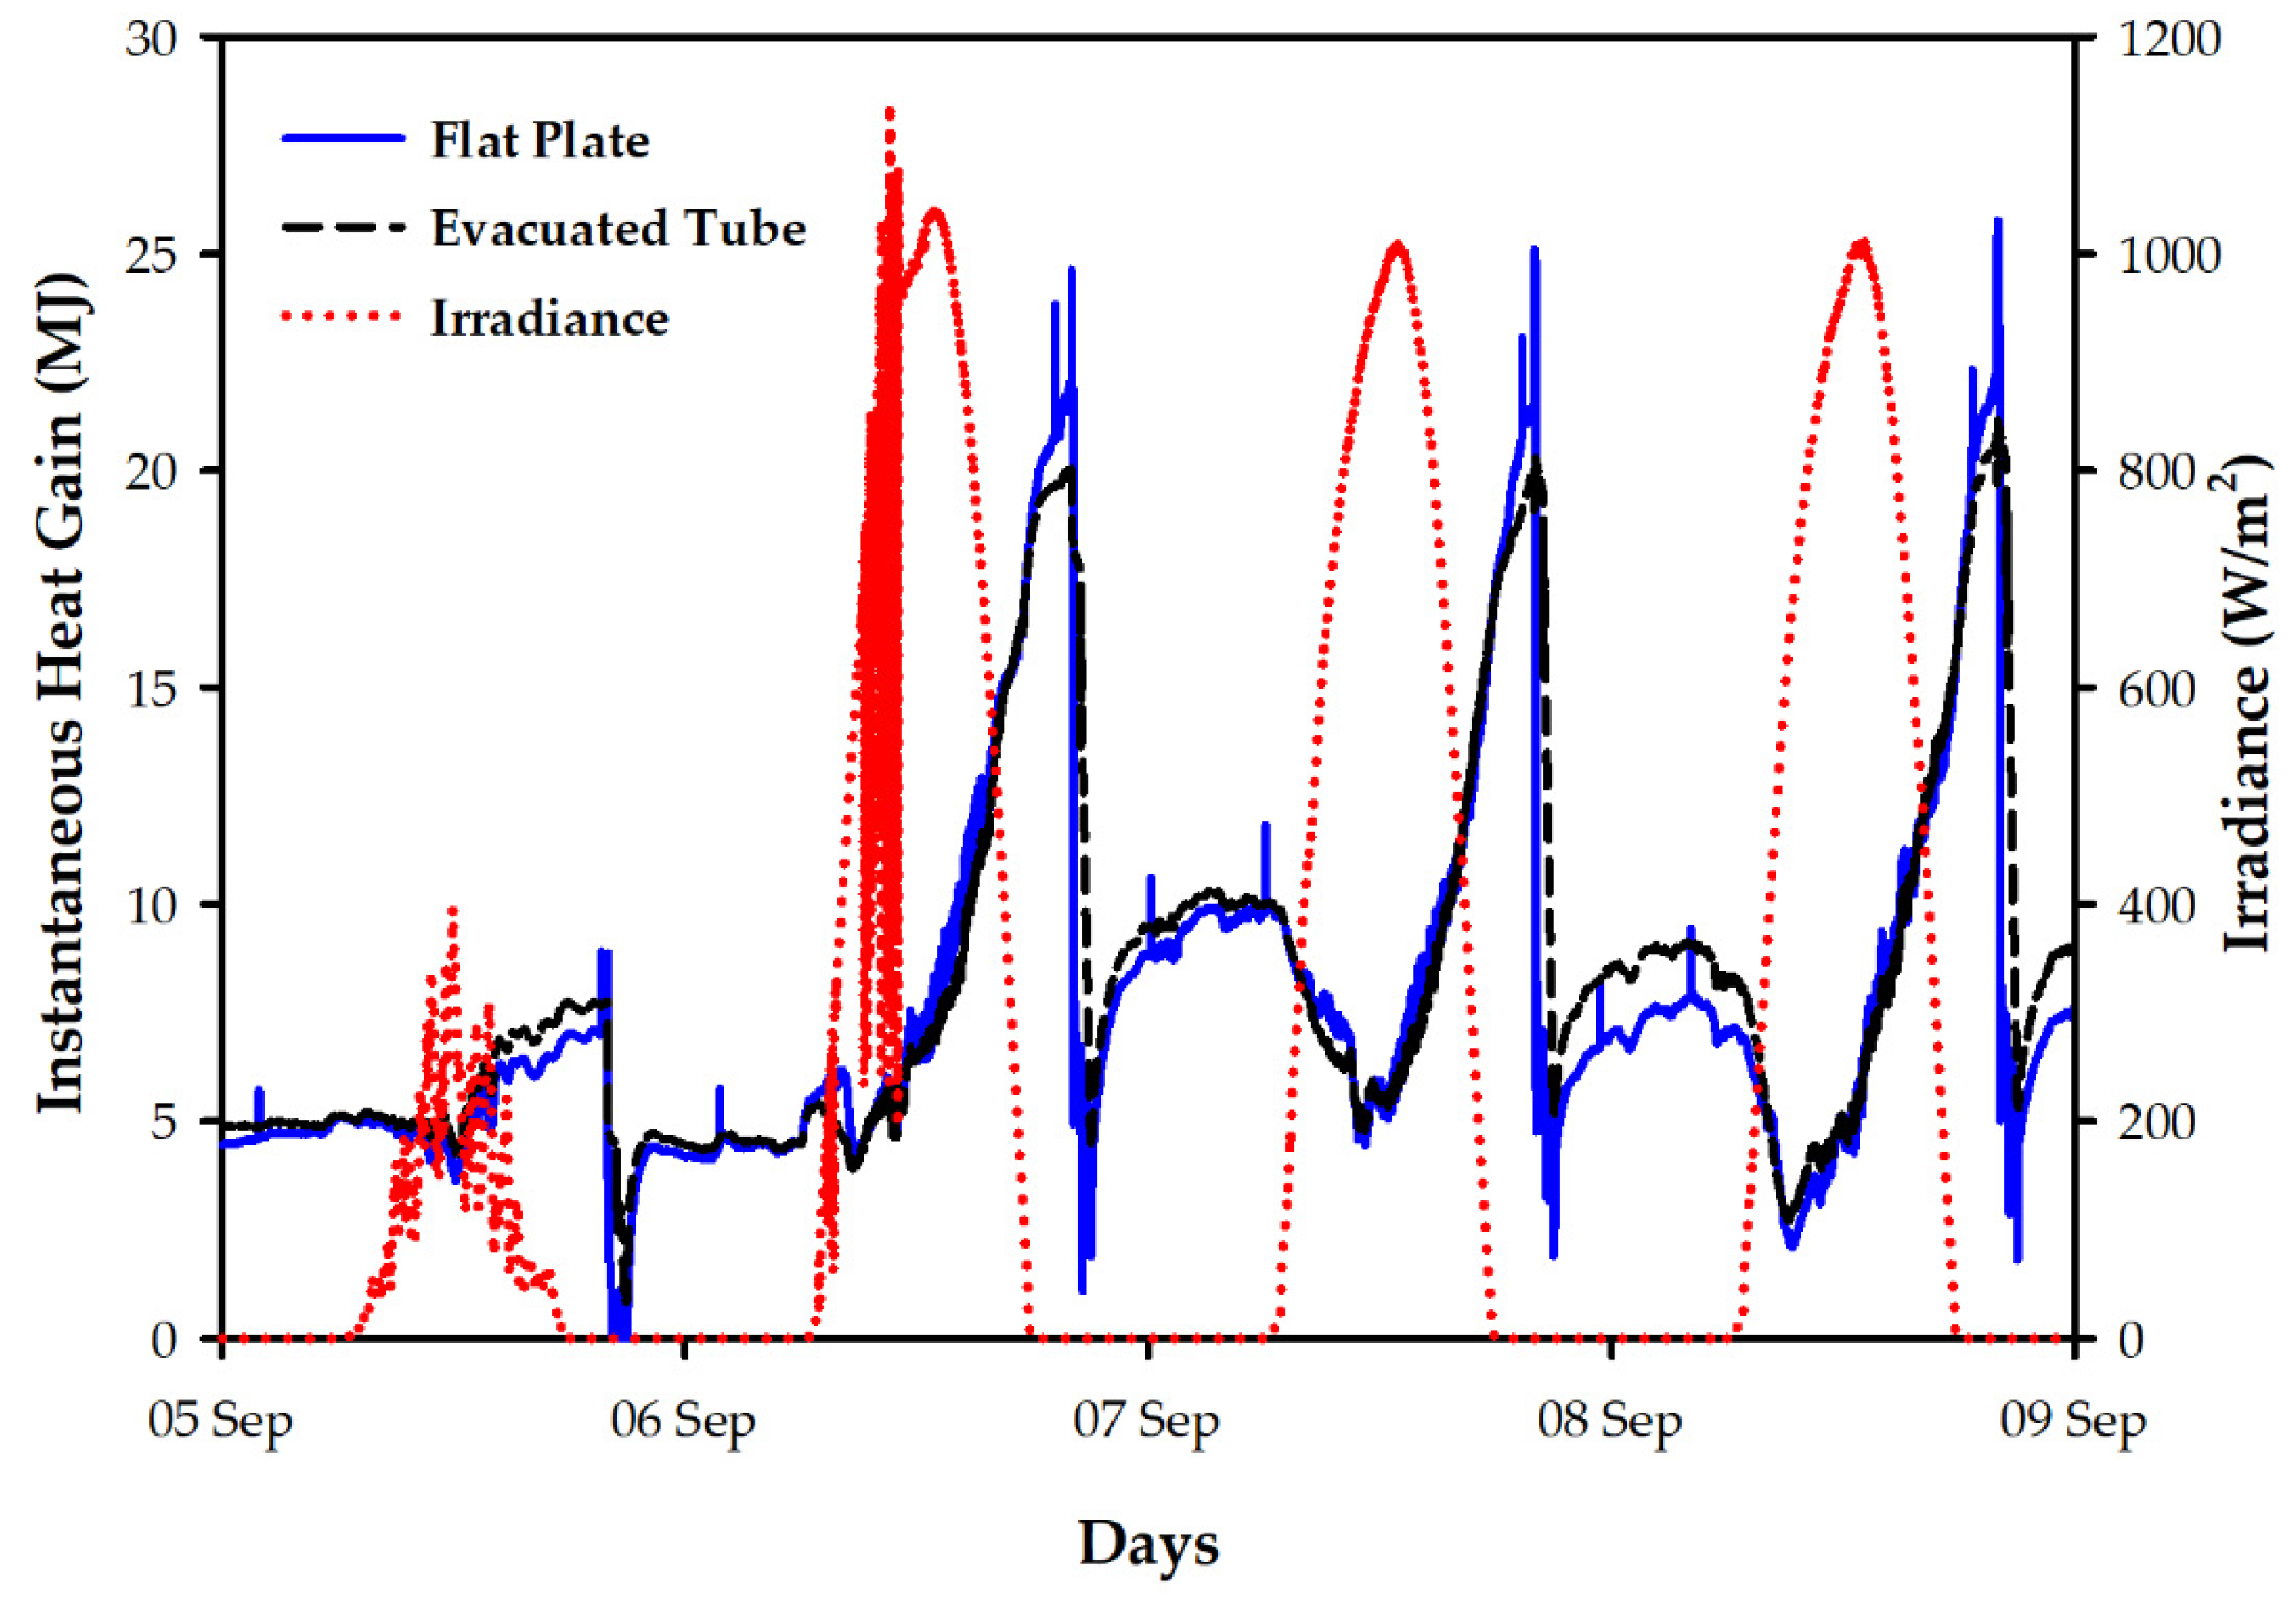
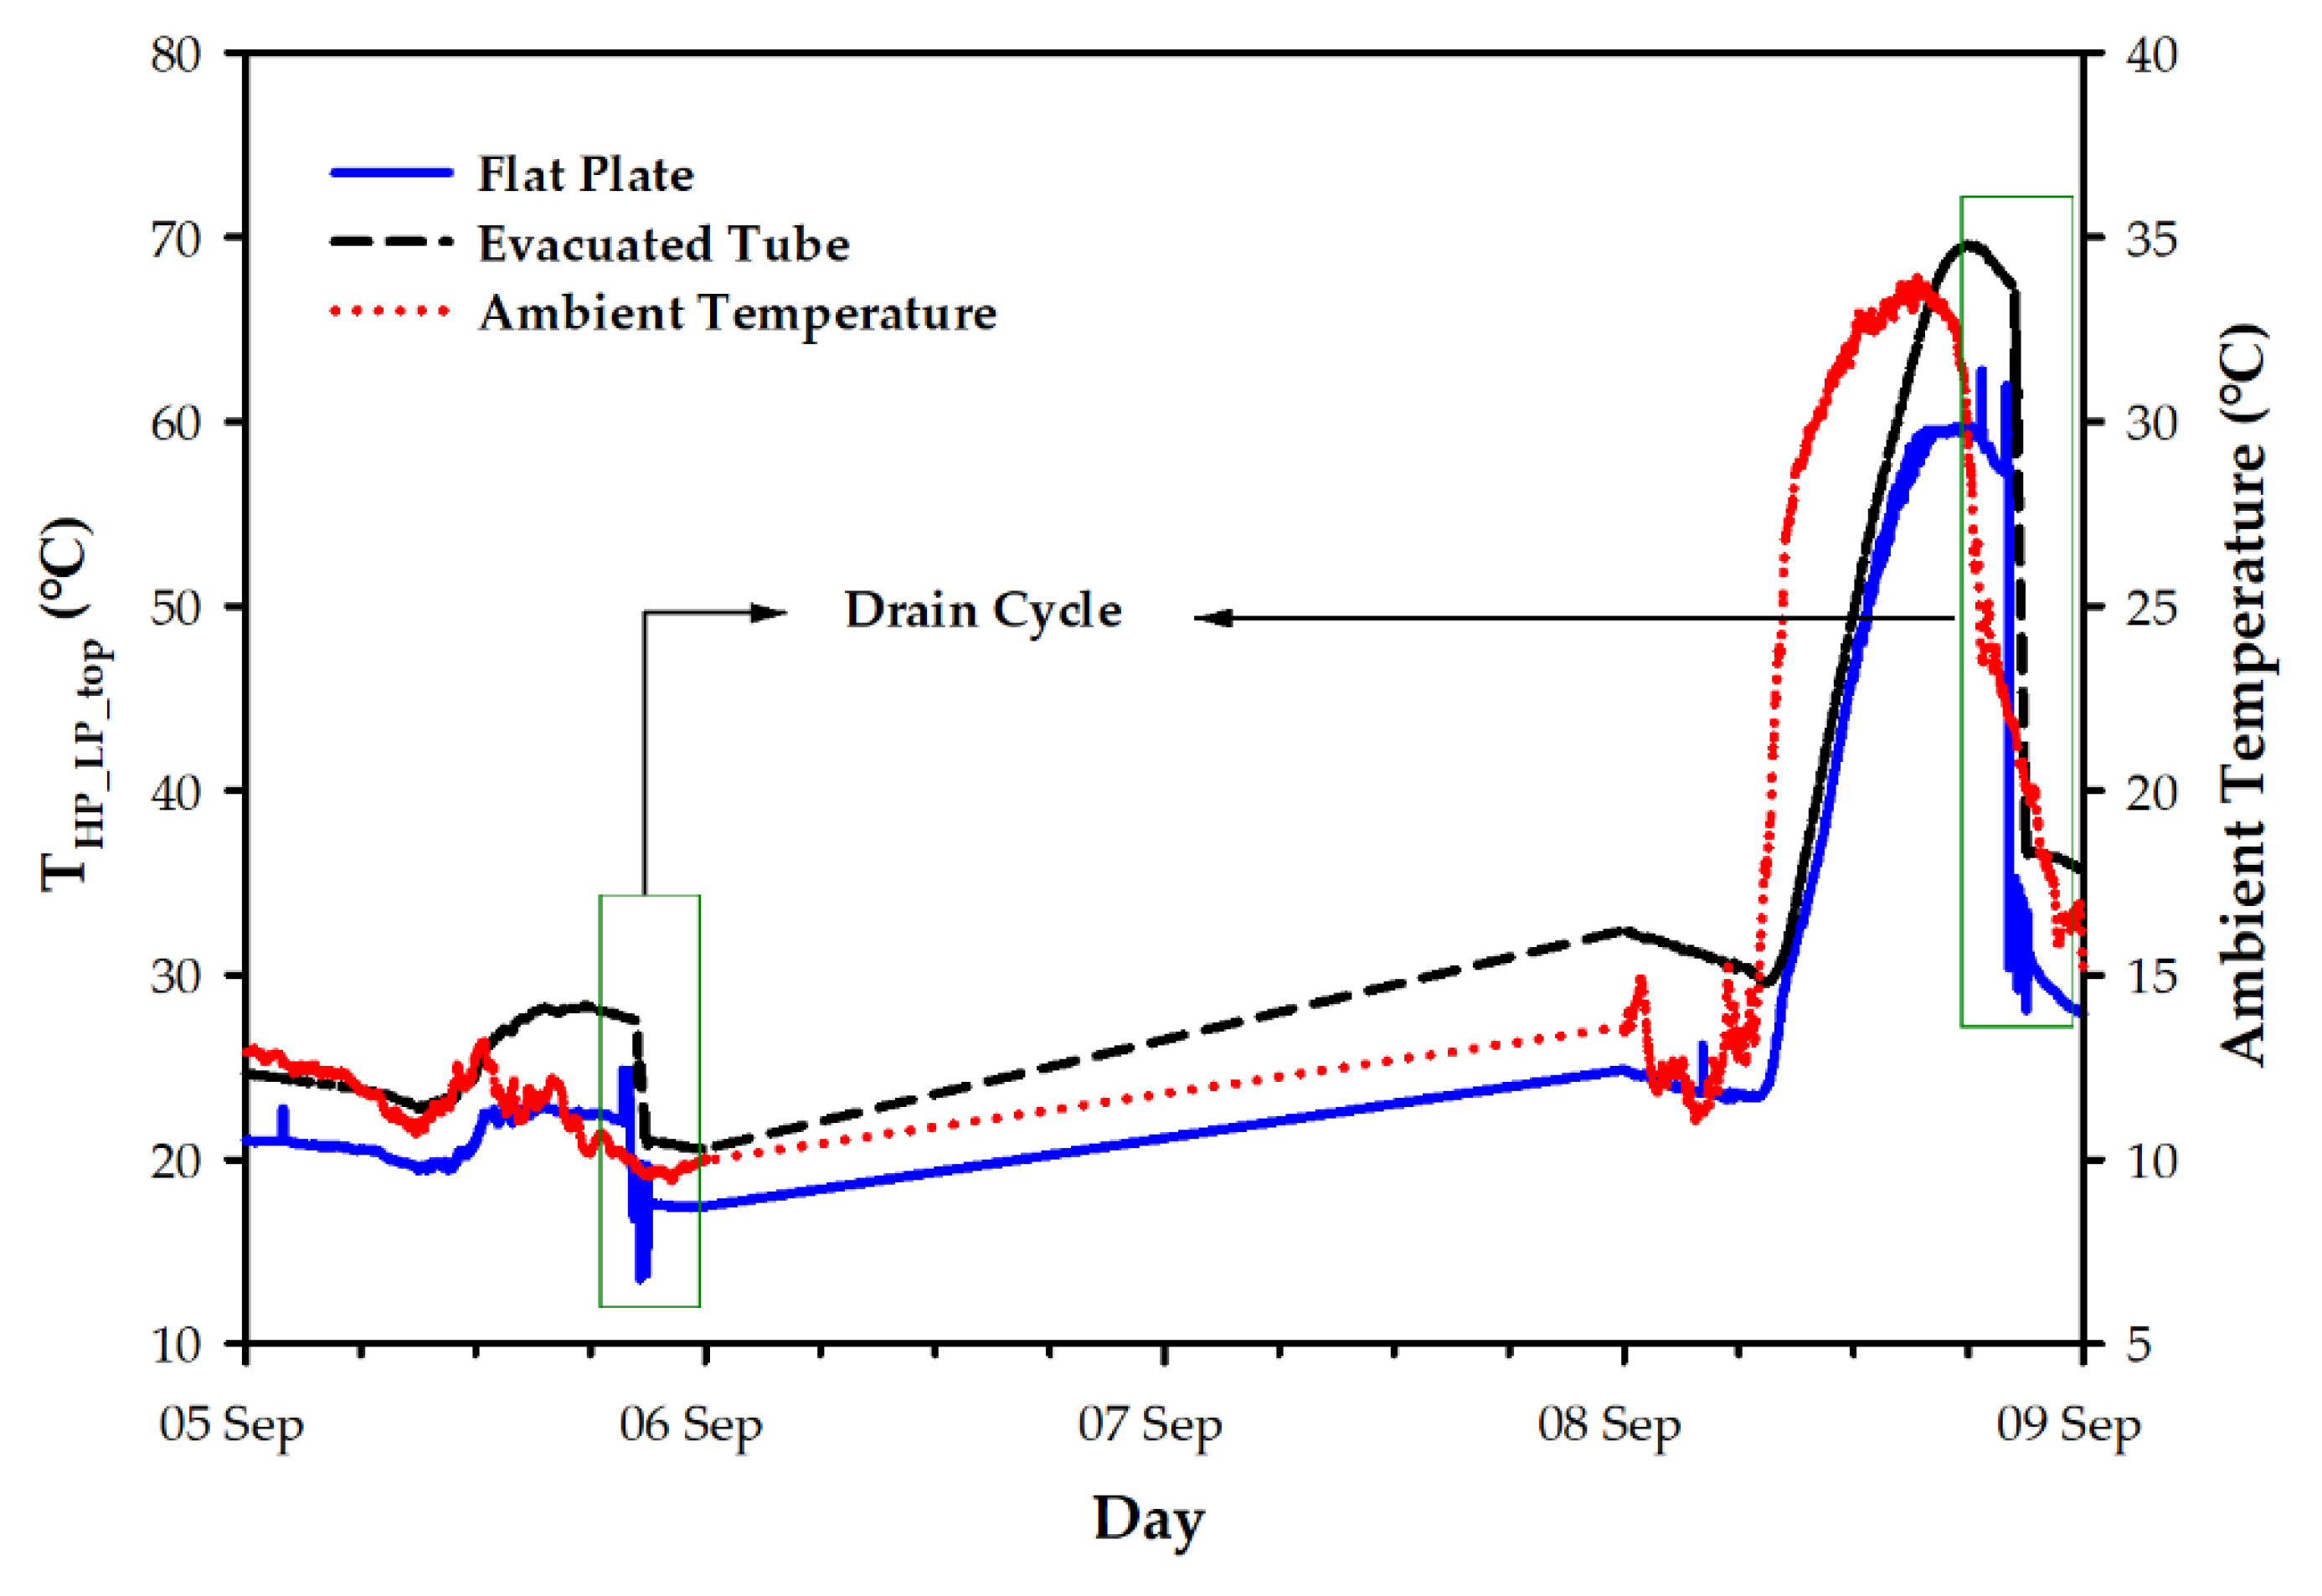
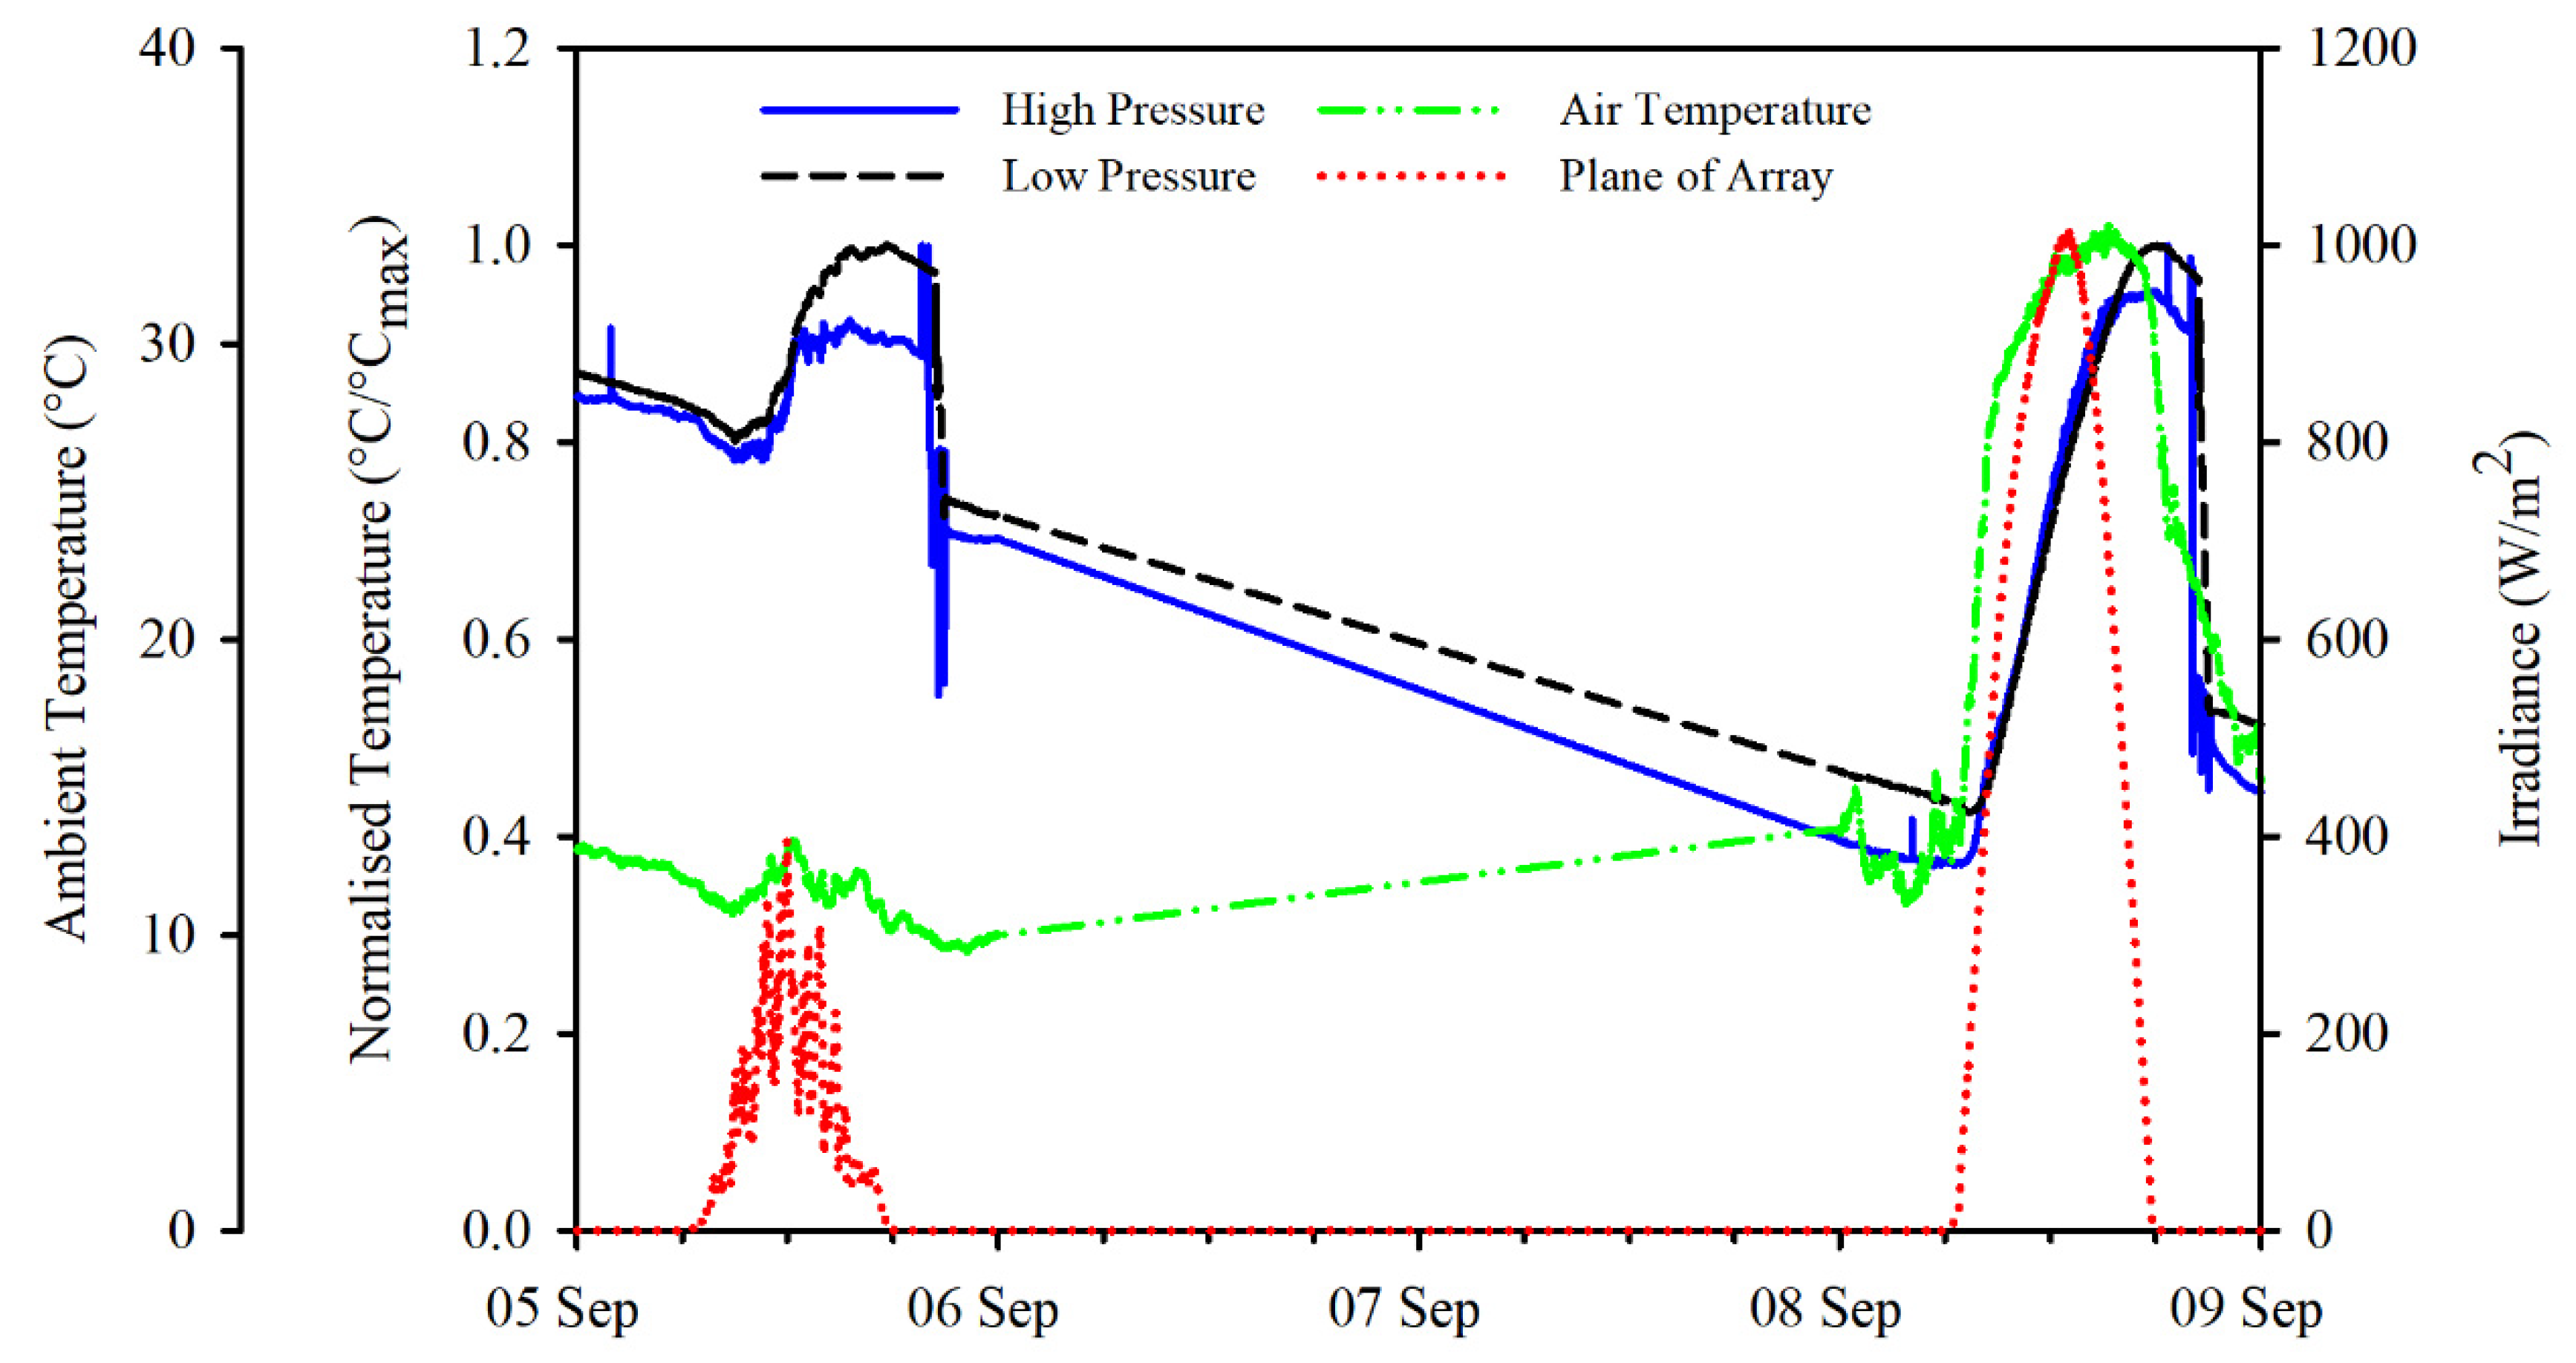
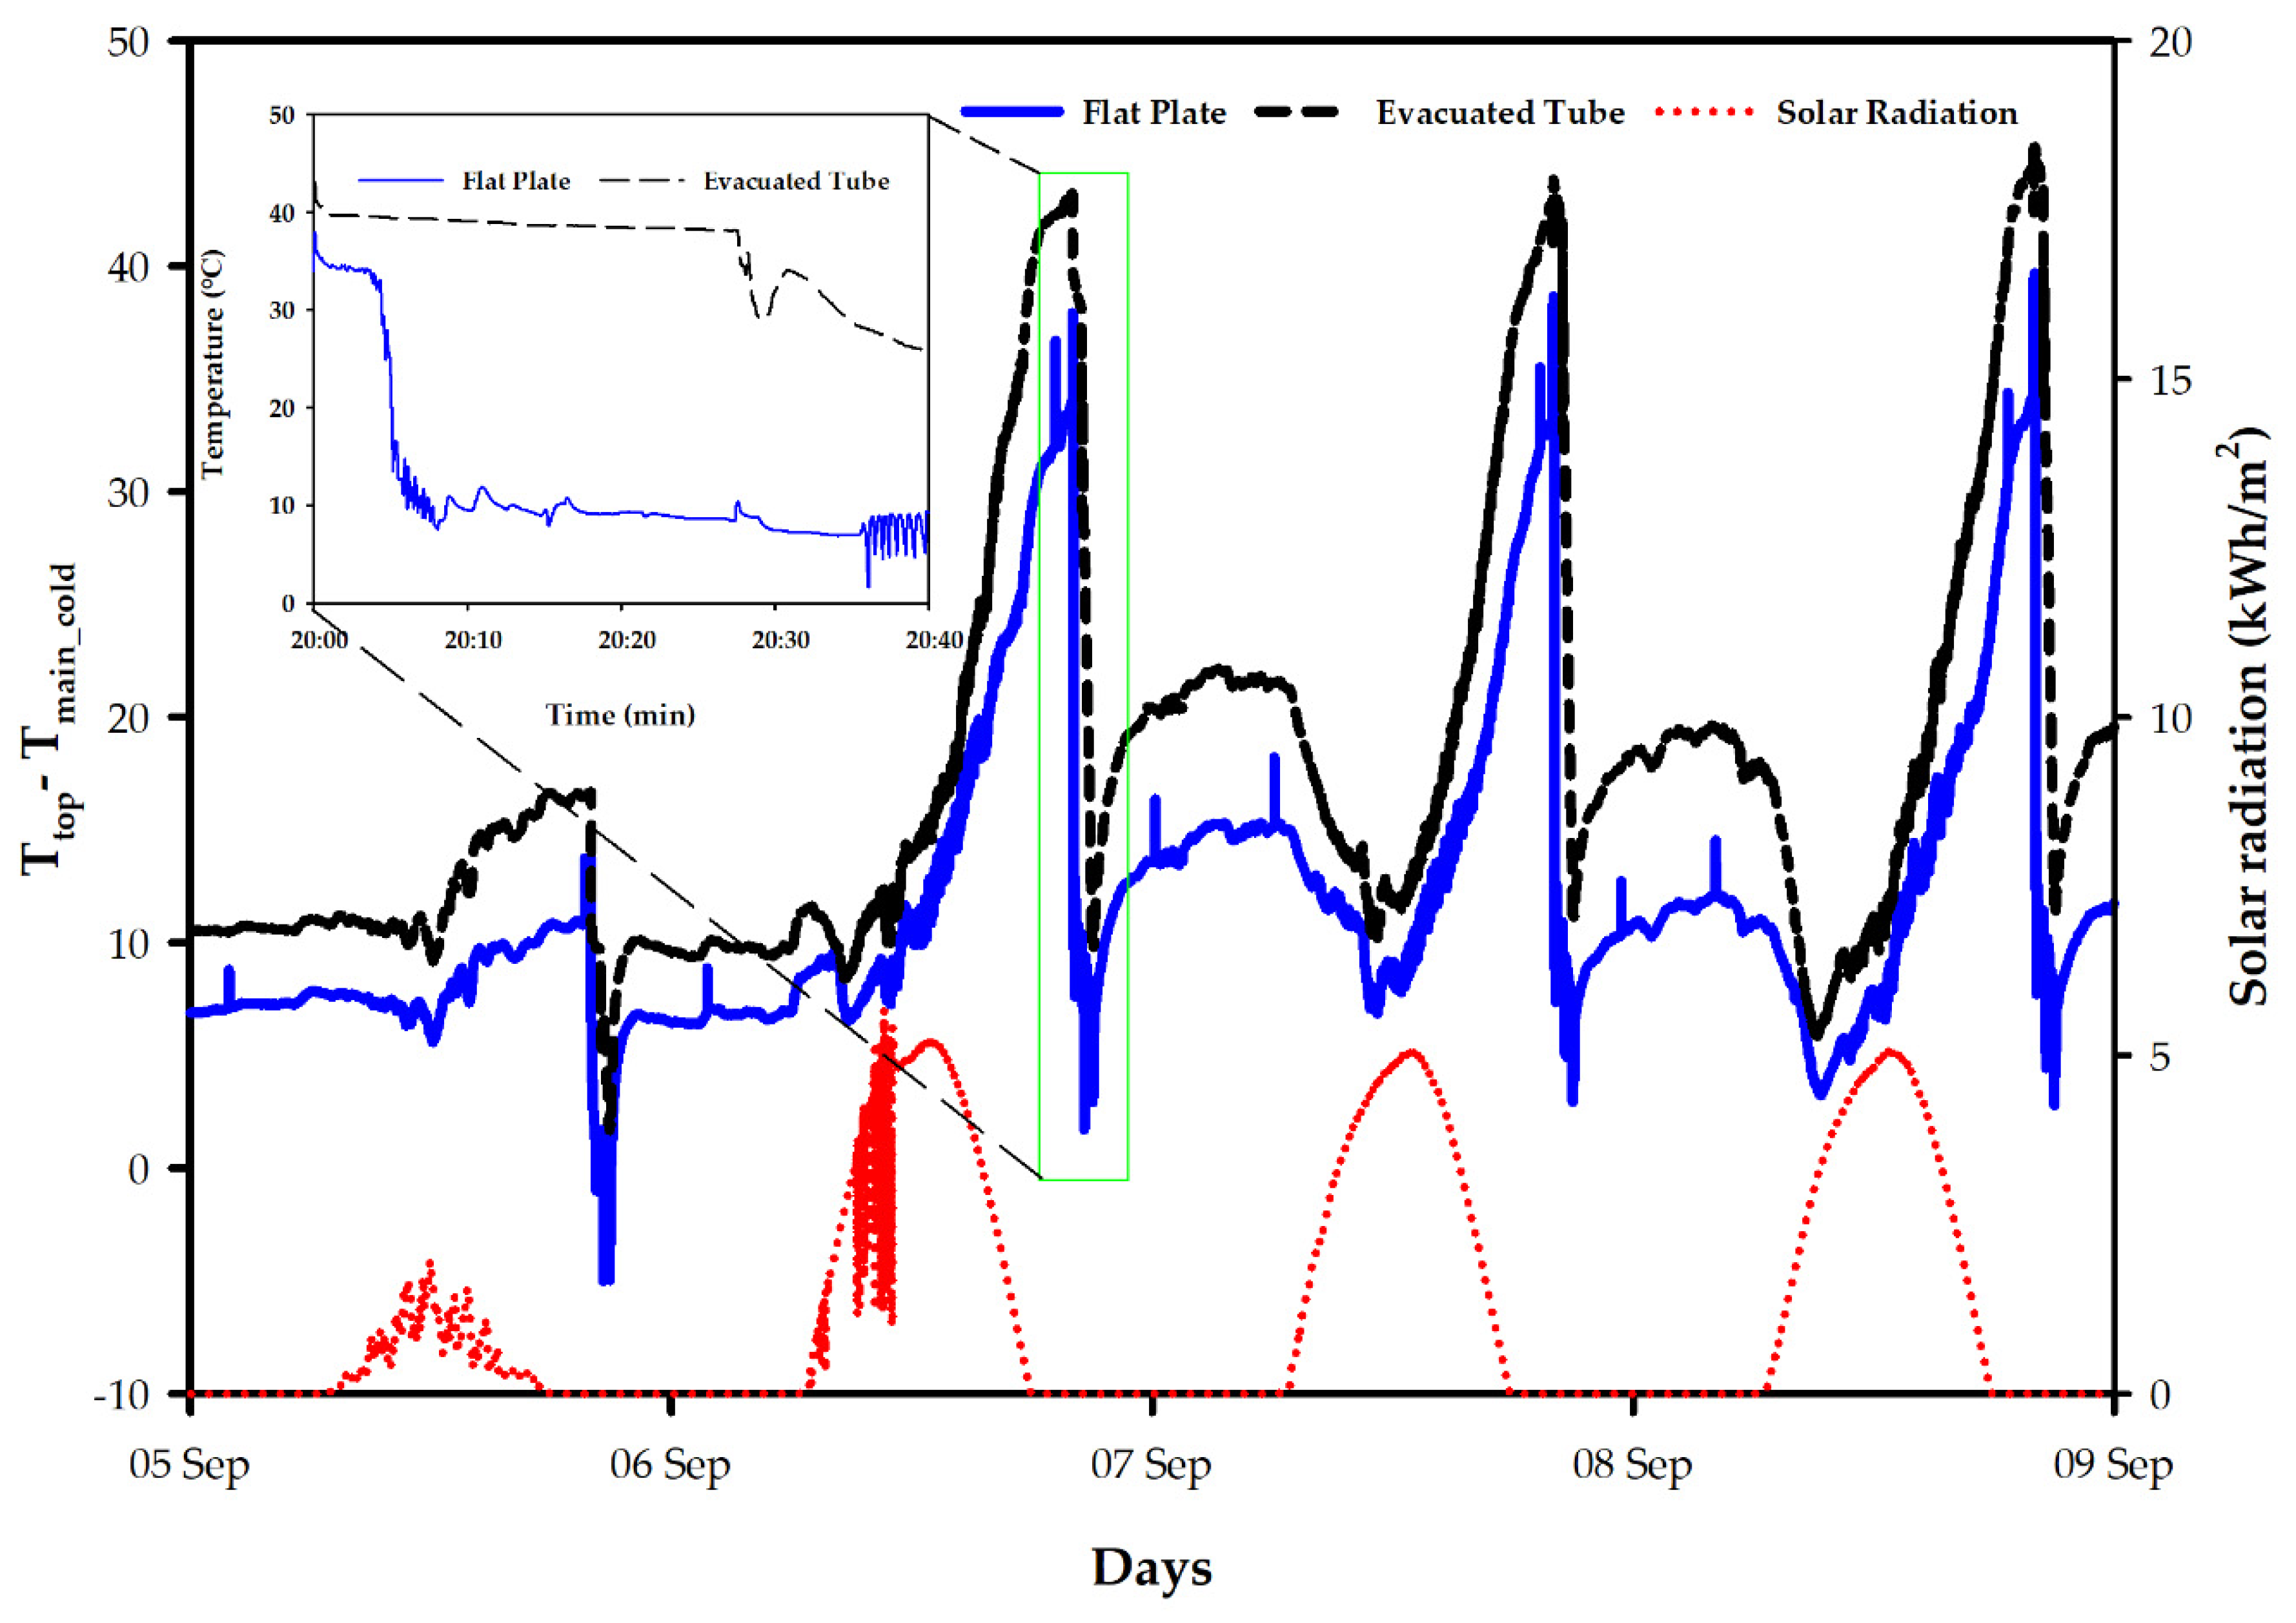
3.1. Overall System Behaviour over Four Days

The high- and low-pressure systems were observed over five days, characterised by clear and cloudy days. The irradiance and water temperature measurements obtained for the days under review are presented in Figure 5.
The results also revealed that the optimum hot water produced is after midday (13:00–17:00) and is similar to the results obtained by Wei et al. [10]. This trend is no different from most renewable energy technologies, whose performance is dependent on the available solar irradiation seen in Figure 5. To simulate a daily usage profile based on rural electricity usage in a typical domestic setting, the water from the FP and ET solar water heater’s storage tank was drained simultaneously into a 500 L storage tank. The results revealed that a maximum of 24.84 °C and 28.32 °C was obtained for the FP and ET systems on a cloudy day. A maximum of 62.77 °C and 69.63 °C was recorded for the FP and ET systems on a clear day. The global solar radiation obtained for the clear and cloudy days was 5.07 and 2.00 kWh/m2, respectively. The results are comparable with those obtained by Apeh et al. [24]. Their work shows that on a clear and cloudy day, the global solar radiation was 5.91 and 3.38 kWh/m2, respectively. The difference in temperature between cold water from the mains and the hot water produced by the collectors is presented in Figure 6.
Hohne et al. [35] suggest that the temperature difference between the water flowing into and out of the collector can be analysed using Equation (1).
T g e y s e r _ o u t T m a i n _ c o l d = [ A g ( F R ( τ α ) G t h ) m c c + A c F R U L ]
where T g e y s e r _ o u t is water temperature out of the collector into the storage tank (°C), T m a i n _ c o l d is the water from the mains into the collector (°C), A g is the area of the geyser (m2), F R is the heat removal factor of the collector, τ α is the absorbance transmittance product, G is the irradiance absorbed by the collector (W/m2), t h is the time (s), m c is the flow rate of water inside the collector (kg/h), c is the specific heat capacity of water (J/kg/°C) and U L is the total heat transfer coefficient of the collector (W/m2. °C).
The FP and ET solar water heater systems were drained at 20:00 daily (highlighted in green) to allow the cold water from the mains into the system, as shown in Figure 6. The daily electricity usage profile informs the decision to drain both systems at 20:00. The inset (highlighted area) presented in Figure 6 shows a decline in the water temperature for both systems. This is due to the difference in density between the cold and hot water in the geyser and the location of the outlet. Therefore, the hottest water is drained first, then the cold water. The heat gained by the systems for the period under study seen in Figure 7 was determined using Equation (2).
Q c o l l = m c Δ T
where Q c o l l is the heat gain (J), m is the mass of water (kg), cp is the specific heat capacity of water, Δ T   ( T o u t T i n ) is the change in water temperature (°C).
Figure 7 shows the heat gained by the high- and low-pressure systems for four days and comprises varying sky conditions. We assume that the conductive, convective and radiative losses are negligible. The heat gained by FP and ET systems on a cloudy day is 9 MJ and 8 MJ, respectively. While on a clear day, the FP and ET systems gained 26 MJ and 21 MJ, respectively. These values compare with the research carried out by Morrison et al. [36]. In their work, under varying solar irradiation with the solar water heater systems mounted on a plane inclined at 45°, they obtained a maximum of 26 MJ/day.

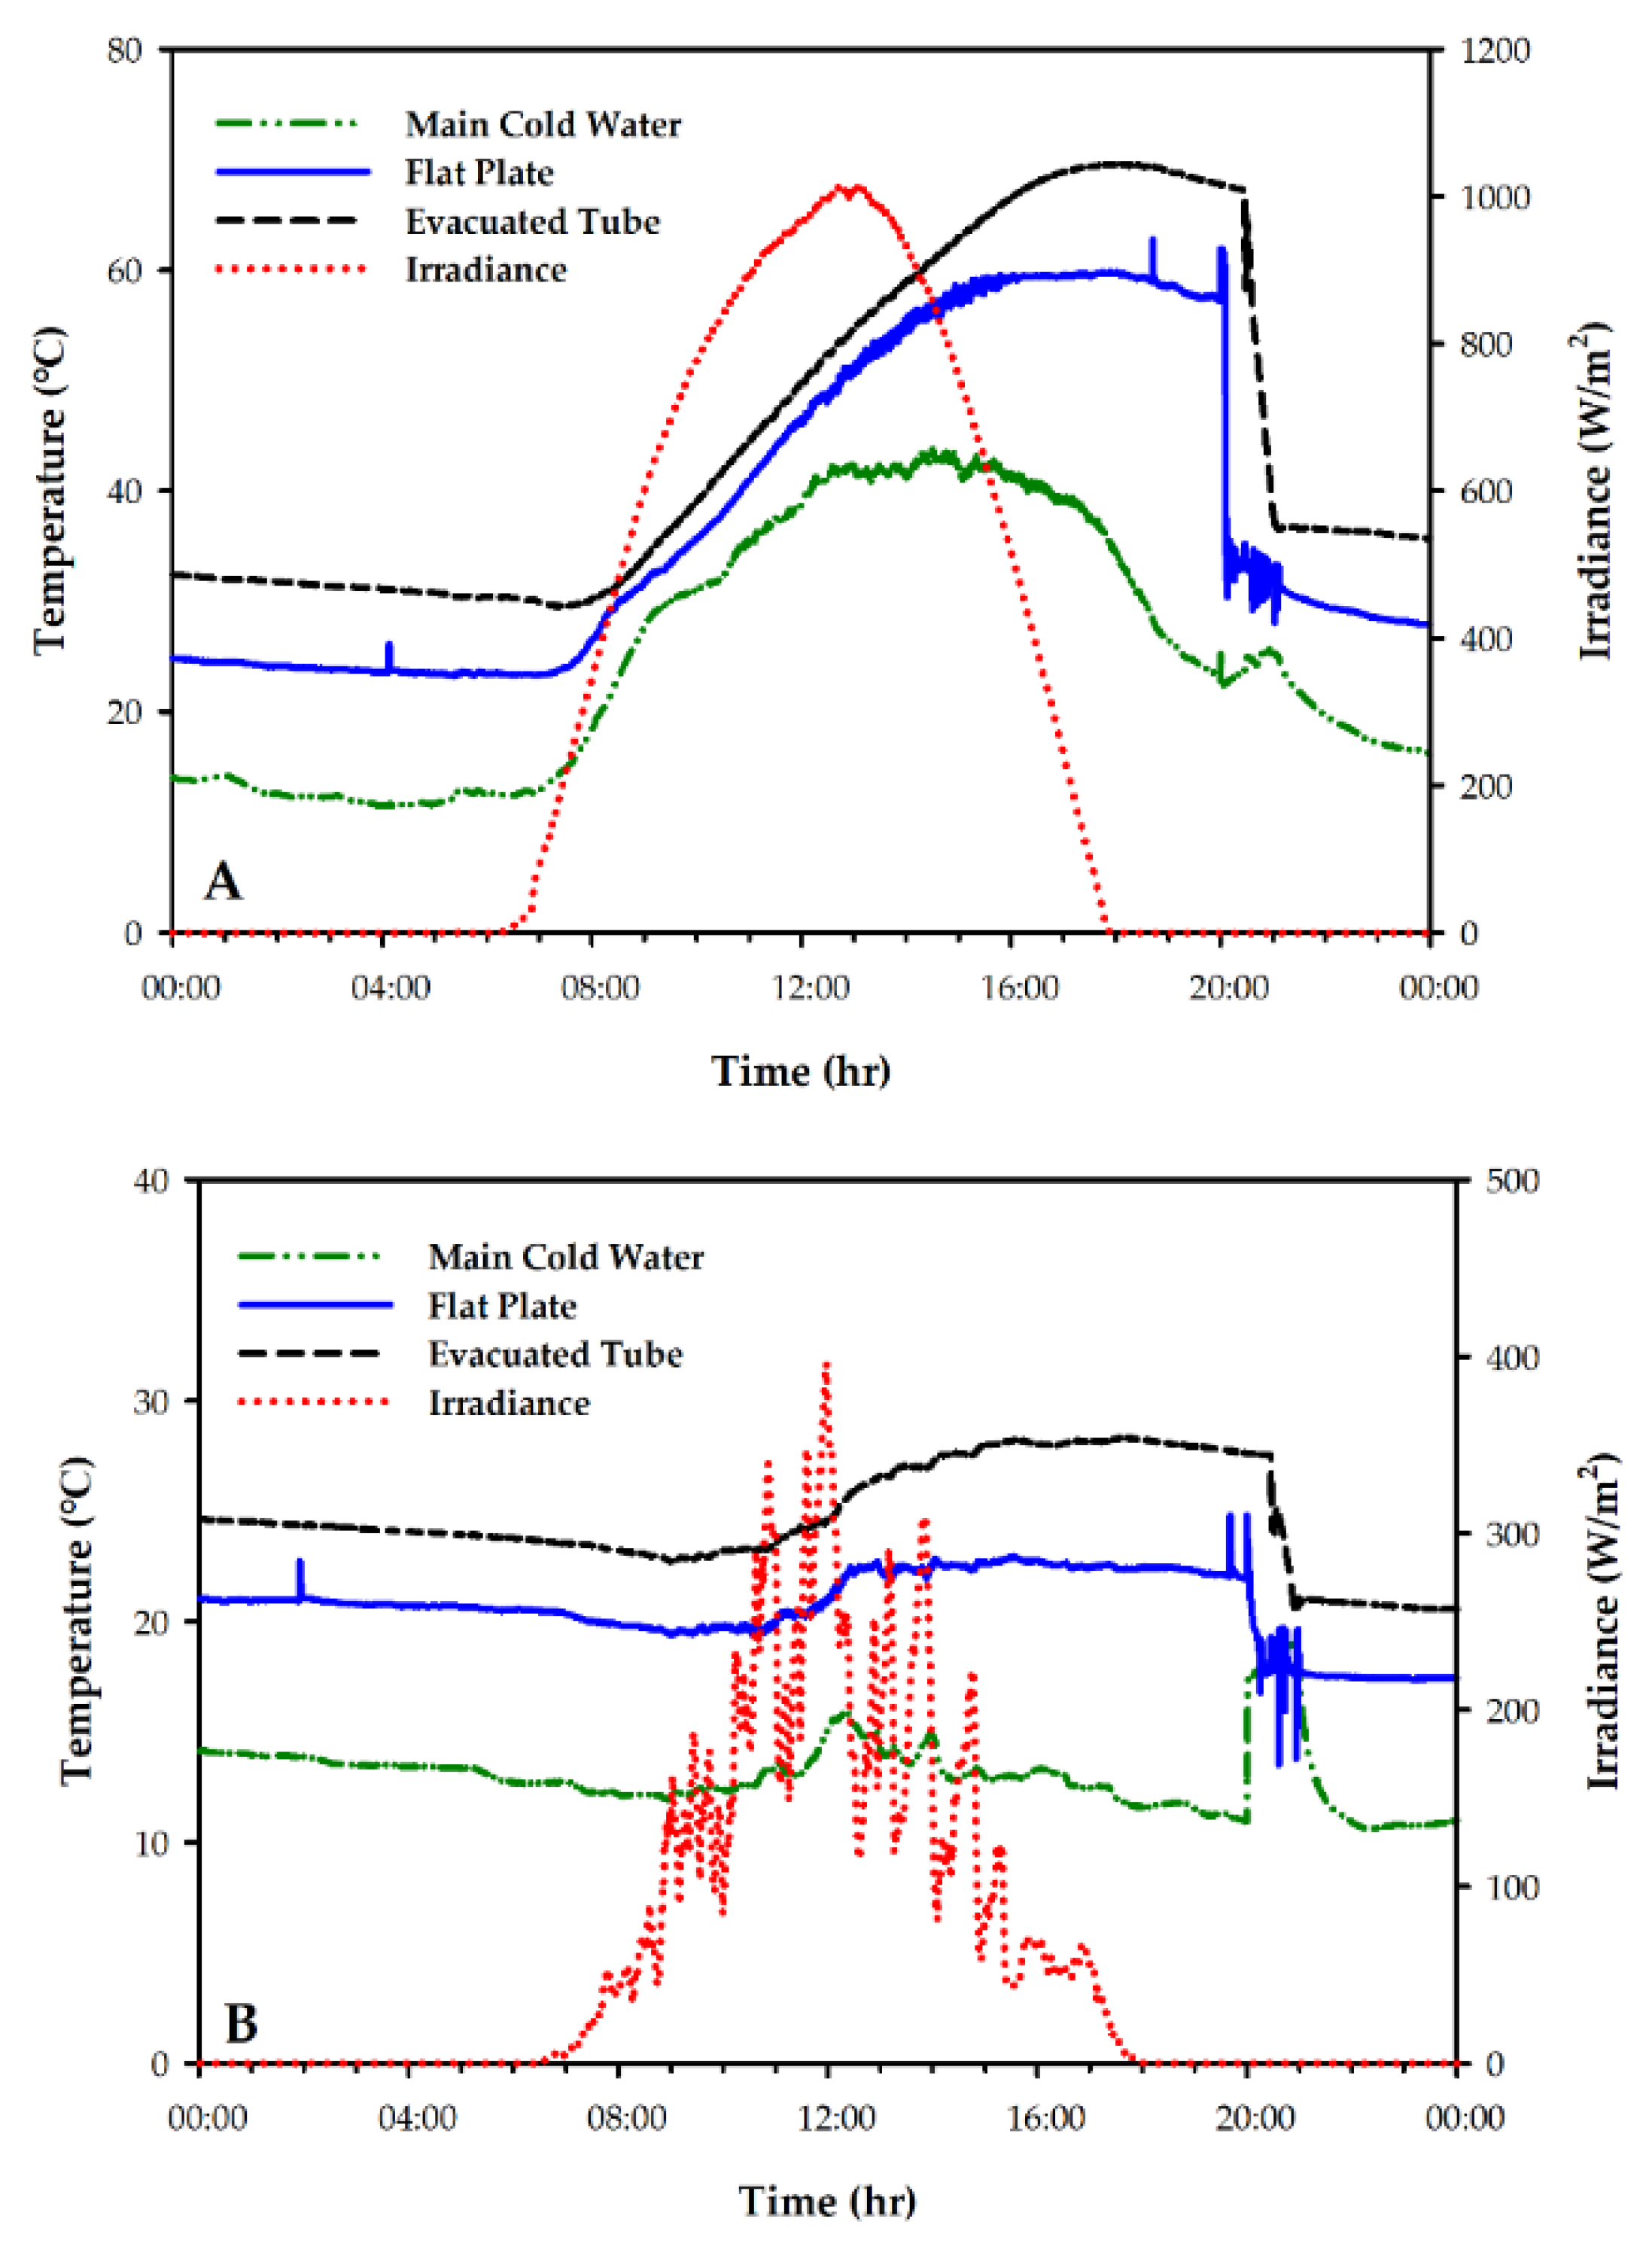
3.2. System Behaviour on a Clear and Cloudy Day

The best- and worst-case scenarios were selected according to the maximum and minimum solar irradiance obtained and are presented in Figure 8. A day characterised with no clouds obstructing the sun’s path, with a maximum solar irradiance of about 1050 W/m2, was selected as a clear day. Moreover, a day with about 400 W/m2 solar irradiance peak was chosen as a cloudy day.
The temperature sensors’ response at various points of the FP and ET systems to irradiance is presented in Figure 8. The results show that irradiance plays a vital role in the performance of both systems. Due to the nature of the evacuated tube SWH, thermocouples could only be fitted at the storage tank’s top and outlet to have a clearer view of the system’s response to varying irradiance and ambient temperature over 24 h. Figure 9 presents the hot water produced by both systems on a clear and cloudy day.
Figure 9A shows that a maximum irradiance of 1050 W/m2 was obtained on a clear day and corresponds to a hot water temperature of 58 °C and 65 °C for the FP and ET, respectively. However, on a cloudy day (Figure 9B) with 400 W/m2, the highest water temperature obtained corresponds to 22 °C and 29 °C for the FP and ET, respectively. The results clearly show that both systems can provide hot water without an auxiliary heat source from 09:00–00:00. However, both of the systems’ hot water generation depends on the intensity of the available incident irradiation.

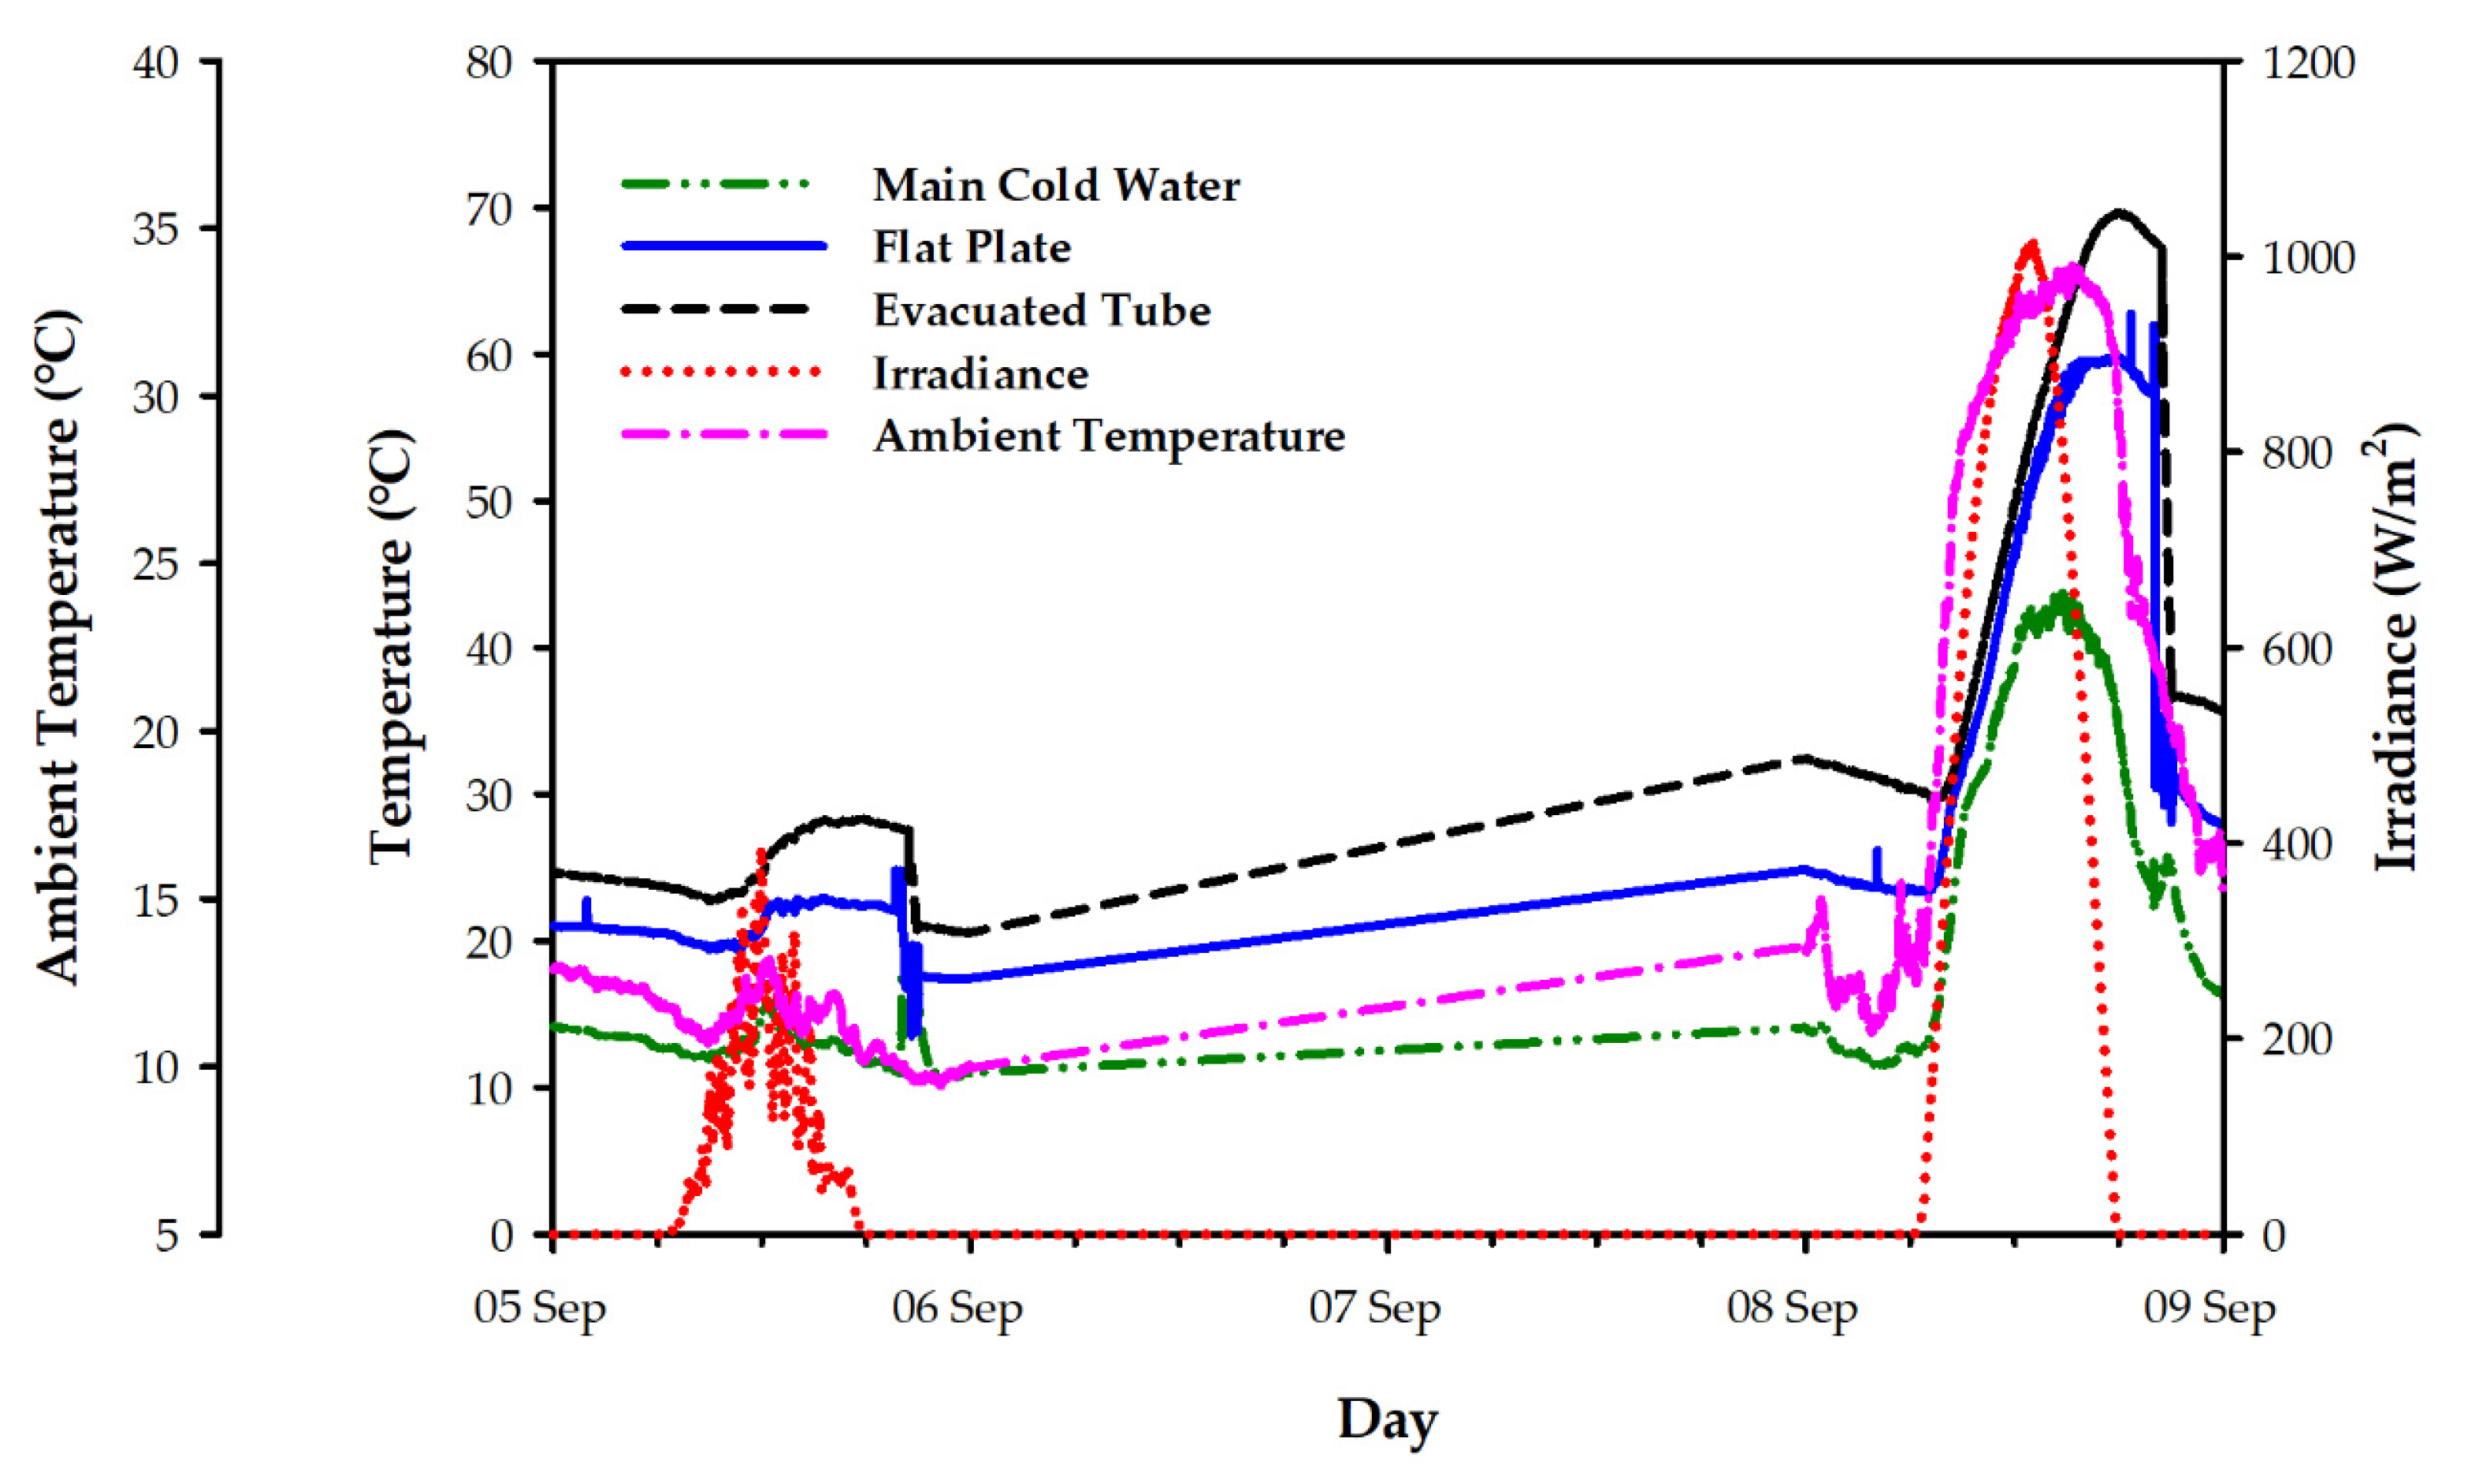
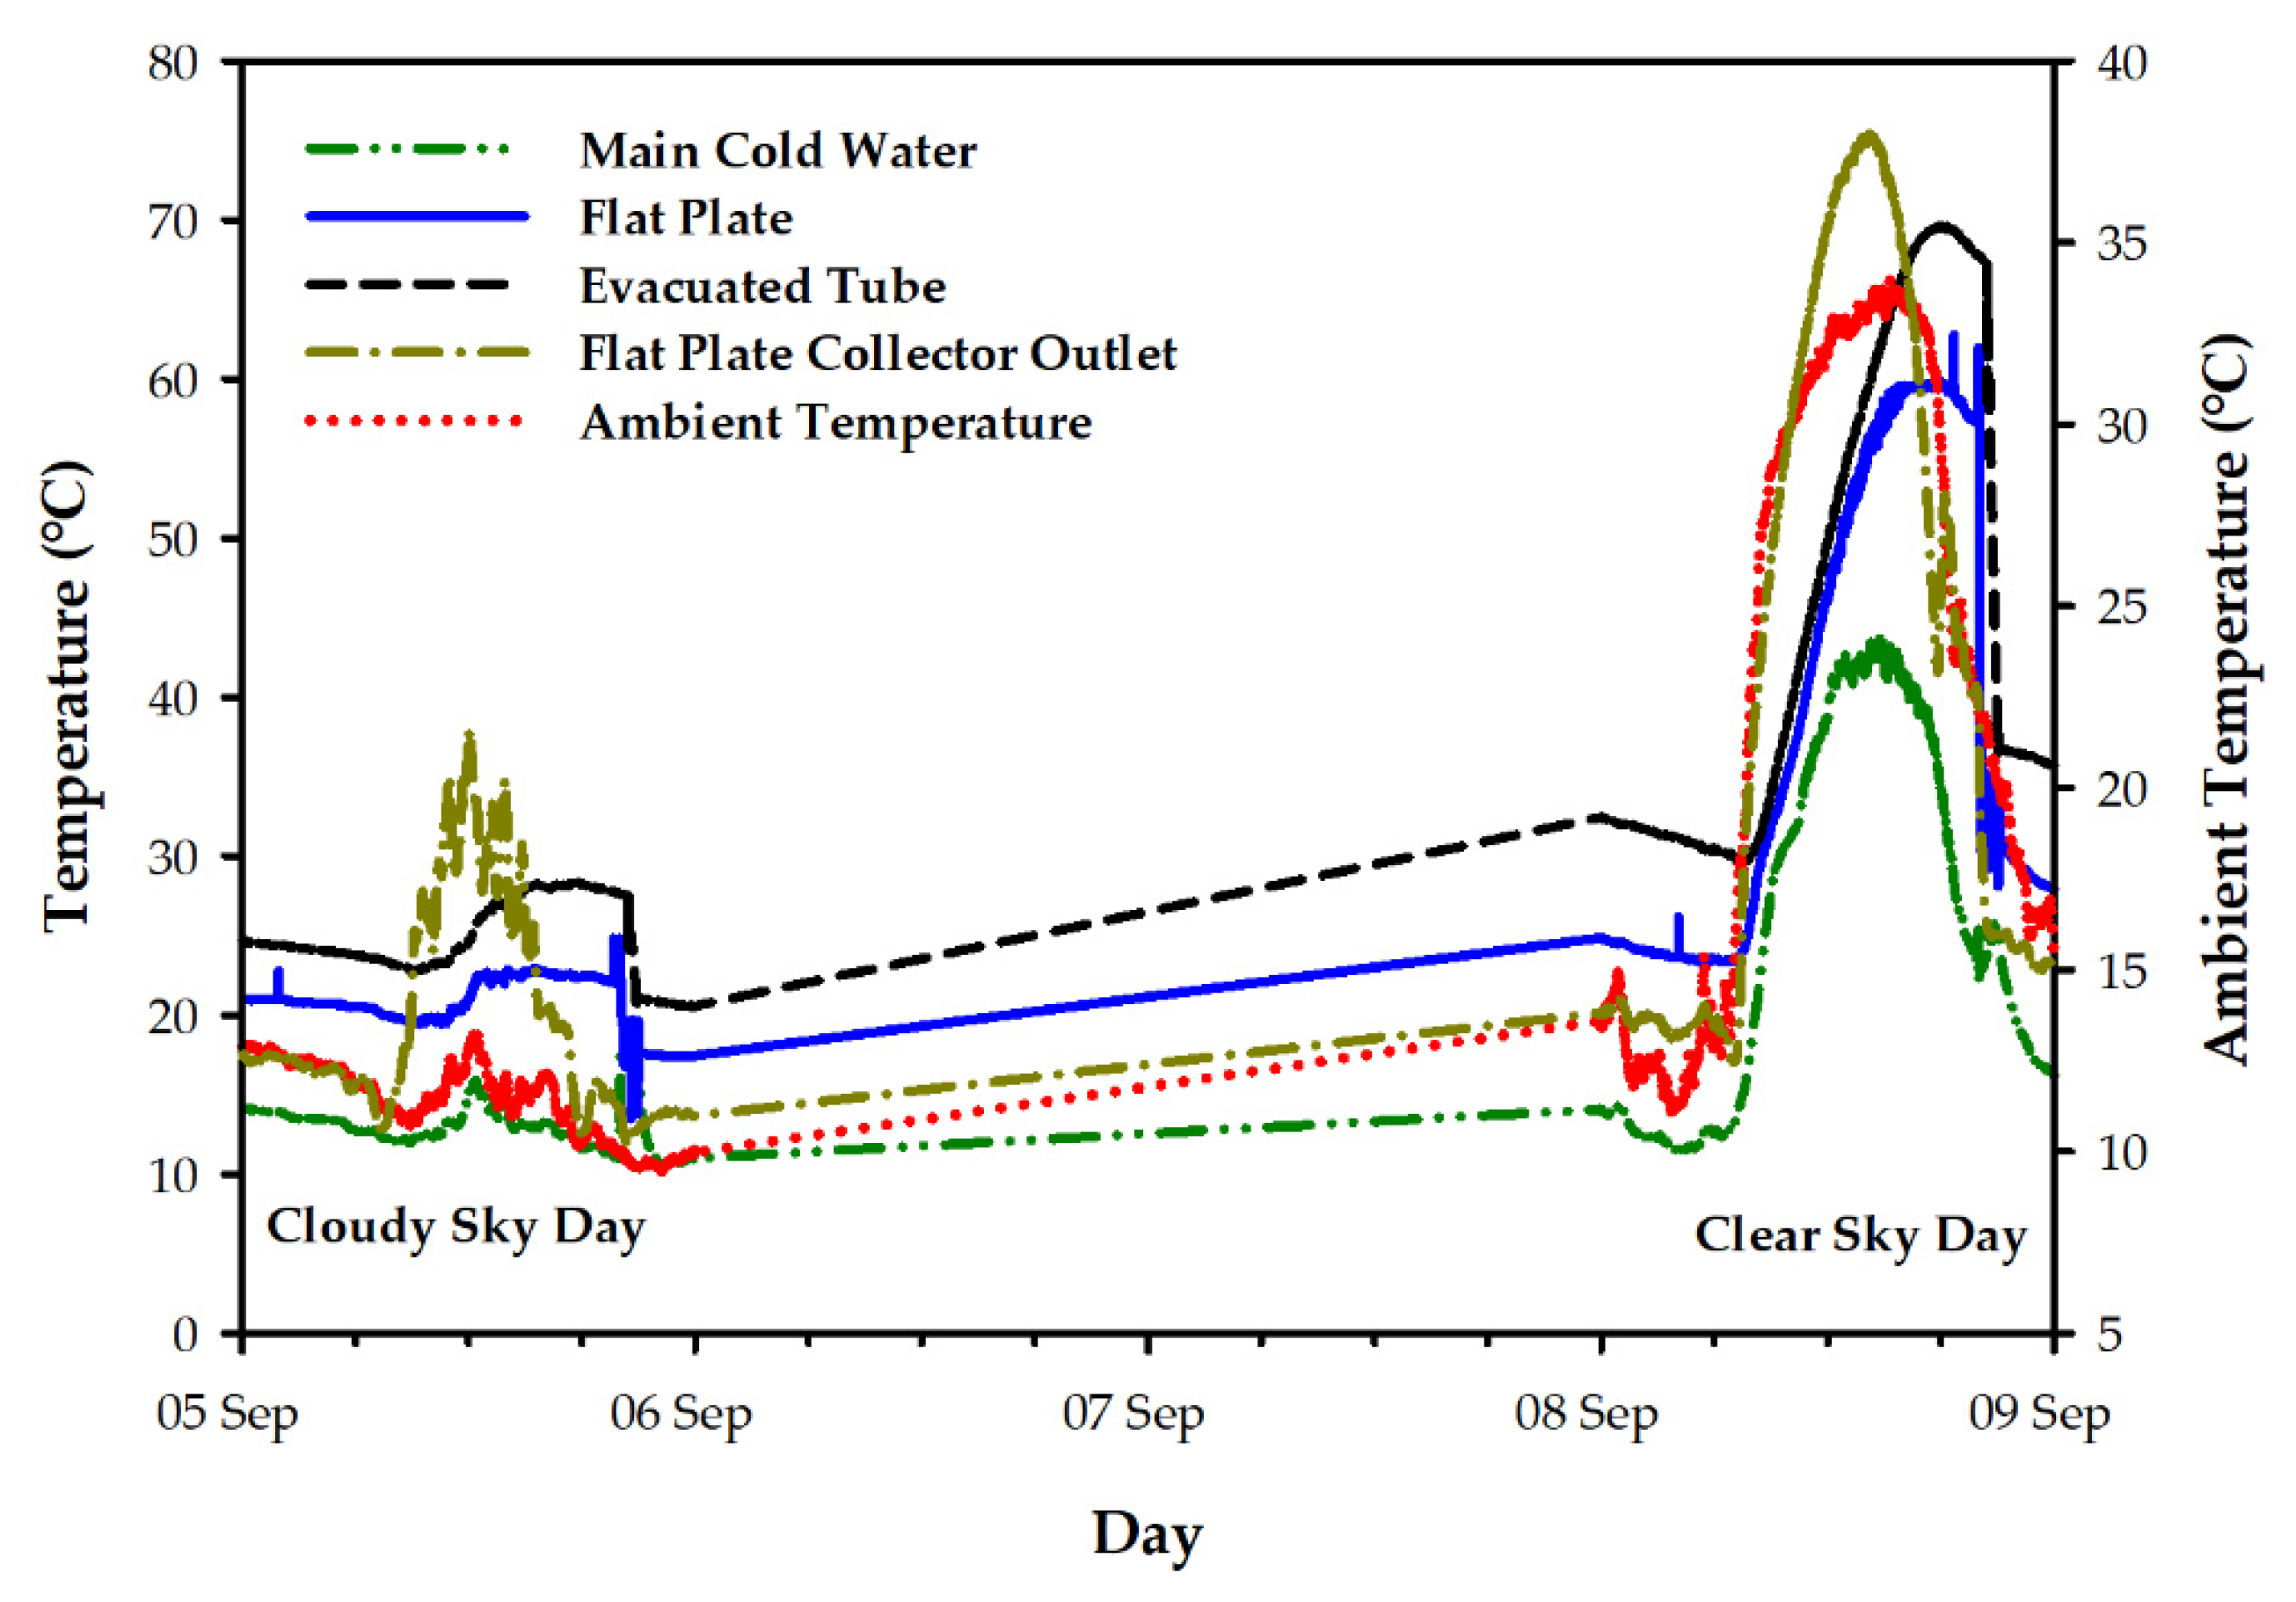
3.3. Effect of Ambient Temperature on Solar Water Heater Systems

The FP and ET solar water heater systems’ performance in response to ambient temperature is presented in Figure 10.
The experimental investigation by Zhao et al. and Chaabane et al. [37,38] shows that ambient temperature plays a vital role in determining the thermal efficiency of a solar water heating system. In Figure 10, it can be seen that the ambient temperature affects all the parts of the SWH systems. The external pipings used for both systems were not lagged. Hence, the difference in the inlet temperature at midday. The highest and lowest ambient temperatures recorded were 22 °C and 11 °C, respectively, and corresponded with a hot water temperature of 70 °C and 15 °C for the FP solar water heater. The hot water produced under the same ambient temperature for the ET system is 63 °C and 20.5 °C, respectively. The effect of ambient temperature on a clear and cloudy day is presented in Figure 11.
Figure 11 shows the effect of ambient temperature at the top of the storage tanks for FP and ET solar water heater systems. The difference between the inlet and outlet was calculated to obtain the actual hot water produced by both systems. This was done by subtracting the measured water into the collector and the geyser topwater temperature of the FP and ET systems. To compare the performance of the FP and ET systems on a cloudy and clear day, Figure 11 was normalised and is presented in Figure 12.
The results obtained by Atia et al. [39] show that solar water heater systems’ performance is affected by irradiance and ambient temperature. Their findings correspond with Figure 12, where ambient temperature and irradiance influence both of the systems’ behaviours. Interestingly, the high-pressure and low-pressure collectors’ water temperature follows a similar pattern to the ambient temperature in Figure 12. Based on the hot water produced by both systems, the percentage difference between the FP and ET systems is 14%. Martínez-Rodríguez et al. [40], in their work, show that the evacuated tube system (ET) is more thermally efficient than the flat plate solar water heating system. However, unlike the FP system, the ET systems are easily susceptible to damage from hailstones or manhandling during installation. The high cost of the ET system is another limiting factor to its widespread use despite its advantages over the FP system.
Equation (3) was used to calculate the efficiencies of the FP and ET systems on a clear and cloudy day.
η = Q c o l l A c G
where η is the systems’ efficiency (%), Q c o l l is the collector’s heat gain (J) and is expressed in Equation (3), A c is the area of the collector (m2) and G t is the incident irradiance on the collector (W/m2).
The results from the calculation show that FP’s efficiency is 73% on a cloudy day while the ET’s is 84%. Conversely, the FP and ET’s efficiencies were 66% and 75% on a cloudy day, respectively. These results, compared with those obtained by Hills-Solar [41], investigated the efficiencies of a flat plate and evacuated tube solar water heating systems in four major Australian cities. In their work, the efficiency of the flat plate was 68%, while the evacuated tube had an efficiency of 89%.

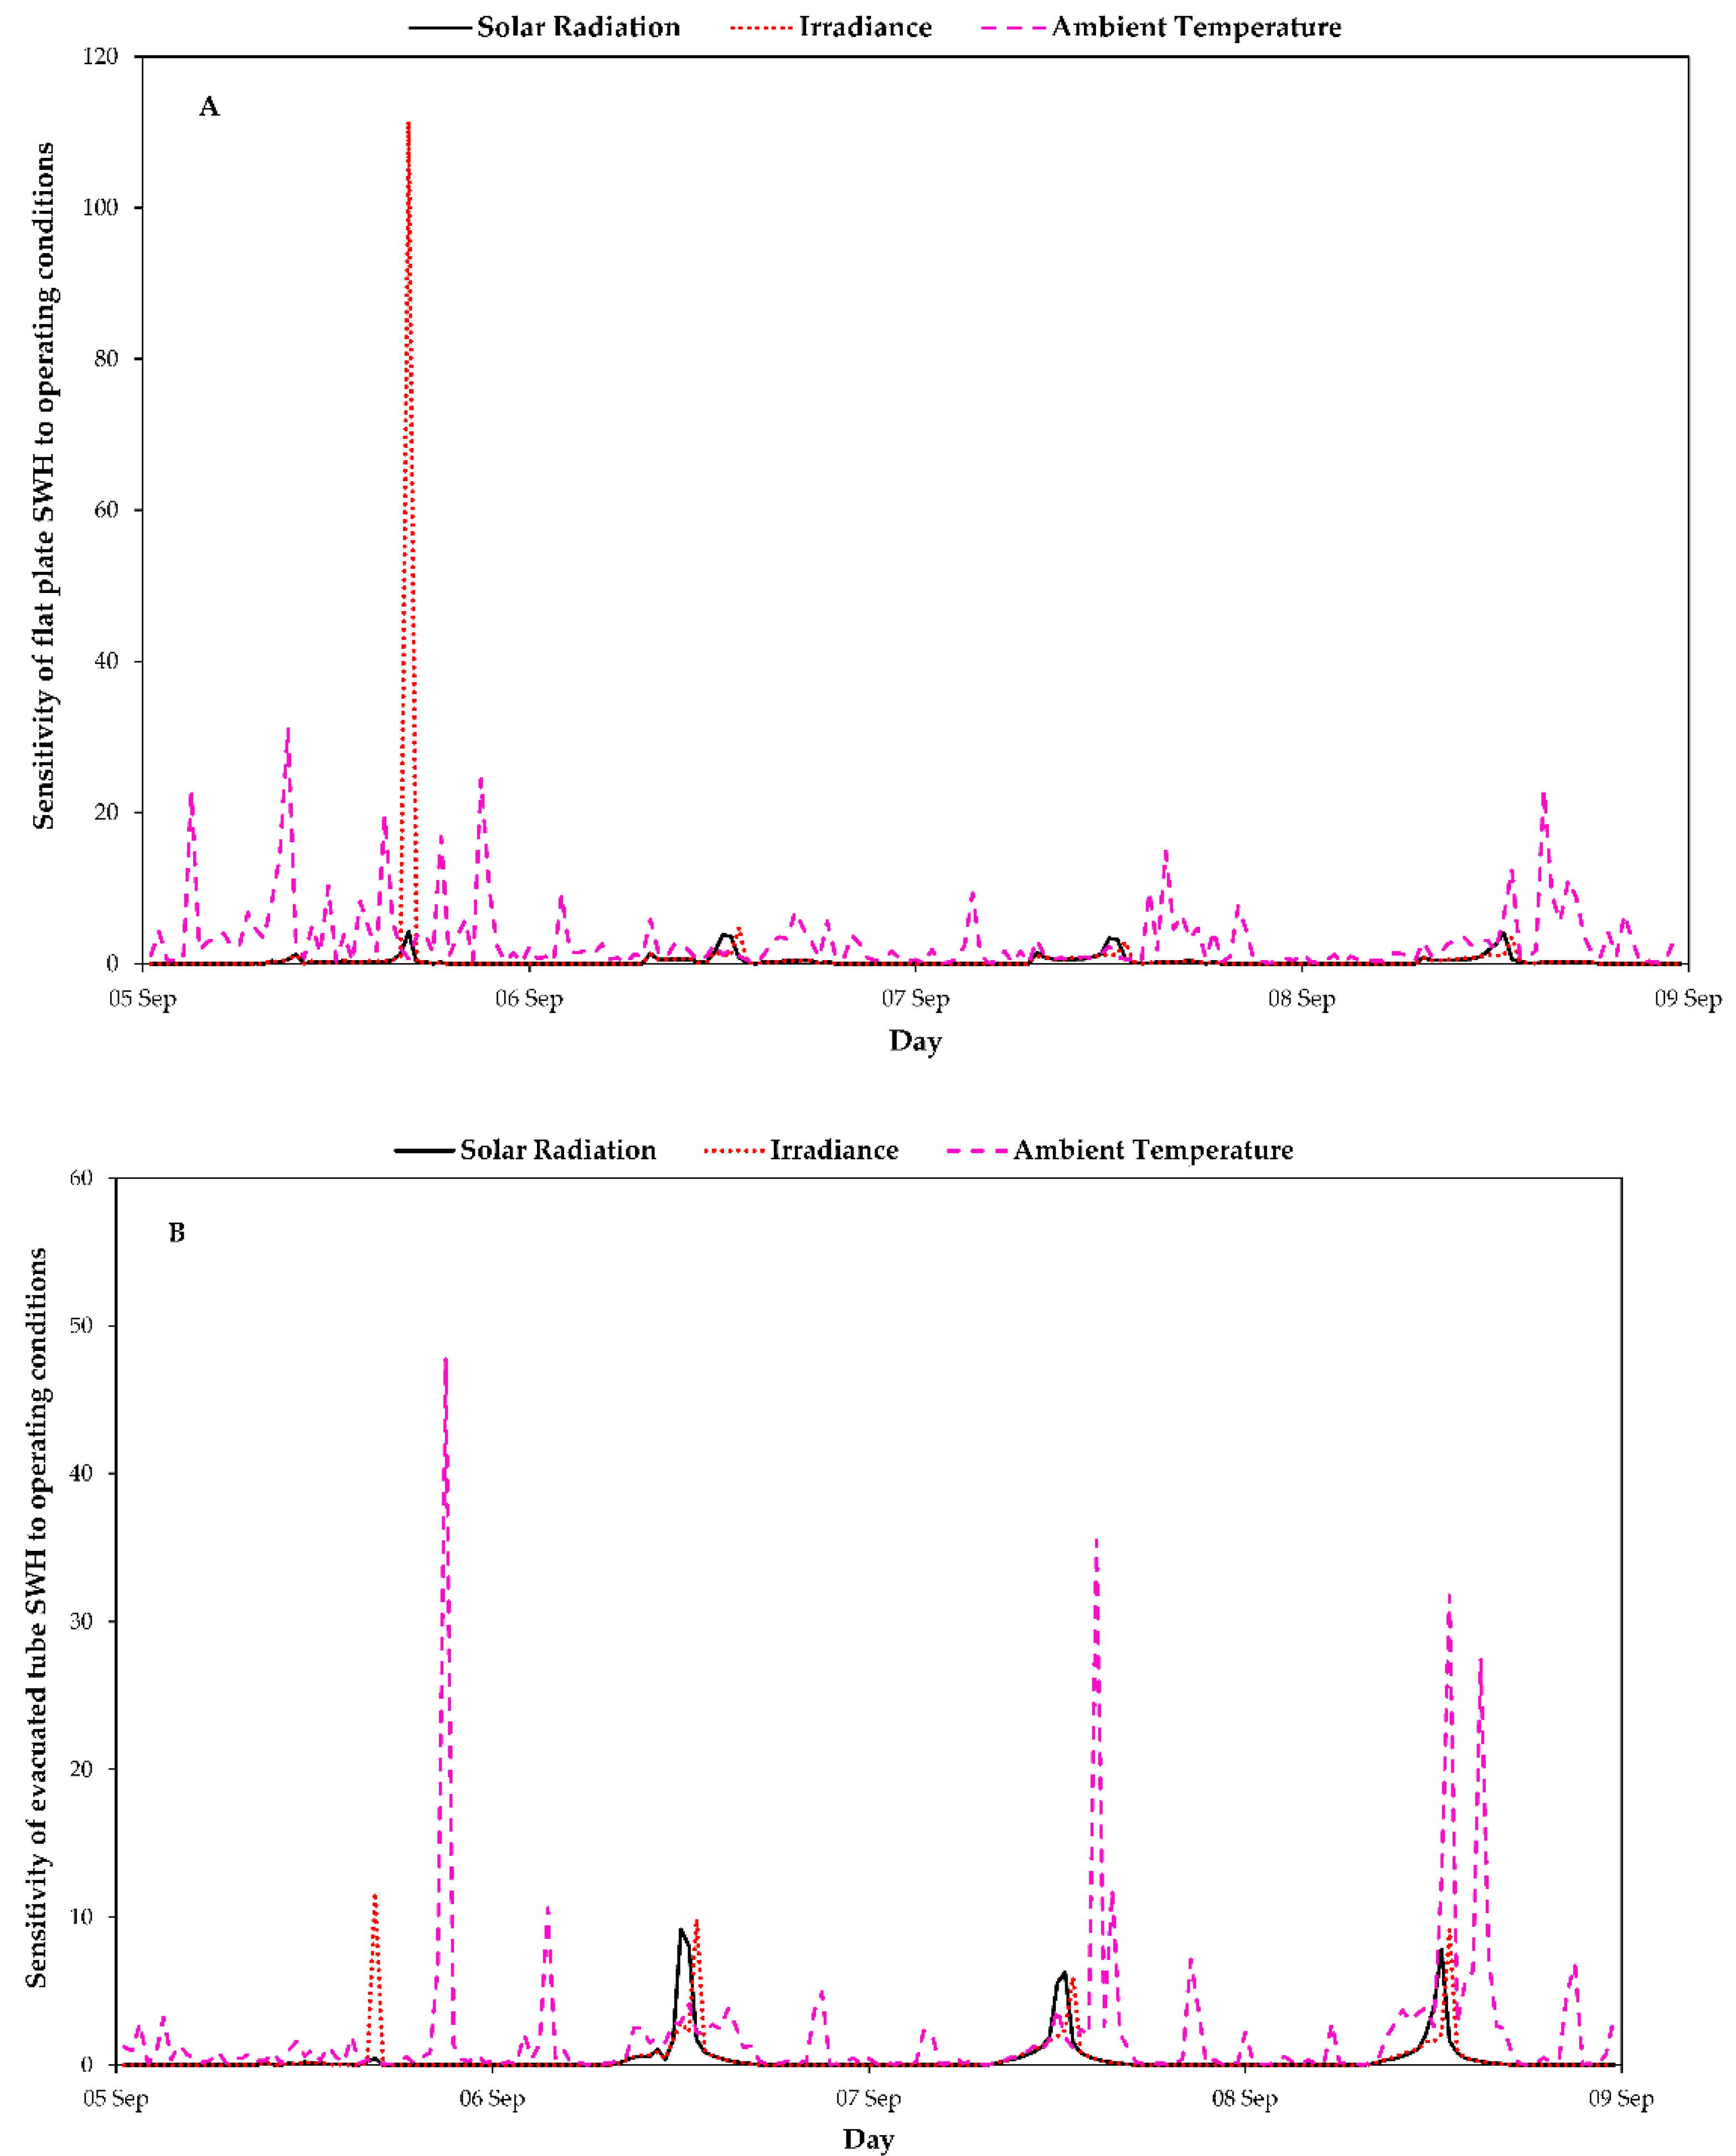
3.4. Sensitivity Analysis of Hot Water Production

As mentioned earlier, all of the parameters were measured at five-second intervals. The sensitivity analysis presented in Figure 13A for FP and Figure 13B for ET was averaged at 30 min intervals. Figure 13A,B shows how uncertainties in the measured parameters influence the total uncertainty in hot water produced by the FP and ET solar water heaters.
The sensitivities presented in Figure 13A show that flat plate SWH is very sensitive to change in irradiance while the evacuated tube is mainly sensitive to ambient temperature. The test clearly shows that the evacuated tube SWH outperforms flat plate SWH in low irradiance conditions, as affirmed by the results in Figure 10. Hence, the ET solar water heating system is recommended over the FP system in areas with mean low annual temperatures.

3.5. Cost and Payback Period

The current average cost of a flat plate and evacuated tube solar water heating system is USD 1118.73 (ZAR 16230.00) and USD 1051.18 (ZAR 15249.99), respectively. The payback period is determined assuming there is no inflation and electricity tariff remains constant (USD 0.144). This payback period, usually in years, is the time taken to recover the capital. Hence, the cost analysis will compare the cost-saving of using FP and ET solar water heaters over electric geysers. The current average daily electricity use by households is about 30 kWh. Refer to Table 1 for the specifications of the SWH systems. The payback period is determined using Equation (4), and the results are presented in Table 3.
Payback   Period = Capita   Investment Annual   Saving
where
Annual   Saving = 365   ( C E × Q l o a d )
Q l o a d = W q C p ( Δ T )
Δ T = T o u t T i n
where Q l o a d is the electricity used (kWh/day), W q daily water usage (L), C E electricity cost per (kWh).
The payback period for the flat plate and evacuated tube systems did not consider the cost of installation. However, the payback period for flat plate SWH is 8 months less than the evacuated tube because it is cheaper than the FP system. The capacity and area of both SWH systems (see Table 1) also played a significant role as both of the systems did not deliver an equal quantity of water. Hence, the FP had a higher annual saving when compared to the ET system. These results compare with those obtained by Nshimyumuremyi and Junqi [42]. The authors used a flat plate solar water system with dual collectors, hence a payback period of 2 years. The authors also revealed that the design considerations for the collector are an essential factor that influences the payback period.

4. Conclusions

This study presented the relevance of evaluating the performance of flat plate and evacuated tube solar water heating systems and their usage profiles. The results over five days, characterised by varying sky conditions, reveal that the available insolation greatly influenced FP and ET systems’ performance. A typical clear day with a maximum irradiance of 1050 W/m2 produced 62.77 °C and 69.63 °C hot water for the FP and ET systems, respectively. However, a cloudy day with a maximum of 400 W/m2 irradiance corresponds to 24.84 °C and 28.32 °C of hot water produced for the FP and ET, respectively. Further results reveal that the FP and ET systems’ efficiencies on a clear day were 73% and 84%, respectively. However, FP had an efficiency of 66% on a cloudy day, while the ET’s efficiency was 75%. Furthermore, the hot water usage profile conducted on both systems shows that their performance on a clear and cloudy day can adequately provide hot water for the domestic sector.
Sensitivity analyses on the hot water production by both of the systems show that the FP is more sensitive to irradiance while the ET is more sensitive to ambient temperature. Additionally, a cost and payback period carried out revealed that the payback periods for the FP and ET are 3 and 3.8 years, respectively. The research demonstrates that solar water heating systems are viable and that the failures encountered in the mass installation were due to inexperienced installers. Hence, the widespread adoption of these technologies in South Africa will ensure a greener future as well as reduce the demand on the strained national utility.

Author Contributions

Conceptualisation, E.L.M., O.K.O. and J.C.N.; methodology, J.C.N.; software, J.C.N.; validation, E.L.M. and O.K.O.; formal analysis, J.C.N.; investigation, J.C.N.; resources, E.L.M.; data curation, J.C.N.; writing—original draft preparation, J.C.N.; writing—review and editing, E.L.M. and O.K.O.; visualisation, J.C.N.; supervision, E.L.M. and O.K.O.; project administration, E.L.M.; funding acquisition, E.L.M. All authors have read and agreed to the published version of the manuscript.

Funding

The authors appreciate the financial support from the following sponsors: South African National Research Foundation (NRF) grant number 129641, Department of Science & Technology (DST), Eskom tertiary education support (TESP) and Govan Mbeki Research & Development Centre (GMRDC) of the University of Fort Hare.

Institutional Review Board Statement

Not applicable.

Informed Consent Statement

Not applicable.

Data Availability Statement

The data used in the study can be provided upon request by contacting the corresponding author [email protected].

Acknowledgments

The authors acknowledge the financial support of the South African National Research Foundation (NRF), Department of Science & Technology (DST), Eskom tertiary education support (TESP) and Govan Mbeki Research & Development Centre (GMRDC) of the University of Fort Hare. We also acknowledge the valuable discussions with Olayiwola Olufemi during the internal review of this research article.

Conflicts of Interest

The authors declare no conflict of interest. The funders had no role in the study’s design; in the collection, analyses or interpretation of data; in the writing of the manuscript or in the decision to publish the results.

Abbreviation

Nomenclature
Abbreviation
SWHSolar water heaters
GHIGlobal horizontal irradiation
HPHigh-pressure
LPLow-pressure
DACData acquisition and control
SCADASupervisory control and data acquisition
FPFlat Plate
ETEvacuated Tube
Symbols
Q c o l l Heat gained by the collector (J)
A c Area of the collector (m2)
G Incident irradiance on the collector (W/m2)
T g e y s e r _ o u t Water temperature out of the collector into the storage tank (°C)
T m a i n _ c o l d Water from the mains into the collector (°C)
A g Area of the geyser (m2)
F R Heat removal factor of the collector
τ α Absorbance transmittance product
t ( h ) Time (s)
m c Flow rate of water inside the collector (kg/h)
c Specific heat capacity of water (J/kg/°C)
U L Total heat transfer coefficient of the collector (W/m2.°C)
η Systems efficiency (%)
Q l o a d Average electricity use per household (kWh/day)
W q Daily water usage (L)
C E Electricity cost (kWh)

References

  1. Sims, R. Renewables for Heating and Cooling: Untapped Potential; International Energy Agency: Paris, France, 2007; pp. 1–210. [Google Scholar]
  2. Peter, C.; Marilyn, S. Technology Roadmap: Solar Heating and Cooling; International Energy Agency: Paris, France, 2012; pp. 1–50. [Google Scholar] [CrossRef]
  3. Buckley, A. Policy Brief: Solar Water Heating Technologies; Center for Renewable & Sustainable Energy Studies: Stellenbosch, South Africa, 2019; pp. 1–35. [Google Scholar]
  4. Ali-Waeli, A.H.A.; Sopian, K.; Kazem, H.A.; Chaichan, M.T. Photovoltaic/Thermal (PV/T) Systems: A review. Int. J. Comput. Appl. Sci. 2017, 2, 62–67. [Google Scholar] [CrossRef]
  5. Hirbodi, K.; Enjavi-Arsanjani, M.; Yaghoubi, M. Techno-economic assessment and environmental impact of concentrating solar power plants in Iran. Renew. Sustain. Energy Rev. 2020, 120, 109642. [Google Scholar] [CrossRef]
  6. Lim, Y.S.; Lo, C.K.; Kee, S.Y.; Ewe, H.T.; Faidz, A.R. Design and evaluation of passive concentrator and reflector systems for bifacial solar panel on a highly cloudy region—A case study in Malaysia. Renew. Energy 2014, 63, 415–425. [Google Scholar] [CrossRef]
  7. Oosthuizen, D.; Goosen, N.J.; Hess, S. Solar thermal process heat in fishmeal production: Prospects for two South African fishmeal factories. J. Clean. Prod. 2020, 253, 119818. [Google Scholar] [CrossRef]
  8. Endale, A. Analysis of status, potential and economic signi fi cance of solar water heating system in Ethiopia. Renew. Energy 2020, 132, 1167–1176. [Google Scholar] [CrossRef]
  9. Roberts, D.E.; Forbes, A. An analytical expression for the instantaneous efficiency of a flat plate solar water heater and the influence of absorber plate absorptance and emittance. Sol. Energy 2012, 86, 1416–1427. [Google Scholar] [CrossRef]
  10. Wei, L.; Yuan, D.; Tang, D.; Wu, B. A study on a flat-plate type of solar heat collector with an integrated heat pipe. Sol. Energy 2013, 97, 19–25. [Google Scholar] [CrossRef]
  11. Sathyamurthy, R.; El-Agouz, S.A.; Nagarajan, P.K.; Subramani, J.; Arunkumar, T.; Mageshbabu, D.; Madhu, B.; Bharathwaaj, R.; Prakash, N. A review of integrating solar collectors to solar still. Renew. Sustain. Energy Rev. 2017, 77, 1069–1097. [Google Scholar] [CrossRef]
  12. Abdullah, A.L.; Misha, S.; Tamaldin, N.; Rosli, M.A.M.; Sachit, F.A. Photovoltaic thermal/solar (PVT) collector (PVT) system based on fluid absorber design: A review. J. Adv. Res. Fluid Mech. Therm. Sci. 2018, 48, 196–208. [Google Scholar]
  13. Duffie, J.A.; Beckman, W.A.; Blair, N. Solar Engineering of Thermal Processes, Photovoltaics and Wind, 5th ed.; John Wiley & Sons, Inc.: Hoboken, NJ, USA, 2020; pp. 1–919. [Google Scholar] [CrossRef]
  14. Tanase, A.; Cheng, S.C.; Groeneveld, D.C.; Shan, J.Q. Diameter effect on critical heat flux. Nucl. Eng. Des. 2009, 239, 289–294. [Google Scholar] [CrossRef]
  15. Salgado-Conrado, L.; Lopez-Montelongo, A. Barriers and solutions of solar water heaters in Mexican household. Sol. Energy 2019, 188, 831–838. [Google Scholar] [CrossRef]
  16. Ratshomo, K.; Nembahe, R. 2018 South African Energy Sector Report. 2018. Available online: http://www.energy.gov.za (accessed on 7 April 2021).
  17. Thobejane, J.S.; Masekameni, D.M.; Rathebe, P.C.; Mgwambani, S.L. The effectiveness of solar water heating geysers in South Africa: A Review. In Proceedings of the 2019 International Conference on the Domestic Use of Energy (DUE), Wellington, South Africa, 25–27 March 2019; pp. 59–62. [Google Scholar]
  18. Netshiozwi, E.E. Causes of failure of the South African solar water heating programme and the forgone social benefits. Rev. Soc. Sci. 2019, 4, 1–15. [Google Scholar] [CrossRef]
  19. Saint Akadiri, S.; Bekun, F.V.; Taheri, E.; Akadiri, A.C. Carbon emissions, energy consumption and economic growth: A causality evidence. Int. J. Energy Technol. Policy 2019, 15, 320–336. [Google Scholar] [CrossRef]
  20. Department of Environmental Affairs and Tourism, a National Climate Change Response Strategy. 2004. Available online: http://unfccc.int/files/meetings/seminar/application/pdf/sem_sup3_south_africa.pdf (accessed on 9 April 2021).
  21. International Energy Agency. Energy Efficiency 2018-Analysis and Outlooks to 2040; OECD Publishing: Paris, France, 2018. [Google Scholar]
  22. Jain, S.; Jain, P.K. The rise of renewable energy implementation in South Africa. Energy Procedia 2017, 143, 721–726. [Google Scholar] [CrossRef]
  23. Meyer, E.L.; Overen, O.K. Towards a sustainable rural electrification scheme in South Africa: Analysis of the Status quo. Energy Rep. 2021, 7, 4273–4288. [Google Scholar] [CrossRef]
  24. Apeh, O.O.; Overen, O.K.; Meyer, E.L. Monthly, seasonal and yearly assessments of global solar radiation, clearness index and diffuse fractions in alice, South Africa. Sustainability 2021, 13, 2135. [Google Scholar] [CrossRef]
  25. Lizama-Tzec, F.I.; Herrera-Zamora, D.M.; Arés-Muzio, O.; Gómez-Espinoza, V.H.; Santos-González, I.; Cetina-Dorantes, M.; Vega-Poot, A.G.; García-Valladares, O.; Oskam, G. Electrodeposition of selective coatings based on black nickel for flat-plate solar water heaters. Sol. Energy 2019, 194, 302–310. [Google Scholar] [CrossRef]
  26. Budea, S.; Bǎdescu, V. Improving the performance of systems with solar water collectors used in domestic hot water production. In Proceedings of the Sustainable Solutions for Energy and Environment, Energy Procedia, Bucharest, Romania, 26–28 October 2016; pp. 398–403. [Google Scholar] [CrossRef]
  27. Roberts, D.E. A figure of merit for selective absorbers in flat plate solar water heaters. Sol. Energy 2013, 98, 503–510. [Google Scholar] [CrossRef]
  28. Kelvin, O.O.; Edson, M.L.; Golden, M. A commercial building lighting demand-side management through passive solar design a commercial building lighting demand-side management through passive solar design. In Proceedings of the Central Europe towards Sustainable Building 2019 (CESB19), Prague, Czech Republic, 2–4 July 2019; pp. 1–8. [Google Scholar] [CrossRef]
  29. Chow, T.T.; Bai, Y.; Dong, Z.; Fong, K.F. Selection between single-phase and two-phase evacuated-tube solar water heaters in different climate zones of China. Sol. Energy 2013, 98, 265–274. [Google Scholar] [CrossRef]
  30. Solargis, Solar Resource Maps and GIS Data Solar Resource Maps of South Africa. 2019. Available online: https://solargis.com/maps-and-gis-data/download/south-africa (accessed on 6 April 2021).
  31. Kelvin, O.O.; Edson, M.L.; Golden, M. Thermal, economic and environmental analysis of a low-cost house in alice, South Africa. Sustainability 2017, 9, 425. [Google Scholar] [CrossRef] [Green Version]
  32. Kelvin, O.O.; Edson, M.L.; Golden, M. Towards sustainable rural development in South Africa through passive solar housing design. In Wind Solar Hybrid Renewable Energy System, 1st ed.; Okedu, K.E., Tahour, A., Aissaoui, A.G., Eds.; IntechOpen: London, UK, 2019; p. 20. [Google Scholar] [CrossRef] [Green Version]
  33. Naghavi, M.S.; Ang, B.C.; Rahmanian, B.; Naghavi, S.; Bazri, S.; Mahmoodian, R.; Metselaar, H.S.C. On-demand dynamic performance of a thermal battery in tankless domestic solar water heating in the tropical region. Appl. Therm. Eng. 2020, 167, 114790. [Google Scholar] [CrossRef]
  34. KwikSol, Instruction, Installation and Warranty Manual. 2021. Available online: https://www.kwikot.com/kwikot/manuals/Kwiksol_Instruction_Installation_Warranty_Manual_Apr_2021.pdf (accessed on 7 June 2021).
  35. Hohne, P.A.; Kusakana, K.; Numbi, B.P. Optimal energy management and economic analysis of a grid-connected hybrid solar water heating system: A case of Bloemfontein, South Africa. Sustain. Energy Technol. Assess. 2019, 31, 273–291. [Google Scholar] [CrossRef]
  36. Morrison, G.L.; Budihardjo, I.; Behnia, M. Water-in-glass evacuated tube solar water heaters. Sol. Energy 2009, 83, 49–56. [Google Scholar] [CrossRef]
  37. Zhao, X.; Huang, S.; Zhou, F.; Yuan, W.; Ji, J. Study on the PCM flat-plate solar collector system with antifreeze characteristics. Int. J. Heat Mass Transf. 2018, 129, 357–366. [Google Scholar] [CrossRef]
  38. Chaabane, M.; Charfi, W.; Mhiri, H.; Bournot, P. Performance evaluation of concentrating solar photovoltaic and photovoltaic/thermal systems. Sol. Energy 2013, 98, 315–321. [Google Scholar] [CrossRef]
  39. Atia, D.M.; Fahmy, F.H.; Ahmed, N.M.; Dorrah, H.T. Optimal sizing of a solar water heating system based on a genetic algorithm for an aquaculture system. Math. Comput. Model. 2012, 55, 1436–1449. [Google Scholar] [CrossRef]
  40. Martínez-Rodríguez, G.; Fuentes-Silva, A.L.; Picón-Núñez, M. Solar thermal networks operating with evacuated-tube collectors. Energy 2018, 146, 26–33. [Google Scholar] [CrossRef]
  41. Hills-Solar, Solar Hot Water Collectors Efficiency Comparisons. 2008. Available online: https://www.energymatters.com.au/wp-content/uploads/2014/07/hills-collector-efficiency.pdf (accessed on 29 June 2021).
  42. Nshimyumuremyi, E.; Wang, J. Thermal efficiency and cost analysis of solar water heater made in Rwanda. Energy Explor. Exploit. 2019, 37, 1147–1161. [Google Scholar] [CrossRef] [Green Version]
Figure 1. Sector-wise energy demand distribution in South Africa. Reprinted with the permission from ref. [16].
Water 13 03186 g001
Figure 2. Map showing (a) daily average global horizontal irradiation for the study site from 1994–2015 [30] and (b) Google map of the study site (SolarWatt Park).
Water 13 03186 g002
Figure 3. Outdoor test rig with installed flat plate and evacuated tube domestic solar water heaters.
Water 13 03186 g003
Figure 4. Data acquisition and control system for the high- and low-pressure solar water heater systems.
Water 13 03186 g004
Figure 5. Daily observations for the flat plate and evacuated tube solar water heating systems.
Water 13 03186 g005
Figure 6. Difference in temperature between cold water from the mains and water produced by the high- and low-pressure solar water heaters.
Water 13 03186 g006
Figure 7. The heat gained by the flat plate and evacuated tube systems.
Water 13 03186 g007
Figure 8. The response of various points on a solar water heating system on a clear and cloudy day.
Water 13 03186 g008
Figure 9. The performance of the flat plate and evacuated tube solar water heaters for a clear day (A) and cloudy day (B).
Water 13 03186 g009
Figure 10. The response of various points on a solar water heating system to ambient temperature.
Water 13 03186 g010
Figure 11. The response of the FP and ET to ambient temperature.
Water 13 03186 g011
Figure 12. Normalised clear and cloudy day for the FP and ET systems and their response to ambient temperature.
Water 13 03186 g012
Figure 13. Sensitivity of hot water production by (A) flat plate and (B) evacuated tube solar water heaters to measured operating conditions.
Water 13 03186 g013
Table 1. Specifications of the flat plate and evacuated tube solar water heaters used in the study [34].
TechnologyCapacity (L)Number of Plates/TubesArea (m2)Heat Transfer MediumHeat Loss at Night (%)
Flat plate collector20012.5Water12.44
Evacuated tube150122.2Water16.05
Table 2. Specification of the sensors used for measuring meteorological data and water temperature of the solar water heater.
Device NameRangeSensor TypeAccuracy/Sensitivity
41382VC RH/T Probe0–100% RH/−50–50 °CRotronic Hygromer/100 Ohm Platinum RTD±2%/± 0.3 °C
KM07 type-K thermocouple−50–250 °CHelicoid Propeller±1.5 °C ±0.25%
CMP10 Kipp & Zonen Pyranometer285–2800 nmThermopile7–14 µV/W/m2
Table 3. Payback period for a flat plate and evacuated tube solar water heater used in the domestic sector.
System Δ T (°C) C E ($) Q l o a d (kWh/day)Annual Saving ($)Payback Period (Years)
Flat Plate39.690.1446.97366.343
Evacuated Tube45.680.1445.23274.893.8
Publisher’s Note: MDPI stays neutral with regard to jurisdictional claims in published maps and institutional affiliations.

