Article

Resolution Dependence of Regional Hydro-Climatic Projection: A Case-Study for the Johor River Basin, Malaysia

1
GeoInformatic Unit, Geography Section, School of Humanities, Universiti Sains Malaysia (USM), Penang 11800, Malaysia
2
College of Engineering, Mathematics and Physical Sciences, University of Exeter, Exeter EX4 4QE, UK
3
Centre for Applied Climate Sciences, University of Southern Queensland, Toowoomba, QLD 4350, Australia
4
Met Office, FitzRoy Road, Exeter EX1 3PB, UK
5
Key Laboratory of Wisdom City and Environmental Modeling of Higher Education Institute, College of Resources and Environment Sciences, Xinjiang University, Urumqi 830046, China
*
Author to whom correspondence should be addressed.
Water 2021, 13(22), 3158; https://doi.org/10.3390/w13223158
Submission received: 7 October 2021 / Revised: 30 October 2021 / Accepted: 2 November 2021 / Published: 9 November 2021
(This article belongs to the Special Issue Integrated Water Assessment and Management under Climate Change)

Abstract

:
High resolution models from the High-Resolution Model Intercomparison Project (HighResMIP), part of CMIP6, have the capacity to allow a better representation of the climate system in tropical regions, but how different model resolutions affect hydrological outputs remains unclear. This research aims to evaluate projections of hydro-climatic change of the Johor River Basin (JRB) in southern Peninsular Malaysia between 1985 to 2015 and 2021 to 2050, focusing on uncertainty quantification of hydrological outputs from low (>1°), medium (0.5° to 1°) and high (≤0.5°) horizontal resolution models. These projections show future increases in annual precipitation of 0.4 to 3.1%, minimum and maximum temperature increases of 0.8 to 0.9 °C and 0.9 to 1.1 °C, respectively. These projected climate changes lead to increases in annual mean streamflow of 0.9% to 7.0% and surface runoff of 7.0% to 20.6% in the JRB. These annual mean changes are consistent with those during the wet period (November to December), e.g., streamflow increases of 4.9% to 10.8% and surface runoff of 28.8 to 39.9% in December. Disagreement in the direction of change is found during the dry seasons, (February to March and May to September), where high resolution models project a decrease in future monthly precipitation and streamflow, whilst increases are projected by the medium- and low-resolution models.

1. Introduction

Hydro-climatic projection provides critical information for promoting disaster mitigation, sustainable urban planning, ecological analysis and water resource and agricultural management under future climate change. Such an operation has been relying on the incorporation of climate simulation from General Circulation Models (GCMs) into hydrological models so that the future hydro-climatic changes are quantified under greenhouse gas emission scenarios [1,2,3]. Dating back to the 1950s, GCMs were initially developed to simulate the large-scale behavior of atmospheric circulation by Phillips [4]. Since then, GCMs have undergone numerous evolutions from simply capturing realistic regional climate patterns by a few modelers during the 1960s–1970s to solving the major technical features of the climate by a group of international modelling communities in the late 1990s [5]. These developments have made GCMs a crucial source of information for investigating the changing state of climate systems, particularly for their uses in the recently released sixth assessment report of the Intergovernment Panel in Climate Change (IPCC), providing the latest physical science basic of climate change for policy makers and the public [5,6].
The Coupled Model Intercomparison Project (CMIP), a collaborative modelling framework was formed in 1995 to foster the management and improvement of GCMs. The early phases (1 and 2) of CMIP started with model experiments based on 18 GCMs, and the ensemble size has expanded to 25 GCMs in Phase 3 launched in 2005–2006. In 2010, CMIP Phase 5 was initiated and its GCM ensemble consisted of 40 GCMs. Currently, the latest CMIP Phase 6 (CMIP6) launched in 2013 includes the output of 55 GCMs [7,8]. A major difference between CMIP6 and CMIP5 is the scenario of GHG emissions for future anthropogenic forcing of climate change, where CMIP5 projections are simulated based the radiative forcing pathways (RCPs) [9], while the recent CMIP6 applies socio-economic pathways (SSPs) [10]. In addition, the CMIP6 GCMs include models with finer spatial resolution, and models with enhanced representation of cloud microphysical and earth system processes [11]. The significance of HighResMIP is that it allows investigation of the sensitivities of present-day climate representation and future climate projection solely to changes in GCM resolution. The CMIP6 GCMs have been extensively used to evaluate climate extremes such as precipitation, temperature and drought [8,12,13]. To date, the use of the CMIP6 in hydrological studies is relatively rare, but such outputs are likely to increase dramatically in the near future [2].
Tropical rivers, especially for those over Southeast Asia, are generally characterized by pronounced streamflow seasonality, with some having two flood peaks observed within a year due to the influence of monsoon-induced rainfall and equatorial convective rainfall [14]. Jahandideh-Tehrani, et al. [15] revealed that climate change has a significant impact on tropical streamflow, hence, the responses of tropical streamflow to climate change have been extensively investigated in tropical basins [16,17,18]. As previously noted, GCMs are a major tool to provide precipitation and temperature information to facilitate assessment of potential future tropical streamflow changes. Therefore, application of the latest CMIP6 GCMs can provide new insights into possible tropical hydro-climatic changes under climate change.
Considerable biases have been found in GCMs with coarse resolution when they are used to simulate fields of regional precipitation and convection rainfall for hydrological modelling. For instance, Lebel [19] found that GCMs with coarse resolutions (1.6° × 3.75°) exhibit biases in representing the seasonal precipitation in West Africa due to the poorly resolved mesoscale convective systems. To address the issue of the coarse GCM resolution, dynamic or statistical downscaling is needed to narrow down the gap between GCMs and hydrological model [3]. As one of the CMIP6-endorsed MIPs, the recently released HighResMIP provides a suite of GCMs simulations with atmospheric horizontal grid spacing of ~25 km or finer [7]. The ability to resolve small scale weather features is important for basin scale analysis, and means HighResMIP GCMs will likely be employed by hydrologists to study hydro-climatic changes around the world, including the tropical regions. Tan, et al. [20] found that high-resolution HighResMIP models projected a higher flow rate during flood season than low-resolution models in the Kelantan River Basin, Malaysia. To date, there has been little investigation of about the role of HighResMIP models resolution on hydro-climatic projections. This study attempts to explore how different model resolutions could affect the tropical streamflow outputs.
The Johor River Basin (JRB) is a tropical river basin closely associated with freshwater supply for Malaysia. It is also a vital water source of Singapore as it provides up to 1157 million litres of freshwater per day [21]. Historical record indicates a number of severe drought events in 1990, 1997, 2005, 2010, 2010–2014 and 2019, leading to water supply disruption in Johor [22,23]. Floods also occur frequently in this region, for example, in 2006–2007 flooding caused 18 deaths, more than 100,000 people were evacuated and about USD 0.5 billion of losses were sustained [24]. Thus, studying streamflow changes is important to help local authorities to mitigate the impact of these events. Tan, et al. [25] reported high flows in the JRB will increase significantly, particularly under the RCP4.5 and RCP8.5 scenarios. In addition, the number of meteorological droughts over the JRB is expected to increase in the mid-21st century, based on the Coordinated Regional Climate Downscaling Experiments—Southeast Asia (CORDEX-SEA) projections [26]. However, investigation of the streamflow changes under the latest SSP scenario is still lacking, so this study provides new insight on potential streamflow changes of the JRB.
The main purpose of this study is to evaluate future hydro-climatic changes of the JRB in the southern Peninsular Malaysia by incorporating the latest CMIP6 HighResMIP climate projections into the Soil and Water Assessment Tool (SWAT), focusing on uncertainty quantification of the streamflow outputs from different model ensemble sub-sets, e.g., all models (Ens_Mean), low resolution (Ens_LR, >1°), medium resolution (Ens_MR, 0.5° to 1°) and high resolution (Ens_HR, ≤0.5°) horizontal resolution models. SWAT is a widely used hydrological model in many parts of the world [27,28], including Southeast Asia [29]. A total of 10 HighResMIP GCMs under the SSP5-8.5 scenario were used to project the differences of hydro-climatic changes between historical (1985–2014) and future (2021–2050) periods. The findings can be used by local authorities to prepare climate adaptation and mitigation strategies based on the latest IPCC suggested socio-economic scenarios. Further, the research framework developed here could be readily duplicated and applied in other river basins, especially those located in the tropical regions.

2. Materials and Methods
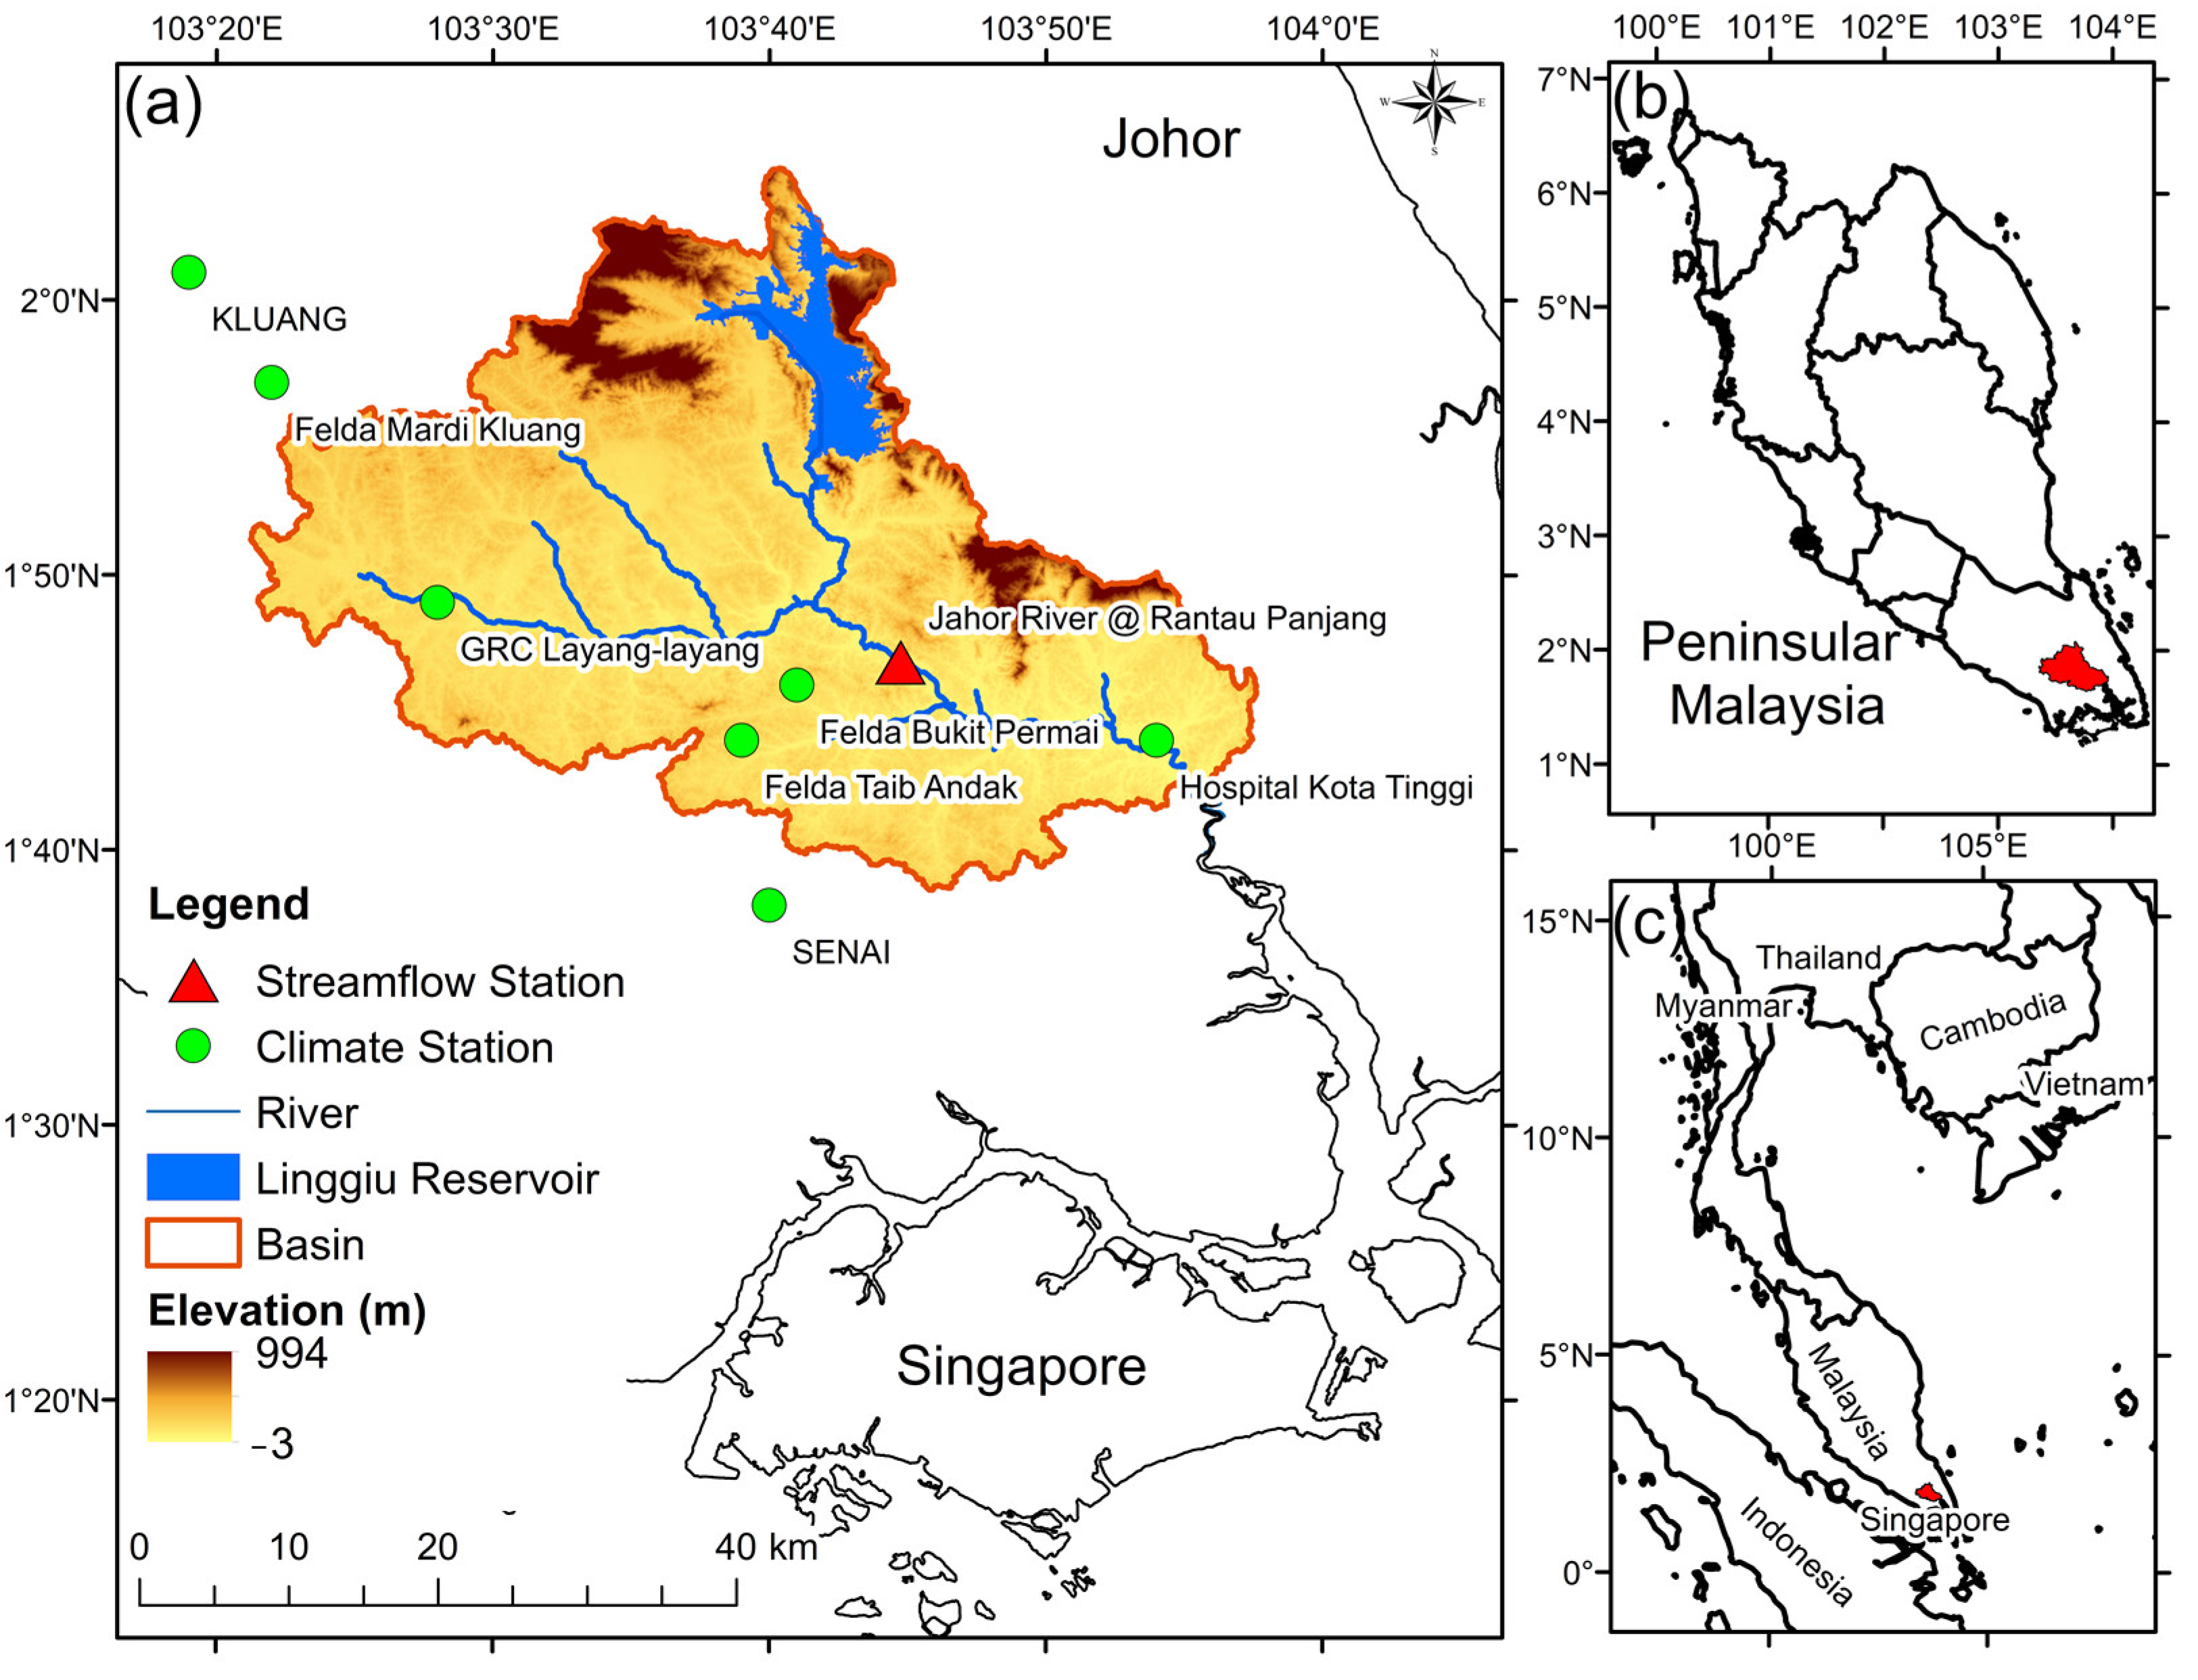
2.1. Study Area

The JRB in the southern part of Peninsular Malaysia was selected as the study site because it is important to Malaysia and Singapore (Figure 1). In addition, the basin experiences a tropical rainforest climate under the Köppen climate classification, where precipitation falls throughout the year, high mean annual temperatures and small temperature ranges. Precipitation amount in the JRB is highly associated with both monsoonal and convective rainfall system. The total area of the basin is about 1644 km2. The mean annual total precipitation during the 1985–2014 period ranged from 1825 mm yr−1 to 2958.5 mm yr−1. The climate of the JRB is strongly influenced by the northeast monsoon (wet season) from November to March and the southwest monsoon (dry season) from May to September [30]. Intense convective precipitation occurs in two inter-monsoon periods of April and October. The annual mean daily maximum and minimum temperatures during the same period were 23 °C and 32 °C, respectively.
The mean annual streamflow of the Johor River, as measured at the Rantau Panjang station, is 37.7 m3s−1, while the peak monthly streamflow reached up to 200 m3s−1 in the early 1984 and 1996. Palm oil is the major use of land cover within the basin, followed by forest, rubber and other agricultural activities [31]. The Linggiu reservoir, with a storage capacity of 760 MCM [32], is located in the northern part of the basin and commenced operation in 1993 [32]. The reservoir is principally used to augment raw water deficit at the downstream Johor River Water Works (JRWW), especially during the dry season. Previous drought events in the JRB have typically occurred between February to September [23,33].

2.2. Data

The digital elevation model of Shuttle Radar Topography Mission (SRTM) with a spatial resolution of 30 m was downloaded from https://dwtkns.com/srtm30m/ (accessed on 1 June 2021) for basin delineation and river network formation. The land use map of 2008 was obtained from the Ministry of Agricultural Malaysia. The digital soil map prepared by the Food and Agriculture Organization of the United Nations (FAO-UNESCO) was used as soil input into the SWAT model. Daily precipitation, maximum and minimum temperatures from 1980 to 2014 were collected from the Malaysia Meteorological Department for HighResMIP bias correction and SWAT development.
Monthly streamflow data from 1985 to 2014 at the Rantau Panjang station were collected from the Department of Irrigation and Drainage Malaysia to calibrate and validate the SWAT model. As shown in Figure 1, the streamflow station is not located at the end of the river outlet due to seawater intrusion issue during dry season [23]. Generally, a full spatial calibration and validation is difficult at the entire basin scale due to insufficient observed data [34]. Hence, the application of calibrated parameters for basin or sub-basin, with similar climatic, land use and soil conditions, is an accepted approach within the SWAT community [34]. As the downstream part of the JRB is a more populated region where floods and water rationing commonly occur and where any changes in streamflow will have greater impact, this study selected the outlet near to the river mouth for a better understanding of potential hydro-climatic changes in the region.

2.3. CMIP6 HighResMIP Models

This study employs 10 atmospheric-only simulations for present and future climate from six GCMs of the CMIP6 HighResMIP protocol (Table 1). The experiments for future climate simulations used in this study apply a high-end emission scenario from the latest Shared Socioeconomic Pathways (SSPs), a scenario framework of differential levels of anthropogenic greenhouse gas emission [10] covered by the upcoming IPCC sixth assessment report. At the sea level, these atmosphere-only simulations are forced by sea-surface temperature and sea-ice data from observations (for present climate simulations) and simulations (for future climate) by the ensemble of coupled experiments of CMIP6 under the 8.5 scenario of the Representative Concentration Pathways. The used atmosphere-land only experiments from HighResMIP were forced by the SSP5-8.5 scenario while and prescribed forcing of sea-surface temperature and sea-ice is based on the future projection of the CMIP5 experiments produced using the RCP8.5 scenario [35]. The SSP5-8.5 scenario represents the highest level of greenhouse gas emissions in the near future [10]. HighResMIP provides high resolution GCM experiments along with experiments with the same scientific configuration but at coarser model resolutions [35]. In this study, the used climate simulations cover the historical periods of 1985–2014 and the future period of 2021–2050. The data are collected from the data platform of the Earth System Grid Federation. The HighResMIP experiments are run for the period of 1950 to 2050, therefore, analysis of future changes in this study can only extend up to 2050. We note, however, that information on the hydro-climatic changes over the 2021–2050 period will be useful for near-term policy planning and development.
To differentiate hydro-climatic changes as projected at different resolutions, the 10 HighResMIP GCMs were further divided into four ensemble groups: (1) Ens_Mean—ensemble of all ten HighResMIP GCMs; (2) Ens_LR—ensemble mean of climate models with horizontal resolution more than 1° which comprises of CNRM, FGOALS-L and HadGEM3-LM; (3) Ens_MR—ensemble mean of EC-Earth, GFDL. HadGEM3-MM and MRI-H which have horizontal resolution between 0.5° to 1°; and (4) Ens_HR—ensemble mean of models with equal or less than 0.5°, e.g., CNRM-HR, HadGEM3-HM and MRI-S. Precipitation, maximum and minimum temperature projections from the HighResMIP models are first interpolated to the station level before being input to the SWAT model for hydro-climatic impact assessment [36]. Bias correction is performed for the interpolated inputs to properly exclude the expected differences between grid box values and station values. For this purpose, the quantile mapping approach is used, which is one of the most popular methods in the hydro-climatic modelling community [37,38]. This approach first computes correction parameters at different quantile ranges by calculating the ratio of mean values within different quantile ranges between the GCM outputs and the observed data. Then, within each quantile range, the computed parameters are used to nudge the values from the GCM outputs towards those from the observed data.

2.4. Soil and Water Assessment Tool (SWAT)

SWAT is a semi-distributed, continuous-time and process-based model developed for assessing different management practices on water resources and non-point source pollution within a river basin [39,40]. More than 4500 research articles have been documented in the SWAT literature database [41], showing that it has been considered worldwide to understand local water resources issues. The capability of SWAT in simulating streamflow has been verified in different parts of the world [27,42,43], including Southeast Asia [29]. Assessing climate change impact on water resources and pollution is the current principal use of SWAT. In any such study, the model should ideally be calibrated for at least a 30-year period using observed data to ensure it captures historic streamflow variability.
Moriasi, et al. [44] recommended a set of guidelines based on the Coefficient of determination (R2), Nash-Sutcliffe Efficiency (NSE) and Relative Bias (RB) to determine the performance rating of SWAT (Table 2). The model assessment is not using only NSE and R2 since both metrics are not contrasting metrics. A third metric is at least required for a more appropriate multi-objective assessment. Therefore, SWAT modelers have begun to use Kling-Gupta Efficiency (KGE) in the capability assessment of the SWAT model [45,46] because it provides a balanced optimization of model bias, variability and temporal fit [45,47]. The performance rating of KGE for monthly streamflow simulation can be found in the studies conducted by Thiemig, et al. [48] and Kouchi, et al. [49]. Hence, this study considered four statistical approaches to assess SWAT’s capability in the JRB. The Sequential Uncertainty Fitting Version (SUFI-2) calibration approach within the SWAT Calibration and Uncertainty Program (SWAT-CUP) tool that developed by Abbaspour et al. [50] was used for the SWAT calibration and validation.
Due to the limited availability of Linggiu Reservoir management data, previous SWAT calibration and validation in the JRB focused only the unregulated flow period before the reservoir operates [25,26,31]. This study seeks to address this by considering the regulated flow period after 1993. Some basic reservoir information, e.g., reservoir operational year, surface area, volume, that are available in open-source articles [21,32], were added in the SWAT model setup for this study. In addition, the maximum allowable water extraction of 1157 million liters per day by Singapore under the 1962 Water Agreement [21] was used as guide to set the water usage parameter. Moreover, maximum and minimum daily outflow parameters were also added in the SWAT model setup and calibration. In addition, some groundwater related parameters were included to the model calibration as groundwater processes influence the streamflow simulation performance.

3. Results

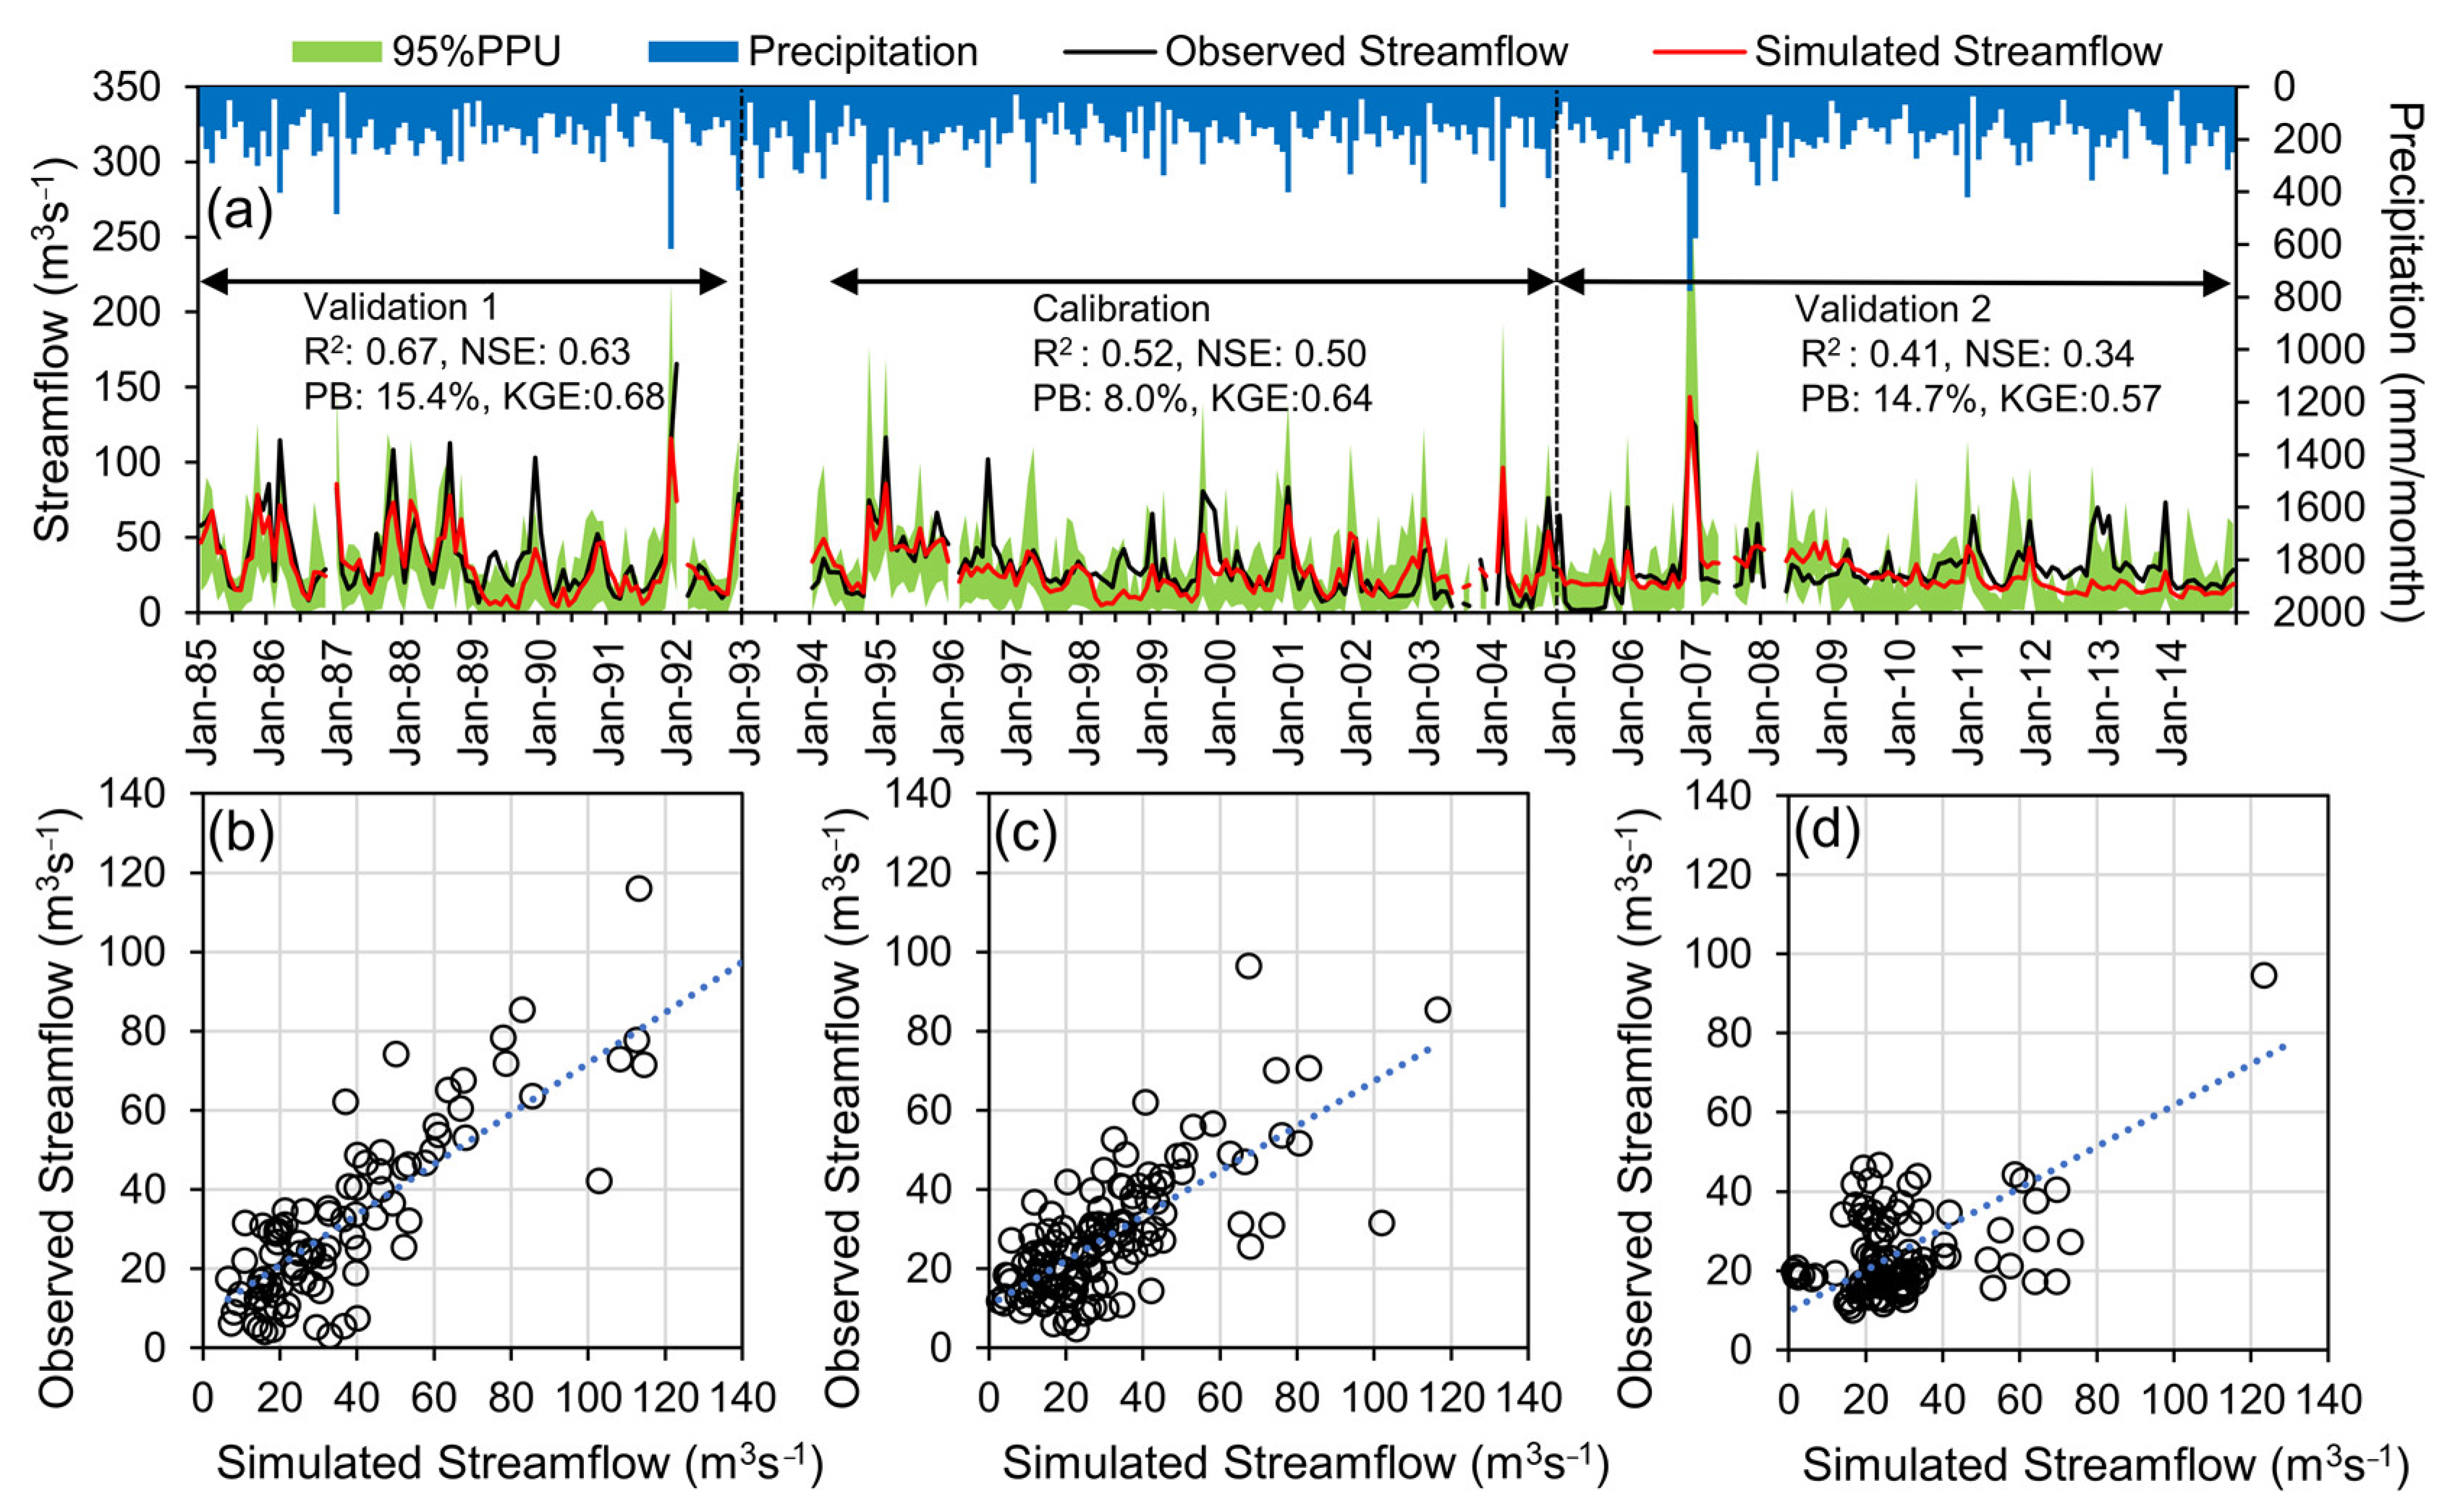
3.1. SWAT Sensitivity Analysis, Calibration and Validation

The JRB has been divided into 23 sub-basins and 151 Hydrologic Response Units (HRUs). For SWAT calibration, 15 parameters that affect streamflow and baseflow, including two newly added reservoir management parameters, as listed in Table 3, have been selected from SWAT studies in Malaysia [26,51,52]. Global sensitivity analysis shows that Initial SCS CN II value (CN2), soil evaporation compensation factor (ESCO), Manning’s n for main channel (CH_N2), maximum canopy storage (CANMX) and groundwater “revap” coefficient (GW_REVAP) are the five most sensitive parameters in the JRB. CN2 that linked to surface runoff has been regarded as the most sensitive parameter in SWAT modeling in many tropical river basins [16,53,54]. A detailed description of each parameter can be found in the SWAT theoretical document written by Neitsch, et al. [55].
The SWAT model was run from 1980 to 2014 with the first 5 years as a model spin up period. The calibration was performed for the regulated period from 1994 to 2004 with 2000 iterations, while the SWAT validation was divided into unregulated (1985–1993) and regulated (2005–2014) flow periods. A comparison between the observed and simulated monthly streamflow at the Rantau Panjang station is shown in Figure 2. Based on the SWAT performance rating for KGE and PB as listed in Table 2, the model can be rated as satisfactory for all the three calibration and validation periods. In summary, the performance of the SWAT model in the validation 1 period outperformed the other two periods, showing SWAT is capable of capturing the unregulated flows accurately. Meanwhile, based on the R2 and NSE values, SWAT was able to simulate monthly streamflow satisfactorily in the calibration and validation 1 periods, while the performance is acceptable for the validation 2 period since the NSE value was greater than 0 [56]. The statistical values are slightly lower in the validation 2 period as compared to the calibration and validation 1 period due to the lack of details reservoir and daily water withdrawal information that is restricted to the public.

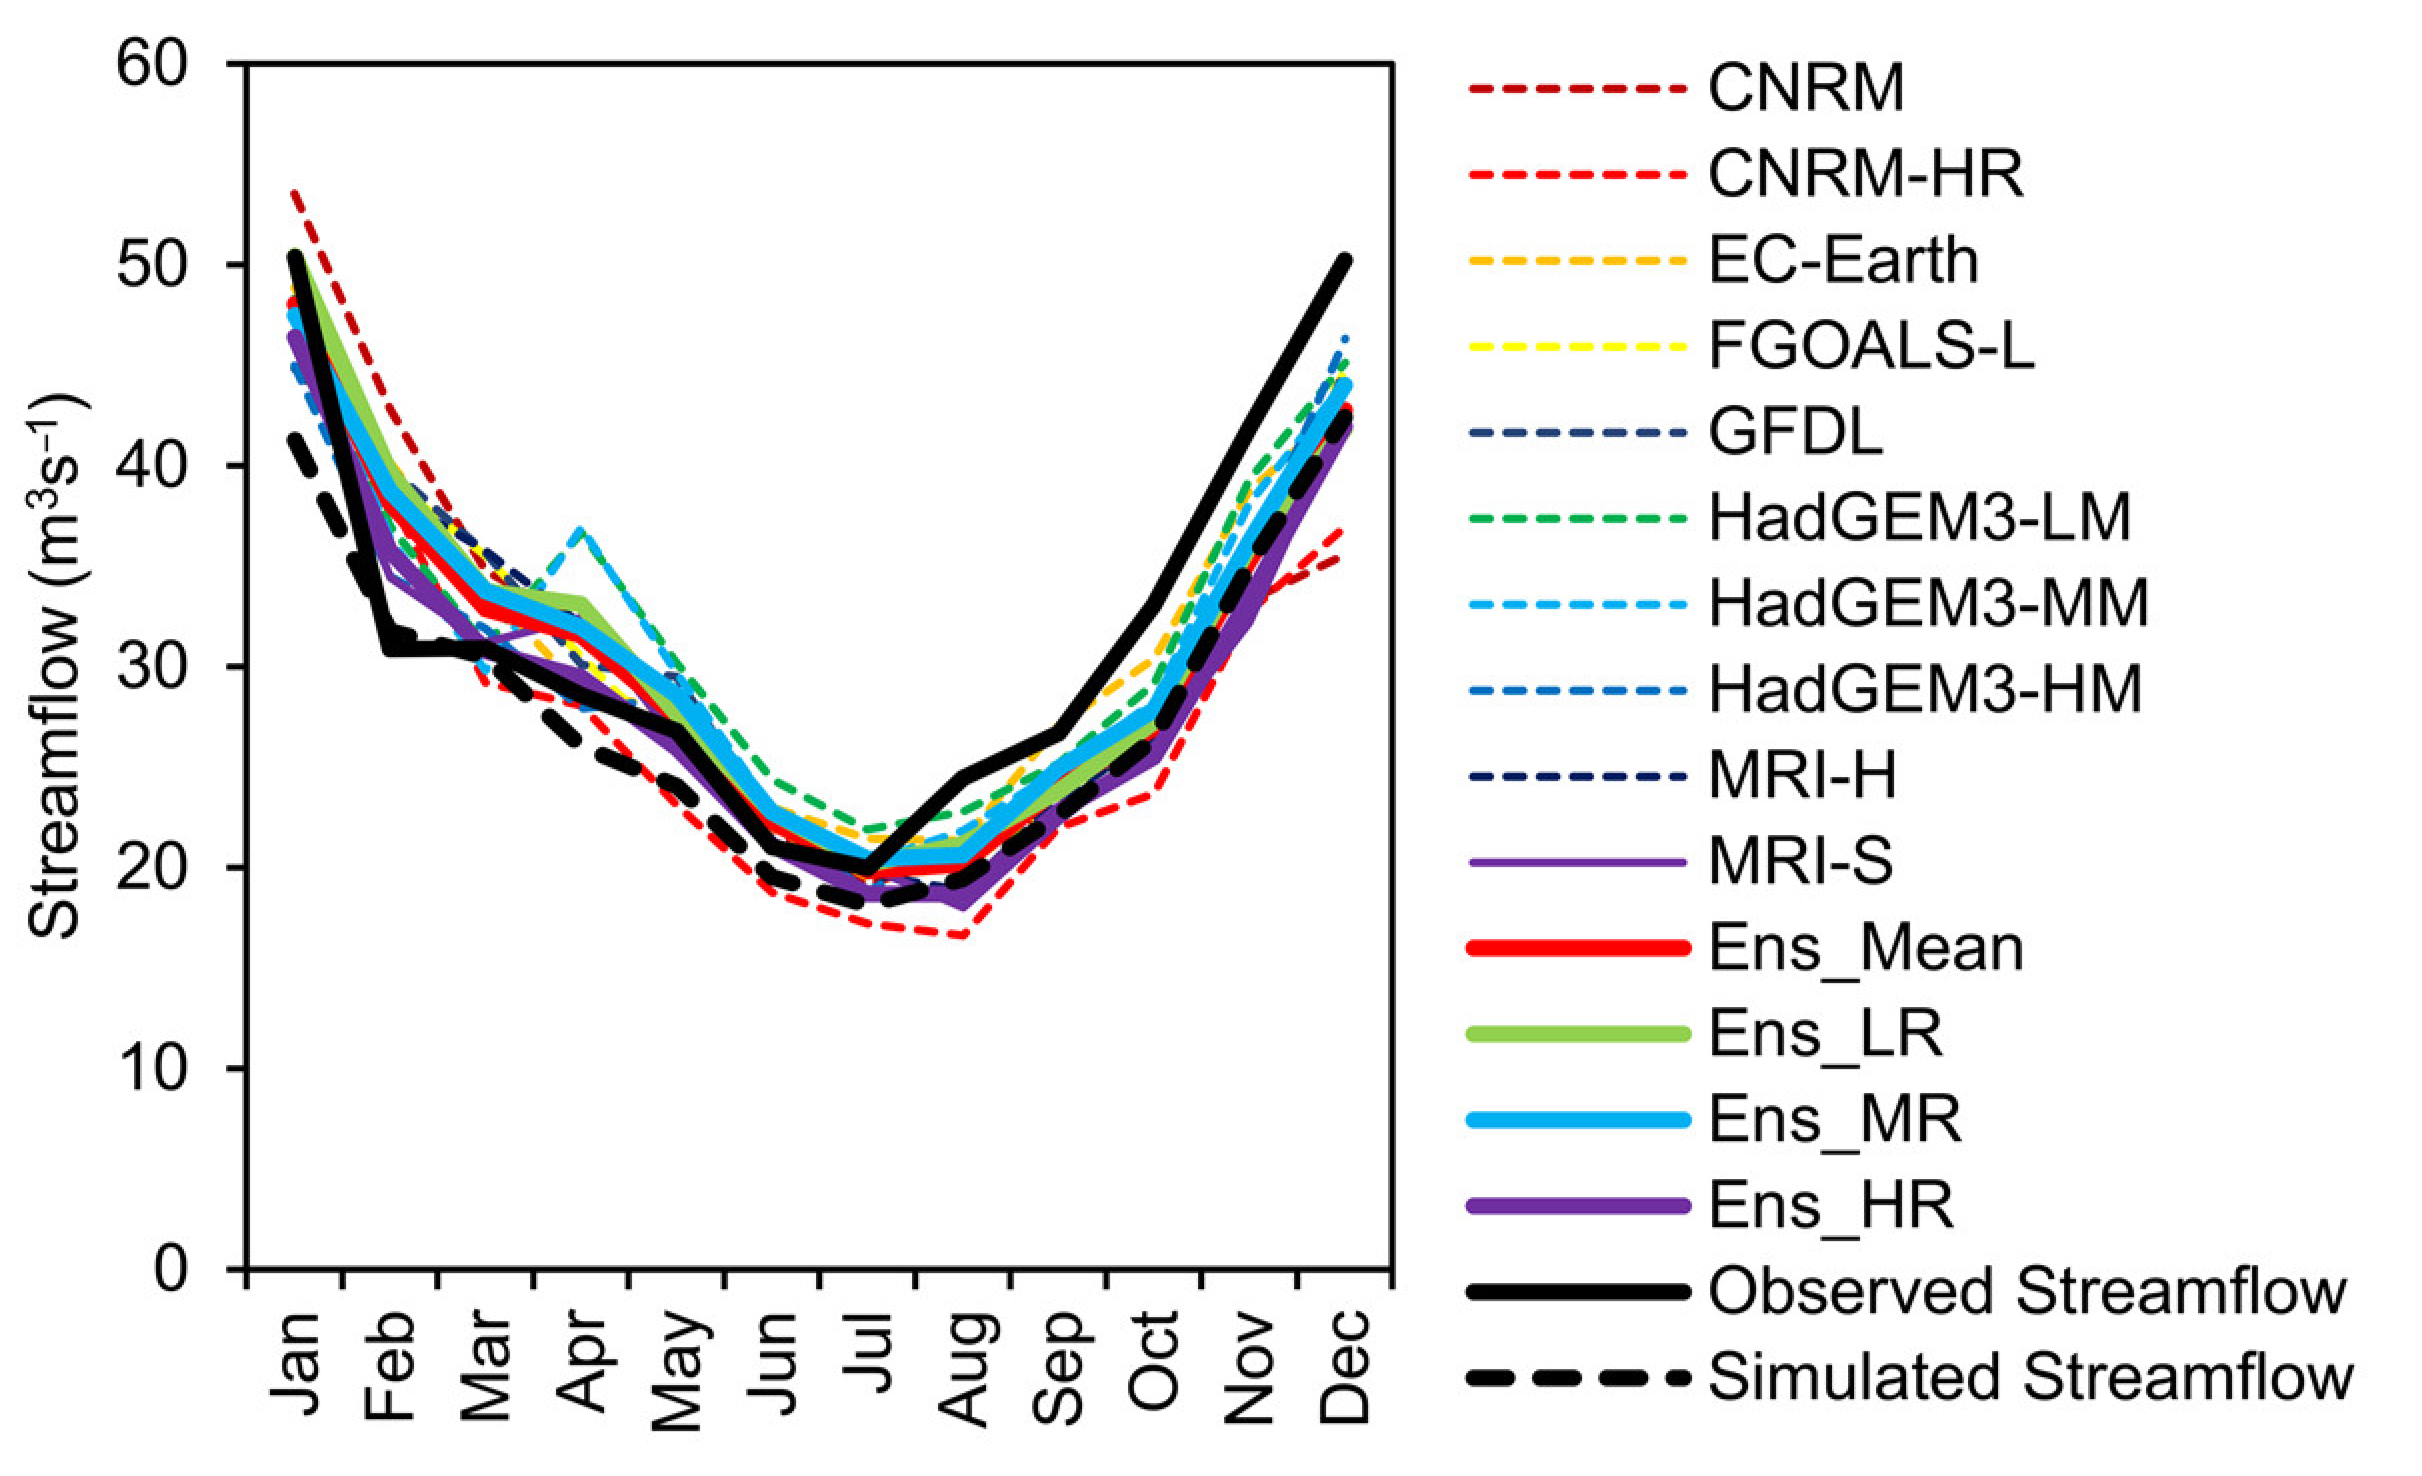
3.2. CMIP6 HighResMIP Models Evaluation and Bias Correction

The climatological performance of GCMs was evaluated for monthly precipitation, monthly mean daily maximum and minimum temperatures with respect to observations, for both raw and bias-corrected HighResMIP model output for the period 1985–2014 (Figure 3). Two peaks can be found in the observed monthly mean precipitation, with a primary peak in December and a secondary peak in April. Most of the HighResMIP models simulate the primary peak 1 or 2 months earlier than observations, while the CNRM models simulate this peak 1 month later. This finding was also reported by Tan et al. [26] for the CMIP5 models in the same basin, showing the mismatch of the peak monthly precipitation by GCMs in this tropical basin remains unsolved in CMIP6 even in high-resolution models. However, the monthly precipitation variability as captured by the Ens_MR and Ens_HR is closer to the observations than Ens_LR and Ens_Mean. For example, FGOALS-L and HadGEM-LM significantly underestimated the precipitation from June to September and January to March, respectively (Figure 3a). A possible explanation for the poorer performance of Ens_LR could be partly due to the poorly resolved mesoscale precipitating systems by the coarse model resolution [57].
The raw HighResMIP GCMs all reproduce the observed seasonal cycle of monthly mean daily minimum and maximum temperatures with greater fidelity than precipitation, except Ens_LR for maximum temperature. This is because the Ens_LR models are less able to capture the peak temperatures in April and October as shown in Figure 3c, e.g., FGOALS-L, which simulated the peak in June. Most of the HighResMIP GCMs overestimate minimum temperatures, with HadGEM3_LR having the largest overestimation. By contrast, an underestimation was found for maximum temperature, while the CNRM and CNRM-HR models were unable to capture the maximum temperature climatology. This spread in performance indicates that inter-model variability poses a significant challenge to accurate hydro-climatic impact assessment. In summary, Ens_HR is slightly closer to the observed data than other ensemble models in the temperature simulations in the JRB. This is consistent with the results reported by Squintu, et al. [58] who compared the high-resolution HighResMIP GCMs (0.23° to 0.5°) with their low-resolution counterparts (0.94° to 1.88°) in extreme winter minimum temperature simulations over the Europe from 1970 to 2014. The biases of monthly precipitation, minimum and maximum temperatures are reduced dramatically through the quantile mapping approach (Figure 3). Further evaluation of the simulated mean streamflow from 1985 to 2014 shows the SWAT model is able to capture the climatology of the historical streamflow at the Rantau Panjang station (Figure 4).

3.3. Bias Corrected CMIP6 HighResMIP Future Projections

Table 4 indicates changes in the mean annual precipitation, annual mean daily minimum and maximum temperatures over the JRB during the 2021–2050 period relative to the 1985–2014 baseline period. The annual precipitation results show minor differences across the HighResMIP models, except the FGOALS-L and GFDL models. The ensemble mean annual precipitation is projected to increase by 0.4 to 3.1%, with the smallest change for the Ens_HR models, which is consistent with the ensemble mean increase of CMIP5 GCMs [25]. In contrast, differences between models and the ensemble are more obvious in the monthly precipitation projections shown in Figure 5. The models and ensembles indicate a universal increase in precipitation over the JRB during the flood period of November, December and January by 0.4 to 4.4%, 9.2 to 13.4% and 1.1 to 9.8%, respectively. In contrast, for the low precipitation period of February and June to July, there is less consistency. For instance, Ens_LR projects increased precipitation in February by 9.2%, while the Ens_mean, Ens_HR and Ens_MR models showed a decreasing amount of 0.7 to 7.0%. Ens_HR projected a reduction of monthly precipitation from February to June and September to October by 1.5 to 11.9% and 1.8 to 1.9%, respectively.
For the study region, increases in mean annual daily minimum and maximum temperatures of up to 0.9 °C and 1.1 °C are projected by all ensembles, with Ens_HR projecting the largest increases (Table 4). Similar increasing trends of minimum and maximum temperatures over the basin were also projected by the CMIP5 GCMs [25] and CORDEX-SEA RCMs [26]. The increase of monthly mean daily minimum temperature is slightly higher in April to June and October to December, which is about 1 °C, as illustrated in Figure 5b. The variation of mean daily monthly maximum temperature across HighResMIP models is larger than mean daily monthly minimum temperature. Figure 5c shows Ens_HR generally projects greater increases in monthly mean daily maximum temperature than Ens_LR, with up to a 0.4 °C difference in May. Overall, these result shows both night time and daytime temperature of the JRB will become warmer in the mid of 21st century, with those increases being greatest during March–April and September–October, at the start and end of the dry season.

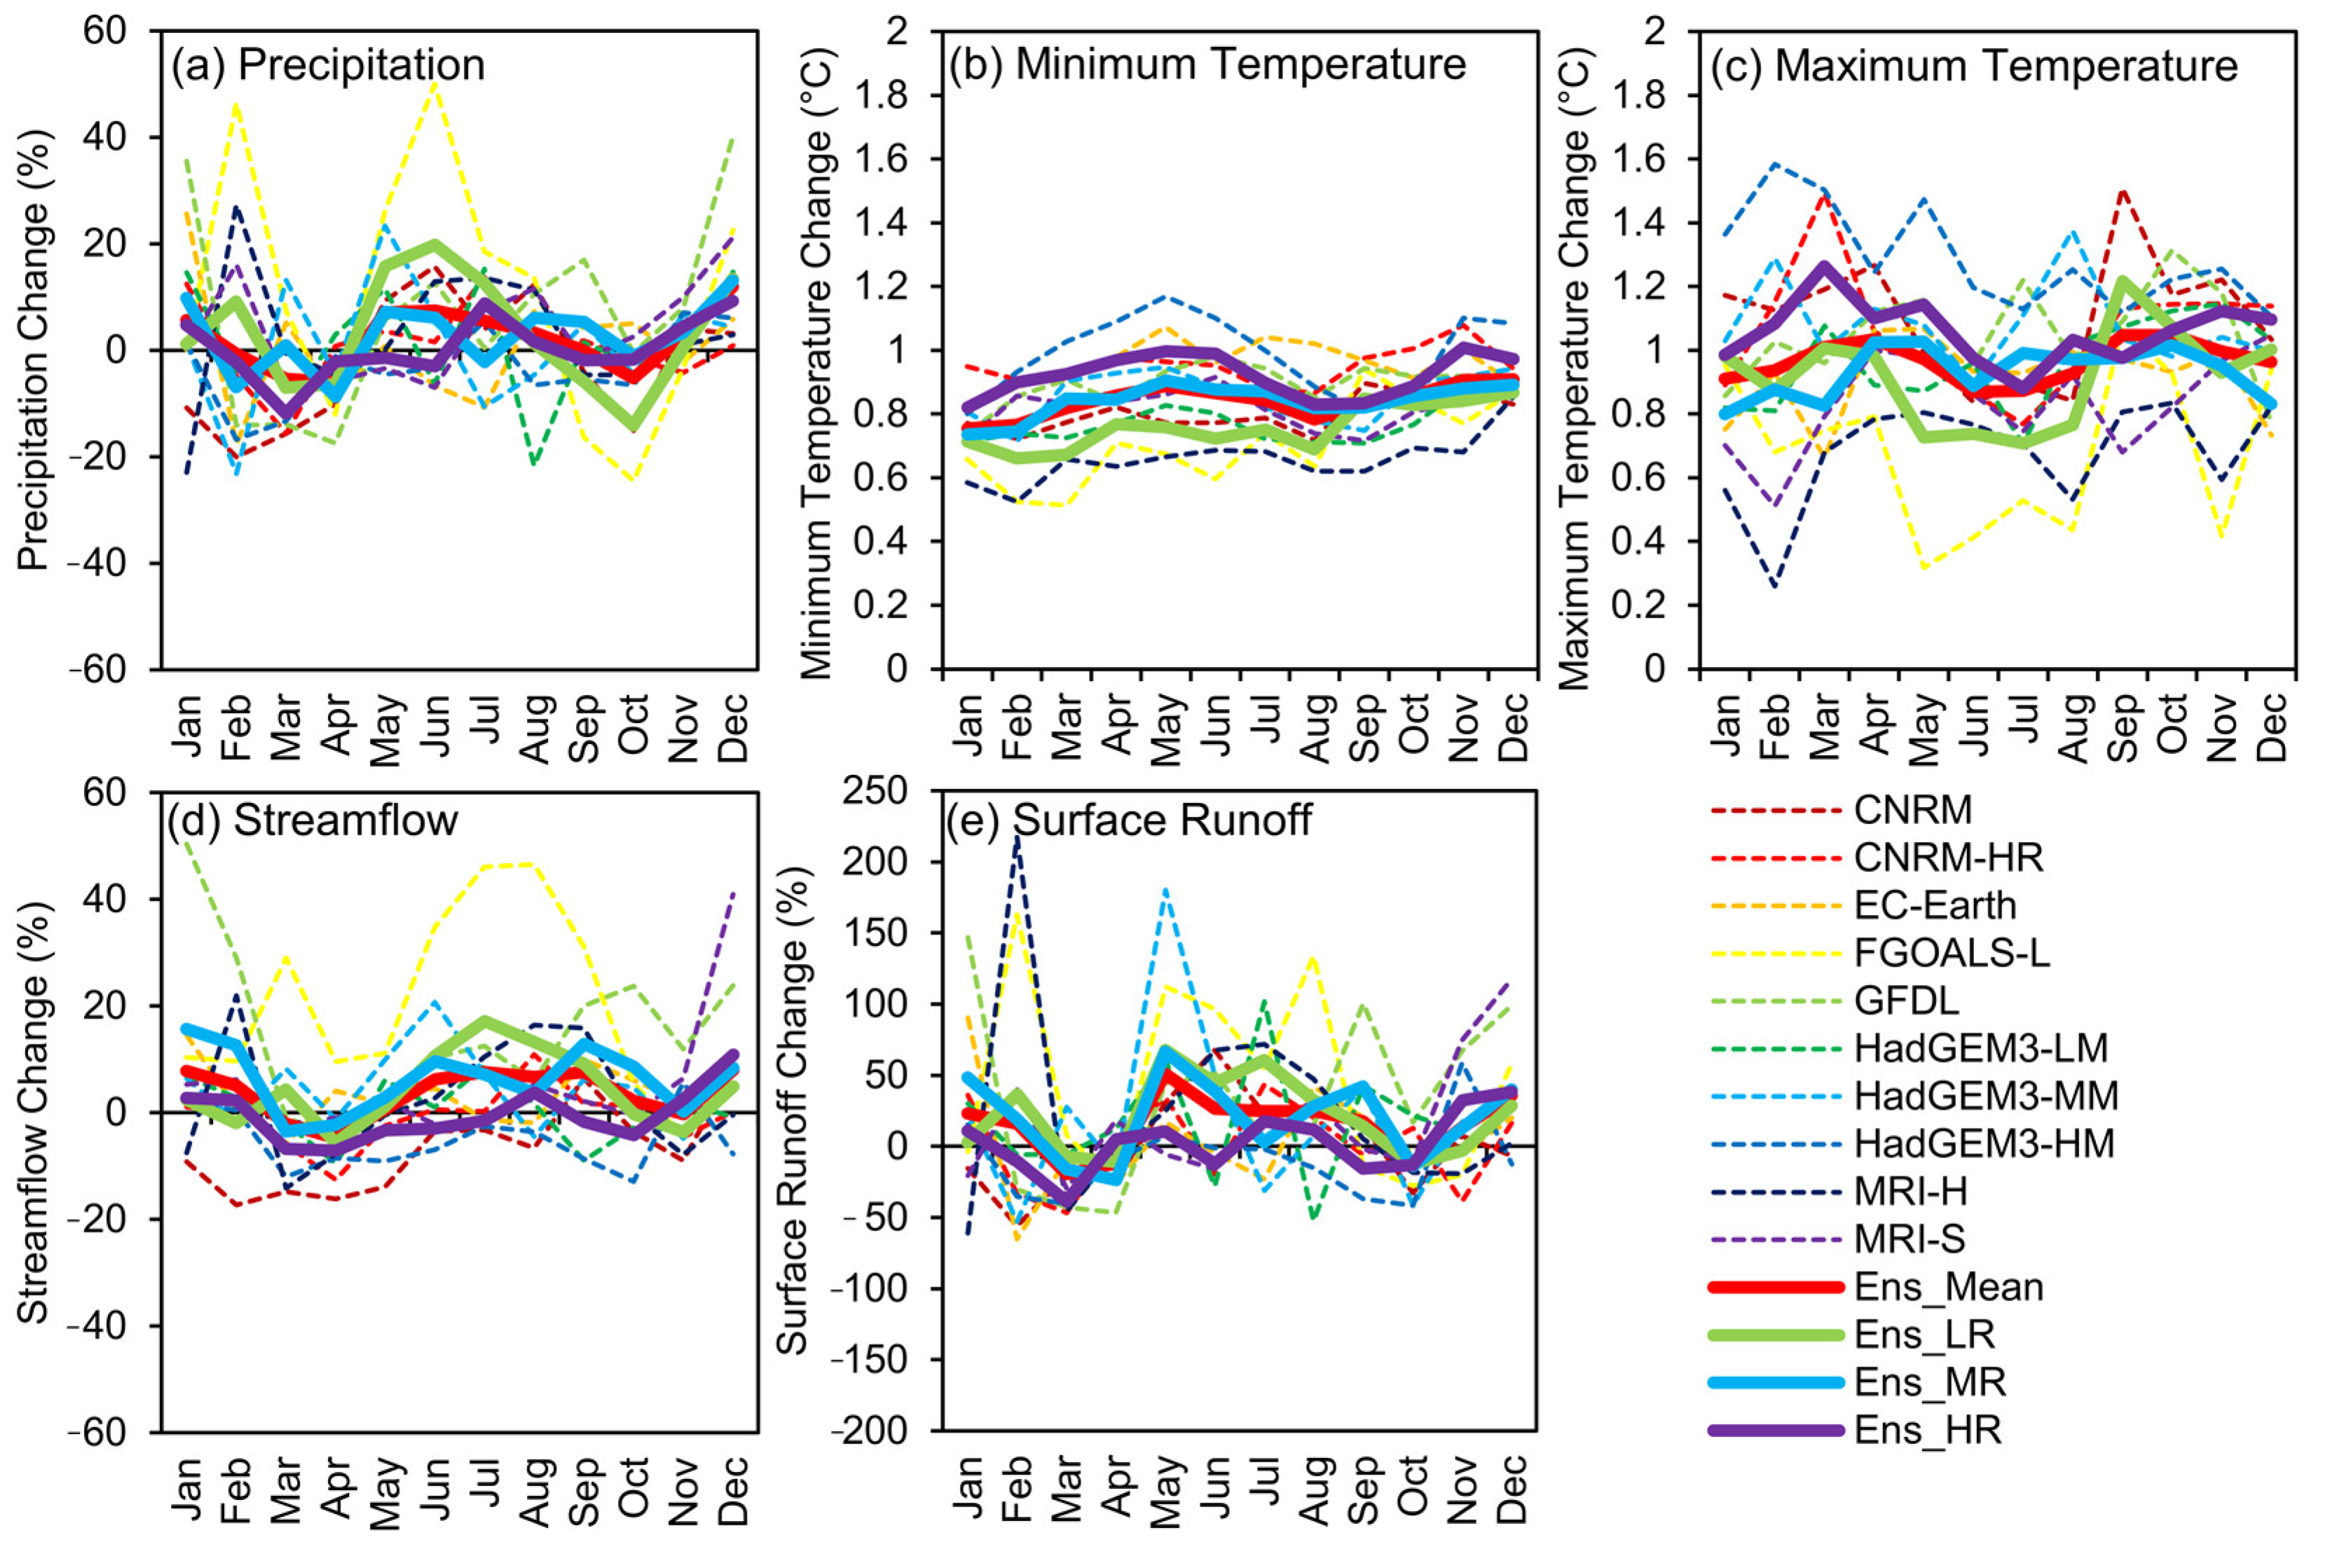
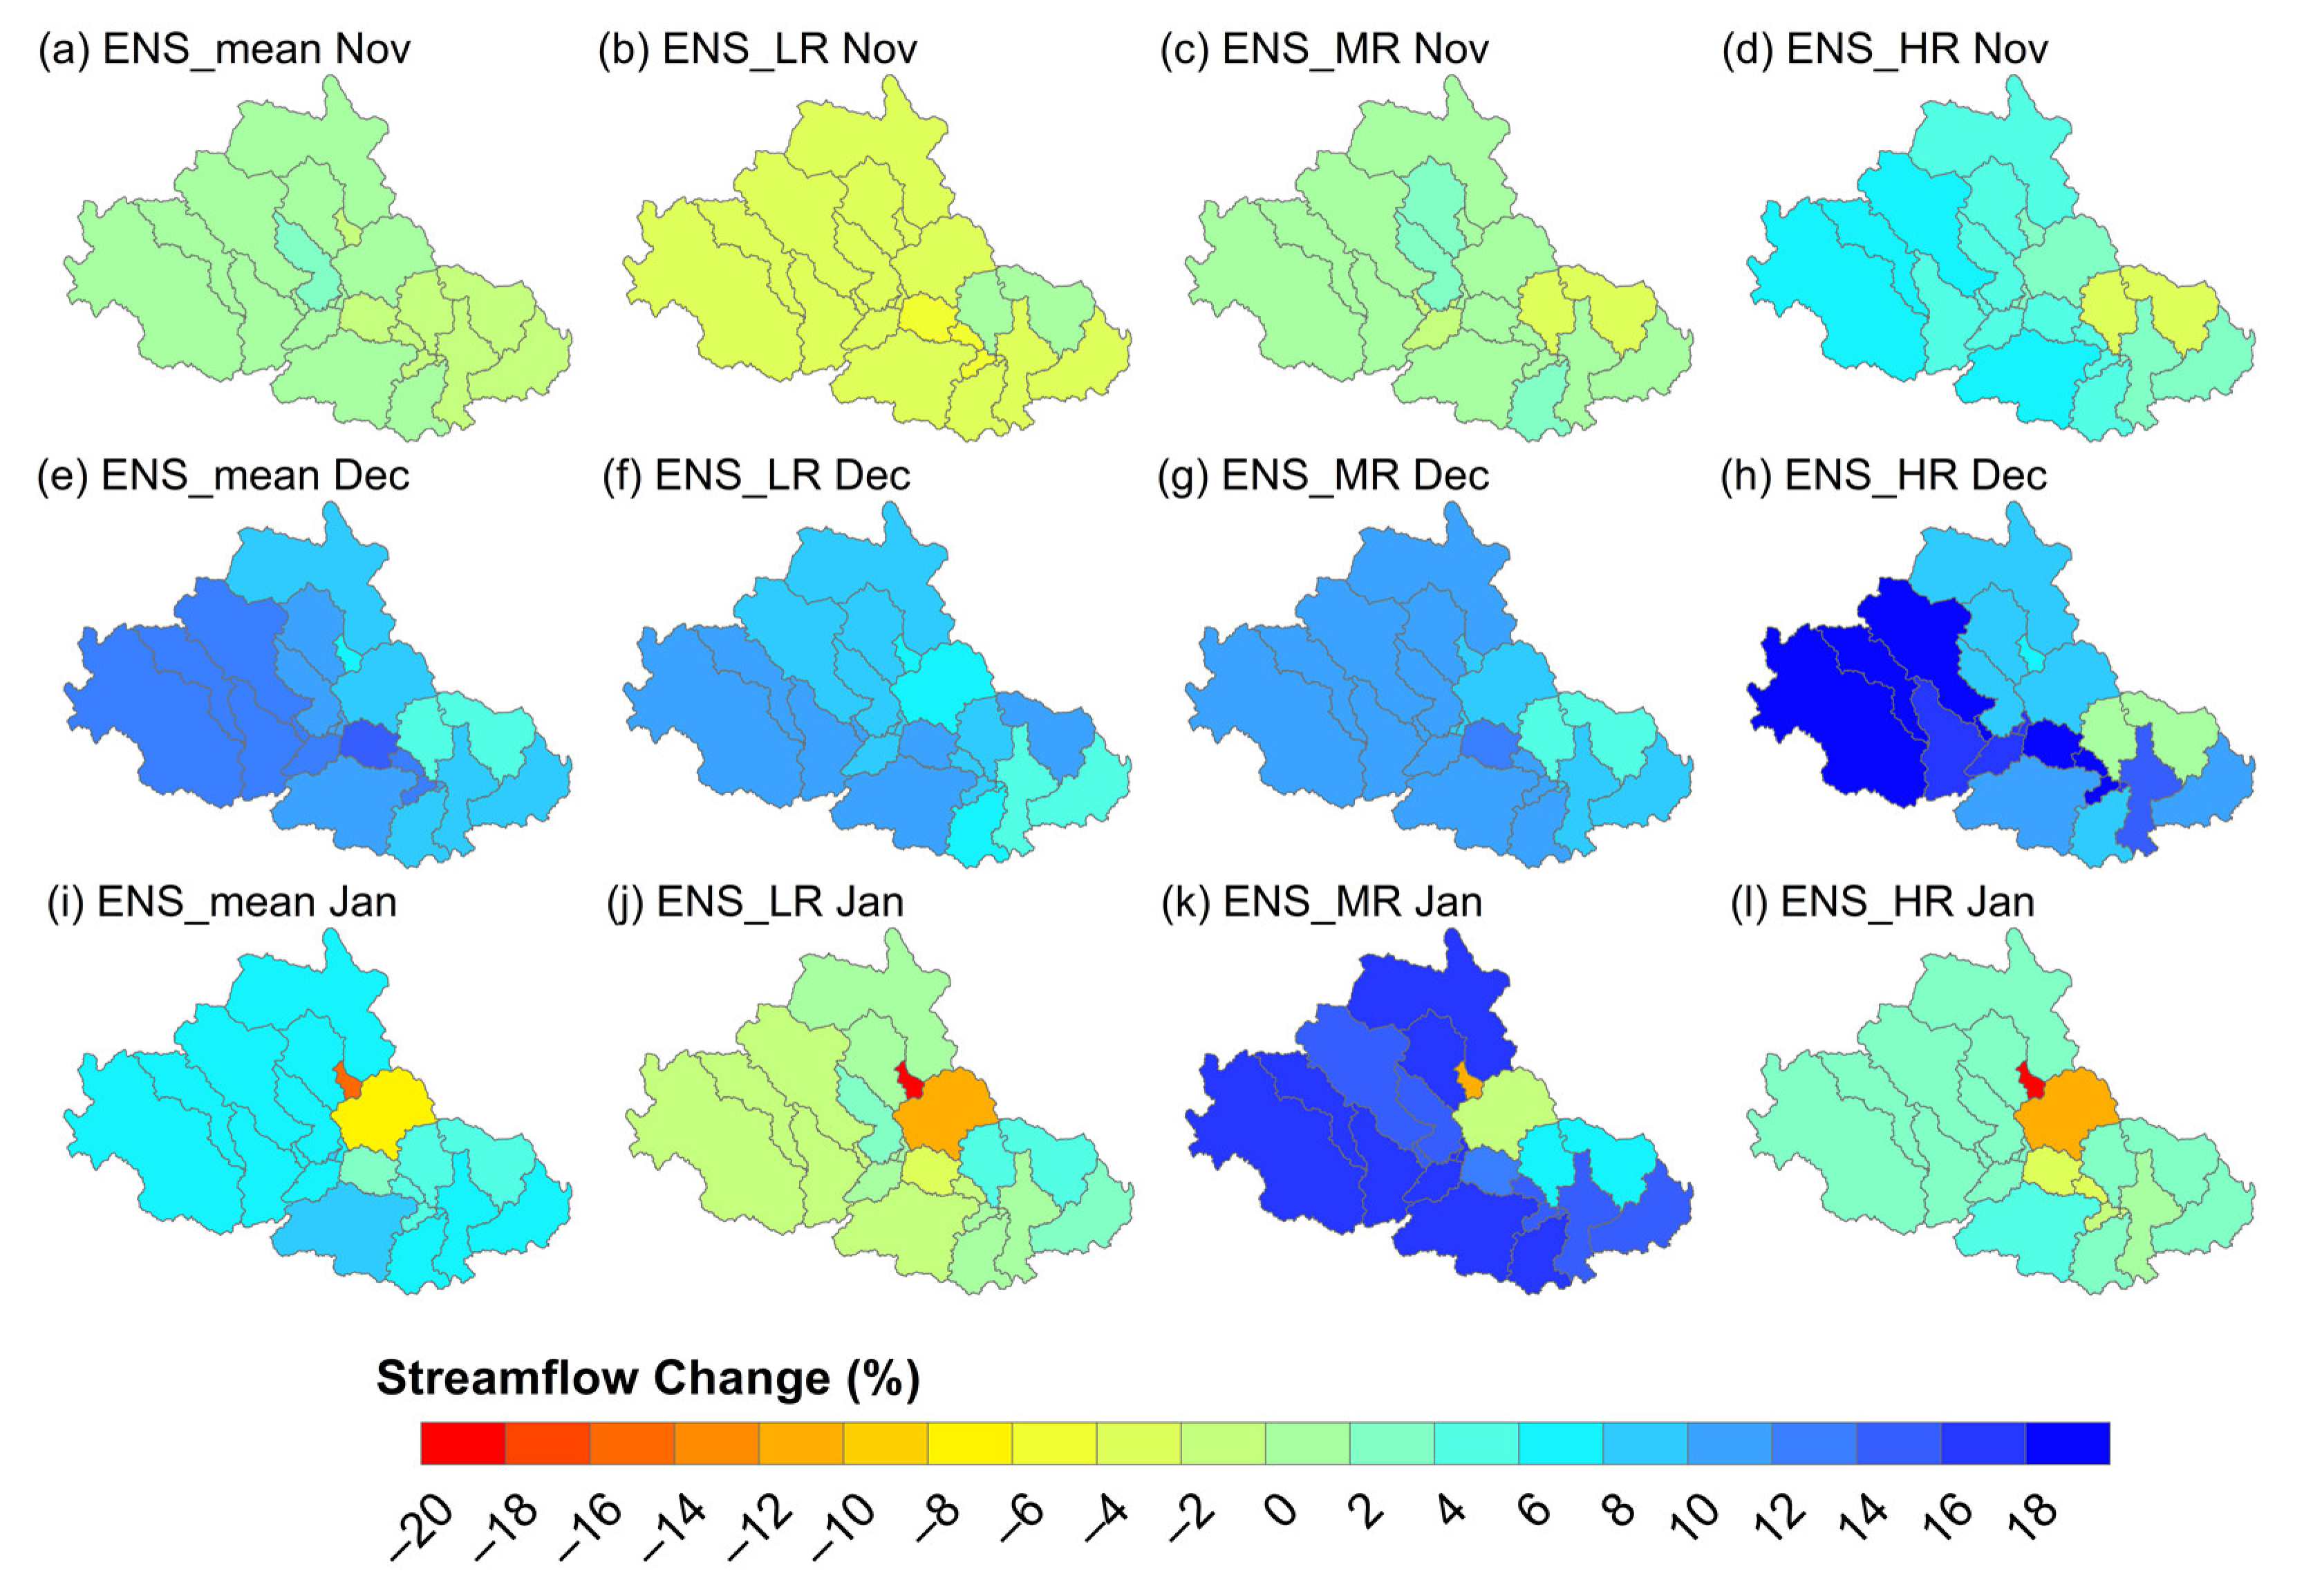
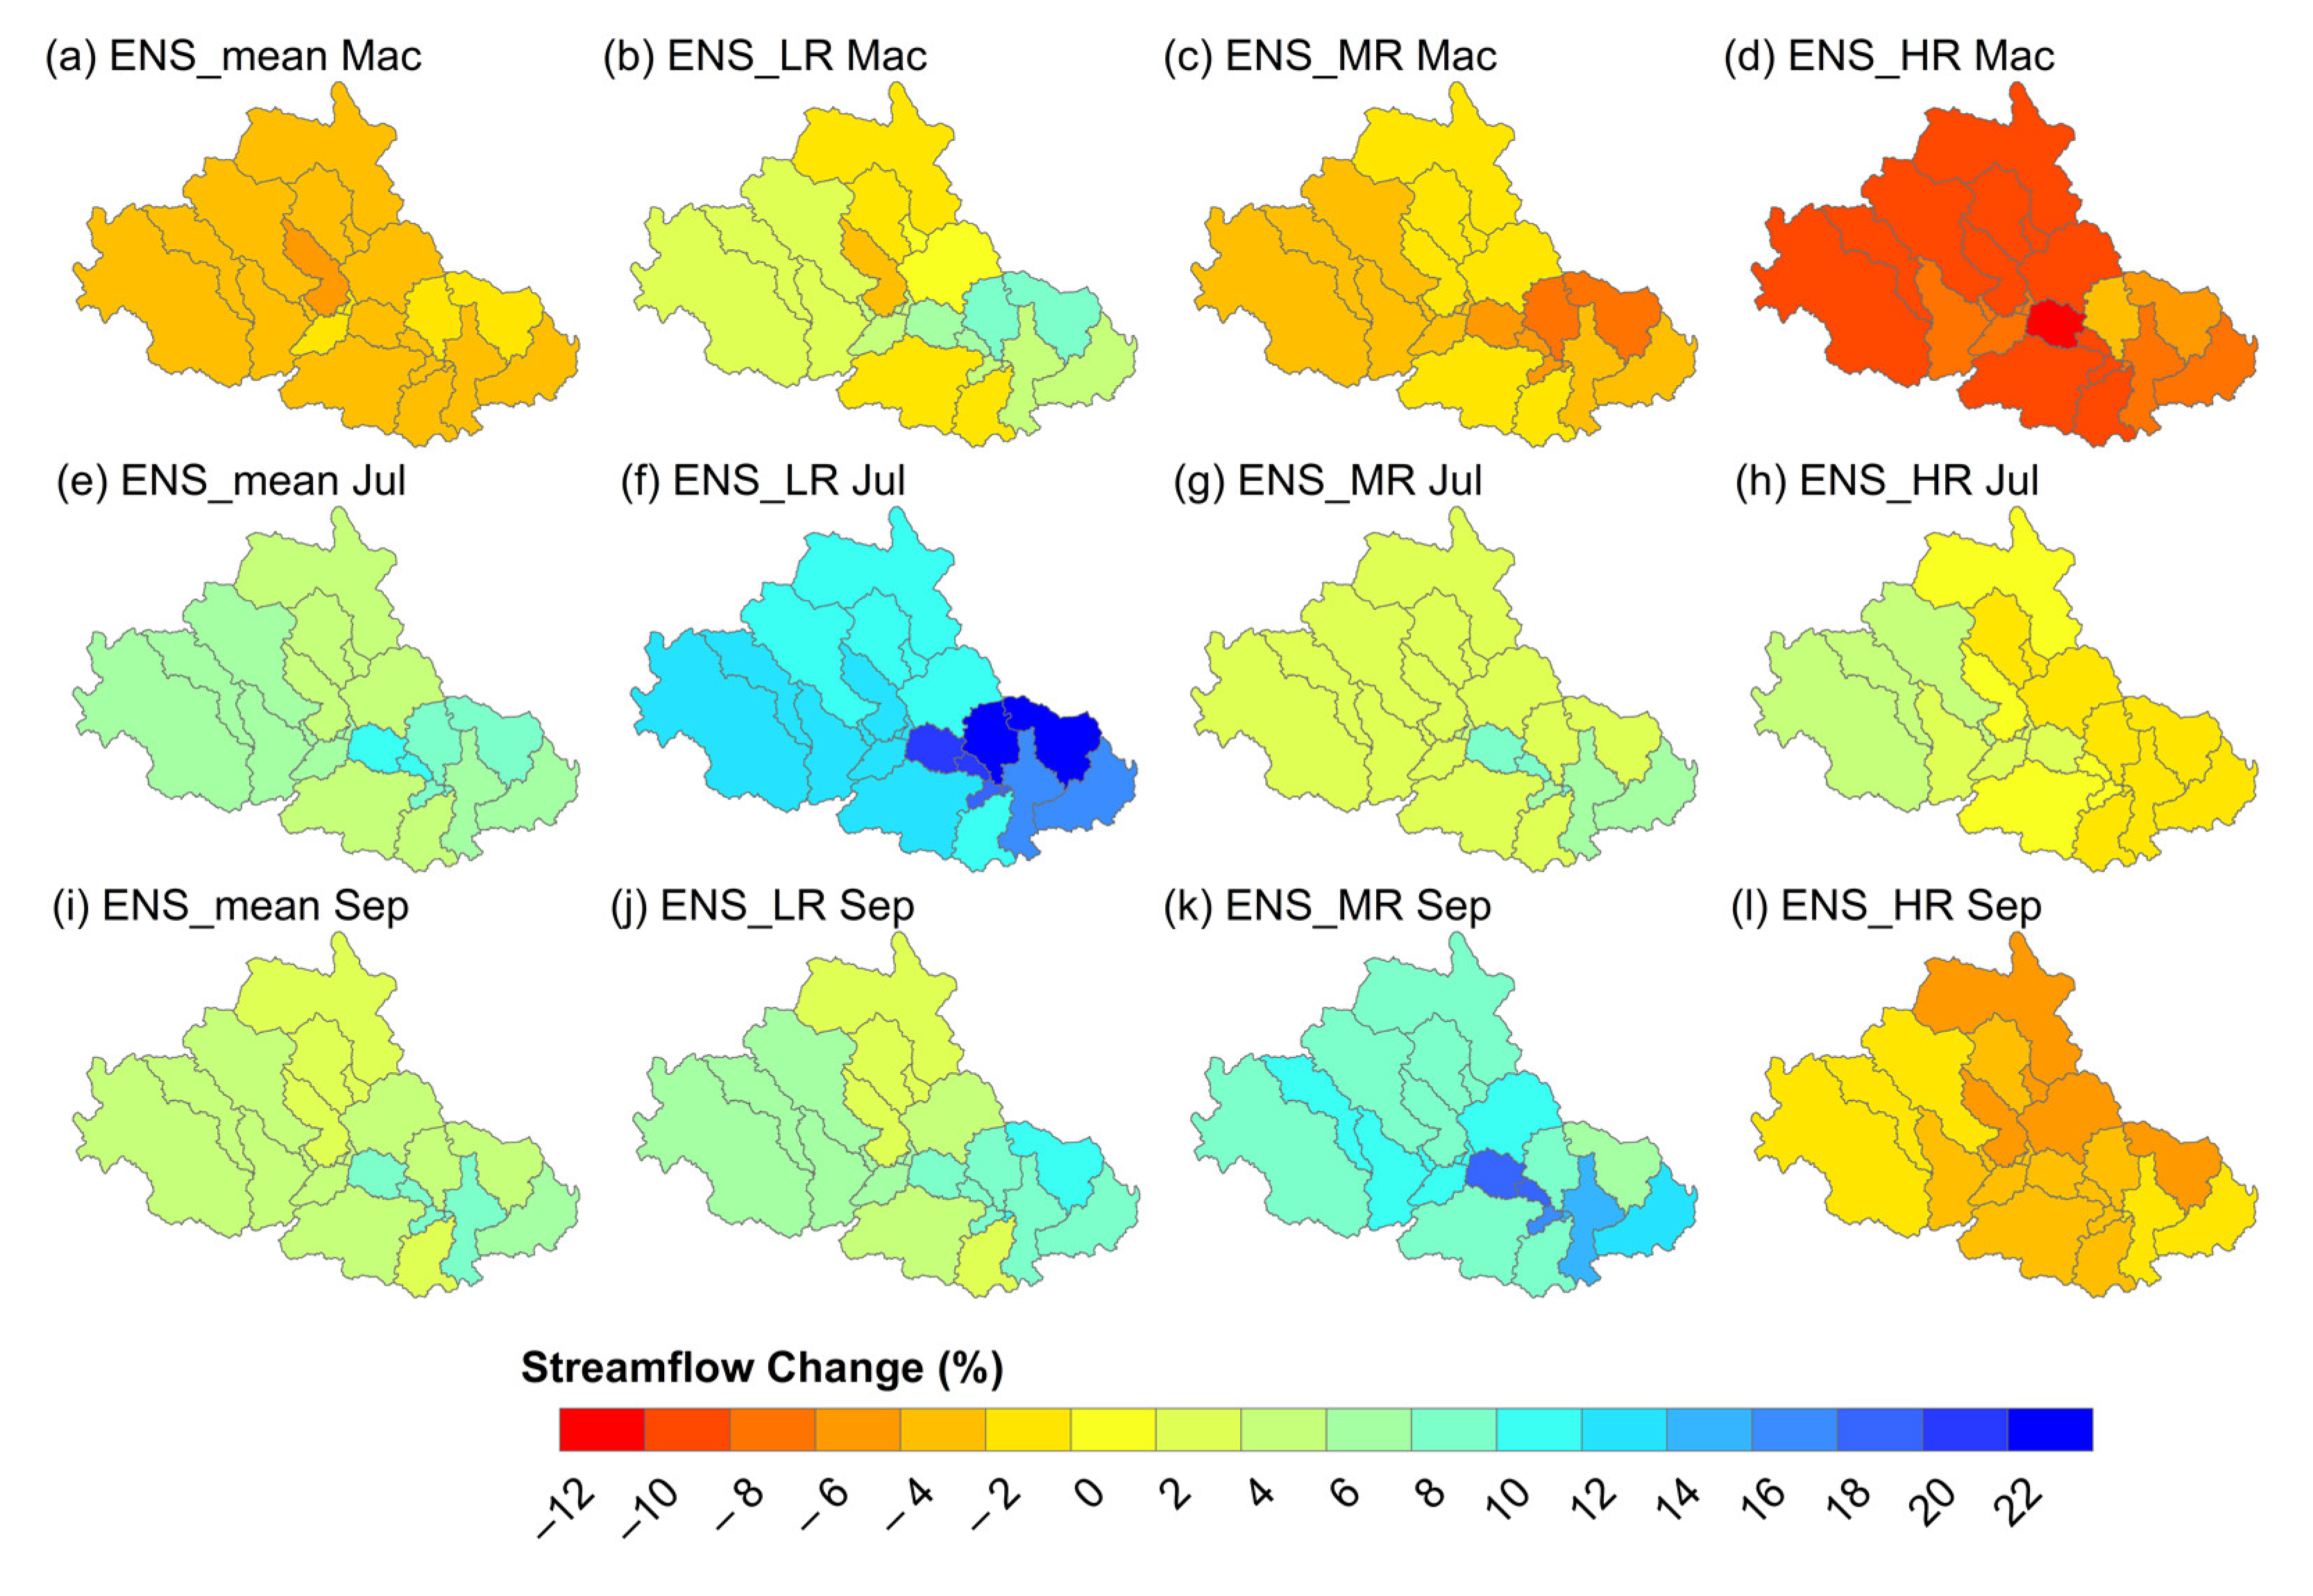
3.4. Hydrological Projections

Table 4 shows annual mean streamflow at the Rantau Panjang station is projected to increase from 0.9% for Ens_HR to 7.0% for Ens_MR under SSP5-8.5 by the 2021–2050 period relative to the 1985–2014 period, which is similar to the ensemble mean of CMIP5 models reported by Tan et al. [25]. Monthly mean streamflow is projected to increase during the flood period by 2.4% to 15.6% in January and 4.9% to 10.8% in December (Figure 5d), indicating that the intensity of floods may increase in the future. Figure 6 shows the monthly mean streamflow changes at sub-basin level during the flood period from November to January. A greater increment can be found mainly over the sub-basins located in the eastern and southern JRB. Figure 6a shows monthly mean streamflow increasing over most of the sub-basins, except Ens_LR which projects slight decreases.
For the dry period, Ens_HR projects that monthly mean streamflow at the Rantau Panjang station will decrease from March to July by 1.6% to 7.2% and September to October by 1.8% to 4.19% by the mid-21st century (Figure 5d). These results contrast with the lower resolution ensembles, except in March and April, indicating water scarcity issues will more likely occur in these 2 months. In March, drier conditions are observed over most of the river basin, apart from some sub-basins located in the western region (Figure 7). In July, Ens_LR shows a large increase of monthly mean streamflow across the sub-basins, while a slight decrease was projected by Ens_HR. These differences can be explained in part by the inter-model variation, where FGOALS-L projects dramatic increases of monthly mean streamflow up to 46.5% in the JRB during the dry period. By contrast, decreases of monthly mean streamflow during the dry period are mainly found in the Ens_HR.
Surface runoff is considered in this study since it is highly related to flood events. In general, annual mean surface runoff of the JRB is projected to increase in the mid-21st century by 7.0% to 20.6% across the model the ensemble. The majority of the HighResMIP models show increases in annual surface runoff, except CNRM and HadGEM3-HM. Figure 5e shows monthly mean surface runoff is projected to increase significantly in January (3.1 to 48.3%), May (10.7 to 67.8%), July (3.0 to 60.8%), August (11.9 to 32.4%) and December (28.8 to 39.9%) in all ensembles. Of particular note are the increases of surface runoff that are projected from May to September as shown in Figure 5e, which can be interpreted in the context of recent unusual flood events which have occurred in Johor during the southwest monsoon season [59]. However, severe floods occur almost every year in the early phase of the northeast monsoon (December/January) and the consistent projections of increased surface runoff those months may lead to enhanced flood damage.

4. Discussion

The SWAT model exhibited a better performance (Figure 2) during the period prior to reservoir management being introduced in 1993. Restriction of reservoir management data to the public or researchers is a common issue for many transboundary basins in developing and less developed countries [60], and further information is needed to improve the SWAT modelling in the regulated flow period. This study demonstrates that adding some basic reservoir and water supply information along with reservoir parameter calibration improved the SWAT capability in regulated flow simulation period. Kim and B. Parajuli [61] found that selection of a suitable reservoir outflow approach is important to accurately simulate the regulated streamflow. Zhang et al. [52] incorporated water usage information into SWAT to better simulate regulated flow under the absence of detailed reservoir management information. However, the reservoir module within SWAT is relatively simple and it can be difficult to provide reliable estimation of reservoir release [62]. Recently, reservoir operation functions have been integrated into the SWAT+ version, but this improvement is solely based on the operation of reservoirs within the United States. In future work, more comprehensive reservoir operational and parameter calibration modules need to be developed to cope with tropical conditions.
The analyses of KGE indicate that the SWAT model reasonably simulate both the unregulated and regulated flows (Figure 2). Noted that the KGE values are higher than the NSE and R2 values, but they cannot be compared directly since there is no unique relationship between them [63]. Additionally, high NSE values do not directly translate into high KGE values [63]. In general, NSE analysis leans towards informing the model’s capability in high flows simulation due to the quadratic nature of the analysis [64]. Figure 2 shows that the SWAT model underestimated some high flow periods during the regulated validation period. A lack of precipitation data in the upstream part of the JRB may lead to the model being unable to accurately capture the precipitation pattern, thus resulting in the underestimation.
In summary, Ens_HR has a slightly better ability to simulate the observed temperature data than the lower resolution model ensembles in the JRB. Consistent with the IPCC’s most recent assessment report [6], the estimated warming of the JRB is likely to increase around 1 °C by the mid-21st century (Table 1). We note that both the mean daily minimum and maximum temperatures are projected to increase at a similar rate, which is contrary with the observed historical trends in Malaysia. In fact, the observed rate of warming in minimum temperature actually increased about two-times greater than the maximum temperature from 1985 to 2018 over Malaysia as measured at multiple ground stations [30].
The HighResMIP GCMs showed a better capability in capturing temperature than precipitation over the JRB, and similar findings have been reported in other CMIP6 models [65]. The low-resolution models were unable to capture the seasonal precipitation cycle over the JRB accurately compared to the moderate- and high-resolution models. For example, FGOALS-L and HadGEM-LM underestimated precipitation during the southwest monsoon (May to September) and the second phase of the northeast monsoon (February to March) as shown in Figure 3a. This shows systematic wet biases are still existing in CMIP6 models in this region, particularly in the low resolution HighResMIP GCMs.
In hydro-climatic modelling, climate models are invariably cited with a larger uncertainty than hydrological models, calibration parameter and bias correction technique [66,67,68]. Streamflow and surface runoff are highly sensitive to changes in precipitation [69]. High resolution climate models have demonstrated the ability to better represent the large-scale atmospheric circulation, tropical instability waves, storm tracks, and other circulation features [35]. Mean monthly flows during the flood period (November to December) are projected to increase across all the ensembles, by 2.6 to 10.8% for Ens_HR and 0.2 to 15.6% for Ens_MR compared to −3.7 to 4.9% for Ens_LR (Figure 5d). Ens_HR suggests a reduction of monthly flows during the southwest monsoon, but Ens_MR and Ens_LR project wetter conditions such that improved hydro-climatic assessment in tropical region will require greater confidence in precipitation projections in the dry season as well as the wet season.

5. Conclusions

The ability to adapt to future changes in precipitation, water availability and flooding requires hydro-climatic projections at a local scale. This study incorporated the latest CMIP6 HighResMIP GCMs into a calibrated SWAT model to project the future hydro-climatic changes over the JRB, Malaysia, and investigate the role played by the spatial resolution of GCMs. Model projections were classified into different groups of multi-GCM ensemble, including of all simulations (Ens_Mean), low resolution (Ens_LR), medium resolution (Ens_MR) and high resolution (Ens_HR) HighResMIP groups. Changes in hydro-climatic features for both the dry and wet seasons were evaluated between a baseline (1985–2014) and mid-21st century period (2021–2050) using a high level GHG emissions scenario.
In the JRB, SWAT presented a good performance in producing the observed hydrological features, which was presented in terms of both unregulated and regulated (before and after the Linggiu reservoir was constructed) monthly streamflow. The CN2 parameter related to surface runoff was found to be the most sensitive parameter in this basin. We note that addition of reservoir parameters during calibration and water supply information in the model setup could improve SWAT’s performance where reservoir management data is not available. The SWAT model tended to underestimate both the high and low flows in this basin, showing that more studies are needed to improve the SWAT modelling in regulated flow simulations in the absence of reservoir management data.
Assessment of different GCM resolutions in simulating historical climate is required both as part of model development and to help in selecting better models for impact assessment and decision making, e.g., IPCC reports [6,70]. This spread in performance indicates that inter-model variability poses a significant challenge to accurate hydro-climatic impact assessment. Historical temperature is simulated somewhat better than precipitation by the HighResMIP GCMs over the JRB. The models simulated the primary precipitation peak one or two months earlier than observations. This bias was evident in the CMIP5 models and persists in the latest CMIP6 models, even in the high-resolution models. However, the moderate- and high-resolution models better capture the seasonal precipitation cycle compared to the low-resolution models. Our findings show that the low-resolution models had a larger uncertainty during the low rainfall period simulations as compared to high precipitation periods in this basin. In addition, the high-resolution models better represent minimum temperatures than the low-resolution models, though there is less spread in their ability to simulate maximum temperature simulations across different resolutions.
In the JRB, annual total precipitation is projected to increase by 0.4 to 3.1% across the variable resolution ensemble evaluated here. The high-resolution models, project increased precipitation during the flood period up to 13.4%, but a decrease of up to 11.9% was found during the dry period, indicating an amplification of the seasonal cycle. Annual mean daily minimum and maximum temperatures are projected to increase up to 0.9 °C and 1.1 °C, respectively, over the JRB. Associated with these changes in precipitation and temperature are projections of increases in annual streamflow and surface runoff from 0.9% to 7.0% and 7.0% to 20.6%, respectively. Similar to precipitation trend, monthly streamflow and surface runoff will likely be increased up to 15.6% and 48.3% during the flood period (November to January). The model experiments analyzed exhibit a certain degree of disagreement between high-resolution and low-resolution GCMs in the projected changes over during the dry period (February to March and May to September) in terms of precipitation, streamflow and surface runoff, while more consistent changes are seen during the wet seasons. The uncertainty is presented under a single GHG emission scenario due to the limited data availability of HighResMIP. Such an uncertainty is worth further investigation in future works using simulations of different SSP scenarios (SSP1-2.6, SSP2-4.5 and SSP3-7.0) and for a longer study period until the end of this century, though this can be strongly constrained by the limited computational resources, especially for high-resolution simulations.
Whilst this study has highlighted some limitations in the ability of state-of-the-art climate models to simulate the current climate in the JRB, it has shown that the models, particularly those with higher resolution, are able to reproduce the key hydrological features of the current climate. When those model outputs are used as inputs to a hydrological model and combined with future climate projections, they show some consistent patterns of hydro-climatic change which provide important information for the government and key stakeholders in the region in the context of adaptation. In particular, this study highlights an analysis framework that could be readily reproduced in other basins and extended to include other global and regional climate models.

Author Contributions

Conceptualization, M.L.T., J.L. and J.M.H.; methodology, M.L.T. and J.L.; software, M.L.T. and J.L.; validation, M.L.T. and J.L.; formal analysis, M.L.T., J.L., M.H. and J.M.H.; data curation, M.L.T. and J.L.; writing—original draft preparation, M.L.T.; writing—review and editing, J.L., M.H. and F.Z.; project administration, M.L.T. and J.M.H.; funding acquisition, M.L.T., J.M.H., M.H., R.R. and W.R.I. All authors have read and agreed to the published version of the manuscript.

Funding

This research was funded by Ministry of Higher Education Malaysia with project code: (NEWTON/1/2018/SS07/USM//1) (203.PHUMANITI.6780001) and Newton Fund of NERC, grant number NE/S002707/1 under the IMpacts of PRecipitation from Extreme StormS, Malaysia (IMPRESS-MALAYSIA) project. M.H. was funded by Meat and Livestock Australia (MLA), the Queensland Government through the Drought and Climate Adaptation Program, and University of Southern Queensland through the Northern Australian Climate Program (NACP). The NACP is coordinated by Roger Stone.

Institutional Review Board Statement

Not applicable.

Informed Consent Statement

Not applicable.

Data Availability Statement

The data presented in this study are available on request from the corresponding author.

Acknowledgments

The author also acknowledge the Department of Agriculture Malaysia, Department of Irrigation and Drainage Malaysia, Malaysian Meteorological Department for supplying the geospatial and hydro-climatic data.

Conflicts of Interest

The authors declare no conflict of interest.

References

  1. Praskievicz, S.; Chang, H. A review of hydrological modelling of basin-scale climate change and urban development impacts. Prog. Phys. Geogr. Earth Environ. 2009, 33, 650–671. [Google Scholar] [CrossRef]
  2. Tan, M.L.; Gassman, P.; Yang, X.; Haywood, J. A Review of SWAT Applications, Performance and Future Needs for Simulation of Hydro-Climatic Extremes. Adv. Water Resour. 2020, 143, 103662. [Google Scholar] [CrossRef]
  3. Xu, C.-Y. Climate Change and Hydrologic Models: A Review of Existing Gaps and Recent Research Developments. Water Resour. Manag. 1999, 13, 369–382. [Google Scholar] [CrossRef]
  4. Phillips, N.A. The general circulation of the atmosphere: A numerical experiment. Q. J. R. Meteorol. Soc. 1956, 82, 123–164. [Google Scholar] [CrossRef]
  5. Weart, S. The development of general circulation models of climate. Stud. Hist. Philos. Sci. Part B Stud. Hist. Philos. Mod. Phys. 2010, 41, 208–217. [Google Scholar] [CrossRef]
  6. IPCC. Summary for Policymakers. In Climate Change 2021: The Physical Science Basis. Contribution of Working Group I to the Sixth Assessment Report of the Intergovernmental Panel on Climate Change; Masson-Delmotte, V., Zhai, P., Pirani, A., Connors, S.L., Péan, C., Berger, S., Caud, N., Chen, Y., Goldfarb, L., Gomis, M.I., et al., Eds.; IPCC: Geneva, Switzerland, 2021. [Google Scholar]
  7. Eyring, V.; Bony, S.; Meehl, G.A.; Senior, C.A.; Stevens, B.; Stouffer, R.J.; Taylor, K.E. Overview of the Coupled Model Intercomparison Project Phase 6 (CMIP6) experimental design and organization. Geosci. Model Dev. 2016, 9, 1937–1958. [Google Scholar] [CrossRef] [Green Version]
  8. Iqbal, Z.; Shahid, S.; Ahmed, K.; Ismail, T.; Ziarh, G.F.; Chung, E.-S.; Wang, X. Evaluation of CMIP6 GCM rainfall in mainland Southeast Asia. Atmos. Res. 2021, 254, 105525. [Google Scholar] [CrossRef]
  9. Van Vuuren, D.P.; Edmonds, J.; Kainuma, M.; Riahi, K.; Thomson, A.; Hibbard, K.; Hurtt, G.C.; Kram, T.; Krey, V.; Lamarque, J.-F.; et al. The representative concentration pathways: An overview. Clim. Chang. 2011, 109, 5. [Google Scholar] [CrossRef]
  10. Riahi, K.; van Vuuren, D.P.; Kriegler, E.; Edmonds, J.; O’Neill, B.C.; Fujimori, S.; Bauer, N.; Calvin, K.; Dellink, R.; Fricko, O.; et al. The Shared Socioeconomic Pathways and their energy, land use, and greenhouse gas emissions implications: An overview. Glob. Environ. Chang. 2017, 42, 153–168. [Google Scholar] [CrossRef] [Green Version]
  11. Eyring, V.; Cox, P.M.; Flato, G.M.; Gleckler, P.J.; Abramowitz, G.; Caldwell, P.; Collins, W.D.; Gier, B.K.; Hall, A.D.; Hoffman, F.M.; et al. Taking climate model evaluation to the next level. Nat. Clim. Chang. 2019, 9, 102–110. [Google Scholar] [CrossRef] [Green Version]
  12. Srivastava, A.; Grotjahn, R.; Ullrich, P.A. Evaluation of historical CMIP6 model simulations of extreme precipitation over contiguous US regions. Weather. Clim. Extrem. 2020, 29, 100268. [Google Scholar] [CrossRef]
  13. Su, B.; Huang, J.; Mondal, S.K.; Zhai, J.; Wang, Y.; Wen, S.; Gao, M.; Lv, Y.; Jiang, S.; Jiang, T.; et al. Insight from CMIP6 SSP-RCP scenarios for future drought characteristics in China. Atmos. Res. 2021, 250, 105375. [Google Scholar] [CrossRef]
  14. Syvitski, J.P.M.; Cohen, S.; Kettner, A.J.; Brakenridge, G.R. How important and different are tropical rivers?—An overview. Geomorphology 2014, 227, 5–17. [Google Scholar] [CrossRef]
  15. Jahandideh-Tehrani, M.; Zhang, H.; Helfer, F.; Yu, Y. Review of climate change impacts on predicted river streamflow in tropical rivers. Environ. Monit. Assess. 2019, 191, 752. [Google Scholar] [CrossRef]
  16. Awotwi, A.; Annor, T.; Anornu, G.K.; Quaye-Ballard, J.A.; Agyekum, J.; Ampadu, B.; Nti, I.K.; Gyampo, M.A.; Boakye, E. Climate change impact on streamflow in a tropical basin of Ghana, West Africa. J. Hydrol. Reg. Stud. 2021, 34, 100805. [Google Scholar] [CrossRef]
  17. Rodrigues, J.A.M.; Viola, M.R.; Alvarenga, L.A.; de Mello, C.R.; Chou, S.C.; de Oliveira, V.A.; Uddameri, V.; Morais, M.A.V. Climate change impacts under representative concentration pathway scenarios on streamflow and droughts of basins in the Brazilian Cerrado biome. Int. J. Climatol. 2020, 40, 2511–2526. [Google Scholar] [CrossRef]
  18. Tan, M.L.; Ibrahim, A.L.; Yusop, Z.; Chua, V.P.; Chan, N.W. Climate change impacts under CMIP5 RCP scenarios on water resources of the Kelantan River Basin, Malaysia. Atmos. Res. 2017, 189, 1–10. [Google Scholar] [CrossRef]
  19. Lebel, T.; Delclaux, F.; Le Barbé, L.; Polcher, J. From GCM scales to hydrological scales: Rainfall variability in West Africa. Stoch. Environ. Res. Risk Assess. 2000, 14, 275–295. [Google Scholar] [CrossRef]
  20. Tan, M.L.; Liang, J.; Samat, N.; Chan, N.W.; Haywood, J.M.; Hodges, K. Hydrological Extremes and Responses to Climate Change in the Kelantan River Basin, Malaysia, Based on the CMIP6 HighResMIP Experiments. Water 2021, 13, 1472. [Google Scholar] [CrossRef]
  21. Heng, H.H.; Pan, W.F.; Siaw, F.L.; Hii, C.P. Coastal and Estuary Reservoir: Case Studies for Johor River Basin. J. Civ. Eng. Sci. Technol. 2017, 8, 25–40. [Google Scholar] [CrossRef] [Green Version]
  22. Bernama. Drought Hits Johor Dam, Water Rationing for 15,000 in Kota Tinggi. 2019. Available online: https://www.freemalaysiatoday.com/category/nation/2019/03/12/drought-hits-johor-dam-water-rationing-for-15000-in-kota-tinggi/ (accessed on 11 September 2021).
  23. Chuah, C.J.; Ho, B.H.; Chow, W.T.L. Trans-boundary variations of urban drought vulnerability and its impact on water resource management in Singapore and Johor, Malaysia. Environ. Res. Lett. 2018, 13, 074011. [Google Scholar] [CrossRef]
  24. Kia, M.B.; Pirasteh, S.; Pradhan, B.; Mahmud, A.R.; Sulaiman, W.N.A.; Moradi, A. An artificial neural network model for flood simulation using GIS: Johor River Basin, Malaysia. Environ. Earth Sci. 2012, 67, 251–264. [Google Scholar] [CrossRef]
  25. Tan, M.L.; Ficklin, D.; Ibrahim, A.L.; Yusop, Z. Impacts and uncertainties of climate change on streamflow of the Johor River Basin, Malaysia using a CMIP5 General Circulation Model ensemble. J. Water Clim. Chang. 2014, 5, 676–695. [Google Scholar] [CrossRef]
  26. Tan, M.L.; Juneng, L.; Tangang, F.T.; Chan, N.W.; Ngai, S.T. Future hydro-meteorological drought of the Johor River Basin, Malaysia, based on CORDEX-SEA projections. Hydrol. Sci. J. 2019, 64, 921–933. [Google Scholar] [CrossRef]
  27. Bressiani, D.A.; Gassman, P.W.; Fernandes, J.G.; Garbossa, L.H.P.; Srinivasan, R.; Bonumá, N.B.; Mendiondo, E.M. Review of Soil and Water Assessment Tool (SWAT) applications in Brazil: Challenges and prospects. Int. J. Agric. Biol. Eng. 2015, 8, 9–35. [Google Scholar] [CrossRef]
  28. Gassman, P.W.; Reyes, M.R.; Green, C.H.; Arnold, J.G. The Soil and Water Assessment Tool: Historical Development, Applications, and Future Research Directions. Trans. ASABE 2007, 50, 1211–1250. [Google Scholar] [CrossRef] [Green Version]
  29. Tan, M.L.; Gassman, P.W.; Srinivasan, R.; Arnold, J.G.; Yang, X. A Review of SWAT Studies in Southeast Asia: Applications, Challenges and Future Directions. Water 2019, 11, 914. [Google Scholar] [CrossRef] [Green Version]
  30. Tan, M.L.; Juneng, L.; Tangang, F.T.; Chung, J.X.; Radin Firdaus, R.B. Changes in Temperature Extremes and Their Relationship with ENSO in Malaysia from 1985 to 2018. Int. J. Climatol. 2021, 41, E2564–E2580. [Google Scholar] [CrossRef]
  31. Tan, M.L.; Ibrahim, A.L.; Yusop, Z.; Duan, Z.; Ling, L. Impacts of land-use and climate variability on hydrological components in the Johor River basin, Malaysia. Hydrol. Sci. J. 2015, 60, 873–889. [Google Scholar] [CrossRef]
  32. Heng, H.H.; Hii, C.P.; Siaw, F.L.; Pan, W.F. Reservoir Yield Analysis Using Multiple Variable Regression Screening Model and Its Comparison: A Study of 28 Water Supply Dams in Malaysia. J. Eng. Technol. Adv. 2018, 3, 35–74. [Google Scholar]
  33. Tan, M.L.; Chua, V.P.; Li, C.; Brindha, K. Spatiotemporal analysis of hydro-meteorological drought in the Johor River Basin, Malaysia. Theor. Appl. Climatol. 2019, 135, 825–837. [Google Scholar] [CrossRef]
  34. Arnold, J.; Moriasi, D.; Gassman, P.; Abbaspour, K.C.; White, M.; Srinivasan, R.; Santhi, C.; Harmel, R.D.; van Griensven, A.; Van Liew, M.; et al. SWAT: Model use, calibration, and validation. Trans. ASABE 2012, 55, 1491–1508. [Google Scholar] [CrossRef]
  35. Haarsma, R.J.; Roberts, M.J.; Vidale, P.L.; Senior, C.A.; Bellucci, A.; Bao, Q.; Chang, P.; Corti, S.; Fučkar, N.S.; Guemas, V.; et al. High Resolution Model Intercomparison Project (HighResMIP v1.0) for CMIP6. Geosci. Model Dev. 2016, 9, 4185–4208. [Google Scholar] [CrossRef] [Green Version]
  36. Murphy, J. An Evaluation of Statistical and Dynamical Techniques for Downscaling Local Climate. J. Clim. 1999, 12, 2256–2284. [Google Scholar] [CrossRef]
  37. Musie, M.; Sen, S.; Srivastava, P. Application of CORDEX-AFRICA and NEX-GDDP datasets for hydrologic projections under climate change in Lake Ziway sub-basin, Ethiopia. J. Hydrol. Reg. Stud. 2020, 31, 100721. [Google Scholar] [CrossRef]
  38. Pandey, V.P.; Dhaubanjar, S.; Bharati, L.; Thapa, B.R. Hydrological response of Chamelia watershed in Mahakali Basin to climate change. Sci. Total Environ. 2019, 650, 365–383. [Google Scholar] [CrossRef]
  39. Arnold, J.G.; Srinivasan, R.; Muttiah, R.S.; Williams, J.R. Large area hydrologic modeling and assessment part I: Model development. JAWRA J. Am. Water Resour. Assoc. 1998, 34, 73–89. [Google Scholar] [CrossRef]
  40. Krysanova, V.; White, M. Advances in water resources assessment with SWAT—An overview. Hydrol. Sci. J. 2015, 60, 771–783. [Google Scholar] [CrossRef] [Green Version]
  41. CARD. SWAT Literature Database for Peer-Reviewed Journal Articles; Center for Agricultural and Rural Development, Iowa State University: Ames, IA, USA; Available online: https://www.card.iastate.edu/swat_articles/ (accessed on 31 June 2021).
  42. Gassman, P.W.; Wang, Y. IJABE SWAT Special Issue: Innovative modeling solutions for water resource problems. Int. J. Agric. Biol. Eng. 2015, 8, 1–8. [Google Scholar] [CrossRef]
  43. Akhavan, S.; Abedi Koupaei, J.; Mousavi, S.F.; Abbaspour, K.; Afyuni, M.; Eslamian, S.S. Estimation of Blue Water and Green Water Using SWAT Model in Hamadan-Bahar Watershed. Water Soil Sci. 2010, 14, 9–23. [Google Scholar]
  44. Moriasi, D.N.; Gitau, M.W.; Pai, N.; Daggupati, P. Hydrologic and water quality models: Performance measures and evaluation criteria. Trans. ASABE 2015, 58, 1763–1785. [Google Scholar] [CrossRef] [Green Version]
  45. Kiesel, J.; Kakouei, K.; Guse, B.; Fohrer, N.; Jähnig, S.C. When is a hydrological model sufficiently calibrated to depict flow preferences of riverine species? Ecohydrology 2020, 13, e2193. [Google Scholar] [CrossRef] [Green Version]
  46. Radcliffe, D.E.; Mukundan, R. PRISM vs. CFSR Precipitation Data Effects on Calibration and Validation of SWAT Models. JAWRA J. Am. Water Resour. Assoc. 2017, 53, 89–100. [Google Scholar] [CrossRef]
  47. Gupta, H.V.; Kling, H.; Yilmaz, K.K.; Martinez, G.F. Decomposition of the mean squared error and NSE performance criteria: Implications for improving hydrological modelling. J. Hydrol. 2009, 377, 80–91. [Google Scholar] [CrossRef] [Green Version]
  48. Thiemig, V.; Rojas, R.; Zambrano-Bigiarini, M.; De Roo, A. Hydrological evaluation of satellite-based rainfall estimates over the Volta and Baro-Akobo Basin. J. Hydrol. 2013, 499, 324–338. [Google Scholar] [CrossRef]
  49. Kouchi, D.H.; Esmaili, K.; Faridhosseini, A.; Sanaeinejad, S.H.; Khalili, D.; Abbaspour, K.C. Sensitivity of Calibrated Parameters and Water Resource Estimates on Different Objective Functions and Optimization Algorithms. Water 2017, 9, 384. [Google Scholar] [CrossRef] [Green Version]
  50. Abbaspour, K.C.; Vejdani, M.; Haghighat, S. SWAT-CUP calibration and uncertainty programs for SWAT. In MODSIM07 International Congress on Modelling and Simulation “Land, Water and Environmental Management: Integrated Systems for Sustainability”, Christchurch, New Zealand, 10–13 December 2007; Modelling and Simulation Society of Australia and New Zealand: Sydney, Australia, 2007; Volume 364, pp. 1603–1609. [Google Scholar]
  51. Tan, M.L.; Samat, N.; Chan, N.W.; Roy, R. Hydro-Meteorological Assessment of Three GPM Satellite Precipitation Products in the Kelantan River Basin, Malaysia. Remote Sens. 2018, 10, 1011. [Google Scholar] [CrossRef] [Green Version]
  52. Zhang, D.; Tan, M.L.; Dawood, S.R.S.; Samat, N.; Chang, C.K.; Roy, R.; Tew, Y.L.; Mahamud, M.A. Comparison of NCEP-CFSR and CMADS for Hydrological Modelling Using SWAT in the Muda River Basin, Malaysia. Water 2020, 12, 3288. [Google Scholar] [CrossRef]
  53. Sharannya, T.M.; Al-Ansari, N.; Deb Barma, S.; Mahesha, A. Evaluation of Satellite Precipitation Products in Simulating Streamflow in a Humid Tropical Catchment of India Using a Semi-Distributed Hydrological Model. Water 2020, 12, 2400. [Google Scholar] [CrossRef]
  54. Yesuf, H.M.; Melesse, A.M.; Zeleke, G.; Alamirew, T. Streamflow prediction uncertainty analysis and verification of SWAT model in a tropical watershed. Environ. Earth Sci. 2016, 75, 806. [Google Scholar] [CrossRef]
  55. Neitsch, S.L.; Arnold, J.G.; Kiniry, J.R.; Grassland, J.R.W. Soil and Water Assessment Tool Theoretical Documentation Version 2009; Agricultural Research Service Blackland Research Center: Temple, TX, USA, 2011. [Google Scholar]
  56. Moriasi, D.N.; Arnold, J.G.; Van Liew, M.W.; Bingner, R.L.; Harmel, R.D.; Veith, T.L. Model Evaluation Guidelines for Systematic Quantification of Accuracy in Watershed Simulations. Trans. ASABE 2007, 50, 885–900. [Google Scholar] [CrossRef]
  57. Liang, J.; Catto, J.L.; Hawcroft, M.; Hodges, K.I.; Tan, M.L.; Haywood, J.M. Climatology of Borneo Vortices in the HadGEM3-GC3.1 General Circulation Model. J. Clim. 2021, 34, 3401–3419. [Google Scholar] [CrossRef]
  58. Squintu, A.A.; van der Schrier, G.; van den Besselaar, E.; van der Linden, E.; Putrasahan, D.; Roberts, C.; Roberts, M.; Scoccimarro, E.; Senan, R.; Klein Tank, A. Evaluation of trends in extreme temperatures simulated by HighResMIP models across Europe. Clim. Dyn. 2021, 56, 2389–2412. [Google Scholar] [CrossRef]
  59. Kaur, M. Unusual to Have Floods in Johor Now, Says Weather Expert. 2020. Available online: https://www.freemalaysiatoday.com/category/nation/2020/06/21/unusual-to-have-floods-in-johor-now-says-weather-expert/ (accessed on 15 September 2021).
  60. Hu, J.; Ma, J.; Nie, C.; Xue, L.; Zhang, Y.; Ni, F.; Deng, Y.; Liu, J.; Zhou, D.; Li, L.; et al. Attribution Analysis of Runoff Change in Min-Tuo River Basin based on SWAT model simulations, China. Sci. Rep. 2020, 10, 2900. [Google Scholar] [CrossRef] [Green Version]
  61. Kim, H.; Parajuli, P.B. Impacts of Reservoir Outflow Estimation Methods in SWAT Model Calibration. Trans. ASABE 2014, 57, 1029–1042. [Google Scholar] [CrossRef]
  62. Wu, J.; Yen, H.; Arnold, J.G.; Yang, Y.C.E.; Cai, X.; White, M.J.; Santhi, C.; Miao, C.; Srinivasan, R. Development of reservoir operation functions in SWAT+ for national environmental assessments. J. Hydrol. 2020, 583, 124556. [Google Scholar] [CrossRef]
  63. Knoben, W.J.M.; Freer, J.E.; Woods, R.A. Technical note: Inherent benchmark or not? Comparing Nash–Sutcliffe and Kling–Gupta efficiency scores. Hydrol. Earth Syst. Sci. 2019, 23, 4323–4331. [Google Scholar] [CrossRef] [Green Version]
  64. Adeyeri, O.E.; Laux, P.; Arnault, J.; Lawin, A.E.; Kunstmann, H. Conceptual hydrological model calibration using multi-objective optimization techniques over the transboundary Komadugu-Yobe basin, Lake Chad Area, West Africa. J. Hydrol. Reg. Stud. 2020, 27, 100655. [Google Scholar] [CrossRef]
  65. Kamruzzaman, M.; Shahid, S.; Islam, A.R.M.T.; Hwang, S.; Cho, J.; Zaman, M.A.U.; Ahmed, M.; Rahman, M.M.; Hossain, M.B. Comparison of CMIP6 and CMIP5 model performance in simulating historical precipitation and temperature in Bangladesh: A preliminary study. Theor. Appl. Climatol. 2021, 145, 1385–1406. [Google Scholar] [CrossRef]
  66. Gosling, S.N.; Taylor, R.G.; Arnell, N.W.; Todd, M.C. A comparative analysis of projected impacts of climate change on river runoff from global and catchment-scale hydrological models. Hydrol. Earth Syst. Sci. 2011, 15, 279–294. [Google Scholar] [CrossRef] [Green Version]
  67. Hattermann, F.F.; Vetter, T.; Breuer, L.; Su, B.; Daggupati, P.; Donnelly, C.; Fekete, B.; Flörke, F.; Gosling, S.N.; Hoffmann, P.; et al. Sources of uncertainty in hydrological climate impact assessment: A cross-scale study. Environ. Res. Lett. 2018, 13, 015006. [Google Scholar] [CrossRef]
  68. Her, Y.; Yoo, S.-H.; Cho, J.; Hwang, S.; Jeong, J.; Seong, C. Uncertainty in hydrological analysis of climate change: Multi-parameter vs. multi-GCM ensemble predictions. Sci. Rep. 2019, 9, 4974. [Google Scholar] [CrossRef] [PubMed] [Green Version]
  69. Teng, J.; Vaze, J.; Chiew, F.H.S.; Wang, B.; Perraud, J.-M. Estimating the Relative Uncertainties Sourced from GCMs and Hydrological Models in Modeling Climate Change Impact on Runoff. J. Hydrometeorol. 2012, 13, 122–139. [Google Scholar] [CrossRef]
  70. IPCC. Global Warming of 1.5 °C. An IPCC Special Report on the Impacts of Global Warming of 1.5°C above Pre-Industrial Levels and Related Global Greenhouse Gas Emission Pathways, In the Context of Strengthening the Global Response to the Threat of Climate Change, Sustainable Development, and Efforts to Eradicate Poverty; IPCC: Geneva, Switzerland, 2018. [Google Scholar]
Figure 1. The location of (a) the Johor River Basin, (b) Peninsular Malaysia and (c) part of Southeast Asia.
Water 13 03158 g001
Figure 2. (a) SWAT calibration and validation at the Rantau Panjang station for monthly streamflow from 1985 to 2014, and comparisons between observed and simulated streamflow for (b) validation 1, (c) calibration and (d) validation 2 periods.
Water 13 03158 g002
Figure 3. Original and bias corrected monthly mean (a,d) precipitation, (b,e) minimum temperature and (c,f) maximum temperature over the Johor River Basin during the period of 1985 to 2014.
Water 13 03158 g003
Figure 4. Comparison of mean monthly streamflow from observation, SWAT-simulated with gauge and corrected CMIP6 HighResMIP projections at the Rantau Panjang station from 1985 to 2014.
Water 13 03158 g004
Figure 5. Changes in monthly (a) precipitation, (b) minimum temperature, (c) maximum temperature, (d) streamflow at Rantau Panjang station and (e) surface runoff of the Johor River Basin under the CMIP6 HighResMIP projections between 2021–2050 and 1985–2014.
Water 13 03158 g005
Figure 6. The percentage change of monthly streamflow during the flood periods of November (ad), December (eh) and January (il) projected by the CMIP6 HighResMIP models.
Water 13 03158 g006
Figure 7. The spatial percent change of monthly streamflow during the dry periods of March (ad), July (eh) and September (il) projected by the CMIP6 HighResMIP models.
Water 13 03158 g007
Table 1. Summary of the GCMs used in this study from the CMIP6 HighResMIP experiments. LR, MR and HR represent low, medium and high resolutions, respectively.
NoSymbolModelResolution (Longitude × Latitude)Organization
1CNRMCNRM-CM6-1LR—1.406° × 1.406°French National Centre for Meteorological Research
2CNRM-HRHR—0.5° × 0.5°
3EC-EarthEC-Earth3PMR—0.703° × 0.703°27 institutes in Europe
4FGOALS-LFGOALS-f3LR—1.25° × 1°Institute of Atmospheric Physics/Chinese Academy of Sciences
5GFDLGFDL-CM4C192MR—0.625° × 0.5°Geophysical Fluid Dynamics Laboratory/NOAA (U.S.)
6HadGEM3-LMHadGEM3-GC31LR—1.875° × 1.25°The UK Met Office Hadley Centre for Climate Change
7HadGEM3-MMMR—0.83° × 0.56°
8HadGEM3-HMHR—0.35° × 0.23°
9MRI-HMRI-AGCM3-2MR—0.563° × 0.563°Meteorological Research Institute (Japan)
10MRI-SHR—0.188° × 0.188°
Table 2. Final SWAT performance rating as recommended by Moriasi et al. [44] and Kouchi et al. [49].
MethodVery GoodGoodSatisfactoryNot Satisfactory
R2>0.850.75 < R2 ≤ 0.850.60 < R2 ≤ 0.75≤0.60
NSE>0.800.65 < NSE ≤ 0.800.50 < NSE ≤ 0.70≤0.50
RB (%)>±5.00±5.00 < RB ≤ ±10.00±10.00 < RB ≤ ±15.00≥±15.00
KGE>0.900.75 ≤ R2 < 0.900.50 ≤ R2 < 0.75<0.50
Table 3. Calibrated SWAT parameters for the Johor River Basin.
NoParameterNameOptimalMinMax
1R__CN2.mgtInitial SCS CN II value−0.31−0.50.5
2V__ESCO.hruSoil evaporation compensation factor0.9601
3V__CH_N2.rteManning’s n for main channel0.2800.3
4V__CANMX.hruMaximum canopy storage6.92010
5V__GW_REVAP.gwGroundwater “revap” coefficient0.180.020.2
6R__SOL_Z(..).solDepth from soil surface to bottom of layer−0.30−0.50.5
7V__GW_DELAY.gwGroundwater delay120.380500
8R__SOL_AWC(..).solAvailable water capacity−0.50−0.50.5
9V__OFLOWMX(..).resMaximum daily outflow for the month1835.5002000
10R__SLSUBBSN.hruAverage slope length−0.46−0.50.5
11R__SOL_K(..).solSaturated hydraulic conductivity0.50−0.50.5
12V__RCHRG_DP.gwDeep aquifer percolation fraction0.3101
13R__SOL_BD(..).solMoist bulk density0.03−0.50.5
14V__OFLOWMN(..).resMinimum daily outflow for the month36.7501000
15R__HRU_SLP.hruAverage slope steepness−0.24−0.50.5
V_ indicates the original parameter value is replaced with the given value, R indicates the parameter value is multiplied with 1 + the given value.
Table 4. Changes in annual total precipitation, annual mean daily minimum temperature and maximum temperature, streamflow at Rantau Panjang station and surface runoff under CMIP6 HighResMIP projections over the Johor River Basin between 2021 and 2050 and 1985 and 2014.
TypeSymbolPrecipitation (%)Minimum Temperature (°C)Maximum Temperature (°C)Streamflow (%)Surface Runoff (%)
Ens_Mean2.10.81.04.115.2
Ens_LR2.40.80.93.115.6
Ens_MR3.10.80.97.020.6
Ens_HR0.40.91.10.97.0
LRCNRM−2.70.81.1−10.7−5.8
HRCNRM-HR0.41.01.1−1.31.9
MREC-Earth1.51.00.92.710.6
LRFGOALS-L8.30.70.719.331.6
MRGFDL7.80.91.118.847.7
LRHadGEM3-LM1.50.81.00.820.4
MRHadGEM3-MM1.90.91.15.620.4
HRHadGEM3-HM−2.71.01.3−5.6−6.8
MRMRI-H1.20.70.70.95.0
HRMRI-S3.60.80.89.726.2
Publisher’s Note: MDPI stays neutral with regard to jurisdictional claims in published maps and institutional affiliations.

