
Comparison of Different Procedures for Separating Microplastics from Sediments


Abstract
:
1. Introduction
2. Materials and Methods
2.1. Preparation of “Spiked Samples”
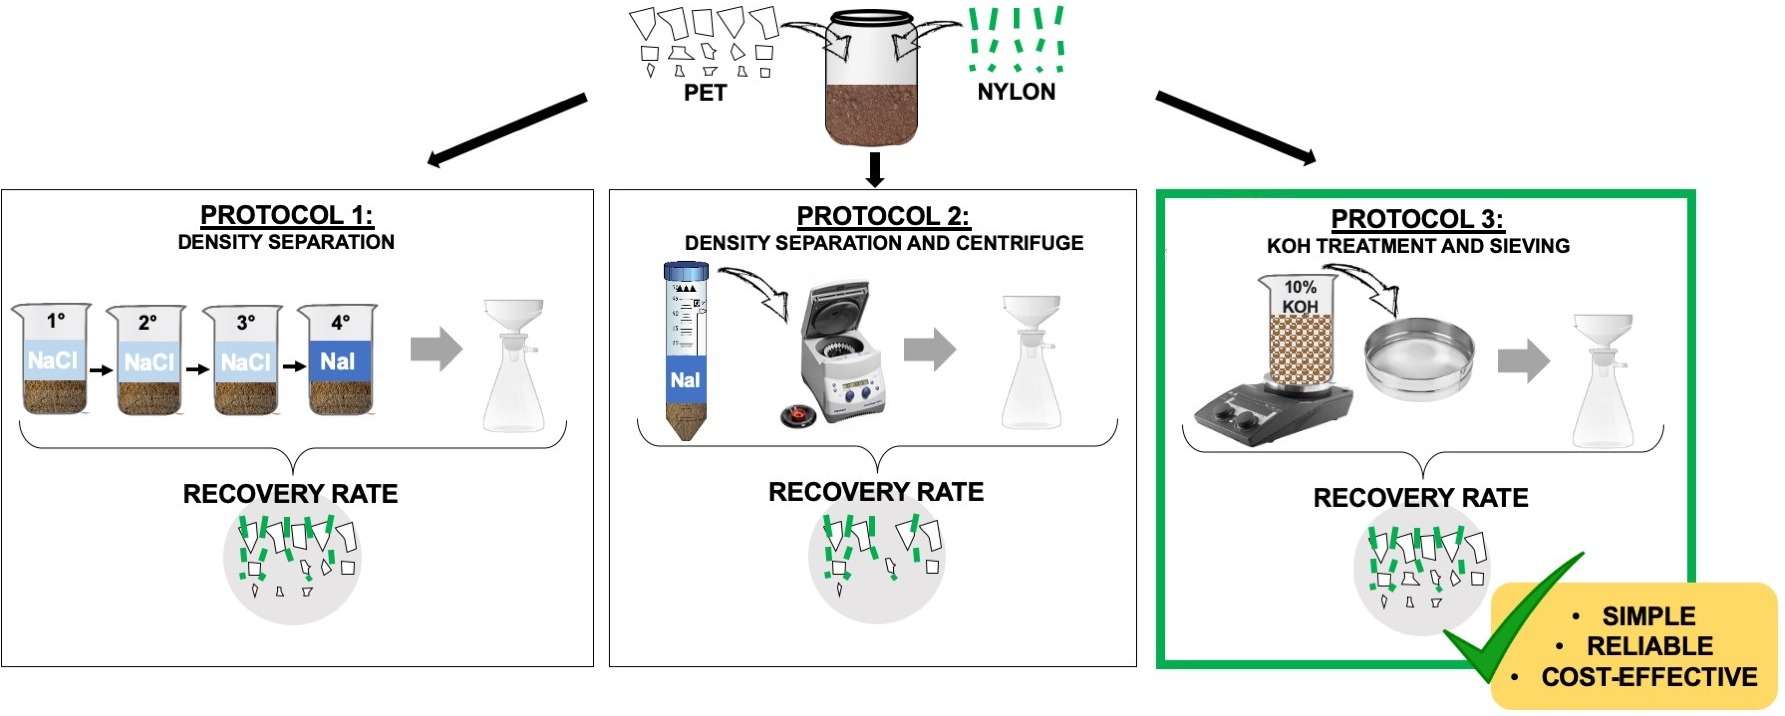
2.2. Protocols for Plastic Separation
2.2.1. Protocol 1
2.2.2. Protocol 2
2.2.3. Protocol 3
2.3. Evaluation of Possible Sources of Contamination
2.4. Cost Assessment and Statistical Analyses
3. Results
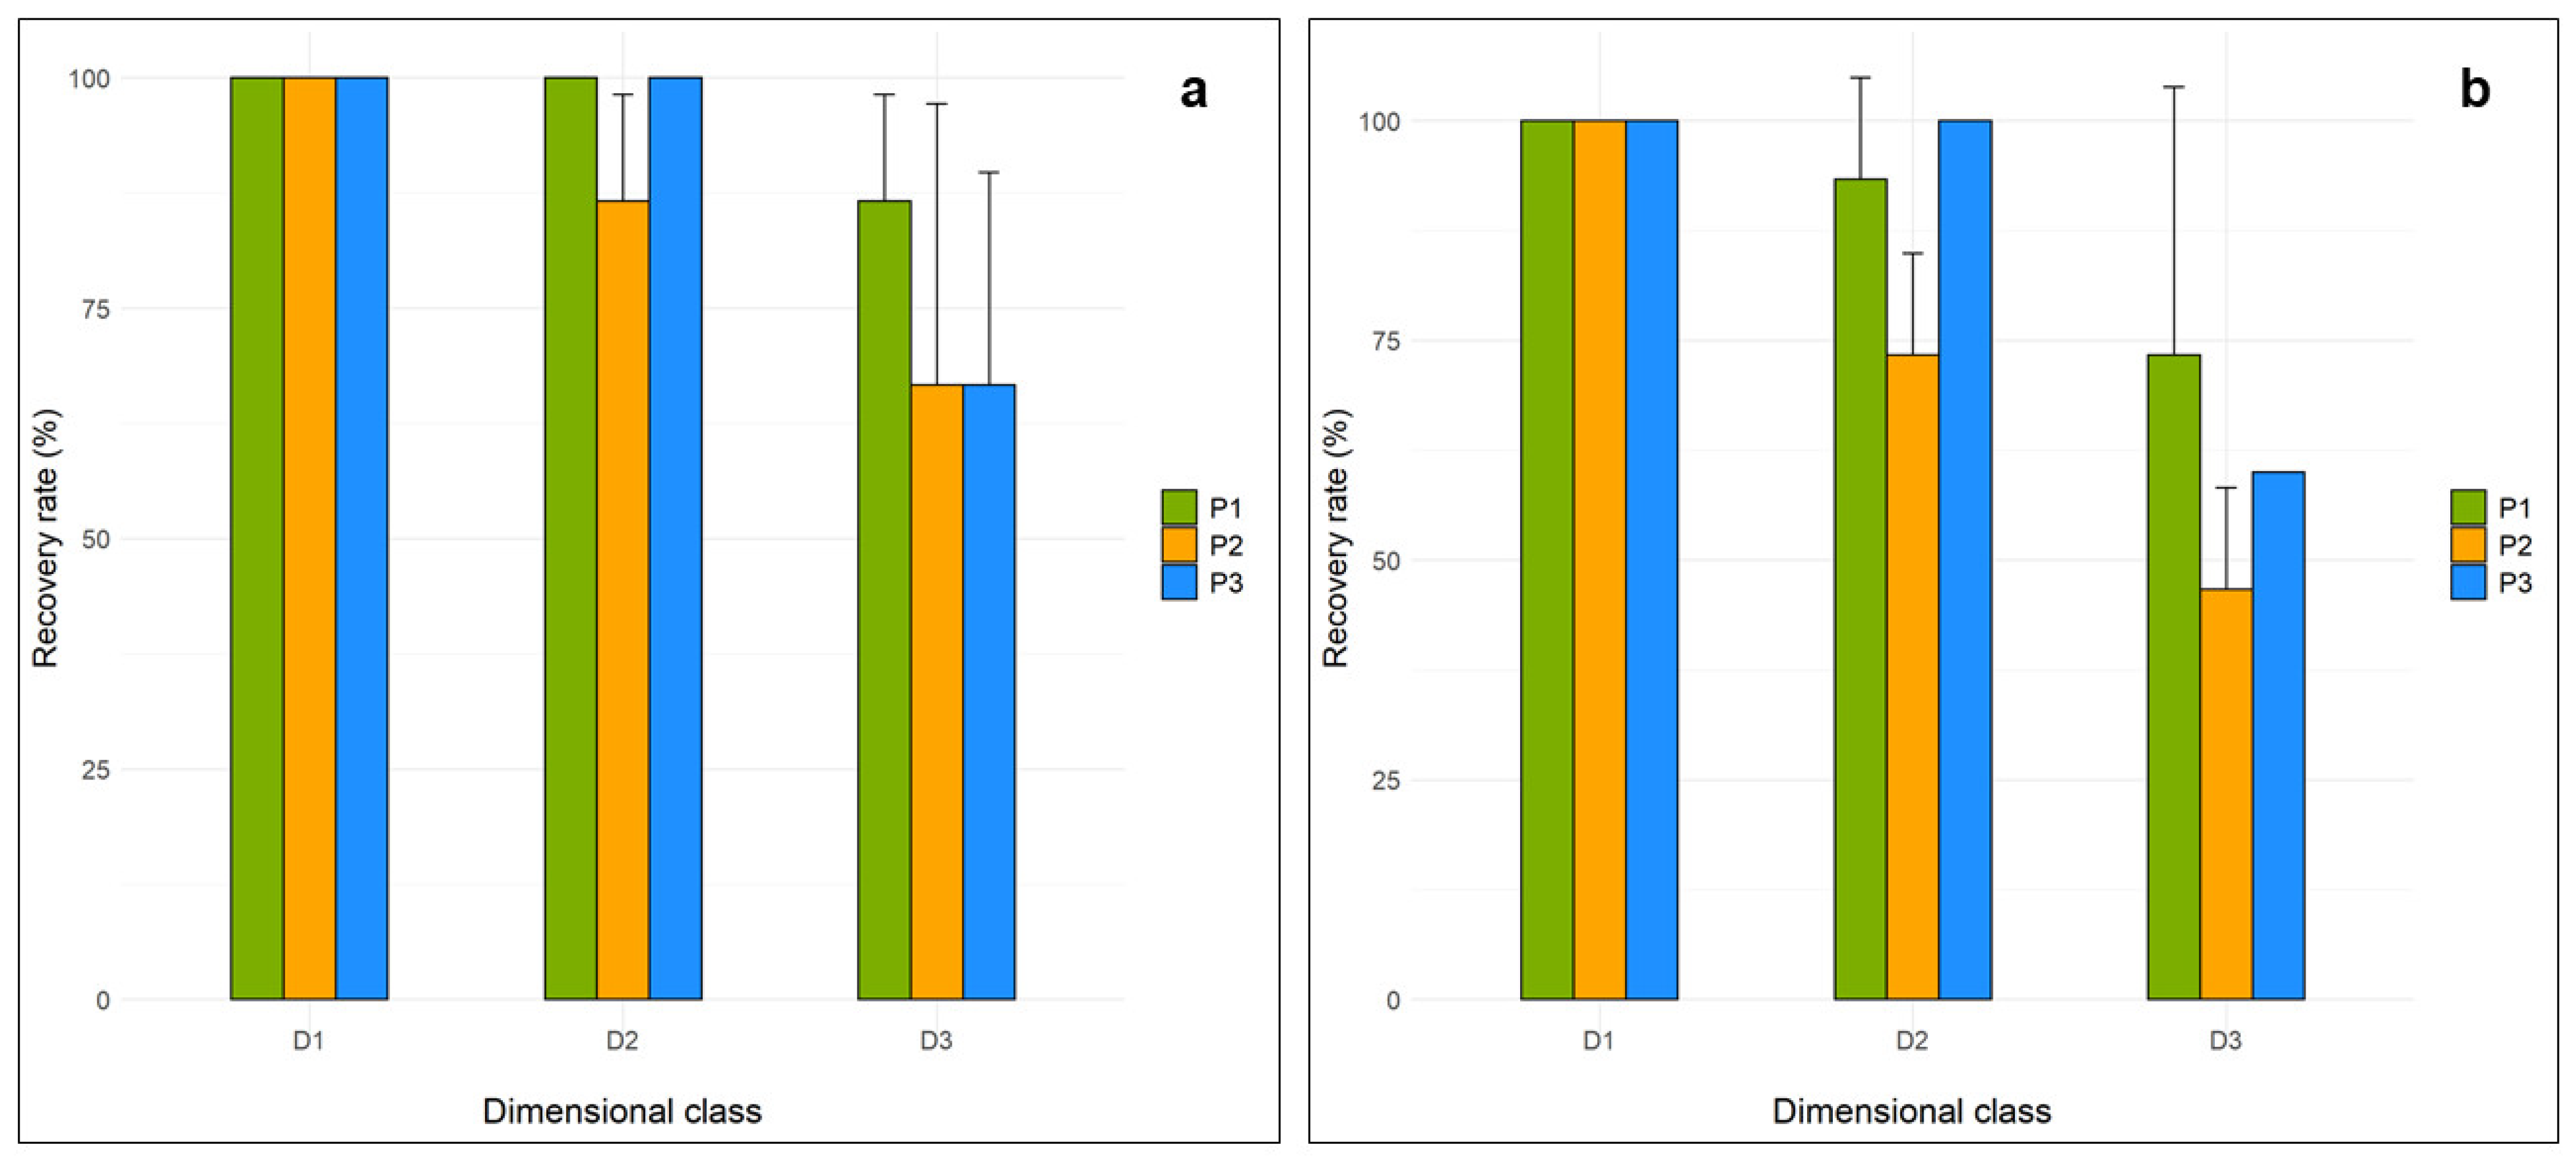
3.1. Recovery Rate
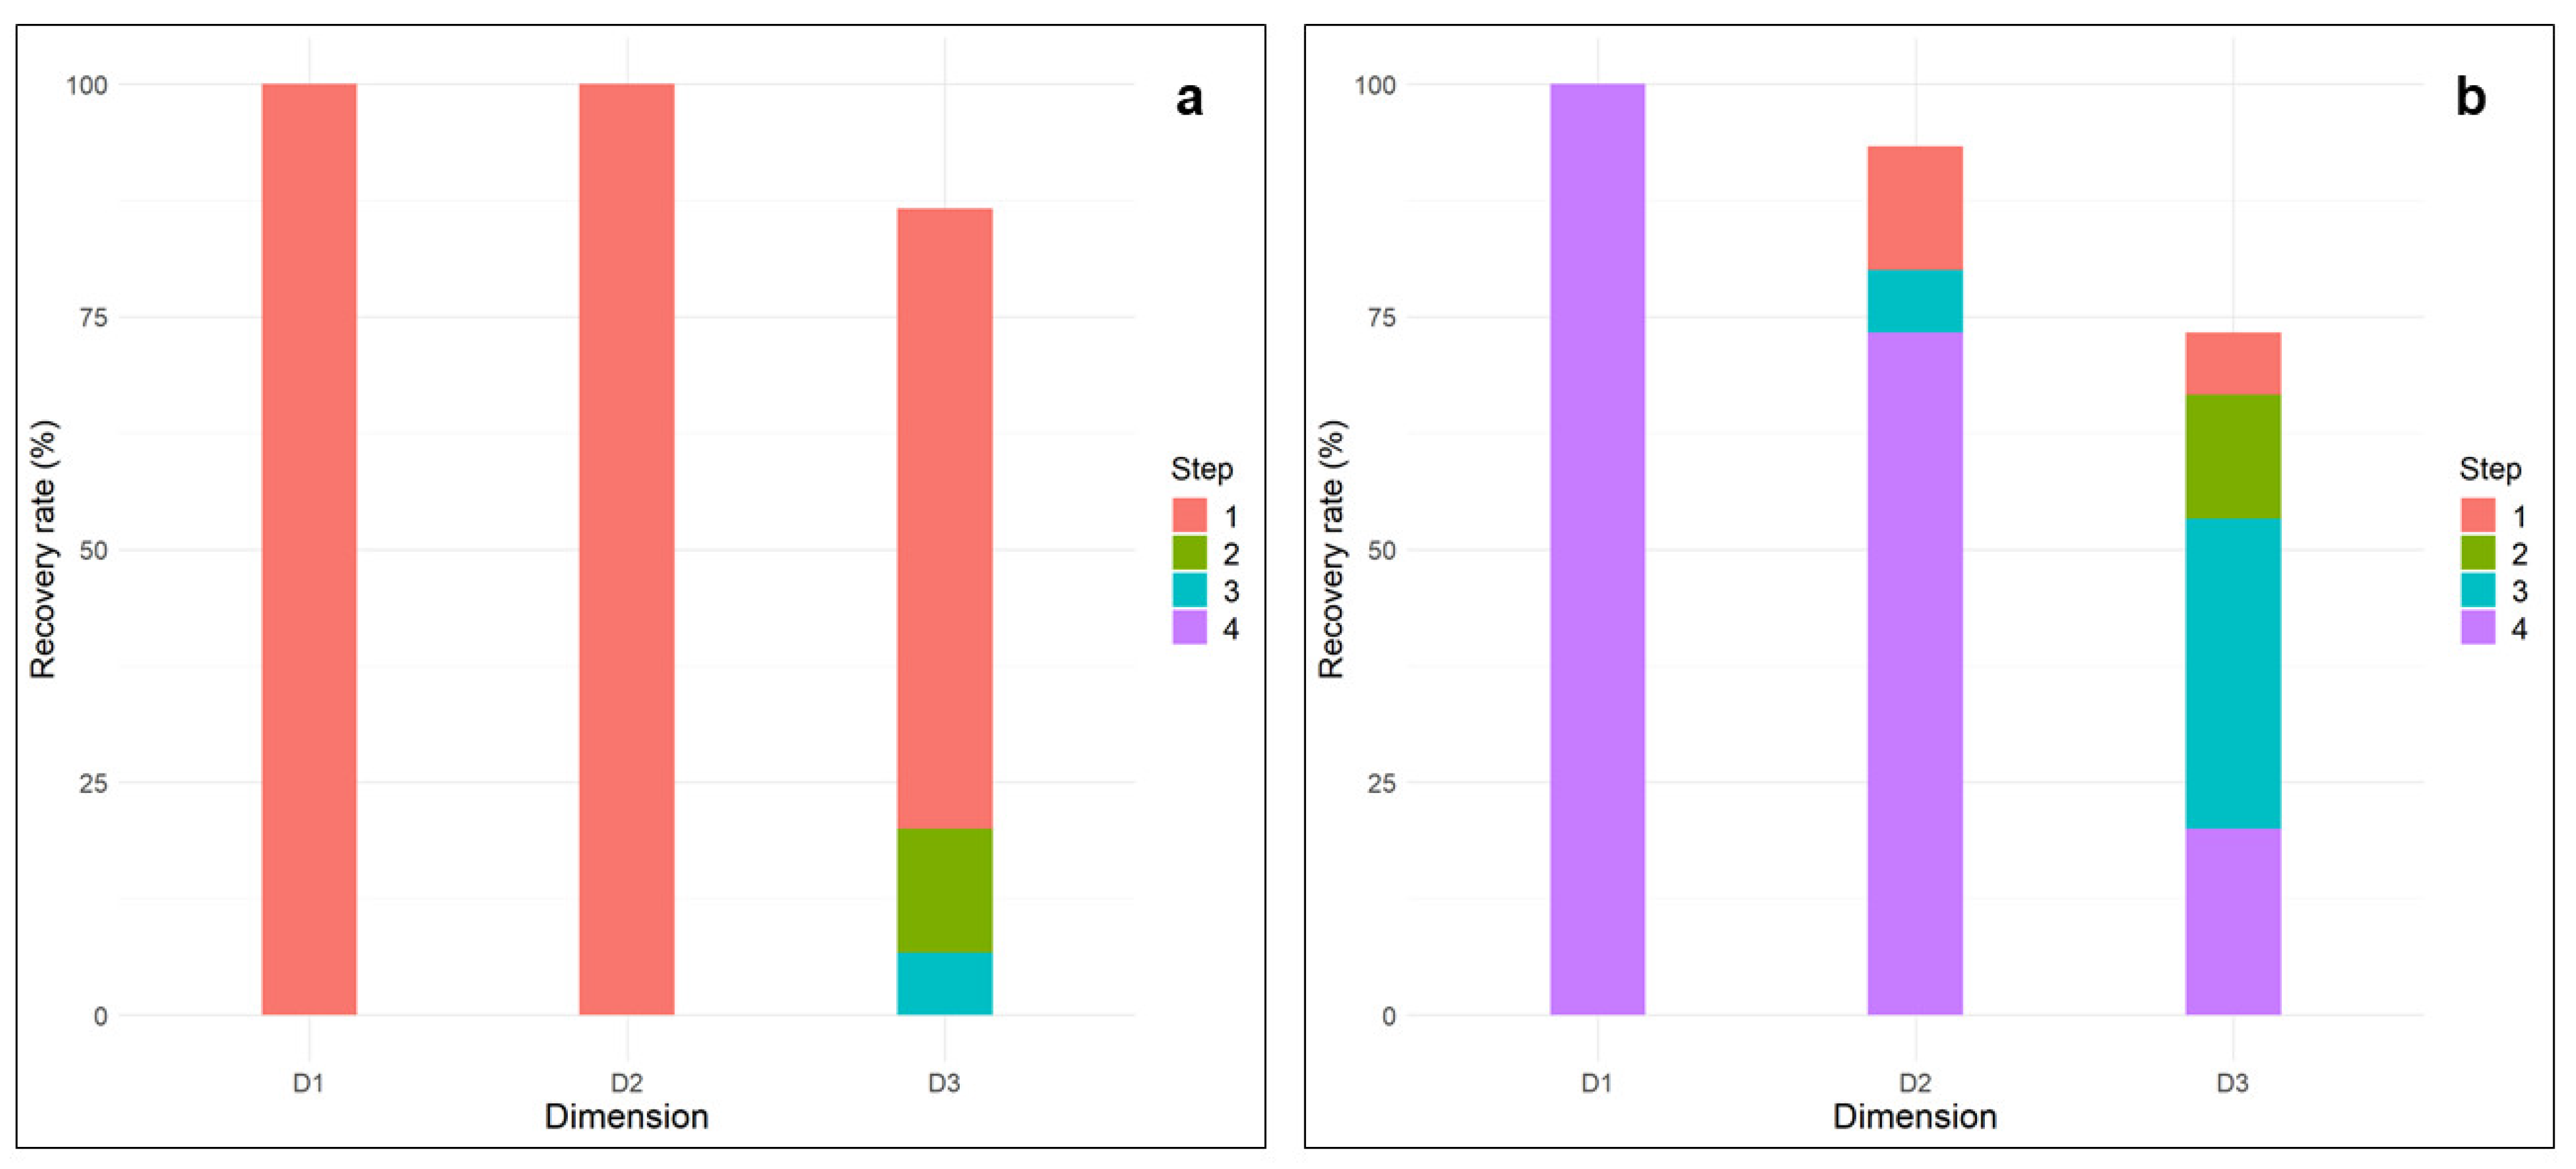
3.2. Sequential Recovery of Protocol 1
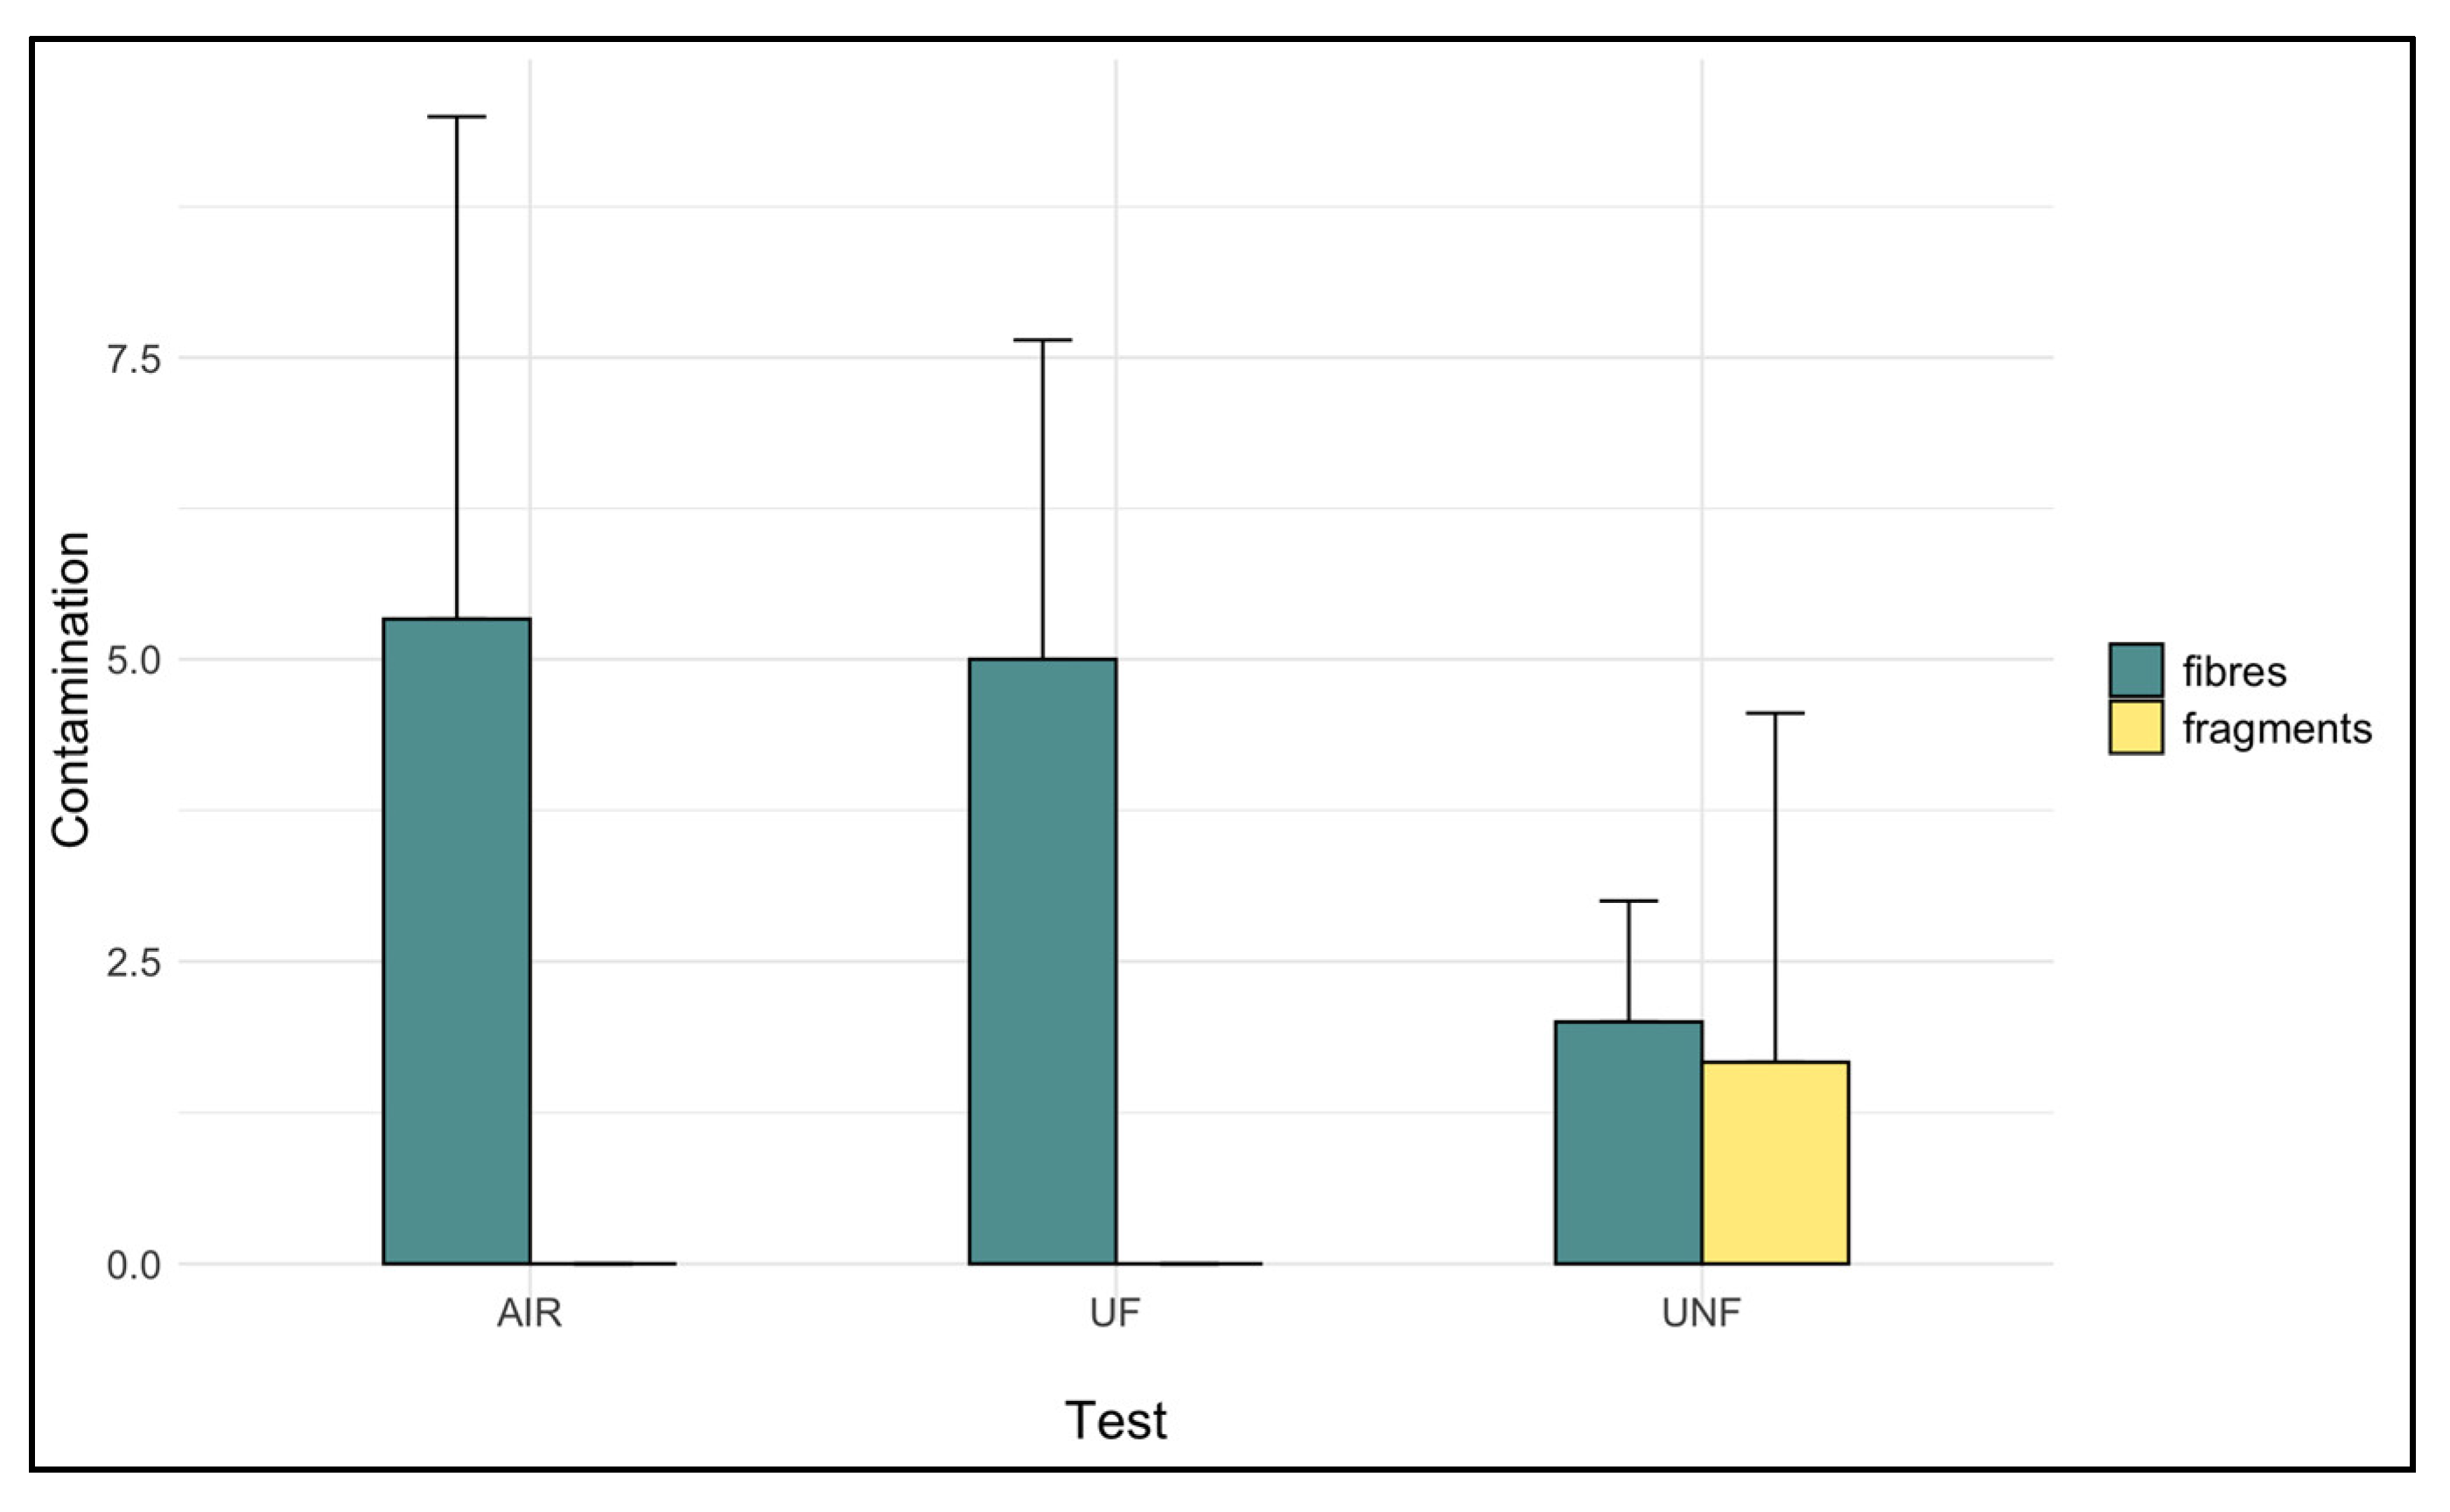
3.3. Contamination Evaluation
3.4. Cost Assessment
4. Discussion
5. Conclusions
Supplementary Materials
Author Contributions
Funding
Data Availability Statement
Acknowledgments
Conflicts of Interest
References
- Horton, A.A.; Walton, A.; Spurgeon, D.J.; Lahive, E.; Svendsen, C. Microplastics in freshwater and terrestrial environments: Evaluating the current understanding to identify the knowledge gaps and future research priorities. Sci. Total Environ. 2017, 586, 127–141. [Google Scholar] [CrossRef] [Green Version]
- Eerkes-Medrano, D.; Thompson, R.C.; Aldridge, D. Microplastics in freshwater systems: A review of the emerging threats, identification of knowledge gaps and prioritisation of research needs. Water Res. 2015, 75, 63–82. [Google Scholar] [CrossRef]
- Schrank, I.; Trotter, B.; Dummert, J.; Scholz-Böttcher, B.M.; Löder, M.G.; Laforsch, C. Effects of microplastic particles and leaching additive on the life history and morphology of Daphnia magna. Environ. Pollut. 2019, 255, 113233. [Google Scholar] [CrossRef]
- Galloway, T.S.; Lewis, C.N. Marine microplastics spell big problems for future generations. Proc. Natl. Acad. Sci. USA 2016, 113, 2331–2333. [Google Scholar] [CrossRef] [PubMed] [Green Version]
- Morét-Ferguson, S.; Law, K.; Proskurowski, G.; Murphy, E.K.; Peacock, E.E.; Reddy, C.M. The size, mass, and composition of plastic debris in the western North Atlantic Ocean. Mar. Pollut. Bull. 2010, 60, 1873–1878. [Google Scholar] [CrossRef] [PubMed]
- Nava, V.; Leoni, B. A critical review of interactions between microplastics, microalgae and aquatic ecosystem function. Water Res. 2021, 188, 116476. [Google Scholar] [CrossRef] [PubMed]
- Cózar, A.; Echevarría, F.; González-Gordillo, J.I.; Irigoien, X.; Úbeda, B.; Hernández-León, S.; Palma, T.; Navarro, S.; García-De-Lomas, J.; Ruiz, A.; et al. Plastic debris in the open ocean. Proc. Natl. Acad. Sci. USA 2014, 111, 10239–10244. [Google Scholar] [CrossRef] [PubMed] [Green Version]
- Lusher, A.; McHugh, M.; Thompson, R. Occurrence of microplastics in the gastrointestinal tract of pelagic and demersal fish from the English Channel. Mar. Pollut. Bull. 2013, 67, 94–99. [Google Scholar] [CrossRef]
- Van Cauwenberghe, L.; Devriese, L.; Galgani, F.; Robbens, J.; Janssen, C. Microplastics in sediments: A review of techniques, occurrence and effects. Mar. Environ. Res. 2015, 111, 5–17. [Google Scholar] [CrossRef] [Green Version]
- Fang, C.; Zheng, R.; Zhang, Y.; Hong, F.; Mu, J.; Chen, M.; Song, P.; Lin, L.; Lin, H.; Le, F.; et al. Microplastic contamination in benthic organisms from the Arctic and sub-Arctic regions. Chemosphere 2018, 209, 298–306. [Google Scholar] [CrossRef]
- Bellasi, A.; Binda, G.; Pozzi, A.; Galafassi, S.; Volta, P.; Bettinetti, R. Microplastic Contamination in Freshwater Environments: A Review, Focusing on Interactions with Sediments and Benthic Organisms. Environments 2020, 7, 30. [Google Scholar] [CrossRef] [Green Version]
- Piperagkas, O.; Papageorgiou, N.; Karakassis, I. Qualitative and quantitative assessment of microplastics in three sandy Mediterranean beaches, including different methodological approaches. Estuar. Coast. Shelf Sci. 2019, 219, 169–175. [Google Scholar] [CrossRef]
- Hanvey, J.S.; Lewis, P.; Lavers, J.; Crosbie, N.D.; Pozo, K.; Clarke, B.O. A review of analytical techniques for quantifying microplastics in sediments. Anal. Methods 2017, 9, 1369–1383. [Google Scholar] [CrossRef]
- Coppock, R.L.; Cole, M.; Lindeque, P.K.; Queiros, A.M.; Galloway, T.S. A Small-scale, portable method for extracting mircoplastics from marine sediments. Environ. Pollut. 2017, 230, 829–837. [Google Scholar] [CrossRef] [Green Version]
- Van Cauwenberghe, L.; Claessens, M.; Vandegehuchte, M.B.; Mees, J.; Janssen, C.R. Assessment of marine debris on the Belgian Continental Shelf. Mar. Pollut. Bull. 2013, 73, 161–169. [Google Scholar] [CrossRef]
- Imhof, H.K.; Schmid, J.; Niessner, R.; Ivleva, N.P.; Laforsch, C. A novel, highly efficient method for the separation and quantification of plastic particles in sediments of aquatic environments. Limnol. Oceanogr. Methods 2012, 10, 524–537. [Google Scholar] [CrossRef]
- Corcoran, P.L.; Biesinger, M.C.; Grifi, M. Plastics and beaches: A degrading relationship. Mar. Pollut. Bull. 2009, 58, 80–84. [Google Scholar] [CrossRef]
- Viaroli, P.; Azzoni, R.; Bartoli, M.; Iacumin, P.; Longhi, D.; Mosello, R.; Rogora, M.; Rossetti, G.; Salmaso, N.; Nizzoli, D. Persistence of meromixis and its effects on redox conditions and trophic status in Lake Idro (Southern Alps, Italy). Hydrobiologia 2018, 824, 51–69. [Google Scholar] [CrossRef]
- Milan, M.; Bigler, C.; Tolotti, M.; Szeroczyńska, K. Effects of long term nutrient and climate variability on subfossil Cladocera in a deep, subalpine lake (Lake Garda, northern Italy). J. Paleolimnol. 2017, 58, 335–351. [Google Scholar] [CrossRef] [Green Version]
- Milan, M.; Bigler, C.; Salmaso, N.; Guella, G.; Tolotti, M. Multiproxy reconstruction of a large and deep subalpine lake’s ecological history since the Middle Ages. J. Great Lakes Res. 2015, 41, 982–994. [Google Scholar] [CrossRef]
- Nava, V.; Frezzotti, M.L.; Leoni, B. Raman Spectroscopy for the Analysis of Microplastics in Aquatic Systems. Appl. Spectrosc. 2021, 26, 12109–12122. [Google Scholar] [CrossRef]
- Lares, M.; Ncibi, M.C.; Sillanpää, M.; Sillanpää, M. Intercomparison study on commonly used methods to determine microplastics in wastewater and sludge samples. Environ. Sci. Pollut. Res. 2019, 26, 12109–12122. [Google Scholar] [CrossRef] [Green Version]
- Hidalgo-Ruz, V.; Gutow, L.; Thompson, R.; Thiel, M. Microplastics in the Marine Environment: A Review of the Methods Used for Identification and Quantification. Environ. Sci. Technol. 2012, 46, 3060–3075. [Google Scholar] [CrossRef]
- Turner, S.; Horton, A.A.; Rose, N.L.; Hall, C. A temporal sediment record of microplastics in an urban lake, London, UK. J. Paleolimnol. 2019, 61, 449–462. [Google Scholar] [CrossRef]
- Leoni, B.; Patelli, M.; Nava, V.; Tolotti, M. Cladocera paleocommunity to disentangle the impact of anthropogenic and climatic stressors on a deep subalpine lake ecosystem (Lake Iseo, Italy). Aquat. Ecol. 2021, 55, 607–621. [Google Scholar] [CrossRef]
- Crawford, C.B.; Quinn, B. Microplastic Pollutants, 1st ed.; Elsevier: Amsterdam, The Netherlands, 2017; ISBN 9780128104699. [Google Scholar]
- Wobbrock, J.O.; Findlater, L.; Gergle, D.; Higgins, J.J. The Aligned Rank Transform for nonparametric factorial analyses using only ANOVA procedures. In Proceedings of the Conference on Human Factors in Computing Systems, Vancouver, BC, Canada, 7–12 May 2011; Association for Computing Machinery: New York, NY, USA, 2011; pp. 143–146. [Google Scholar]
- Kay, M.; Wobbrock, J.O. ARTool: Aligned Rank Transform for Nonparametric Factorial ANOVAs, R Packag, Version 0.10.0. 2019. Available online: http://depts.washington.edu/acelab/proj/art/index.html (accessed on 25 September 2021).
- Lenth, R. emmeans: Estimated Marginal Means, aka Least-Squares Means. R Packag, Version 1.4.1. 2019. Available online: https://cran.r-project.org/web/packages/emmeans/index.html (accessed on 25 September 2021).
- Woodall, L.C.; Sanchez-Vidal, A.; Canals, M.; Paterson, G.L.; Coppock, R.; Sleight, V.; Calafat, A.; Rogers, A.D.; Narayanaswamy, B.; Thompson, R.C. The deep sea is a major sink for microplastic debris. R. Soc. Open Sci. 2014, 1, 140317. [Google Scholar] [CrossRef] [Green Version]
- Blair, R.M.; Waldron, S.; Phoenix, V.R.; Gauchotte-Lindsay, C. Microscopy and elemental analysis characterisation of microplastics in sediment of a freshwater urban river in Scotland, UK. Environ. Sci. Pollut. Res. 2019, 26, 12491–12504. [Google Scholar] [CrossRef] [PubMed] [Green Version]
- Zarfl, C. Promising techniques and open challenges for microplastic identification and quantification in environmental matrices. Anal. Bioanal. Chem. 2019, 411, 3743–3756. [Google Scholar] [CrossRef]
- Quinn, B.; Murphy, F.; Ewins, C. Validation of density separation for the rapid recovery of microplastics from sediment. Anal. Methods 2017, 9, 1491–1498. [Google Scholar] [CrossRef] [Green Version]
- Shim, W.J.; Hong, S.H.; Eo, S.E. Identification methods in microplastic analysis: A review. Anal. Methods 2016, 9, 1384–1391. [Google Scholar] [CrossRef]
- Kedzierski, M.; Le Tilly, V.; Bourseau, P.; Bellegou, H.; César, G.; Sire, O.; Bruzaud, S. Microplastics elutriation from sandy sediments: A granulometric approach. Mar. Pollut. Bull. 2016, 107, 315–323. [Google Scholar] [CrossRef]
- Ivleva, N.P.; Wiesheu, A.C.; Niessner, R. Microplastic in Aquatic Ecosystems. Angew. Chem. Int. Ed. 2016, 56, 1720–1739. [Google Scholar] [CrossRef]
- Löder, M.G.J.; Kuczera, M.; Mintenig, S.; Lorenz, C.; Gerdts, G. Focal plane array detector-based micro-Fourier-transform infrared imaging for the analysis of microplastics in environmental samples. Environ. Chem. 2015, 12, 563–581. [Google Scholar] [CrossRef]
- Eriksen, M.; Mason, S.; Wilson, S.; Box, C.; Zellers, A.; Edwards, W.; Farley, H.; Amato, S. Microplastic pollution in the surface waters of the Laurentian Great Lakes. Mar. Pollut. Bull. 2013, 77, 177–182. [Google Scholar] [CrossRef] [PubMed]
- Li, J.; Yang, D.; Li, L.; Jabeen, K.; Shi, H. Microplastics in commercial bivalves from China. Environ. Pollut. 2015, 207, 190–195. [Google Scholar] [CrossRef] [PubMed]
- Shruti, V.; Jonathan, M.; Rodriguez-Espinosa, P.; Rodríguez-González, F. Microplastics in freshwater sediments of Atoyac River basin, Puebla City, Mexico. Sci. Total Environ. 2018, 654, 154–163. [Google Scholar] [CrossRef] [PubMed]
- Claessens, M.; Van Cauwenberghe, L.; Vandegehuchte, M.B.; Janssen, C.R. New techniques for the detection of microplastics in sediments and field collected organisms. Mar. Pollut. Bull. 2013, 70, 227–233. [Google Scholar] [CrossRef] [PubMed]
- Li, J.; Liu, H.; Chen, J.P. Microplastics in freshwater systems: A review on occurrence, environmental effects, and methods for microplastics detection. Water Res. 2018, 137, 362–374. [Google Scholar] [CrossRef]
- Pagter, E.; Frias, J.; Nash, R. Microplastics in Galway Bay: A comparison of sampling and separation methods. Mar. Pollut. Bull. 2018, 135, 932–940. [Google Scholar] [CrossRef]


| Protocol Number | Dimensional Class | Mean Particles Dimension (±SD) (mm) |
|---|---|---|
| P1 | D1 | 3.12 ± 0.33 |
| D2 | 1.44 ± 0.17 | |
| D3 | 0.42 ± 0.05 | |
| P2 | D1 | 3.04 ± 0.29 |
| D2 | 1.38 ± 0.28 | |
| D3 | 0.42 ± 0.03 | |
| P3 | D1 | 3.07 ± 0.27 |
| D2 | 1.21 ± 0.26 | |
| D3 | 0.41 ± 0.06 |
| Protocol Number | Cost (€) 1 | Relative Cost Unit |
|---|---|---|
| P1 | 23 | 7.7 |
| P2 | 11 | 3.7 |
| P3 | 3 | 1 |
Publisher’s Note: MDPI stays neutral with regard to jurisdictional claims in published maps and institutional affiliations. |
© 2021 by the authors. Licensee MDPI, Basel, Switzerland. This article is an open access article distributed under the terms and conditions of the Creative Commons Attribution (CC BY) license (https://creativecommons.org/licenses/by/4.0/).
Share and Cite
Nava, V.; Leoni, B. Comparison of Different Procedures for Separating Microplastics from Sediments. Water 2021, 13, 2854. https://doi.org/10.3390/w13202854
Nava V, Leoni B. Comparison of Different Procedures for Separating Microplastics from Sediments. Water. 2021; 13(20):2854. https://doi.org/10.3390/w13202854
Chicago/Turabian StyleNava, Veronica, and Barbara Leoni. 2021. "Comparison of Different Procedures for Separating Microplastics from Sediments" Water 13, no. 20: 2854. https://doi.org/10.3390/w13202854
APA StyleNava, V., & Leoni, B. (2021). Comparison of Different Procedures for Separating Microplastics from Sediments. Water, 13(20), 2854. https://doi.org/10.3390/w13202854