
Modeling as a Tool for Transboundary Aquifer Assessment Prioritization

Abstract
:1. Introduction
2. Materials and Methods
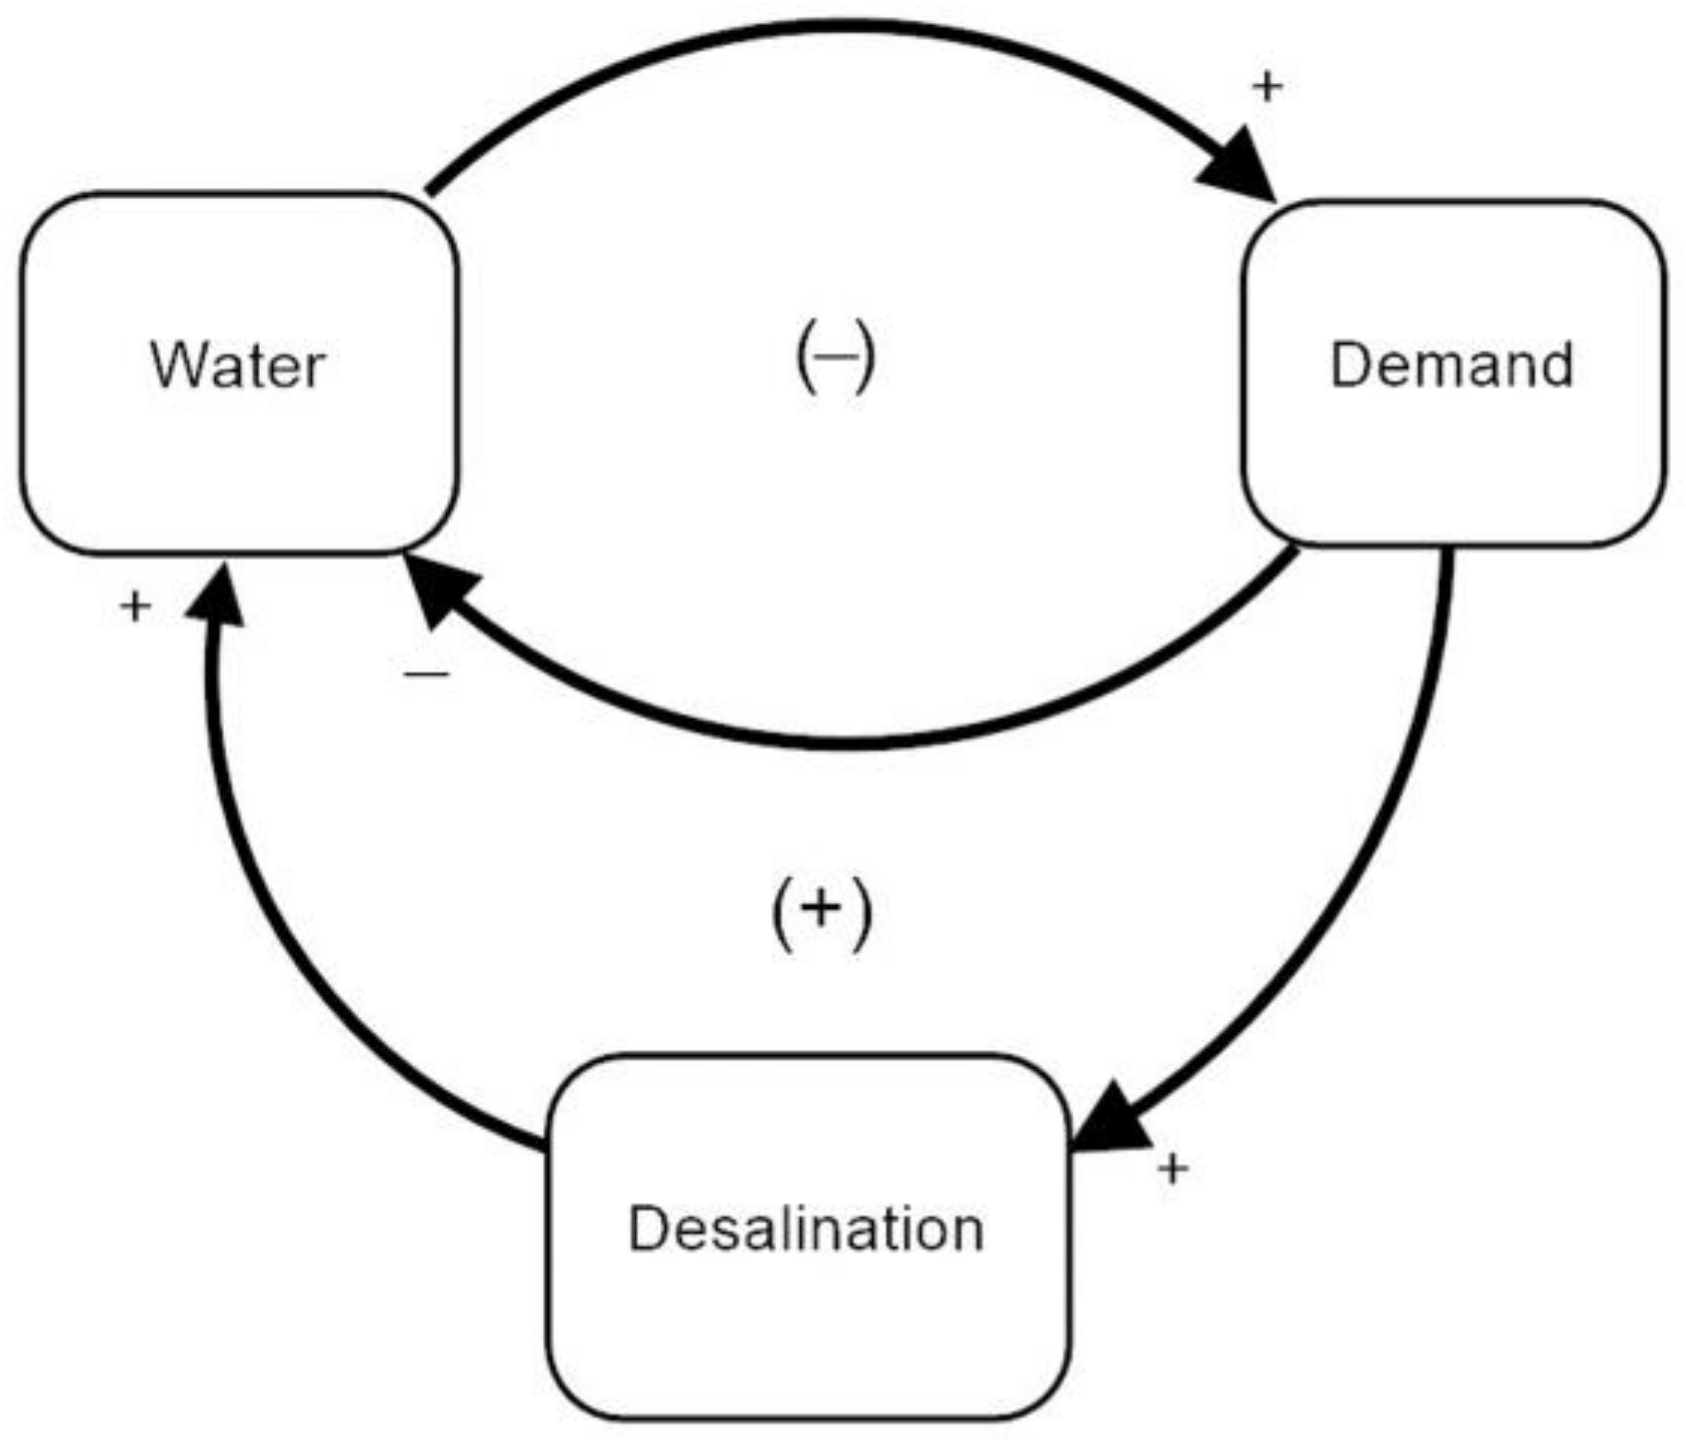
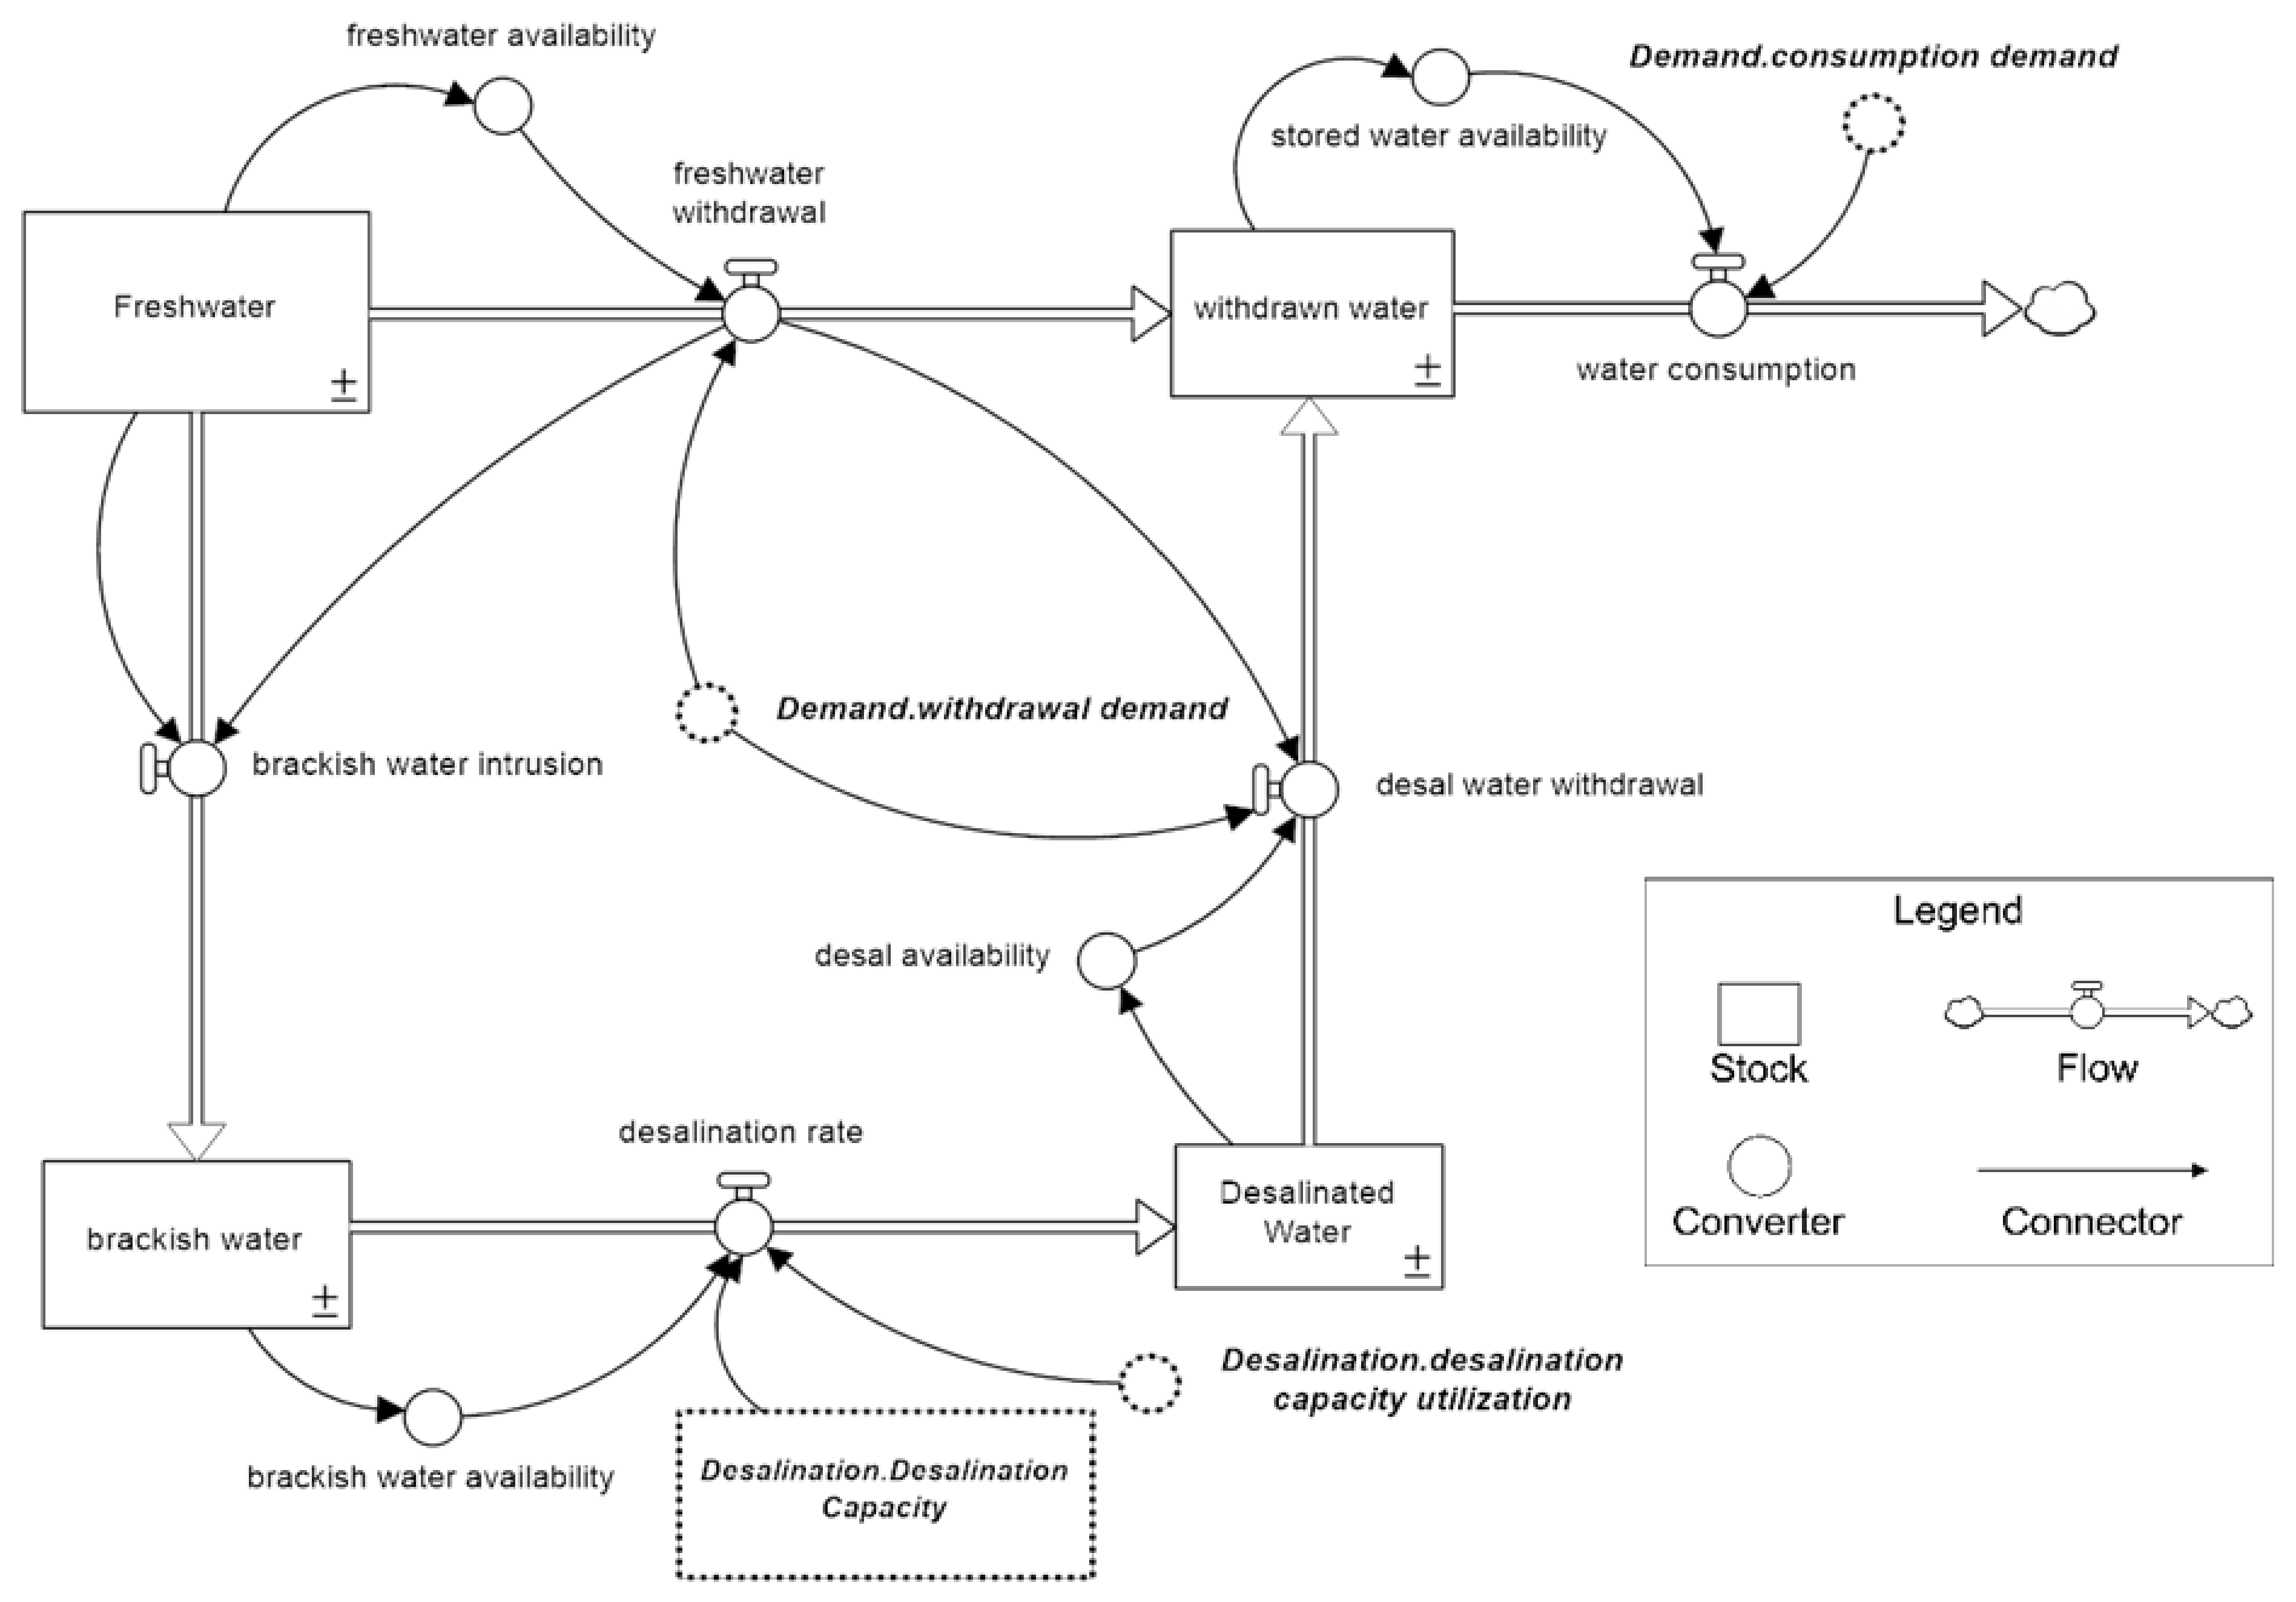
2.1. Water
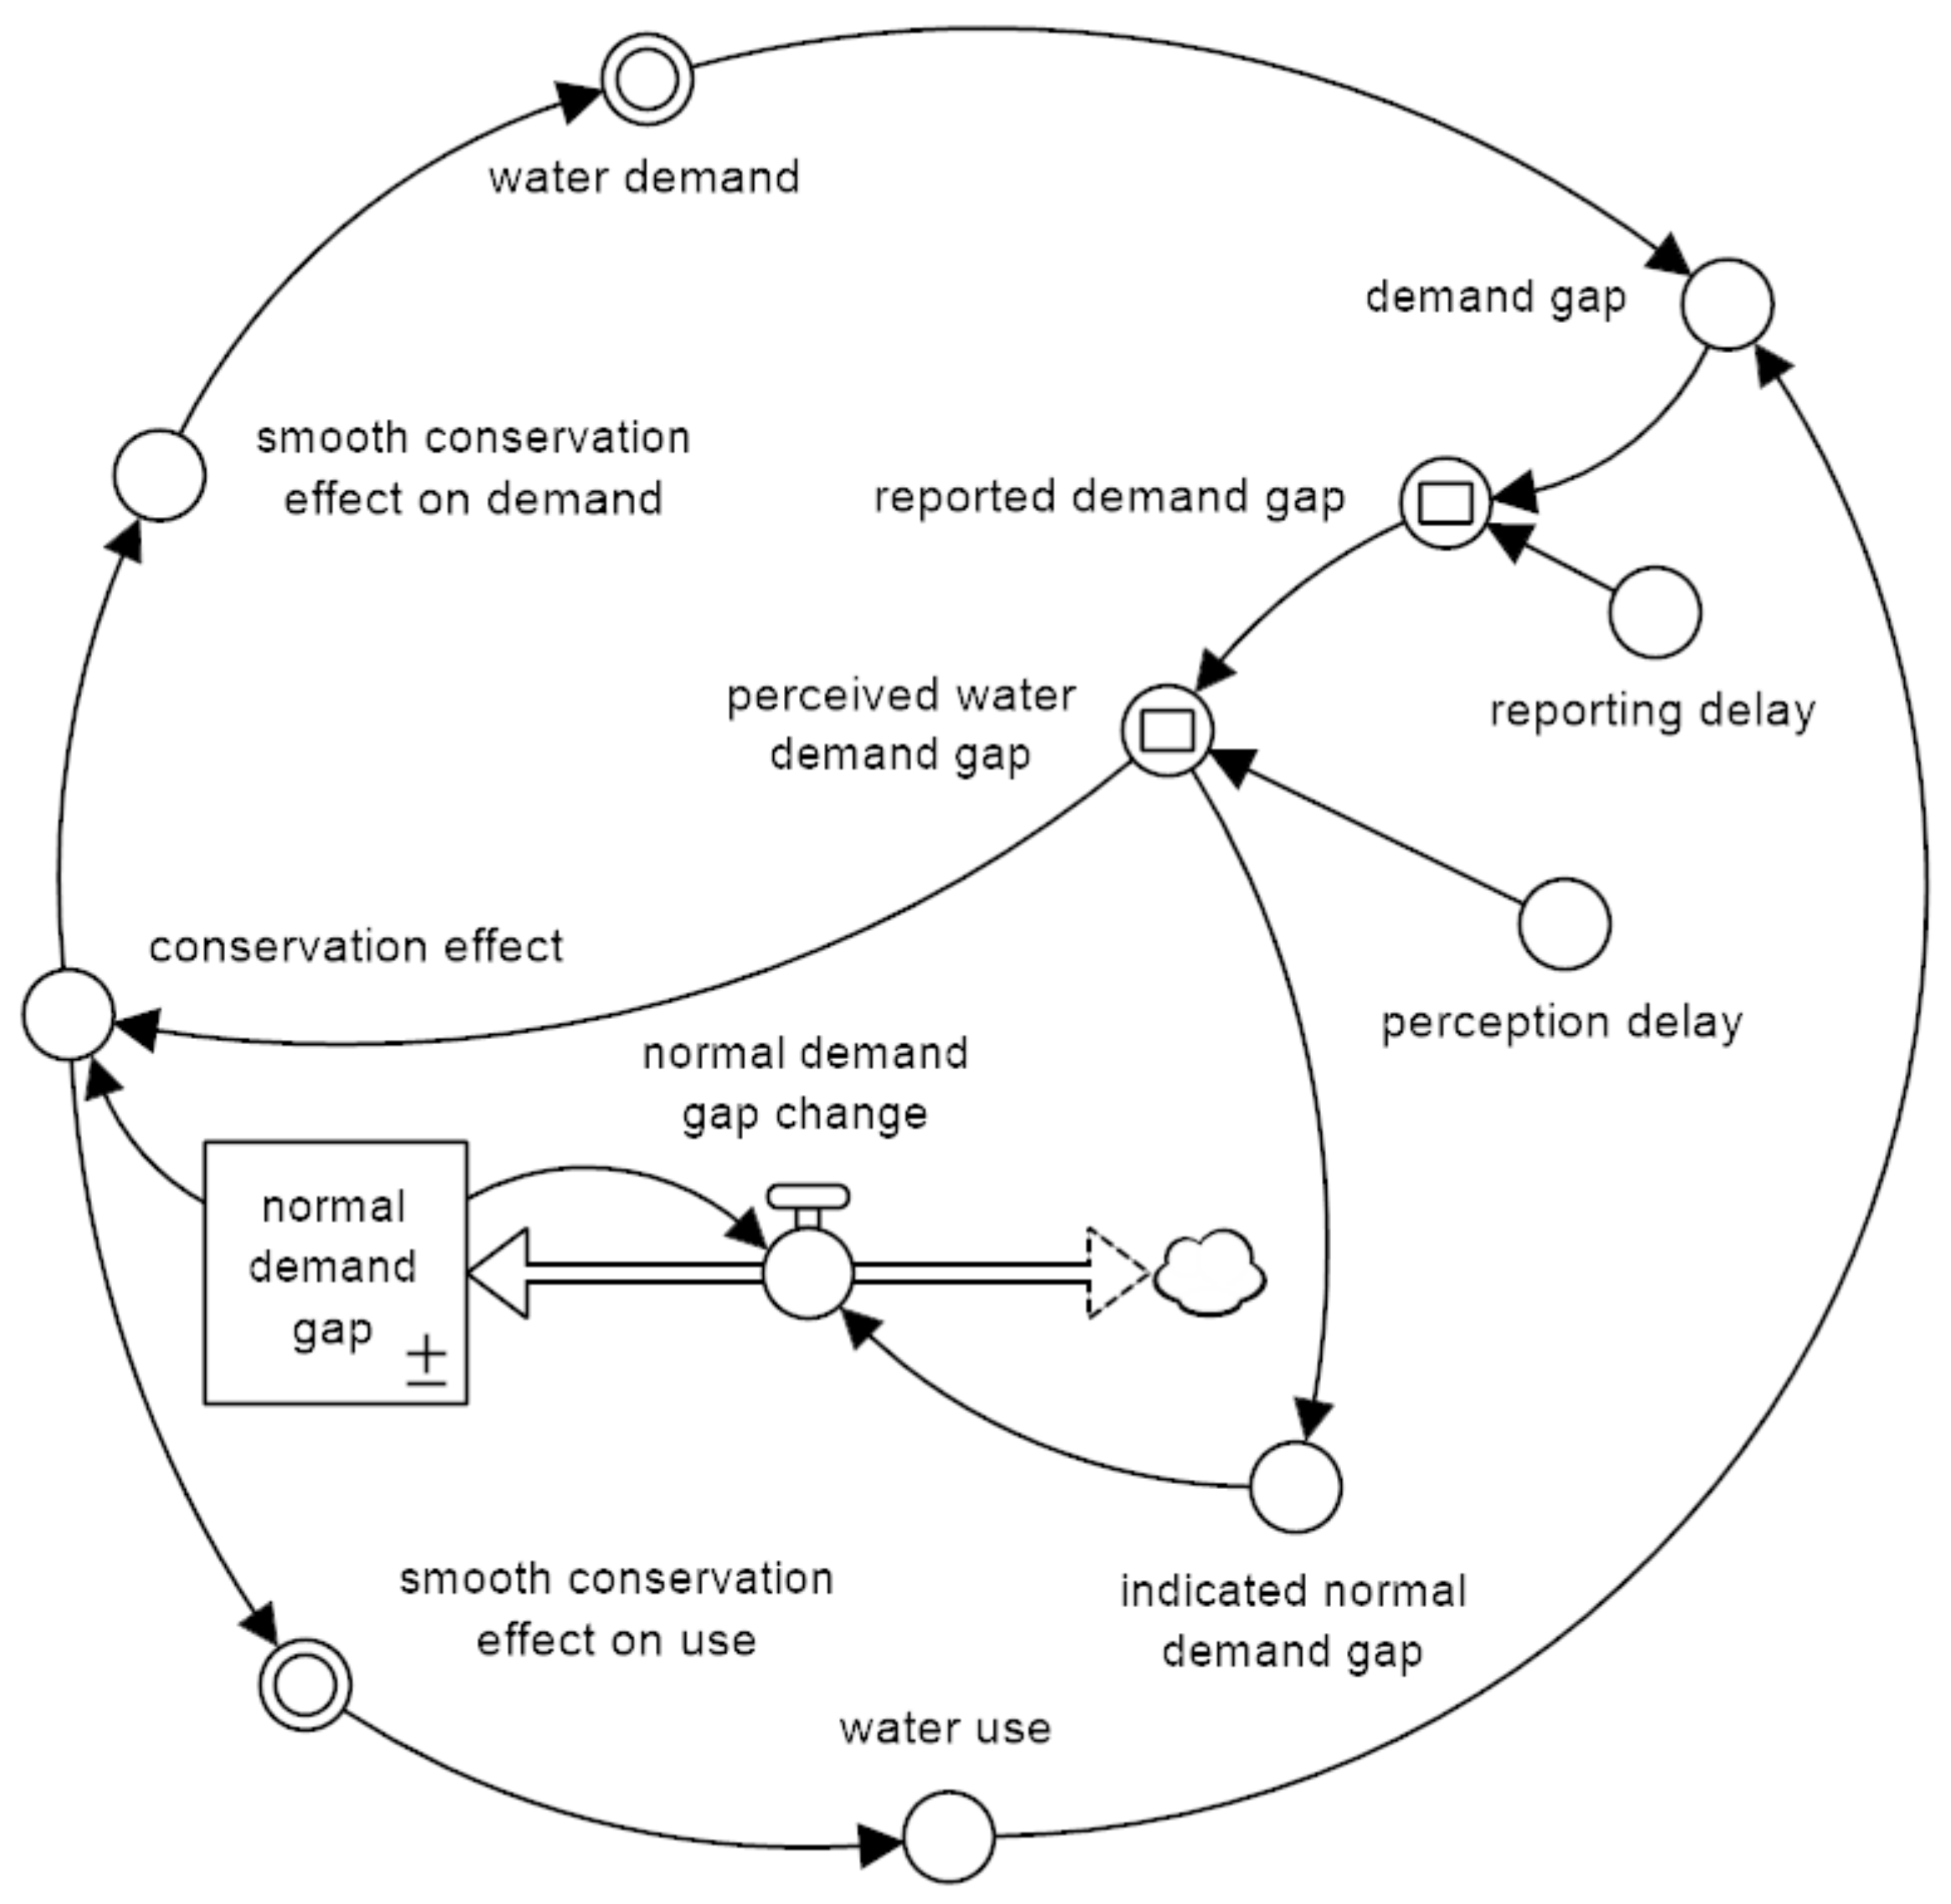
2.2. Demand
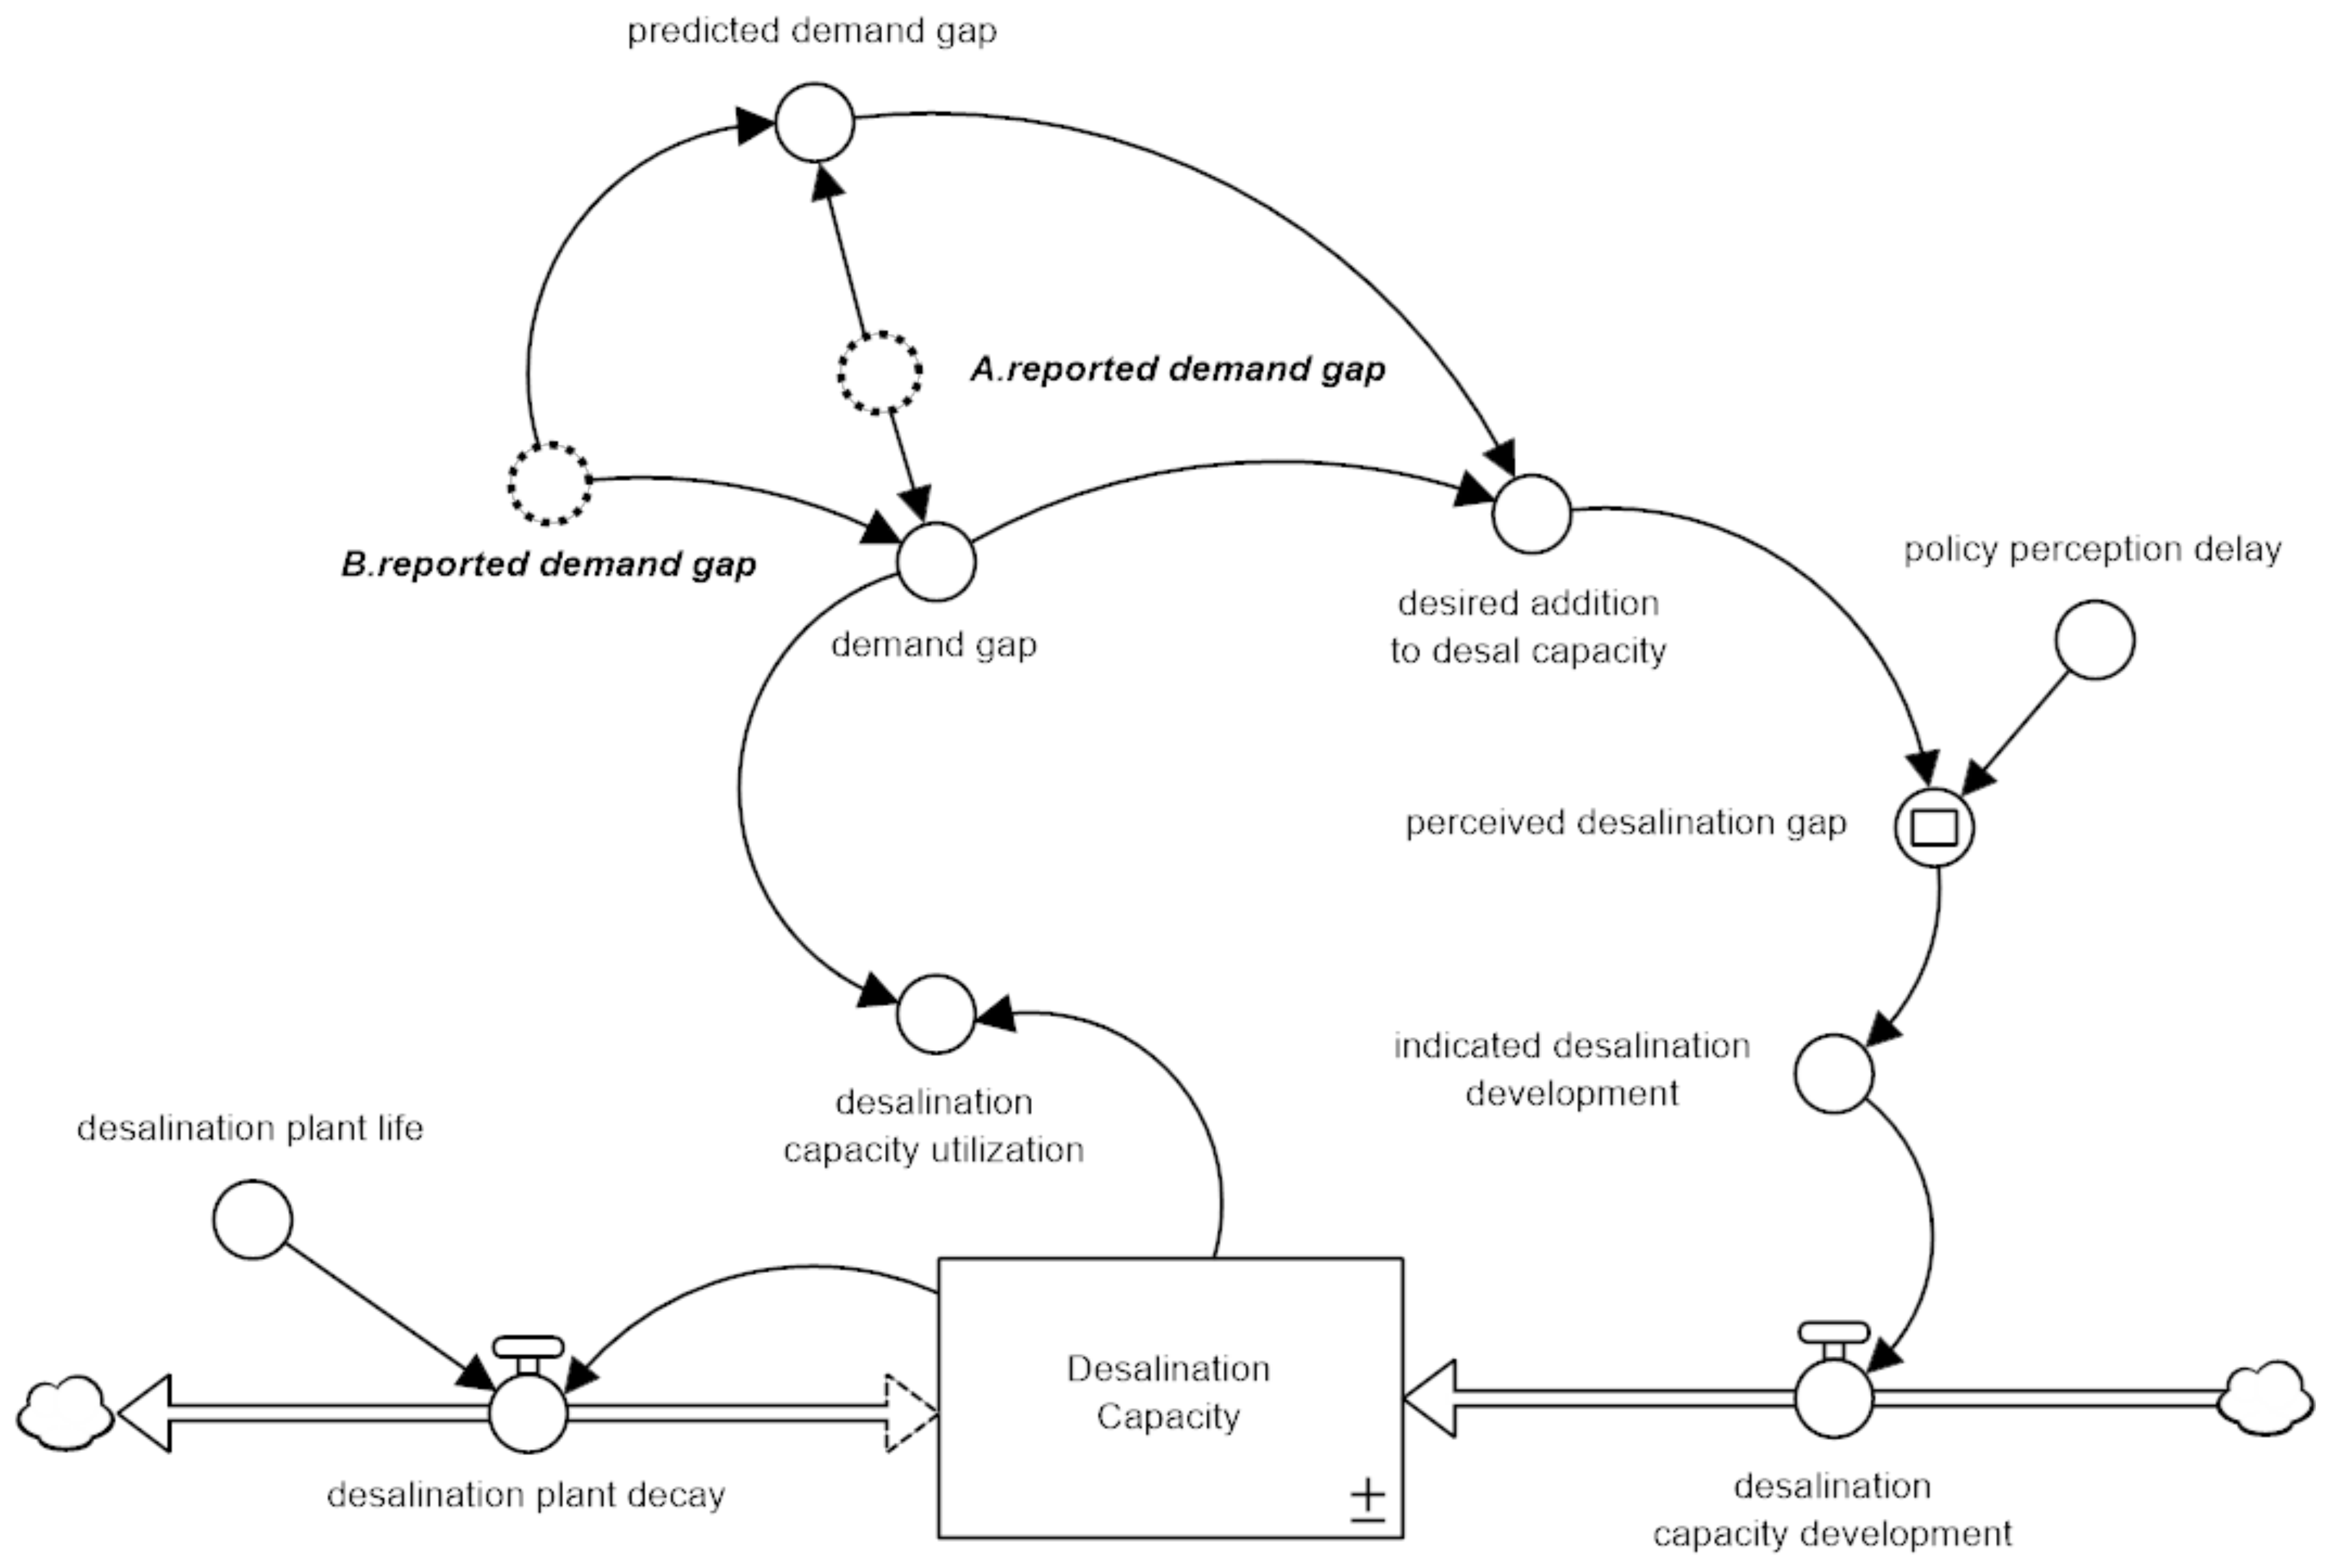
2.3. Desalination
2.4. Simulation Experiments
3. Results and Discussion
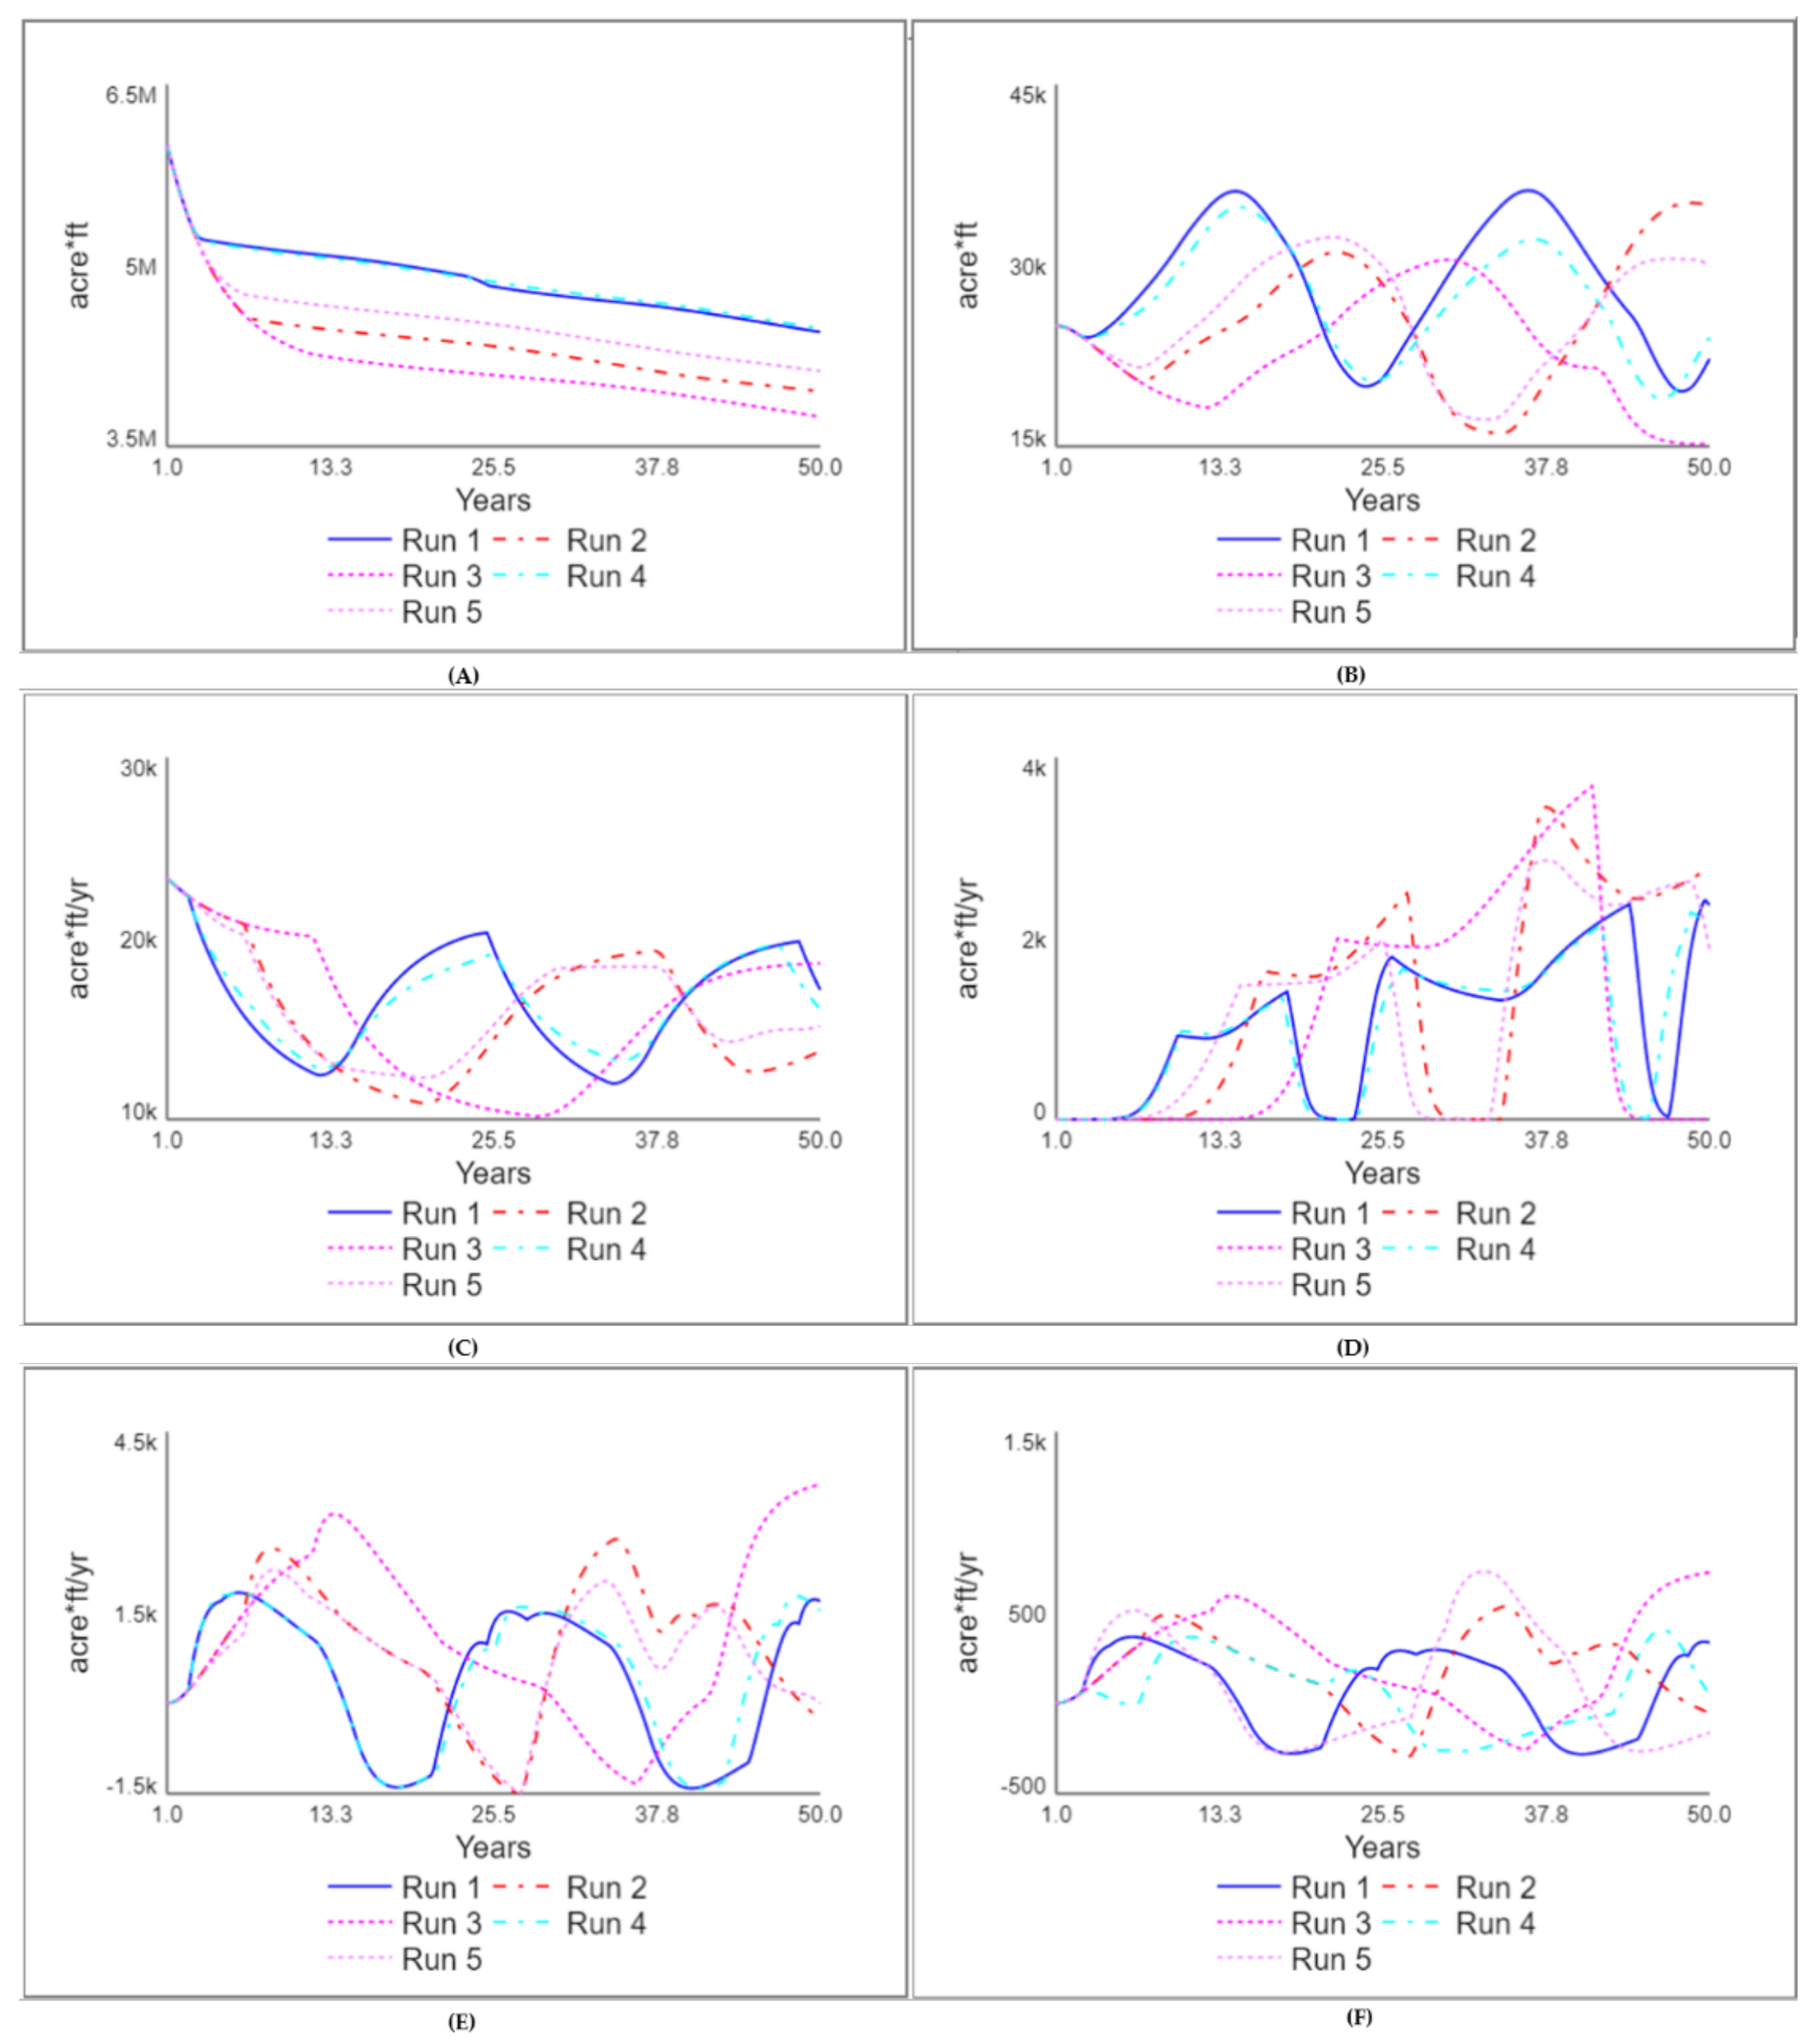
3.1. Users with Identical Perception and Reporting Delays
3.2. Users with Different Perception and Reporting Delays
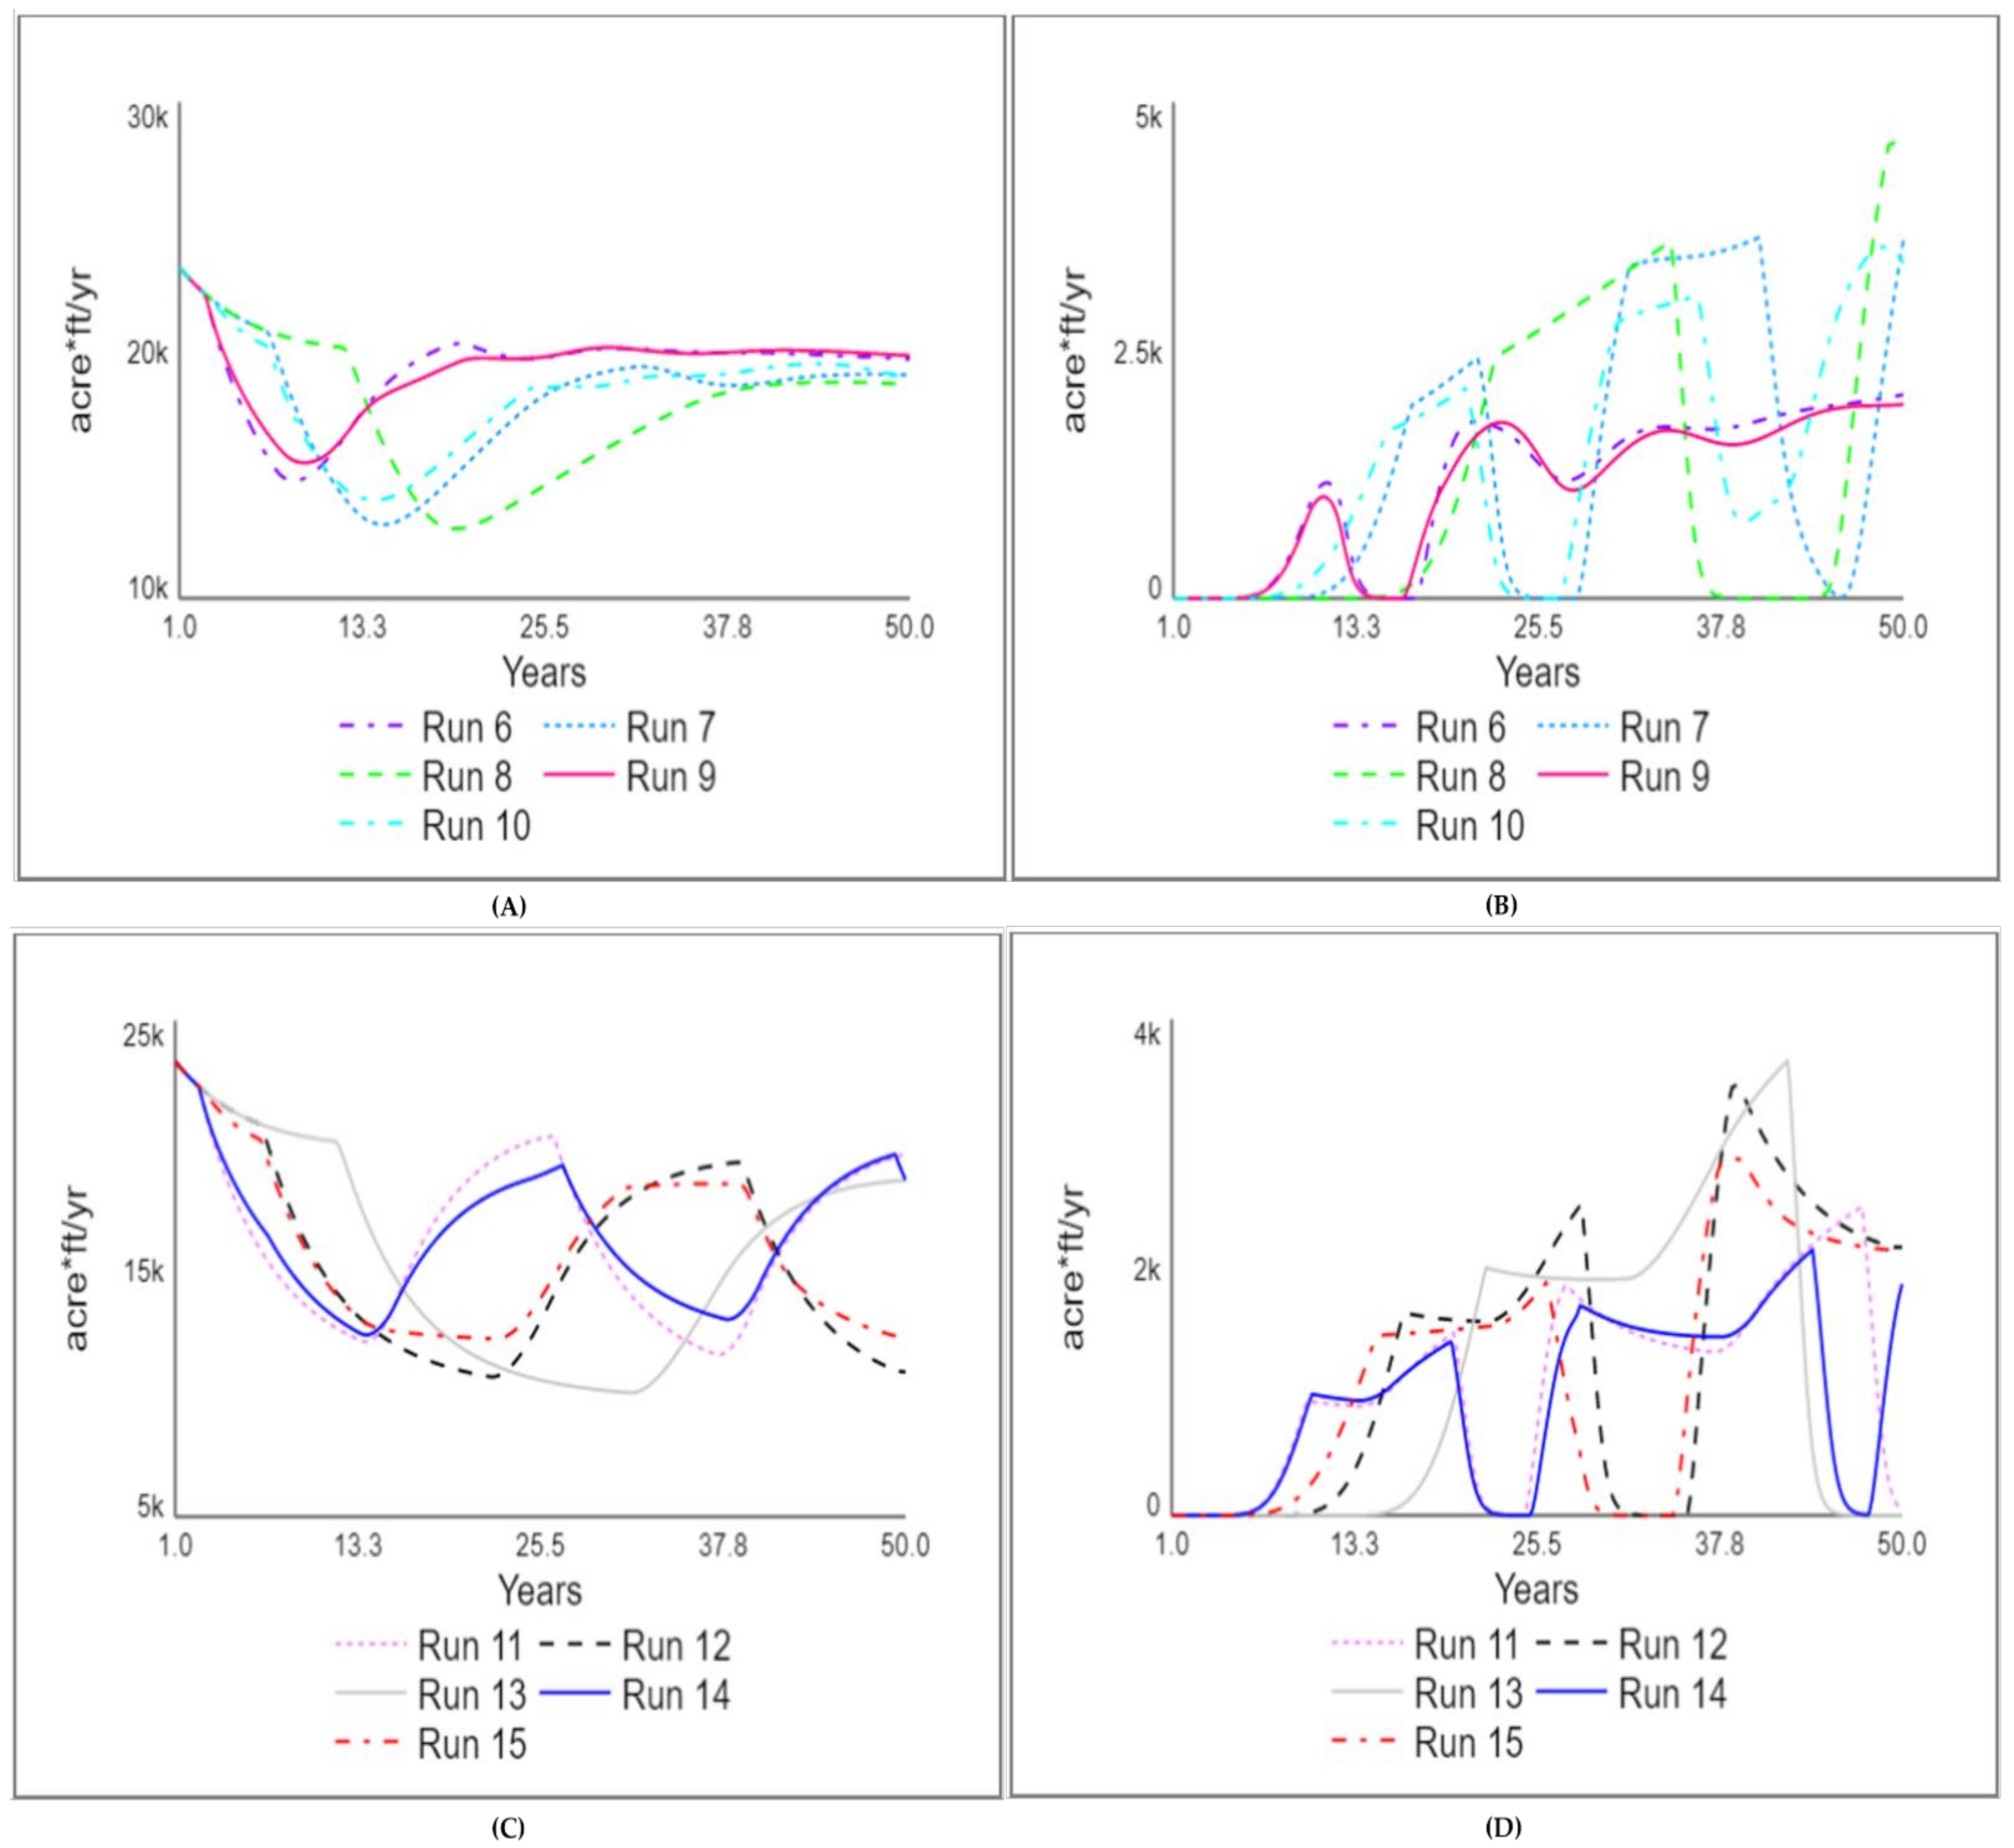
3.3. Practical Implications
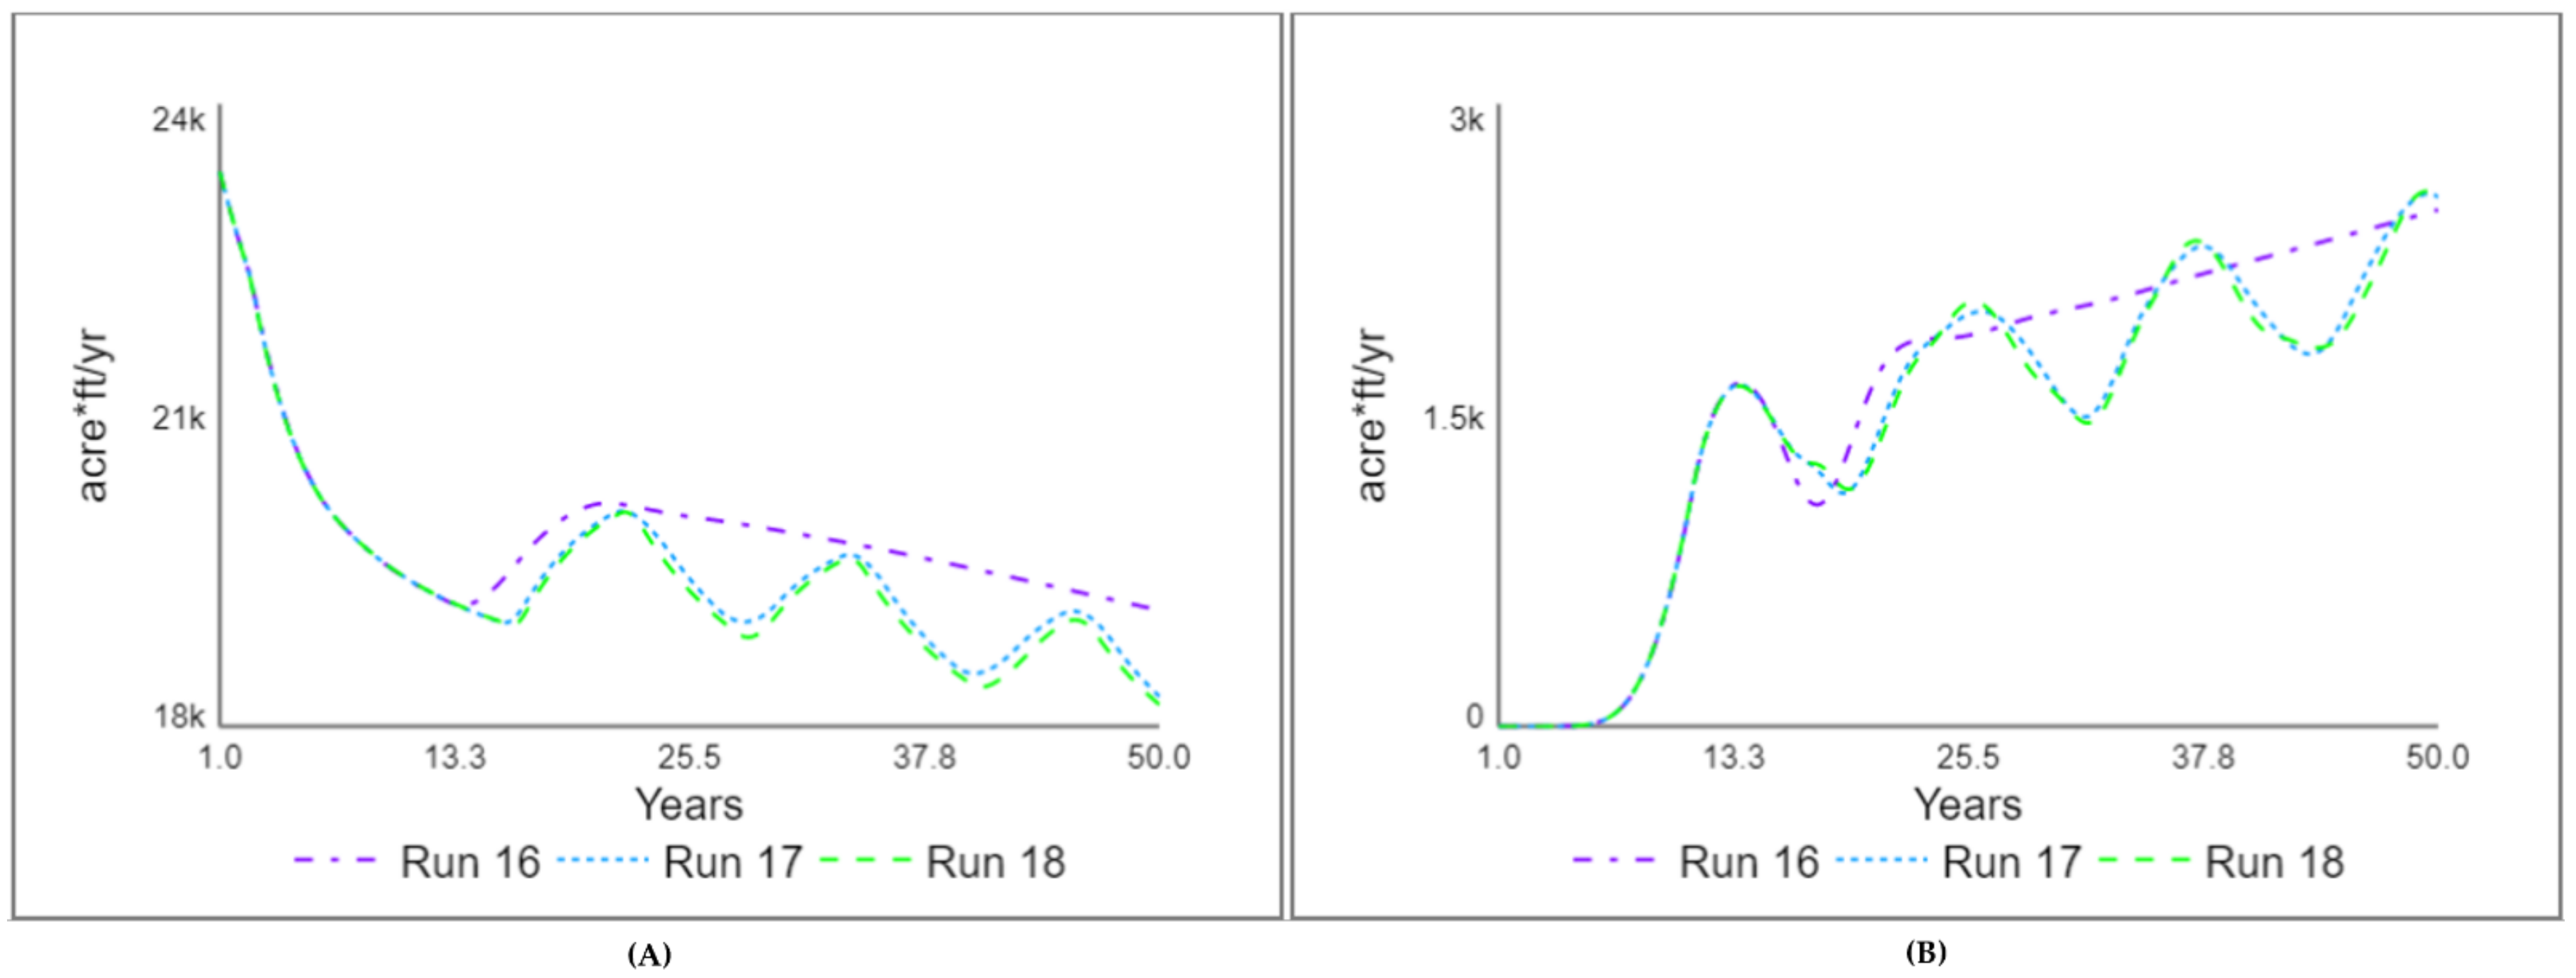
3.4. System Sensitivity
3.5. Extreme Scenarios
3.6. Future Work
4. Conclusions
Supplementary Materials
Author Contributions
Funding
Institutional Review Board Statement
Informed Consent Statement
Data Availability Statement
Acknowledgments
Conflicts of Interest
References
- Famiglietti, J.S. The global groundwater crisis. Nat. Clim. Chang. 2014, 4, 945–948. [Google Scholar] [CrossRef]
- Konikow, L.F.; Kendy, E. Groundwater depletion: A global problem. Hydrogeol. J. 2005, 13, 317–320. [Google Scholar] [CrossRef]
- Siebert, S.; Burke, J.; Faures, J.M.; Frenken, K.; Hoogeveen, J.; Döll, P.; Portmann, F.T. Groundwater use for irrigation—A global inventory. Hydrol. Earth Syst. Sci. 2010, 14, 1863–1880. [Google Scholar] [CrossRef] [Green Version]
- Wada, Y.; Van Beek, L.P.H.; Van Kempen, C.M.; Reckman, J.W.T.M.; Vasak, S.; Bierkens, M.F.P. Global depletion of groundwater resources. Geophys. Res. Lett. 2010, 37, 37. [Google Scholar] [CrossRef] [Green Version]
- IGRAC (International Groundwater Resources Assessment Centre). Transboundary Aquifers of the World; UNESCO International Hydrologic Programme; IGRAC: Delft, The Netherlands, 2015. [Google Scholar]
- Wada, Y.; Heinrich, L. Assessment of transboundary aquifers of the world—vulnerability arising from human water use. Environ. Res. Lett. 2013, 8, 024003. [Google Scholar] [CrossRef] [Green Version]
- Eckstein, G.; Eckstein, Y. A Hydrogeological Approach to Transboundary Ground Water Resources and International Law. Am. Univ. Int. Law Rev. 2003, 19, 201–258. [Google Scholar]
- Ganoulis, J.; Fried, J. Transboundary Hydro-Governance: From Conflict to Shared Management; Springer: Cham, Switzerland, 2018; Available online: https://libezp.nmsu.edu:2176/lib/nmsu/reader.action?docID=5419660&ppg=10 (accessed on 1 February 2021).
- Albrecht, T.R.; Varady, R.G.; Zuniga-Teran, A.; Gerlak, A.K.; Staddon, C. Governing a shared hidden resource: A review of governance mechanisms for transboundary groundwater security. Water Secur. 2017, 2, 43–56. [Google Scholar] [CrossRef] [Green Version]
- Tapia-Villaseñor, E.; Megdal, S. The U.S.-Mexico Transboundary Aquifer Assessment Program as a Model for Transborder Groundwater Collaboration. Water 2021, 13, 530. [Google Scholar] [CrossRef]
- Forrester, J.W. Industrial Dynamics; Productivity Press: Cambridge, MA, USA, 1961. [Google Scholar]
- Winz, I.; Brierley, G.; Trowsdale, S. The Use of System Dynamics Simulation in Water Resources Management. Water Resour. Manag. 2008, 23, 1301–1323. [Google Scholar] [CrossRef]
- Sterman, J.D. All models are wrong: Reflections on becoming a systems scientist. Syst. Dyn. Rev. 2002, 18, 501–531. [Google Scholar] [CrossRef]
- Blair, P.; Buytaert, W. Socio-hydrological modelling: A review asking “why, what and how?”. Hydrol. Earth Syst. Sci. 2016, 20, 443–478. [Google Scholar] [CrossRef] [Green Version]
- Sterman, J. Business Dynamics: Systems Thinking and Modeling for a Complex World; Irwin/McGraw-Hill: New York, NY, USA, 2000; Available online: https://books.google.com/books?id=CCKCQgAACAAJ (accessed on 1 February 2021).
- Glaubitz, A.; Fu, F. Oscillatory dynamics in the dilemma of social distancing. Proc. R. Soc. A Math. Phys. Eng. Sci. 2020, 476, 20200686. [Google Scholar] [CrossRef]
- Bingaman, J. United States-Mexico Transboundary Aquifer Assessment Act. In International Groundwater Law and the US-Mexico Border Region; Brill Nijhoff: Leiden, The Netherlands, 2006. [Google Scholar]
- Page, A.; Langarudi, S.; Forster-Cox, S.; Fernald, A. A Dynamic Hydro-Socio-Technical Policy Analysis of Transboundary Desalination Development. J. Environ. Account. Manag. 2019, 7, 91–118. [Google Scholar] [CrossRef]
- Page, A. A Public Policy Modeling Analysis of the Sustainability of Transboundary Desalination within the Sunland Park-Santa Teresa-San Jerónimo-Anapra Hydrologic-Social System. Master’s Thesis, New Mexico State University, Las Cruces, NM, USA, 2018. [Google Scholar]
- Di Baldassarre, G.; Wanders, N.; AghaKouchak, A.; Kuil, L.; Rangecroft, S.; Veldkamp, T.I.E.; Garcia, M.; van Oel, P.; Breinl, K.; Van Loon, A.F. Water shortages worsened by reservoir effects. Nat. Sustain. 2018, 1, 617–622. [Google Scholar] [CrossRef]
- Di Baldassarre, G.; Sivapalan, M.; Rusca, M.; Cudennec, C.; Garcia, M.; Kreibich, H.; Konar, M.; Mondino, E.; Mård, J.; Pande, S.; et al. Sociohydrology: Scientific Challenges in Addressing the Sustainable Development Goals. Water Resour. Res. 2019, 55, 6327–6355. [Google Scholar] [CrossRef] [Green Version]
- Gates, J.S.; Stanley, W.; Ackermann, H. Availability of fresh and slightly saline ground water in the basins of westernmost Texas. In Open-File Report; US Geological Survey: Reston, VA, USA, 1978; pp. 1258–2331. [Google Scholar]
- Hawley, J. Challenges and Opportunities for Brackish Groundwater Resource Development in New Mexico—Prediction Hydro-Science from an Octogenarian Hydrogeologist’s Perspective; White Paper; Hawley Geomatters: Albuquerque, NM, USA, April 2016. [Google Scholar]
- Hawley, J.; Kennedy, J.; Creel, B. The Mesilla Basin Aquifer System of New Mexico, West Texas, and Chihuahua—An Overview of Its Hydrogeologic Framework and Related Aspects of Groundwater Flow and Chemistry. In Aquifers of West Texas; Angle, E.S., Mace, R.E., Mullican, W.F., III, Eds.; Texas Water Development Board: Austin, TX, USA, 2001; pp. 76–99. [Google Scholar]
- Ojeda, G. Aquifer recharge estimation at the Mesilla Bolson and Guaymas aquifer systems, Mexico. In Isotope Based Assessment of Groundwater Renewal in Water Scarce Regions; Edmunds, W.M., Ed.; International Atomic Energy Agency: Vienna, Austria, 2001; pp. 23–44. [Google Scholar]
- Sheng, Z. Impacts of groundwater pumping and climate variability on groundwater availability in the Rio Grande Basin. Ecosphere 2013, 4, 1–25. [Google Scholar] [CrossRef]
- Texas Water Development Board and New Mexico Water Resources Research Institute. Transboundary Aquifers of the El Paso/Ciudad Juarez/Las Cruces Region; US Environmental Protection Agency: Washington, DC, USA, October 1997. [Google Scholar]
- Witcher, J.; King, J.P.; Hawley, J.; Williams, J.; Cleary, M.; Bothern, L. Sources of Salinity in the Rio Grande and Mesilla Basin Groundwater; WRRI Technical Completion Report 330; New Mexico Water Resources Research Institute: Las Cruces, NM, USA, February 2004. [Google Scholar]
- Rivera, A. Transboundary aquifers along the Canada–USA border: Science, policy and social issues. J. Hydrol. Reg. Stud. 2015, 4, 623–643. [Google Scholar] [CrossRef] [Green Version]
- Maupin, M.A.; Kenny, J.F.; Hutson, S.S.; Lovelace, J.K.; Barber, N.L.; Linsey, K.S. Estimated use of water in the United States in 2010. In Circular 1405; US Geological Survey: Reston, VA, USA, 2014. [Google Scholar] [CrossRef]
- Cooley, H.; Donnelly, K. Proposed Seawater Desalination Facilities in California; The Pacific Institute: Oakland, CA, USA, 2012; Available online: http://pacinst.org/app/uploads/2014/04/desalination-facilities.pdf (accessed on 27 January 2017).
- Selcraig. Albuquerque learns it really is a desert town. High Country News, 26 December 1994. [Google Scholar]
- Indicators Progress Commission. City of Albuquerque Progress Report 2004; City of Albuquerque: Albuquerque, NM, USA, 2004. [Google Scholar]
- Indicators Progress Commission. City of Albuquerque Progress Report 2020; City of Albuquerque: Albuquerque, NM, USA, 2020. [Google Scholar]
- Albuquerque Bernalillo County Water Utility Authority. 2015 Annual Report: Groundwater on the Rebound; Albuquerque Bernalillo County Water Utility Authority: Albuquerque, NM, USA, 2015. [Google Scholar]
- Fleck, J. Aquifer rising despite drought. Albuquerque Journal, 6 October 2013. [Google Scholar]
- Davis, T. Aquifer on the rebound. Albuquerque Journal, 23 August 2019. [Google Scholar]
- Cobos, G.D.L. The Genevese transboundary aquifer (Switzerland-France): The secret of 40 years of successful management. J. Hydrol. Reg. Stud. 2018, 20, 116–127. [Google Scholar] [CrossRef]
- Tversky, A.; Kahneman, D. Judgment under uncertainty: Heuristics and biases. Science 1974, 185, 1124–1131. [Google Scholar] [CrossRef]
- Simon, H.A. Bounded Rationality. In Utility and Probability; Eatwell, J., Milgate, M., Newman, P., Eds.; Palgrave Macmillan: London, UK, 1990; pp. 15–18. [Google Scholar] [CrossRef]
- Roumasset, J.A.; Wada, C.A. Chapter 5—Integrated Groundwater Resource Management. In Sustainable Economic Development; Balisacan, A.M., Chakravorty, U., Ravago, M.-L.V., Eds.; Academic Press: San Diego, CA, USA, 2015; pp. 77–89. [Google Scholar] [CrossRef]
- Petersen-Perlman, J.D.; Megdal, S.B.; Gerlak, A.K.; Wireman, M.; Zuniga-Teran, A.A.; Varady, R.G. Critical Issues Affecting Groundwater Quality Governance and Management in the United States. Water 2018, 10, 735. [Google Scholar] [CrossRef] [Green Version]
- Björk, B.-C.; Solomon, D. The publishing delay in scholarly peer-reviewed journals. J. Inf. 2013, 7, 914–923. [Google Scholar] [CrossRef] [Green Version]
- Horbach, S.P.J.M. Pandemic publishing: Medical journals strongly speed up their publication process for COVID-19. Quant. Sci. Stud. 2020, 1, 1056–1067. [Google Scholar] [CrossRef]
- Lipworth, W.; Gentgall, M.; Kerridge, I.; Stewart, C. Science at Warp Speed: Medical Research, Publication, and Translation During the COVID-19 Pandemic. J. Bioethical Inq. 2020, 17, 555–561. [Google Scholar] [CrossRef]
- Hanna-Attisha, M.; Lachance, J.; Sadler, R.C.; Schnepp, A.C. Elevated Blood Lead Levels in Children Associated With the Flint Drinking Water Crisis: A Spatial Analysis of Risk and Public Health Response. Am. J. Public Health 2016, 106, 283–290. [Google Scholar] [CrossRef] [PubMed]
- Simpson, N.; Shearing, C.; Dupont, B. Climate gating: A case study of emerging responses to Anthropocene Risks. Clim. Risk Manag. 2019, 26, 100196. [Google Scholar] [CrossRef]
- Visser, W.P. A perfect storm: The hydropolitics of Cape Town’s water crisis. J. Transdiscipl. Res. S. Afr. 2018, 14, 10. [Google Scholar] [CrossRef]
- Bradley, J. Morrison and Rogelio Oliva, Integration of Behavioral and Operational Elements Through System Dynamics. In The Handbook of Behavioral Operations; Wiley: New York, NY, USA, 2017; Available online: https://papers.ssrn.com/abstract=2997235 (accessed on 1 August 2021).
- Langarudi, S.P.; Silva, C.G.; Fernald, A.G. Measure more or report faster? Effect of information perception on management of the commons. Syst. Dyn. Rev. 2021, 37, 72–92. [Google Scholar] [CrossRef]
- Arrhenius, S. XXXI. On the influence of carbonic acid in the air upon the temperature of the ground. Lond. Edinb. Dublin Philos. Mag. J. Sci. 1896, 41, 237–276. [Google Scholar] [CrossRef] [Green Version]
- Marx, W.; Haunschild, R.; Thor, A.; Bornmann, L. Which early works are cited most frequently in climate change research literature? A bibliometric approach based on Reference Publication Year Spectroscopy. Scientometrics 2017, 110, 335–353. [Google Scholar] [CrossRef] [Green Version]
- Langarudi, S.; Sabie, R.; Bahaddin, B.; Fernald, A. A Literature Review of Hybrid System Dynamics and Agent-Based Modeling in a Produced Water Management Context. Modelling 2021, 2, 12. [Google Scholar] [CrossRef]


| Run | Country | Perception Delay | Reporting Delay | Conservation Parameter | Maximum Conservation Parameter |
|---|---|---|---|---|---|
| 1 | A | 1 | 2 | 0.5 | 0.5 |
| B | 1 | 2 | 0.5 | 0.5 | |
| 2 | A | 5 | 6 | 0.5 | 0.5 |
| B | 5 | 6 | 0.5 | 0.5 | |
| 3 | A | 10 | 11 | 0.5 | 0.5 |
| B | 10 | 11 | 0.5 | 0.5 | |
| 4 | A | 1 | 2 | 0.5 | 0.5 |
| B | 5 | 6 | 0.5 | 0.5 | |
| 5 | A | 5 | 6 | 0.5 | 0.5 |
| B | 1 | 2 | 0.5 | 0.5 | |
| 6 | A | 1 | 2 | 0.1 | 0.5 |
| B | 1 | 2 | 0.1 | 0.5 | |
| 7 | A | 5 | 6 | 0.1 | 0.5 |
| B | 5 | 6 | 0.1 | 0.5 | |
| 8 | A | 10 | 11 | 0.1 | 0.5 |
| B | 10 | 11 | 0.1 | 0.5 | |
| 9 | A | 1 | 2 | 0.1 | 0.5 |
| B | 5 | 6 | 0.1 | 0.5 | |
| 10 | A | 5 | 6 | 0.1 | 0.5 |
| B | 1 | 2 | 0.1 | 0.5 | |
| 11 | A | 1 | 1 | 0.9 | 0.5 |
| B | 1 | 2 | 0.9 | 0.5 | |
| 12 | A | 5 | 6 | 0.9 | 0.5 |
| B | 5 | 6 | 0.9 | 0.5 | |
| 13 | A | 10 | 10 | 0.9 | 0.5 |
| B | 11 | 11 | 0.9 | 0.5 | |
| 14 | A | 1 | 2 | 0.9 | 0.5 |
| B | 5 | 6 | 0.9 | 0.5 | |
| 15 | A | 5 | 6 | 0.9 | 0.5 |
| B | 1 | 2 | 0.9 | 0.5 | |
| 16 | A | 1 | 2 | 0.1 | 0.9 |
| B | 1 | 2 | 0.1 | 0.9 | |
| 17 | A | 1 | 2 | 0.5 | 0.9 |
| B | 1 | 2 | 0.5 | 0.9 | |
| 18 | A | 1 | 2 | 0.9 | 0.9 |
| B | 1 | 2 | 0.9 | 0.9 |
| Run | Amplitude 1 | Amplitude 2 | Period 1 | Period 2 |
|---|---|---|---|---|
| 1 | 16.1 | 16.2 | 10 | 12 |
| 2 | 10.5 | 15 | 14 | 12 |
| 3 | 12.3 | 15.3 | 18 | 18 |
| 4 | 14.3 | 11.7 | 12 | 10 |
| 5 | 15.1 | 13.3 | 11 | 24 |
Publisher’s Note: MDPI stays neutral with regard to jurisdictional claims in published maps and institutional affiliations. |
© 2021 by the authors. Licensee MDPI, Basel, Switzerland. This article is an open access article distributed under the terms and conditions of the Creative Commons Attribution (CC BY) license (https://creativecommons.org/licenses/by/4.0/).
Share and Cite
Atkins, A.E.P.; Langarudi, S.P.; Fernald, A.G. Modeling as a Tool for Transboundary Aquifer Assessment Prioritization. Water 2021, 13, 2685. https://doi.org/10.3390/w13192685
Atkins AEP, Langarudi SP, Fernald AG. Modeling as a Tool for Transboundary Aquifer Assessment Prioritization. Water. 2021; 13(19):2685. https://doi.org/10.3390/w13192685
Chicago/Turabian StyleAtkins, Ashley E. P., Saeed P. Langarudi, and Alexander G. Fernald. 2021. "Modeling as a Tool for Transboundary Aquifer Assessment Prioritization" Water 13, no. 19: 2685. https://doi.org/10.3390/w13192685
APA StyleAtkins, A. E. P., Langarudi, S. P., & Fernald, A. G. (2021). Modeling as a Tool for Transboundary Aquifer Assessment Prioritization. Water, 13(19), 2685. https://doi.org/10.3390/w13192685