Abstract
Water distribution networks are the backbone of any municipal water supply. Their task is to supply the population regardless of the respective demand. High resilience of these infrastructures is of great importance and has brought these infrastructures into the focus of science and politics. At the same time, the data collected is highly sensitive and often openly unavailable. Therefore, researchers have to rely on models that represent the topology of these infrastructures. In this work, a model is developed that allows the topology of an urban water infrastructure to be mapped using the example of Cologne, Germany by combining freely available data. On the one hand, spatial data on land use (local climate zones) are used to disaggregate the water demand within the city under consideration. On the other hand, the parallelism of water and urban transportation infrastructures is used to identify the topology of a network by applying optimization methods. These networks can be analyzed to identify vulnerable areas within urban structures.
1. Introduction
The topology of water distribution systems (WDS) is highly dependent on the urban structure which they provide for. First, they are restricted to the common ground, which is mainly the street network. Second, they have to scale with the water demand resulting from the population density. Recently, water distribution systems have been confronted with two pressing topics. On the one hand, water distribution systems face challenges from ongoing urbanization. On the other hand, climate change poses further changes on the availability and demand of water. This is where the question arises in which sense, the phrase “form [...] follows function” [1] applies to the design of water distribution systems. The function of water distribution systems can be easily identified as meeting a spatially and temporally distributed water demand. In turn, the form, that is, the topology of the water distribution system, can be considered on two levels: on a lower level, the topology of the water distribution system follows the existing form of an urban pattern or, considering a higher level, the urban pattern has to adjust for an optimal water distribution system. As many urban forms grew generically, here the water distribution system had to be designed to best meet its function under the constraint of an existing urban pattern. Yet, considering rapidly growing urban forms or planned urban forms, the higher-level interpretation could be applied. The first introduced design maxim combined with the guiding principle “less but better” [2] leads to the design maxim “maximize quality subject to functionality” [3]. This maxim can be applied to water distribution systems when considering mathematical optimization with the aim of minimizing cost, while ensuring the function of meeting the water demand. In this work, a methodology based on optimization generating a WDS suitable to the underlying topology and considering a realistic water demand is presented. To do so, the one important openly unavailable is the demand and its spatial as well as temporal distribution. This data often underlies privacy policies and is hard to collect [4]. Therefore, this work relies on openly available geo-referenced data on the development to spatially disaggregate the total water demand. This approach pursues general applicability, while at the same time increasing the water demand prediction compared to state-of-the-art approaches, for example, [5].
Furthermore, it is the aim to ensure minimum functioning of the system, particularly during incidents and other unexampled events. Especially for critical infrastructures such as the water distribution system, resilience assessments and enhancements is an ongoing research interest [6]. Current state-of-the-art WDS generators do not consider the systems’ resilience [5]. Therefore, the introduced methodology is to be enhanced to additionally optimize the resilience in future works. In short, the aim is to present a methodology which allows for the generation of water distribution systems which account for the influence of the urban form on the spatial disaggregation of the water demand.
While the resilience research of critical infrastructure is of high interest, their related data, comprising personal as well as critical data, are highly shielded, and therefore, often unavailable. Thus, broad analyses and performance comparisons are often based on virtual data. These may be completely detached from real-world infrastructure, or simulate the same. As previously introduced, for generic water distribution systems, one highly unfound parameter is the temporal and spatial water demand distribution. As a consequence, this need is herein addressed by presenting the implementation of a highly automated approach to generate realistic real-world water distribution systems for spatially disaggregated water demands from geo-referenced data. Focusing on deriving the water demand, geo-referenced, accessible, and non-personal or critical data are considered. The derived framework is applied for the German city of Cologne.
This paper is structured into in-depth literature, as well as a data review (Section 2), the presentation of the developed framework (Section 3), and its underlying optimization model and data preprocessing (Section 4). Subsequently, the application city of Cologne is introduced as an instance of the optimization model. The solution and resilience assessment of the generated optimal realistic water distribution system is discussed in Section 5. Finally, an outlook on how this framework can be further enhanced and applied is given in (Section 6).
2. State-of-the-Art
The availability of geo-referenced data are crucial to derive location-specific water demands. Therefore, the following section provides an overview of existing data and data analysis methods, as well as frameworks. Subsequently, the estimated water demands have to be met by a water distribution system. To find a possible water distribution system, known relations as the parallelism of urban infrastructures, as well as existing frameworks for the generation of water distribution systems are examined. To conclude, resilience metrics assessing the water distribution system’s topology are presented.
2.1. Spatial Disaggregation of Water Demand
The high spatial resolution representation of water demand in urban areas is key information for determining the function that a water distribution network must fulfill, that is, meeting the water demand. Although building-level water consumption data can be (i) collected by local water utilities for billing purposes on the one hand, or (ii) systematically collected by vendors through smart meters [7], these data are often unavailable on large scales for research purposes due to privacy issues. In turn, considering the data breakdown from coarse non-personal data to fine data, there are different approaches modeling the water demand for a city as a whole by combining different data [8,9,10]. The water demand depends on different factors, especially the use density of buildings by humans and non-human processes dependent on water. This relates to the building geometry as well as physics, and the use of census data, socio-economic data, and meteorological data. Yet, just a few methods have been presented that spatially resolve the water demand within a city.
Bao et al. [4] presented a method by simulating water demand in individual buildings depending on building geometry, building physics, census data, and socio-economical and meteorological information. Although this method provides spatially highly accurate information on water demand, it has two major drawbacks: First, detailed information on individual buildings, such as their use, geometry, and information about the number of occupants, is necessary for implementation. This information is only available in this high data quality selectivity, which is mostly not city or even country-wide. Secondly, this data form is not suitable for further processing on a large scale, due to its vector-based structure [11].
A more advantageous variant is the disaggregation of a given water demand using gridded data sets. Similar to how water use for different purposes (washing, cooking, etc.) can be disaggregated within households through modeling [12], this approach can be used at a higher level for water demand within a city, as annual water demand is often recorded and published.
This information can then be disaggregated on spatially more highly resolved data, where the spatial information on urban morphology is condensed for a specific area to enable large-scale analyses. One method that has become well-established for spatially characterizing land use in urban areas is local climate zones (LCZ) developed by Stewart and Oke [13]. These data describe the built-up morphology in urban and rural areas, and are available in relatively high resolution (100 m × 100 m) for continental Europe and North America) [14]. Although they were originally introduced to investigate the influence of the built-up morphology of urban areas on the climate, they now have many other applications, like the characterization of the spatial heterogeneity of land use in cities [15] or on land consumption [16], among others, which also show the dependence on census data as well as commercial density.
2.2. Generation of Water Distribution Systems
Urban water infrastructures are critical infrastructures, and their operation data also contain personal data. Therefore, water infrastructure data have data privacy issues, meaning they are widely unavailable or only available at aggregated spatial levels. Especially for large-scale analyses of different cities and comparison of different water infrastructures, many real-world water infrastructures are demanded. For graph theoretical analysis purposes, water infrastructures can be represented as (planar) mathematical graphs. Therefore, the pipes are modeled as edges, and nodes represent their junctions, as well as any sources or taps, that is, sinks. A planar graph is given if there are no under- or over-crossings of edges, but instead, there are junction nodes wherever edges cross.
This graph representation of the water distribution system is also possible for the urban transportation infrastructure, and analyses have shown that the edges, that is, pipes, of the water distribution system are in parallel to the edges of the urban transportation system, that is, streets and pathways [17]. In Germany and many other countries, this is also required by standards [18]. Data of transportation infrastructures are available on many platforms, such as open street maps [19] or Google maps [20]. As the energy requirement to achieve the water flow, as well as pressure, depends on the elevation profile of the considered location, elevation data are also required [21].
Based on this knowledge, the Tool DynaVIBe [5,22] generates virtual water distribution systems for urban areas. Therefore, the user has to provide the information of the water demand within the selected area, as well as information about the location of the sources. Furthermore, the user can choose between either a homogeneous water demand or a normal distributed water demand within the selected area. The algorithmic approach allows for the generation of several water distribution networks.
In contrast to the previously introduced algorithmic generation of water distribution networks, optimization techniques are to be applied to identify a close to real-world water distribution system within an urban structure. Today, there already exist technical optimization models to find the optimal solution for water distribution systems and their operation. For example, Müller et al. [23] optimize the booster stations of high-rise buildings by considering the pump type and location to allow for central or decentralized booster stations. Lorenz and Pelz [24] presented an optimization model to improve existing water distribution systems towards maximized resilience for predefined costs. These optimization programs are based on operations research methods applied to technical design and operation challenges [25,26]. While in this work, the proposed optimization program is applied to identify a close-to-real-world water distribution system, different optimization objectives can represent the user’s needs as increasing the resilience of the network. Today’s established design guidelines lead to known and good solutions, and the implementation of the objective, for example, minimization of the overall cost or the maximization of resilience under different constraints, guarantee the physical feasibility which allows for (out-of-the-box) optimal solutions.
2.3. Resilience of Water Distribution Systems
As already suggested, an established aim of present-day water distribution systems’ design is its resilience. This aim is derived from asset management activities of water infrastructure providers, as well as decision-making support [27]. In contrast to a formerly deducted robust design, resilient technical systems allow for a predefined minimum functionality in case of disturbance or unexpected events, as well as the capacity to recover to their set point functionality [28].
To assess a system’s resilience, static and dynamic resilience metrics can be distinguished. Especially in the planning phase, static resilience concepts prove valuable, as they assess the infrastructure’s topology. In turn, the resilience assessment of the operation and recovery process is possible with dynamic resilience metrics. The former is often a resilience metric based on the graph theory, as it is the case for simple graph theoretical metrics reviewed by Yazdani et al. [29], which assess, among others, the link density, the average node degree, and the meshed-ness coefficient, stating that resilient networks are both robust and redundant. The resilience index introduced by Herrera et al. [30], which was physically motivated by Lorenz et al. [31], describes the supply of the demand nodes as well as the redundancy in the network, considering alternative feeding paths from the same, as well as additional sources. The buffering capacity introduced by Leise et al. [32] assesses the number of components which may fail to still ensure a minimum functionality of the network, labelled as k-resilient. Lastly, the resilience index introduced by Todini [33] describes the excess pressure at single demand nodes, which in the case of a disturbance, should allow for minimum demand security. Dynamic resilience metrics consider the operation and the recovery process by assessing the capabilities of monitoring, responding, learning, and anticipating, first introduced by Hollnagel [34,35,36]. Therefore, the downtime multiplied with its specific non-fulfillment in function is often seen as the basis for assessing the resilience, for example, as in the References [37,38].
In general, it is important to include resilience as a central parameter in the planning and operation of water infrastructures. Digital models or digital twins of the infrastructures, which can be used to make the concept of resilience understandable for decision-makers (e.g., from politics), are therefore of great importance in order to transfer concepts and findings from the scientific context into practice. Additionally, increased monitoring of operation data in the context of digital waterconcepts can support the development of resilient operational concepts, to monitor water quality or energy consumption and detect system failures, like pipe bursts. Furthermore, the influence of topological changes in the network (e.g., additional pipes) on the resilience can be quantified.
3. Framework
To answer the presented research question and identify spatially resolved water demand and the network topology of a water distribution system, five different kinds of data were combined. The concept of parallel infrastructures to identify possible locations of water infrastructures in a city was applied. Therefore, (i) urban transportation infrastructure is the basis for the water distribution network. For the next step, (ii) data on local climate zones (LCZs) are used as proxy for the morphologic pattern derived from earth observation data to spatially disaggregate (iii) the total water consumption in a given time-period within a city. This water is fed from (iv) the water sources, whose location is available from the local water supplier. Finally, to account for the underlying physics, (v) the elevation profile of the area is considered as the necessary pressure supply needs the height difference to be overcome. While more detailed data than the considered LCZs for the considered urban structure, as 3D city models, would result in more accurate water demand data, these data are not available on a global scale. In turn, local climate zone data are currently produced in a consistent manner from Earth observation data. Therefore, the framework presented herein can be applied for other cities across the globe. Additionally, these data allow conclusions on the census data, commercial use, and built-up morphology, and are therefore connected to the water demand.
The disaggregated demands are located on the closest nodes of the possible water infrastructure. Finally, by using optimization techniques, a cost-efficient real-world water distribution system within a city is identified, connecting all nodes with non-zero water demand. The aim of this optimization can be, for example, cost-efficiency, characteristic values of real supply networks (number of meshes or connections per node) or alternative characteristic values, such as resilience metrics assessing the network topology. The framework is illustrated in Figure 1.
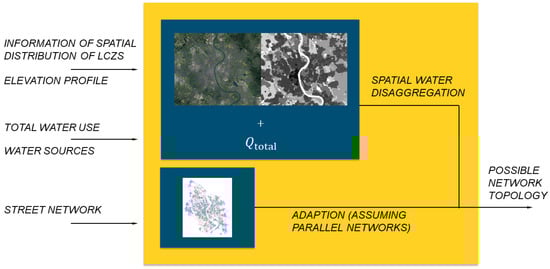
Figure 1.
Framework used in this work.
The presented methodology allows for the generation of water distribution systems to the likes of the operator in the long-term. Therefore, the wide applicability to urban forms due to the open data approach is a particular aim of the presented work. While this approach considers the generation of water distribution systems from scratch, water suppliers can consider adaptations of their existing networks to match the generated optimized networks.
4. Data and Methods
In the following, the different types of data and methods used to perform our analysis in detail are presented. First, the data are identified, and then the water demand disaggregation method is presented. Next, the possible pipes, that is, edges, of the water distribution system reflecting the urban pattern are determined. Finally, the optimization problem is set up and initialized for the city of Cologne.
4.1. Data
To narrow down the data of interest, first, the systems boundary has to be defined. Therefore, the spatial perimeter of an area to be studied and the water demand of this area in a given period of time are demanded. These data are mostly openly published by the water suppliers.
In the presented study, the boundary is given for the local water supplier and network operator of Cologne, Germany, that is, RheinEnergie AG and rheinische NETZgesellschaft, respectively, and is represented by the yellow polygon in Figure 2a. The water consumption for the previously defined polygon (yellow line), as well as the geographic position of the waterworks, is openly available. For the year of 2019, the water consumption amounted to . In contrast, more precise information on the size of each waterwork meeting this demand was provided by the local water network operator and is under non-disclosure.
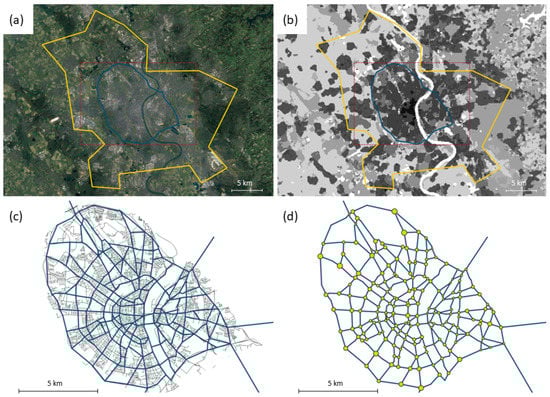
Figure 2.
(a) Satellite image (Google Earth, 2021) and (b) local climate zones of Cologne, Germany [15]. The yellow polygon marks the administrative boundary, and the blue one, the inner city, which is investigated in this paper. (c) Streets from OpenStreetMap with the possible network topology are represented by blue edges. (d) The possible network topology with sizes of the nodes (yellow points) represent the water demand disaggregated to the graph.
To disaggregate the water consumption spatially, spatial data on LCZ within the given area are applied. For the city of Cologne, these data are derived from satellite data (Sentinel 2-Data). Detailed information on the used framework to identify the LCZs can be found in Qui et al. [39]. The LCZ-land use classes, originally introduced by Stewart and Oke [13] to analyze the impact of the built-up morphology on the climate of urban areas, describe the degree of built-up areas in a defined area. The considered area is thus divided into a grid with cells of 100 m × 100 m resolution. The proportion of built-up areas (surface fraction) and the average height of the buildings in an area is considered to assign each cell a specific LCZ. The names and characteristic values of the individual LCZs are listed in Table 1. A schematic representation of the considered area of Cologne, Germany is shown in Figure 2b.

Table 1.
Local climate zones adapted from [13]. * The value for the local climate zone class 10 (heavy industry) is calculated by doubling the highest value occurring in the other classes (i.e., 12.5 m/A for class 1).
Since in this work, the water distribution system for the inner city of Cologne is to be modeled, a second boundary is defined, given by the blue polygon in Figure 2. The water demand within the blue area is calculated by considering relative water consumption within the LCZs of the area of interest in relation to the LCZs within the whole service area. This results in a water demand of QTotal,blue = 0.33 · QTotal,yellow = 31.4 Mio.m3/y.
Lastly, information about the location of possible pipes of a supply network within a city is needed. Assuming that supply infrastructures run in parallel to urban transportation infrastructures, for which geo-referenced data are openly available on OpenStreetMap (Figure 2c), these can therefore be used as the basis of possible edges of the WDS.
Finally, these information and data are merged within the QGIS tool [40].
4.2. Disaggregation of Water Demand
As mentioned above, the total water demand in a city is disaggregated according to the built-up morphology present in the urban structure. Therefore, the fraction of a specific urban area of the total water consumption in the city is identified. It is assumed that the water consumption of the area i correlates with the building volume within this area, as this depends on the census data, as well as the socio-economic use. To calculate the building volume in a specific area within the city, the information given within the LCZ is considered (Table 1).
The average surface fraction and height is calculated using the mean of the specified values. Whenever solely lower boundaries were given for the height, as it is the case for LCZ 1 and 4, these values, instead of a mean value, were used. By multiplying the average height and surface fraction, the average building volume per area in m is calculated. Therefore, the different LCZs can be compared and weighted. Since the objective is to map the water supply system currently in place in the city, information on population growth or economic growth is not considered.
It has to be emphasized that this procedure is, obviously, an approximation only, as the values for height or surface fraction for two pixels with the same LCZ may differ from one another due to the intervals specified in the respective classes. Nevertheless, the method is an effective and time-saving method to incorporate the morphology of a given city into the identification of a water distribution network. In future work, the method of disaggregation is to be matched with aggregated demand data to be provided by the water supplier.
After each cell within the system boundary described above has thus been attributed a defined weighting factor , the sum of these weighting factors can be calculated as
with this weighting factor now known, the respective water demand in the considered cell can be determined as
Since each pixel can be assigned to their respective node in the possible water distribution system, the water demand of each network node can be specified as the sum of the specific water demand of all pixels assigned to this node. Thereby, the total water demand is distributed among the individual demand nodes of the network.
4.3. Identification of the Possible Water Network
To identify the possible edges of the main water distribution system, the parallelism of the urban transportation network and the water distribution system is exploited. The aim is to implement a highly automated framework using open-source data implemented in the open source programming language python to allow for wide applicability. Therefore, the open-source data of urban transportation infrastructures available via OpenStreetMap and its categorization by tags is considered. To focus on the main water distribution system, a small study of the tags allowed for an elimination of two tag types, that is, residential and living street, as they do not map the general urban structure. The remaining street types form the characteristic urban structure of the considered city. As streets with several lanes are represented by multiple edges, up to one edge per lane, in the first step, these multiple and close-to-parallel edges have to be condensed to one edge representing the street. To do so, three consecutive simplifications are carried out. First, for all edges crossing each other, a junction node is added, and the two crossing edges are divided into four separate edges. This also guarantees a planar graph. Secondly, nodes within a close radius are aggregated in one node. For example, the intersection of two double-lane streets consists of four junction nodes, which are then comprised in one node with eight edges representing the double-lane streets crossing in this node. Finally, parallel edges between two nodes are reduced to one edge by choosing the edge of minimum length through a simple minimum path optimization. This results in a planar graph with undirected edges, simultaneously without any parallel edges.
The computation time of the implemented optimization program mainly depends on the number of nodes and edges in the maximum possible water distribution system from which edges to lay pipes as well as their respective diameter are chosen. Therefore, this number is to be minimized in a second step. This is done by eliminating all nodes solely connecting two edges which thereby do not represent an intersection. The two former edges are then replaced by one continuous edge. The new edge is assigned the summed length of the two edges it replaced. This process is repeated until there are solely junction nodes left.
In a last manual step, the resulting graph is minimally adapted to account for information given by the local water provider and to further reduce the computation cost of the following optimization. To achieve the latter, edges over-representing the urban structure are neglected. This step is not mandatory when applied to other cities.
The resulting maximum possible main water distribution system then has no diameter values assigned to the edges, which allow for pipes to be laid. The previously disaggregated demand of each pixel is then assigned to the nearest node to the centroid of each pixel. Therefore, to a single node in the possible WDS, the sum of the water demand of all pixels closest to it is assigned. To subsequently decide how this demand can be met and which design parameters have to be chosen, that is, the diameter of the pipes and the edges on which a pipe has to be positioned, a mixed-integer linear optimization program is implemented.
4.4. Water Distribution System Design Optimization Problem
Designing an optimal water distribution system (WDS), with respect to various possible objectives, is a challenging combinatorial problem for which mathematical optimization can be applied to find the optimal design. Objectives can be cost minimization, performance maximization, or resilience maximization, to name a few. In this work, we aim to minimize the investment cost of the WDS in the sense of robust design. The demands of all nodes have to be covered for the peak load of the WDS. The operating costs are not considered, and the WDS is assumed to be quasi-stationary. The mentioned possible optimization objectives can be pursued by a multi-objective optimization problem. In this case, the user has to define a prioritization or a conversion of the different goals into one aim. Therefore, weighting of the different aims is mandatory. This weighting is mostly based on socio-economic and political values, which makes multi-objective optimization highly dependent on the user. Therefore, in future work, instead of just one aim being chosen as the objective, the other possible aims can be implemented as constraints for which the domain is then varied to find a Pareto front of the aims from which the user can then choose the suiting solution. In this work so far, one sole aim, cost minimization, was implemented.
The optimal WDS is a subgraph of the maximum possible WDS, consisting of nodes with a water demand and undirected edges. These are represented by two oppositely directed edges (Table 2) weighted by their investment cost dependent on their length and the respective diameter. On these edges, pipes can be placed by the optimization program to design the WDS. The counter-directed edge of each edge in the graph allows for the deduction of the sets of adjacent nodes . With the addition of other useful sets (Table 2) as well as the introduction of the decision variables and parameters (Table 3 and Table 4 respectively), the Mixed Integer Linear Program (MILP) can be expressed in an abstract form, as it is presented below.
Table 2.
Sets of the optimization problem.
Table 3.
Decision variables of the optimization problem.
Table 4.
Parameters defining the optimization problem.
The optimization objective is the cost minimization composed of the total pipe installation cost, with being the diameter-dependent specific installation cost, and the length of the pipe .
The binary decision variable contains the two main decisions for the construction of pipes in the WDS. The first one is the decision on whether a pipe is installed on the corresponding directed edge or not. Additionally, pipes can have different discrete diameters which are listed in the set of diameters . One of those diameters has to be chosen in the case of a pipe installation on an edge. This leads to a 1-entry for the corresponding diameter. No pipe is installed if no diameter is chosen, which is the case for . Secondly, the variable is introduced to minimize the pump count to the necessary minimum for the optimal network. A functional price of 1 € is enough to force the minimum pump count without altering the network. Without considering any costs for pumps, there would be no optimization pressure on the pump count, and a multitude of optimal solutions would exist. Further costs regarding the purchase of pumps are neglected to limit the complexity of the resulting optimization problem. Pump costs are mainly proportional to the hydraulic power output which depends on the volume flow rate and the pressure increase over the pump . This would lead to a non-linear expression in the optimization problem, leading to a significant increase in complexity in comparison to a MILP. Nevertheless, the optimization pressure for the creation of a minimal network with the corresponding minimal pump count is present, even though pumping losses are neglected.
The WDS design is subject to physical, technical, and logical constraints. First, the continuity equation has to be valid for all nodes in the WDS (Equation (4)). Water can only enter the WDS over the reservoir nodes with their respective maximum inflow (Equations (5) and (6)). Furthermore, solely one pipe exists between two nodes in reality, while the flow direction is a result of the pressure gradient. This is ensured by Equation (8) so that the maximum one -irected pipe is installed per edge and otherwise, the volume flow is constrained to 0 (Equation (7)). A maximum volume flow for each diameter is implemented to avoid higher velocities which in turn leads to higher pressure losses. Additionally, for the pressure loss calculation, it is assumed that the velocity is in the range of the characteristic velocity to allow a linear pressure loss formulation and thereby reduce the complexity of the optimization program, presented later (Equation (10)).
The second main physical constraint is the pressure distribution, expressed by the first law of thermodynamics for the stationary case (Equation (9)). It has to be valid for all edges and is coupled with the volume flow by the pressure loss calculation for each edge with the pressure loss coefficients and the estimated mean velocity (Equation (10)). Pressure losses are assumed to occur mainly in pipes, and losses caused by other components are accounted for with an increased roughness of the pipes. The mean velocity as a parameter is introduced to avoid a non-linear expression. Pumps are placed on pipes to increase the pressure. The binary decision variable equals to 1 in the case of an installed pump, which is only possible on edges where a pipe is to be installed (Equation (13)). The actual pressure increase for a pump has to be at least to avoid the unrealistic installation of many very small pumps spread over the WDS (Equations (11) and (12)). This would also result in a cost-inefficient solution. The reservoir pressure as a boundary condition, is specified by Equation (14). All consumer nodes have to fulfill a minimum pressure to guarantee a convenient water extraction, and a maximum pressure is defined, according to the pressure class of the pipes installed, to prevent any damage on them (Equations (15) and (16)).
The WDS in cities are usually connected graphs that are mostly grown historically. To increase their resilience, newly developed systems are connected to decrease the dependence on a certain reservoir. It is therefore required that the generated WDS is a connected graph. This request can be expressed by another simple transport problem. Treating all pipes as undirected edges, there has to be a path between one reservoir node to each of the other reservoir nodes to obtain a connected graph. The binary decision variable specifies whether an edge is part of the path from reservoir to the reservoir node r. The constraints (17)–(21) force the creation of such paths via a simplified continuity rule. The imaginary flow out of the source node is constrained by Equation (20) and is constrained to flow into one of the reservoirs and therefore targets by Equation (21). To find a connected graph, the imaginary flow has to find its way from source to sink. Therefore, for all other nodes, Equation (19) applies, allowing only for nodes without connecting edges or one ingoing and one outgoing edge in combination with constraint (18).
Another aspect of the optimization is to obtain a WDS with comparable architecture and characteristics to those observed in real cities. The most cost-efficient solution of the optimization would be a minimum spanning tree for each reservoir node which represents the root node of the minimum spanning tree. Those trees would just be connected with the minimum overall length of pipes needed to satisfy the added connectivity constraints (Equations (17)–(21)) due to the minimum cost objective. WDS observed in reality rather exhibit a meshed structure with loops and increased connectivity, particularly for areas with higher building density, mostly the city center. Yazdani et al. [29] presented several structural network measurements to characterize typical WDS. Among those measurements are the link density l (Equation (22), the average node-degree (Equation (23)), and the meshed-ness coefficient (Equation (24)). All of them solely depend on the edge- e and node-count n.
Constraints for the minimum value of these three structural network measurements are added to force the creation of a more realistic WDS with loops and increased connectivity. Constraints (24) and (25) are just a reformulation of these metrics utilizing . The edge count is calculated over the sum of chosen diameters corresponding to one pipe each over . Due to the cost-minimization objective, the optimization pressure tries to reduce the amount of installed pipes, which leads to lower connectivity and less loops. Consequently, constraints for the maximum of those structural network measurements are not necessary.
The presented MILP is implemented in pyomo, which is a Python-based, open-source optimization modeling language and can subsequently be solved by different solvers. In this work, the Gurobi solver was applied.
4.5. Optimization Instance
The abstract model presented in Section 4.4 has to be initialized by an optimization instance to represent the case study. In this work, the German city of Cologne is the instance that the previously stated optimization program is to be solved for. The main optimization is implemented in Python with the Pyomo package [41] for the modeling of the optimization program. For the preprocessing, the packages WNTR [42] and NetworkX [43] are used. The possible network topology created in Section 4.3 is used to initialize the sets of nodes and edges. Other sets are created with the water demand data, as well as the reservoir information obtained from the local water supplier and network operator (RheinEnergie AG and rheinische NETZgesellschaft). The used parameter values for the optimization instance are given in Table 5.
Table 5.
Instance parameters defining the optimization problem.
An order of magnitude analysis, as deduced by Lorenz et al. [31], justifies the use of the pressure loss calculations for hydraulic rough pipes in our case. A dimensionless pressure loss coefficient is introduced which is approximated with the friction factor according to Prandtl–Karman’s law in Equations (28) and (29).
A mean velocity of is assumed for the pressure loss calculation in constraint (10) since the calculation of the true pipe velocity would cause non-linearities in the program. The maximum volume flow rate is calculated for constraint (7) to limit velocities conservatively to . That way, the velocities are guaranteed to be in the same order of magnitude as the assumed mean velocity so that the underlying assumptions for the pressure loss calculation after Lorenz et al. [31] are still applicable.
The minimum pressure at consumer nodes is demanded to be to ensure a sufficient driving pressure difference for the expected volume flow rate. On the other hand, WDS in Germany have to withstand a positive working pressure of whereas water hammers and other pressure surges are limited to a maximum of [44]. Therefore, the pressure class of the considered pipes is chosen as since Cologne is a relatively flat city with a maximum elevation difference of in the considered area. This results in a maximum admissible static pressure of above the ambient pressure in the reservoirs.
Pipe costs are derived from Chee et al. [45] who performed a detailed cost estimation for the total installation cost of long-distance water transmission pipelines in the US. Their cost estimate is based on the average manufacturer price by comparing various supplier prices. A large price variance is observed even for pipes of the same type and material [45]. For the city of Cologne, it is assumed that mainly PVC and PE pipes are employed in the WDS with diameters spanning from . Since PE pipe costs are only available in [45] for diameters up to in the given pressure class, PVC pipes are assumed for all installed pipes in the WDS. Chee et al. [45] also emphasize that their installation cost calculation is not applicable for WDS in cities. Therefore, installation cost from Nussbaum and Thalman [46] are used who designed a district heating system in Switzerland. Values are directly taken for and linearly extrapolated for diameters which also matches the qualitative behavior in Chee et al. [45]. The total cost results as the sum of the pipe and the installation cost (Figure 3). Even though the cost of installation and materials in Germany might differ from the ones in Switzerland and the US, the qualitative behavior of the underlying models matches, and is assumed to be similar for Germany. Only the qualitative cost behavior in dependence on the diameter is decisive for the optimal WDS, whereas the absolute pricing only has an influence on the total investment cost. According to the local water supplier, the installation cost is highly sensitive to the conditions on site, so they were not able to provide an estimate for the installation cost.
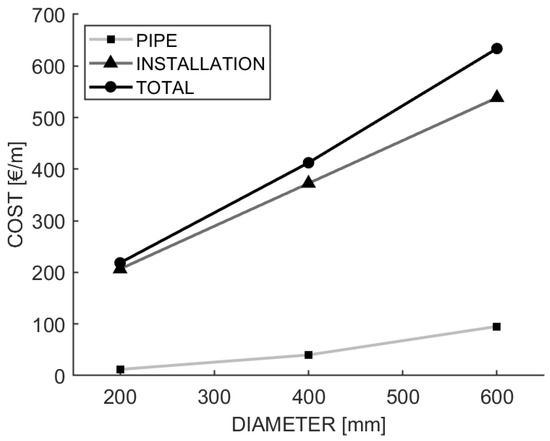
Figure 3.
Cost composition of the total pipe installation cost per meter in dependence on the diameter.
Yazdani et al. [29] calculated the values for the three selected structural network measurements (Equations (22)–(24)) for the city of Kumasi in Ghana. These values were adopted with a slight relaxation to stay in the same order of magnitude, but at the same time, to put less pressure on the optimization.
5. Results and Discussion
The cost-optimal design of water distribution systems is one of several possible objectives as cost-efficiency, resilience, and other socio-economic aims. In this work, a cost-minimal water distribution system was the aim. This objective, without any further requirements to the network stated as constraints, leads to as many networks as there are sources, each representing a minimum spanning tree. Therefore, this solution is constrained to force a connected network of all pipes. Furthermore, several graph theoretical metrics and their typical value range are considered to achieve a realistic water distribution network. The resulting optimal water distribution system is depicted in Figure 4. Herein, all possible edges from which the optimal WDS was chosen are shown as grey lines, while the pipes of the optimal WDS are shown as blue lines of different width associated to their respective pipe diameter.
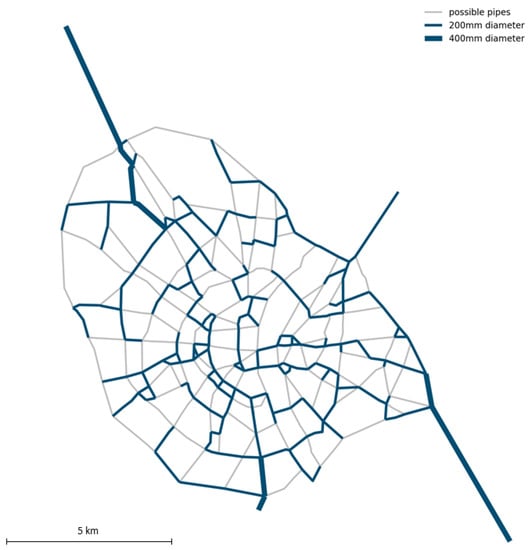
Figure 4.
Cost-optimal WDS (blue) with different line widths to represent the change in pipe diameter and maximum possible network topology (grey).
The optimal WDS is, as constrained and therefore expected, a connected graph with a predefined number of meshes. Due to the cost-minimization in the objective function, meshes are chosen for small pipe lengths in addition to the minimal spanning tree. This results in a WDS with characteristic values for the considered graph theoretical metrics, while the meshes seem to be on a smaller level than it is the case for real-life WDS. This comparison is based on a visual comparison of typical real-world water distribution systems, as identified for the city of Darmstadt in [24]. Therefore, the graph theoretical metrics considered do not fully describe the characteristics of real-world WDS. In future work, a comparison of the real-world water distribution system with the optimization solution is planned by identifying characteristics which fully describe the topology of real-world water distribution systems.
Additionally, the chosen diameters decrease further away from sources along a continuous path, as it is the case for real-world WDS. This is a result of the ramification and the splitting of the volume flow at junction nodes. Depending on the size of the source, that is, the volume flow out of the source, different diameters are chosen to connect the sources to the area in which the water demand arises.
Even though the resulting optimal WDS is a connected graph and the underlying urban structure is a concentric structure, there is no circular path on one of the outer possible rings. Instead, the connected graph can be separated into two sub-graphs by cutting just one single edge, even after a few ramifications of the path coming from each source.
Considering how the physical behavior of the optimal solution shows that the volume flow decreases from each source at the different branchings and due to the feeding of the demand nodes, see Figure 5. This is ensured by the continuity rule constraining the optimization program. Furthermore, the pressure at the demand nodes is consistently higher than 3 bars, which is predefined as the minimum pressure. Solely, the sources have ambient pressure. Pumps are placed on edges after each source and within the network to ensure this pressure value at the demand nodes.
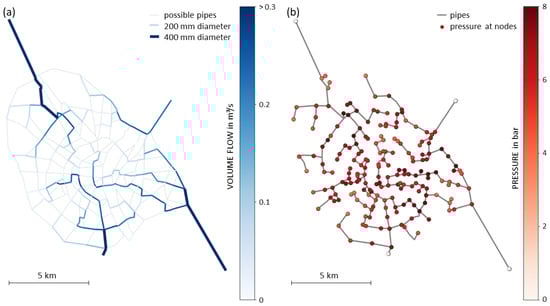
Figure 5.
Quasi-stationary behavior of the generated WDS. (a) Volume flow in the pipes, (b) pressure at demand nodes.
The resulting optimal WDS topology can be assessed towards its resilience, applying the adapted resilience index first introduced by Herrera et al. [30]. This resilience index is applied to compare different urban structures. When normalized by the number of sources, the specific resilience value is one order of magnitude smaller than resilience optimal water distribution systems, as analyzed by Lorenz et al. [24,47]. This deviation was partially expected, as for the generation of the present WDS, and the resilience was neglected as a constraint or objective. Yet, the resilience value is still significantly lower than for a typical real-world WDS, which again indicates that the considered graph theoretical metrics for characteristic real-world WDS are not exclusive.
Limitations
The results and methods presented have some limitations that will be briefly discussed below. So far, the objective function does not consider the pumping stations’ investment costs or their operation costs, but instead forces the solver to use the minimal number of pumping stations for which the cost-minimal pipes network can be realized. For the present network, this is the case for nine pumping stations, partially located on the edges connecting sources and the network and partially located within the network. If investment costs and/ or operation costs of the pumps were considered in the optimization, it could be possible that in part, larger diameters would be chosen to reduce the energy costs to supply the pressure due to decreasing pressure losses in more expensive and larger diameter pipes.
In general, it should be mentioned that the quality of the networks generated using this methodology depends significantly on the data used and the constraints of the optimization. The more precise typical properties of water supply networks, such as the number of edges per surface, the number of closed rings in the considered network, or the distribution of node degrees is known, the better the real networks can be represented. With such condensed information, network operators could provide data to scientists for validation without publishing information about specific critical infrastructure routes. Since these characteristics are currently unknown and will be developed in future work, a quantitative comparison between a modeled and real network is not possible at this time.
6. Conclusions and Outlook
This work demonstrated the potential of considering (open-source) geo-referenced data to disaggregate water demands in urban structures to allow for the generation of real-world water distribution systems. The introduced method allows for a significant increase in the data-driven significance of the water demand estimation for the generated water distribution system compared to state-of-the-art methods to estimate the spatial distribution of the water demand. The automated setup of the water distribution system generation paths the way towards an application to further cities. This is also encouraged by the open-source data considered in this work. While in this work, the land-use classes are not open-source data, data on LCZ are available for large regions, such as Europe or North America. The presented method can also be used to disaggregate the water demand predicted by other models. [9] Therefore, vulnerable areas in urban water infrastructures can be identified and treated with future resilience optimization constraints. Furthermore, through the application of graph-based resilience metrics, those pipes whose failure would jeopardize the security of supply can be identified. In addition, the estimated spatial distribution of the maximum water demand allows for a prioritization of maintenance areas and supply lines, as well as a prioritized hazard action plan.
The information generated by the introduced, as well as the future model can be made available to water suppliers. Water supply infrastructures are often historically grown and cannot be immediately adapted to the latest research results. However, if operators are aware of the resilient water supply infrastructures that are possible for the urban structure at hand, they can be taken into account during repairs or maintenance if necessary. The generated network could also be used to identify the potential of energy recovery systems in cities [48]. Furthermore, the information available to the tool can be increased by considering additional data sets to derive the spatial water demand. This data could be the population density, as given by, for example [49], or the commercial density within the considered area.
The latter steps, such as analyzing the resilience of the network, for example, in relation to crisis scenarios such as accidents or consequences of climate change, can be studied in detail using the methodology presented here, but would go beyond the scope of this paper.
While this work had the aim of generating real-world water distribution systems by considering established characteristic graph theoretical values, the results show that, even though those values are met, the resulting optimal water distribution system’s topology does not fully compare to a real-world water distribution system. Therefore, in future work, this has to be enforced by further constraints. Additionally, in future work, optimizing the resilience instead of achieving the minimum cost of the water distribution system should have a positive impact on the comparability of the optimal solution with real-world water distribution systems. Therefore, the inclusion of the resilience metric as objectively constrained by a given maximum cost which may not be exceeded but can be varied to study the behavior of the resilience optimal solution is intended.
Author Contributions
Conceptualization, I.-S.R. and J.F.; Methodology, I.-S.R. and J.F.; Resources, H.T.; Software, I.-S.R., J.F., K.P. and C.B.; Writing—original draft, I.-S.R., J.F., K.P. and C.B.; Writing—review & editing, I.-S.R., J.F., K.P. and C.B., H.T.; Supervision, P.F.P. All authors have read and agreed to the published version of the manuscript.
Funding
The authors thank the KSB Stiftung Stuttgart, Germany for funding this research within the project “Antizipation von Wasserbedarfsszenarien für die Städte der Zukunft”. More-over, we thank the LOEWE center of Hesse State Ministry for Higher Education, Research and the Arts for partly funding this work within the project emergenCITY.
Institutional Review Board Statement
Not applicable.
Informed Consent Statement
Not applicable.
Data Availability Statement
Not applicable.
Acknowledgments
The authors thank the Rheinische NETZGesellschaft for their support and insightful information on water distribution systems. Map data copyrighted OpenStreetMap contributors and available from https://www.OpenStreetMap.org (accessed on 18 June 2021).
Conflicts of Interest
The authors declare no conflict of interest.The funders had no role in the design of the study; in the collection, analyses, or interpretation of data; in the writing of the manuscript, or in the decision to publish the results.
Abbreviations
The following abbreviations are used in this manuscript:
| MDPI | Multidisciplinary Digital Publishing Institute |
| DOAJ | Directory of open access journals |
| TLA | Three letter acronym |
| LD | Linear dichroism |
| LCZ | Local Climate Zones |
| WDS | water distribution system |
References
- Louis, H. Sullivan. The tall office building artistically considered. West. Archit. 1922, 1922, 3–11. [Google Scholar]
- Rams, D.; Klatt, J. Weniger, Aber Besser: Skizze für Phonokombination TP 1 = Less but Better: Drawing for Phono Combination TP 1; Jo Klatt Design und Design Verlag: Hamburg, Germany, 1995. [Google Scholar]
- Pelz, P.F.; Groche, P.; Pfetsch, M.E.; Schäffner, M. Mastering Uncertainty in Mechanical Engineering; Springer Tracts in Mechanical Engineering; Springer International Publishing: Berlin/Heidelberg, Germany, 2021. [Google Scholar]
- Bao, K.; Padsala, R.; Thrän, D.; Schröter, B. Urban Water Demand Simulation in Residential and Non-Residential Buildings Based on a CityGML Data Model. ISPRS Int. J. Geo-Inf. 2020, 9, 642. [Google Scholar] [CrossRef]
- Sitzenfrei, R.; Fach, S.; Kleidorfer, M.; Urich, C.; Rauch, W. Dynamic virtual infrastructure benchmarking: DynaVIBe. Water Supply 2010, 10, 600–609. [Google Scholar] [CrossRef]
- Shin, S.; Lee, S.; Judi, D.; Parvania, M.; Goharian, E.; McPherson, T.; Burian, S. A Systematic Review of Quantitative Resilience Measures for Water Infrastructure Systems. Water 2018, 10, 164. [Google Scholar] [CrossRef] [Green Version]
- Pesantez, J.E.; Berglund, E.Z.; Kaza, N. Smart meters data for modeling and forecasting water demand at the user-level. Environ. Model. Softw. 2020, 125, 104633. [Google Scholar] [CrossRef]
- Zubaidi, S.; Al-Bugharbee, H.; Ortega-Martorell, S.; Gharghan, S.; Olier, I.; Hashim, K.; Al-Bdairi, N.; Kot, P. A Novel Methodology for Prediction Urban Water Demand by Wavelet Denoising and Adaptive Neuro-Fuzzy Inference System Approach. Water 2020, 12, 1628. [Google Scholar] [CrossRef]
- Zubaidi, S.L.; Ortega-Martorell, S.; Al-Bugharbee, H.; Olier, I.; Hashim, K.S.; Gharghan, S.K.; Kot, P.; Al-Khaddar, R. Urban Water Demand Prediction for a City That Suffers from Climate Change and Population Growth: Gauteng Province Case Study. Water 2020, 12, 1885. [Google Scholar] [CrossRef]
- Viola, F.; Caracciolo, D.; Deidda, R. Modelling the mutual interactions between hydrology, society and water supply systems. Hydrol. Sci. J. 2021, 66, 1265–1274. [Google Scholar] [CrossRef]
- Demuzere, M.; Hankey, S.; Mills, G.; Zhang, W.; Lu, T.; Bechtel, B. Combining expert and crowd-sourced training data to map urban form and functions for the continental US. Sci. Data 2020, 7, 264. [Google Scholar] [CrossRef]
- Pastor-Jabaloyes, L.; Arregui, F.; Cobacho, R. Water End Use Disaggregation Based on Soft Computing Techniques. Water 2018, 10, 46. [Google Scholar] [CrossRef] [Green Version]
- Stewart, I.D.; Oke, T.R. Local Climate Zones for Urban Temperature Studies. Bull. Am. Meteorol. Soc. 2012, 93, 1879–1900. [Google Scholar] [CrossRef]
- Demuzere, M.; Bechtel, B.; Middel, A.; Mills, G. Mapping Europe into local climate zones. PLoS ONE 2019, 14, e0214474. [Google Scholar] [CrossRef] [Green Version]
- Taubenböck, H.; Debray, H.; Qiu, C.; Schmitt, M.; Wang, Y.; Zhu, X.X. Seven city types representing morphologic configurations of cities across the globe. Cities 2020, 105, 102814. [Google Scholar] [CrossRef]
- Hu, J.; Wang, Y.; Taubenböck, H.; Zhu, X.X. Land consumption in cities: A comparative study across the globe. Cities 2021, 113, 103163. [Google Scholar] [CrossRef]
- Mair, M.; Zischg, J.; Rauch, W.; Sitzenfrei, R. Where to Find Water Pipes and Sewers?—On the Correlation of Infrastructure Networks in the Urban Environment. Water 2017, 9, 146. [Google Scholar] [CrossRef] [Green Version]
- DIN-Normausschuss Bauwesen. DIN 1998-Placement of Service Conduits in Public Circulation Areas—Guideline for Planning; German Standardisation Agency: Berlin, Germany, 2018. [Google Scholar]
- Planet Dump. 2015. Available online: https://planet.openstreetmap.org/ (accessed on 18 June 2021).
- Google. Satellite Images of Cologne. Available online: https://www.google.de/maps/@50.93517027036617,6.9501295729336405z (accessed on 14 June 2021).
- Jarvis, A.; Reuter, H.I.; Nelson, A.; Guevara, E. Hole-Filled Seamless SRTM Data V4; CIAT: Rome, Italy, 2008. [Google Scholar]
- Sitzenfrei, R.; Möderl, M.; Rauch, W. Automatic generation of water distribution systems based on GIS data. Environ. Model. Softw. Environ. Data News 2013, 47, 138–147. [Google Scholar] [CrossRef] [Green Version]
- Müller, T.M.; Leise, P.; Lorenz, I.S.; Altherr, L.C.; Pelz, P.F. Optimization and validation of pumping system design and operation for water supply in high-rise buildings. Optim. Eng. 2021, 22, 643–686. [Google Scholar] [CrossRef]
- Lorenz, I.S.; Pelz, P. Optimal Resilience Enhancement of Water Distribution Systems. Water 2020, 12, 2602. [Google Scholar] [CrossRef]
- Schänzle, C.; Altherr, L.C.; Ederer, T.; Lorenz, U.; Pelz, P.F. As Good As It Can Be-Ventilation System Design By A Combined Scaling And Discrete Optimization Method. In Proceedings of the International Conference on Fan Noise, Fan Technology and Numerical Methods (Fan 2015), Lyon, France, 15–17 April 2015. [Google Scholar]
- Pelz, P.F.; Lorenz, U.; Ludwig, G. Besser geht’s nicht. TOR plant das energetisch optimale Fluidsystem. Chem. More 2014, 6, 2–9. [Google Scholar]
- Ugarelli, R.; Venkatesh, G.; Brattebø, H.; Di Federico, V.; Sægrov, S. Asset Management for Urban Wastewater Pipeline Networks. J. Infrastruct. Syst. 2010, 16, 112–121. [Google Scholar] [CrossRef]
- Altherr, L.C.; Brötz, N.; Dietrich, I.; Gally, T.; Geßner, F.; Kloberdanz, H.; Leise, P.; Pelz, P.F.; Schlemmer, P.D.; Schmitt, A. Resilience in Mechanical Engineering—A Concept for Controlling Uncertainty during Design, Production and Usage Phase of Load-Carrying Structures. Appl. Mech. Mater. 2018, 885, 187–198. [Google Scholar] [CrossRef] [Green Version]
- Yazdani, A.; Otoo, R.A.; Jeffrey, P. Resilience enhancing expansion strategies for water distribution systems: A network theory approach. Environ. Model. Softw. 2011, 26, 1574–1582. [Google Scholar] [CrossRef]
- Herrera, M.; Abraham, E.; Stoianov, I. A Graph-Theoretic Framework for Assessing the Resilience of Sectorised Water Distribution Networks. Water Resour. Manag. 2016, 30, 1685–1699. [Google Scholar] [CrossRef] [Green Version]
- Lorenz, I.S.; Altherr, L.C.; Pelz, P.F. Resilience Enhancement of Critical Infrastructure—Graph Theoretical Resilience Analysis of the Water Distribution System in the German City of Darmstadt. In 14th WCEAM Proceedings; Crespo Márquez, A., Komljenovic, D., Amadi-Echendu, J., Eds.; Lecture Notes in Mechanical Engineering; Springer International Publishing: Cham, Switzerland, 2021; pp. 137–149. [Google Scholar] [CrossRef]
- Altherr, L.C.; Joggerst, L.; Leise, P.; Pfetsch, M.E.; Schmitt, A.; Wendt, J. On Obligations in the Development Process of Resilient Systems with Algorithmic Design Methods. Appl. Mech. Mater. 2018, 885, 240–252. [Google Scholar] [CrossRef] [Green Version]
- Todini, E. Looped water distribution networks design using a resilience index based heuristic approach. Urban Water 2000, 2, 115–122. [Google Scholar] [CrossRef]
- Hollnagel, E. Epilogue: RAG—The resilience analysis grid. In Resilience Engineering in Practice. A Guidebook; Hollnagel, E., Pariès, J., Woods, D.D., Wreathall, J., Eds.; Ashgate Publishing, Ltd.: Farnham, UK, 2011; pp. 275–296. [Google Scholar]
- Hollnagel, E. Prologue: The scope of resilience engineering. In Resilience Engineering in Practice. A Guidebook; Hollnagel, E., Pariès, J., Woods, D.D., Wreathall, J., Eds.; Ashgate Publishing, Ltd.: Farnham, UK, 2011. [Google Scholar]
- Hollnagel, E. FRAM, The Functional Resonance Analysis Method. Modelling Complex Socio-Technical Systems; CRC Press: Boca Raton, FL, USA, 2012. [Google Scholar]
- Bruneau, M.; Chang, S.E.; Eguchi, R.T.; Lee, G.C.; O’Rourke, T.D.; Reinhorn, A.M.; Shinozuka, M.; Tierney, K.; Wallace, W.A.; von Winterfeldt, D. A Framework to Quantitatively Assess and Enhance the Seismic Resilience of Communities. Earthq. Spectra 2003, 19, 733–752. [Google Scholar] [CrossRef] [Green Version]
- Hashimoto, T.; Stedinger, J.R.; Loucks, D.P. Reliability, resiliency, and vulnerability criteria for water resource system performance evaluation. Water Resour. Res. 1982, 18, 14–20. [Google Scholar] [CrossRef] [Green Version]
- Qiu, C.; Schmitt, M.; Zhu, X.X. Fusing Multi-Seasonal Sentinel-2 Images with Residual Convolutional Neural Networks for Local Climate Zone-Derived Urban Land Cover Classification. In Proceedings of the IGARSS 2019—2019 IEEE International Geoscience and Remote Sensing Symposium, Yokohama, Japan, 28 July–2 August 2019; IEEE: Piscataway, NJ, USA, 2019; Volume 72019, pp. 5037–5040. [Google Scholar] [CrossRef] [Green Version]
- QGIS Association. 2021. Available online: https://www.qgis.org/en/site/index.html (accessed on 12 June 2021).
- Hart, W.E. Pyomo-Optimization Modeling in Python, 2nd ed.; Springer Optimization and Its Applications; Springer: Cham, Switzerland, 2017; Volume 67. [Google Scholar]
- Hagberg, A.A.; Schult, D.A.; Swart, P.J. Exploring Network Structure, Dynamics, and Function using NetworkX. In Proceedings of the 7th Python in Science Conference, Pasadena, CA, USA, 19–24 August 2008; Varoquaux, G., Vaught, T., Millman, J., Eds.; pp. 11–15. [Google Scholar]
- Varoquaux, G.; Vaught, T.; Millman, J. (Eds.) In Proceedings of the 7th Python in Science Conference, SciPy, Pasadena, CA, USA, 19–24 August 2008. Available online: https://hal.inria.fr/hal-00502586/en (accessed on 19 August 2021).
- DIN Deutsches Institut für Normung e.V. DIN 1988–Technische Regeln für Trinkwasser-Installationen – Teil 200: Installation Typ A (geschlossenes System)–Planung, Bauteile, Apparate, Werkstoffe; Technische Regel des DVGW German Standardisation Agency: Berlin, Germany, 2012. [Google Scholar]
- Chee, R.; Lansey, K.; Chee, E. Estimation of Water Pipe Installation Construction Costs. J. Pipeline Syst. Eng. Pract. 2018, 9. [Google Scholar] [CrossRef]
- Nussbaum, T.; Thalmann, S. Dimensionierung von Fernwärmenetzen: Minimale Rohrdurchmesser Reduzieren Kosten und Netzverluste; VDI Verlag GmbH: Düsseldorf, Germany, 2017; Available online: www.ingenieur.de (accessed on 14 June 2021).
- Lorenz, I.S.; Pouls, K.; Pelz, P.F. Comparability of Water Infrastructure Resilience of Different Urban Structures. In ICUME; Springer: Cham, Switzerland, 2020. [Google Scholar]
- Meirelles, G.; Brentan, B.; Izquierdo, J.; Ramos, H.; Luvizotto, E. Trunk Network Rehabilitation for Resilience Improvement and Energy Recovery in Water Distribution Networks. Water 2018, 10, 693. [Google Scholar] [CrossRef] [Green Version]
- Tatem, A.J. WorldPop, open data for spatial demography. Sci. Data 2017, 4, 170004. [Google Scholar] [CrossRef]
Publisher’s Note: MDPI stays neutral with regard to jurisdictional claims in published maps and institutional affiliations. |
© 2021 by the authors. Licensee MDPI, Basel, Switzerland. This article is an open access article distributed under the terms and conditions of the Creative Commons Attribution (CC BY) license (https://creativecommons.org/licenses/by/4.0/).