
Assessment of Different Pressure Drop-Flow Rate Equations in a Pressurized Porous Media Filter for Irrigation Systems

 ,
,  , ,
, ,  and
and
Abstract
:1. Introduction
2. Materials and Methods
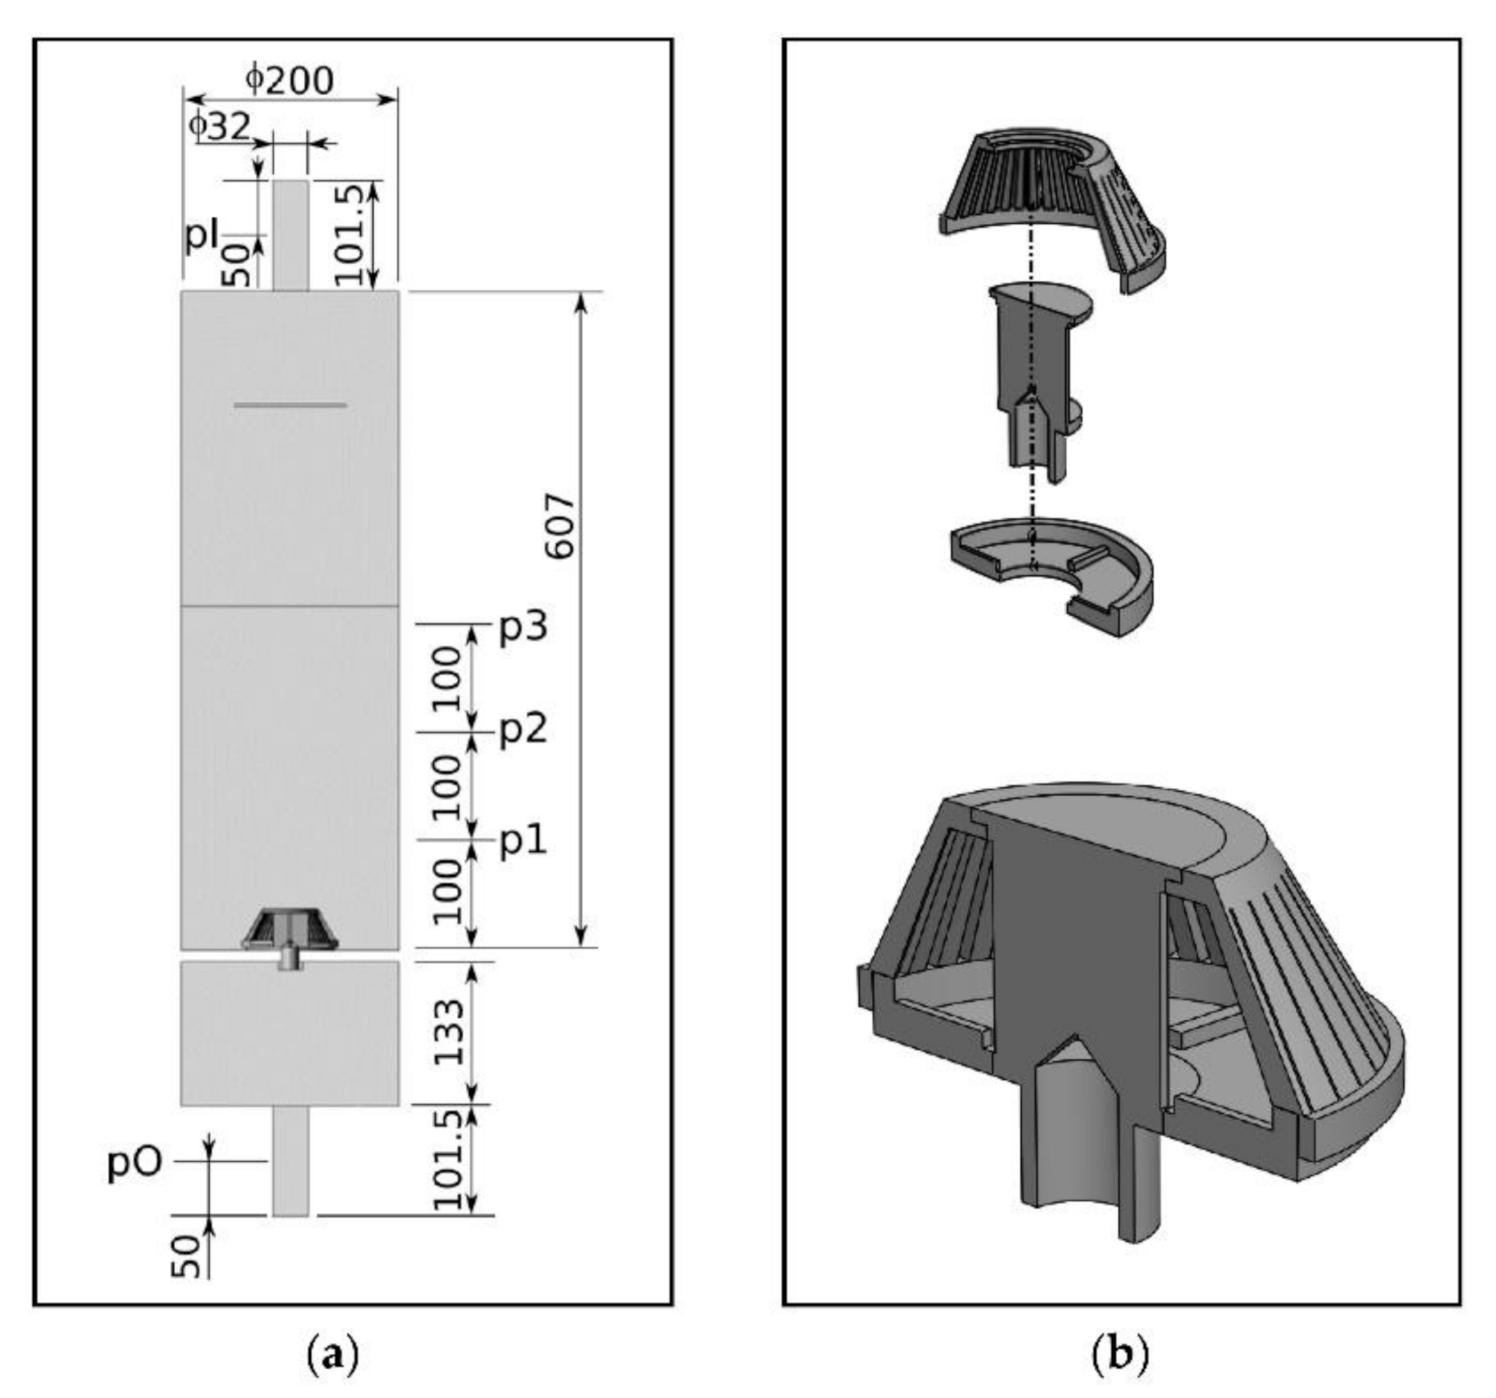
2.1. Experimental Data
2.2. Porous Media
2.3. Momentum Source Terms for Porous Media
2.4. Model Setup
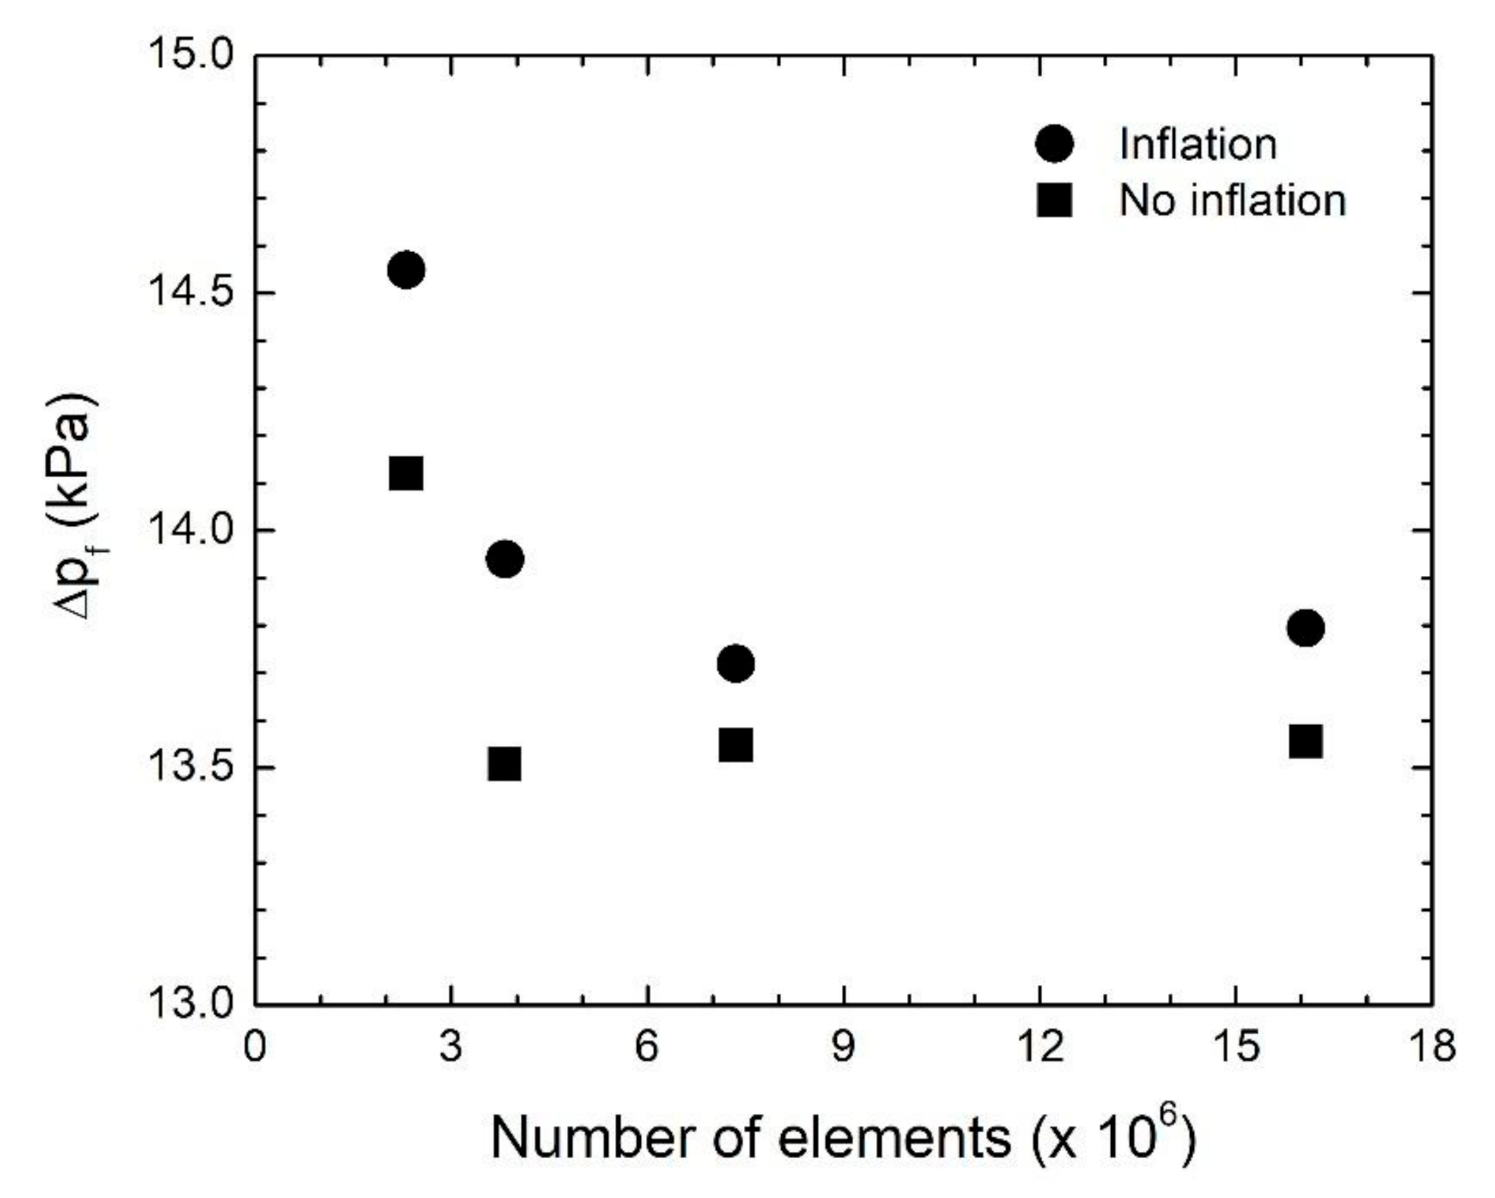
2.5. Mesh Sensitivity Study
3. Results
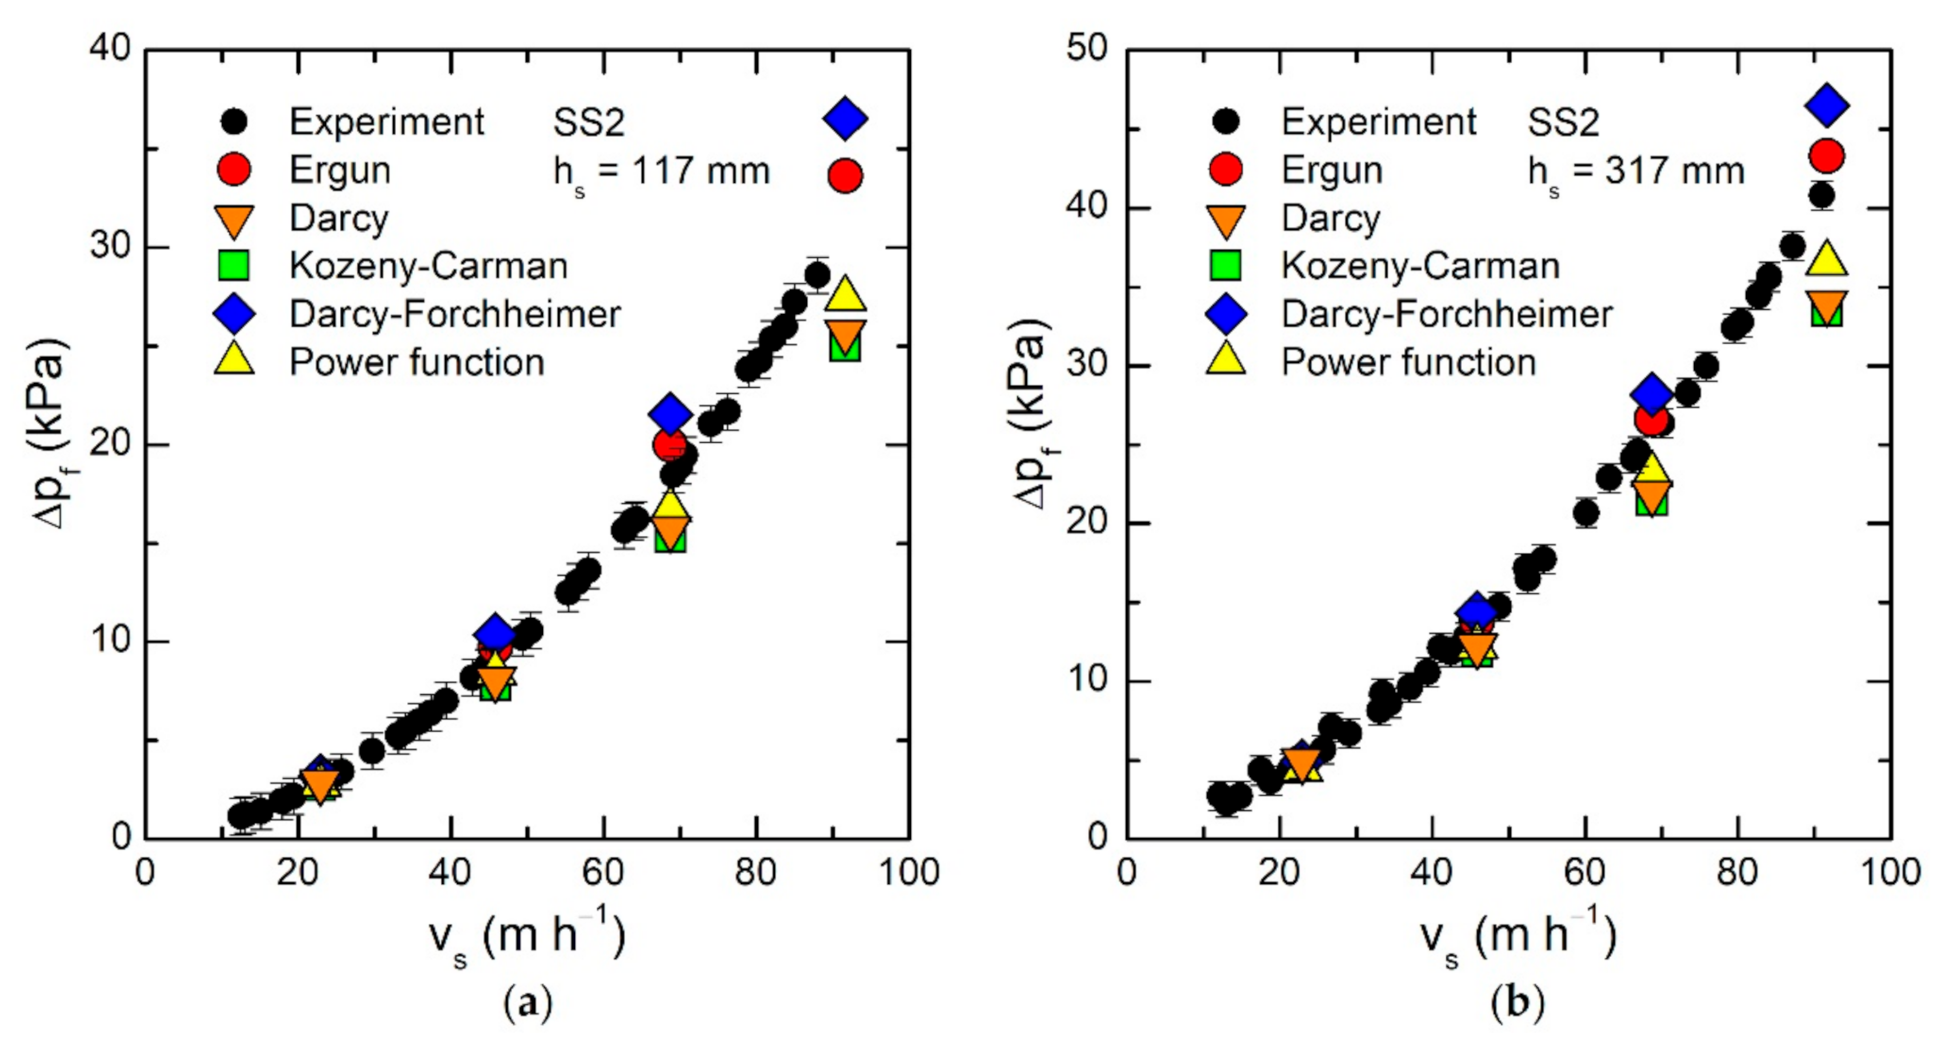
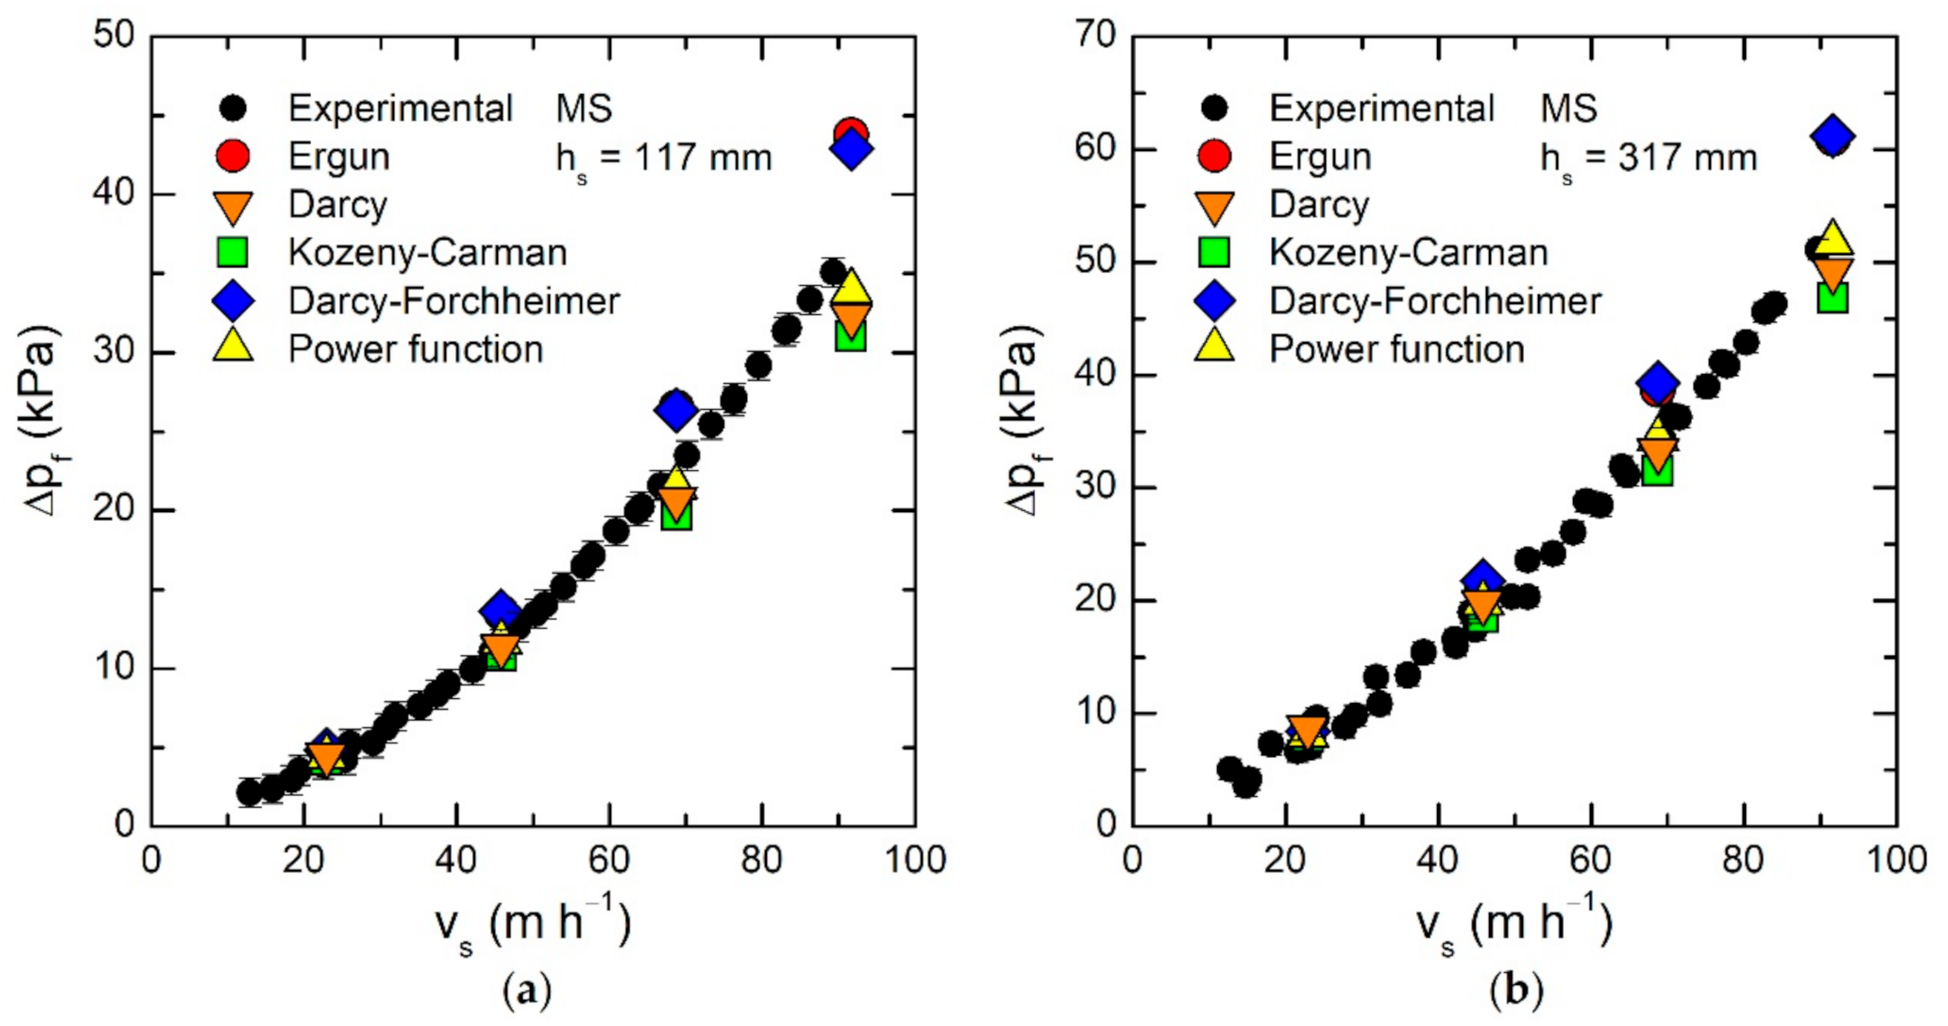
3.1. Filter Pressure Drop
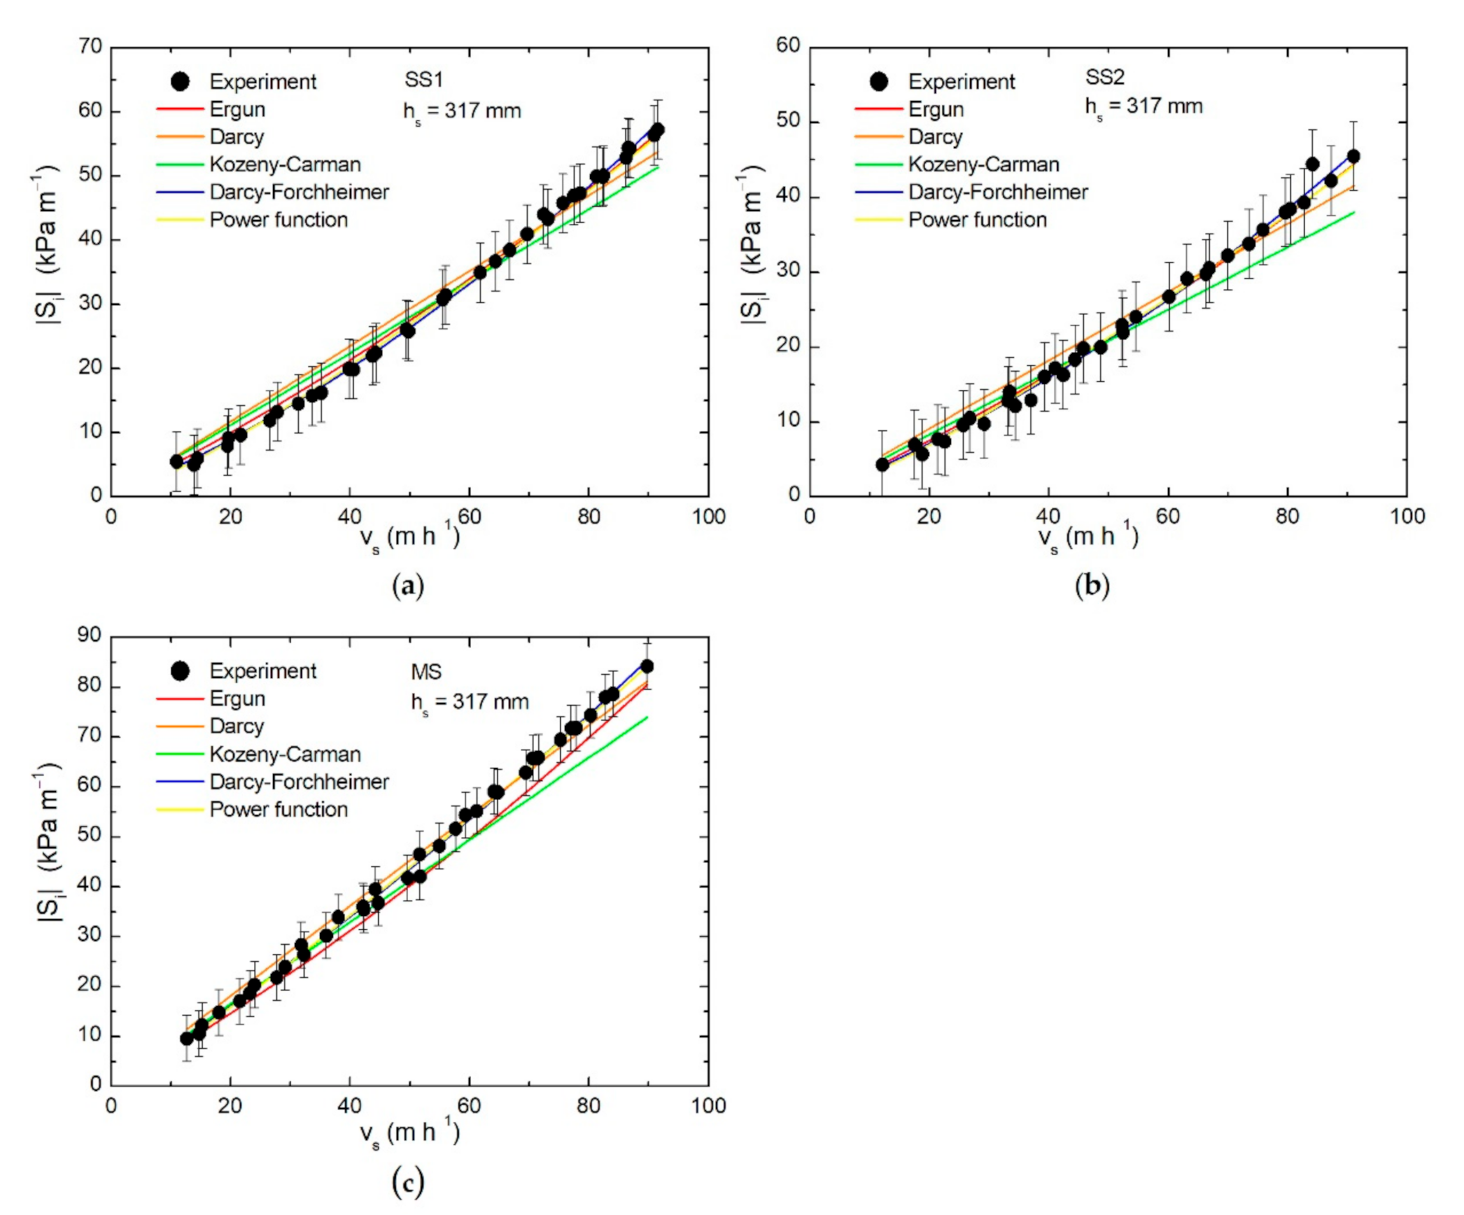
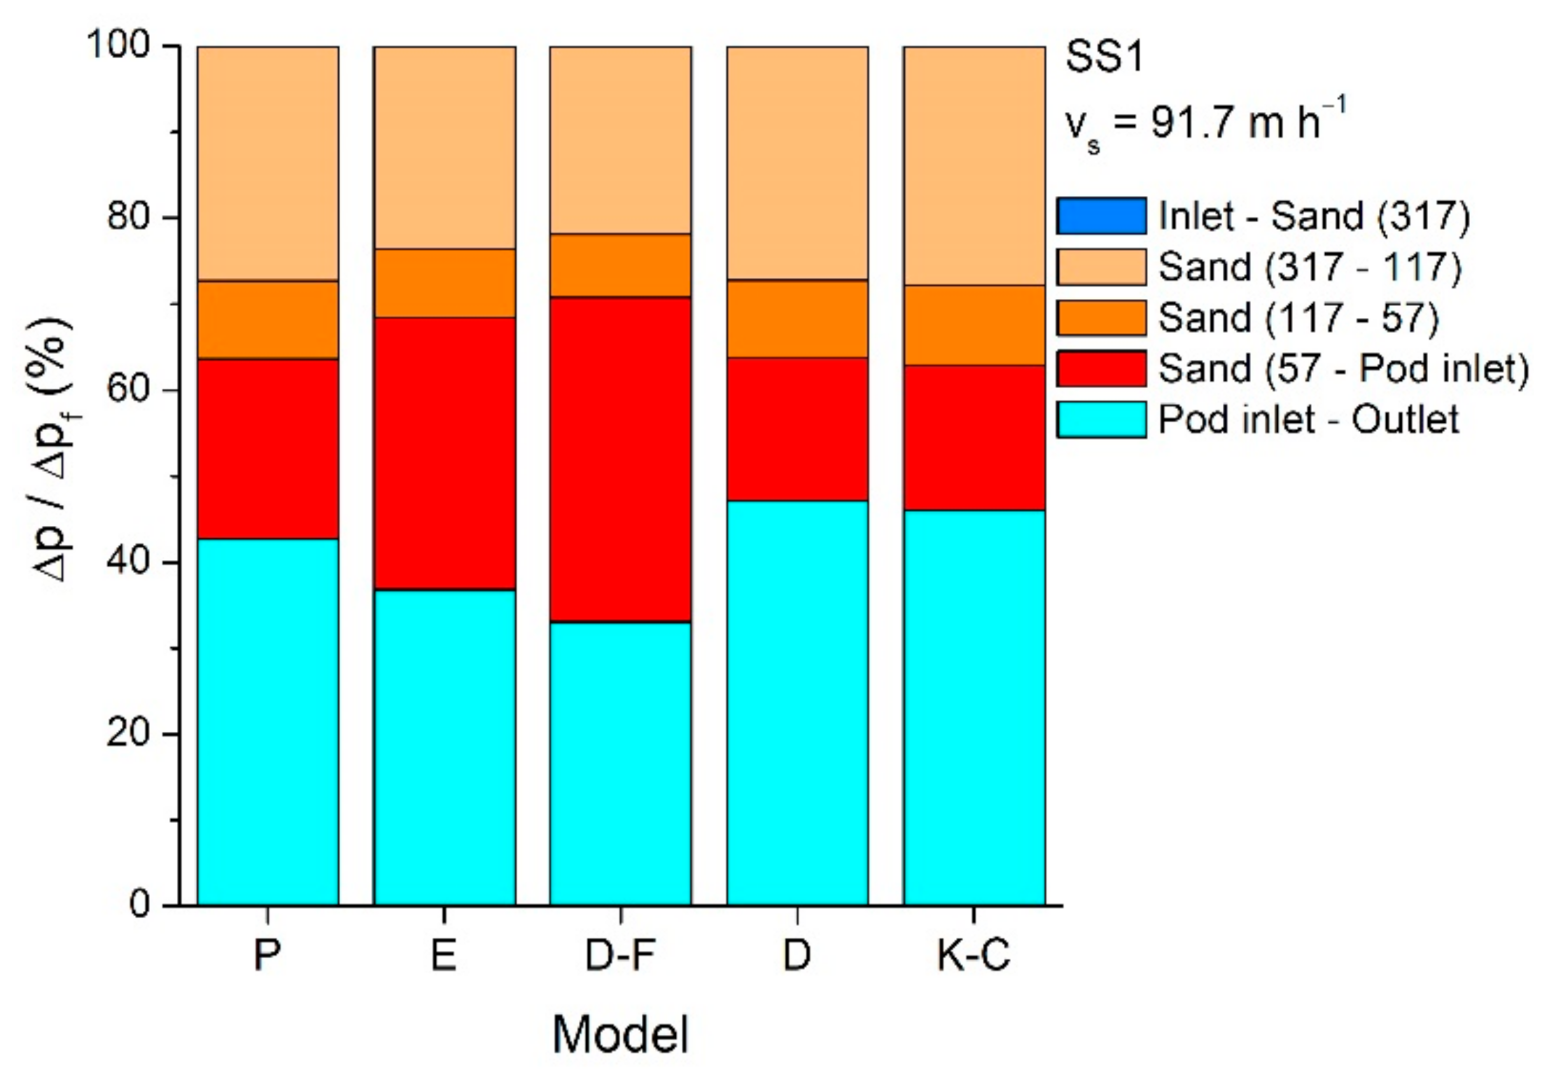
3.2. Pressure Drop Per Filter Zones
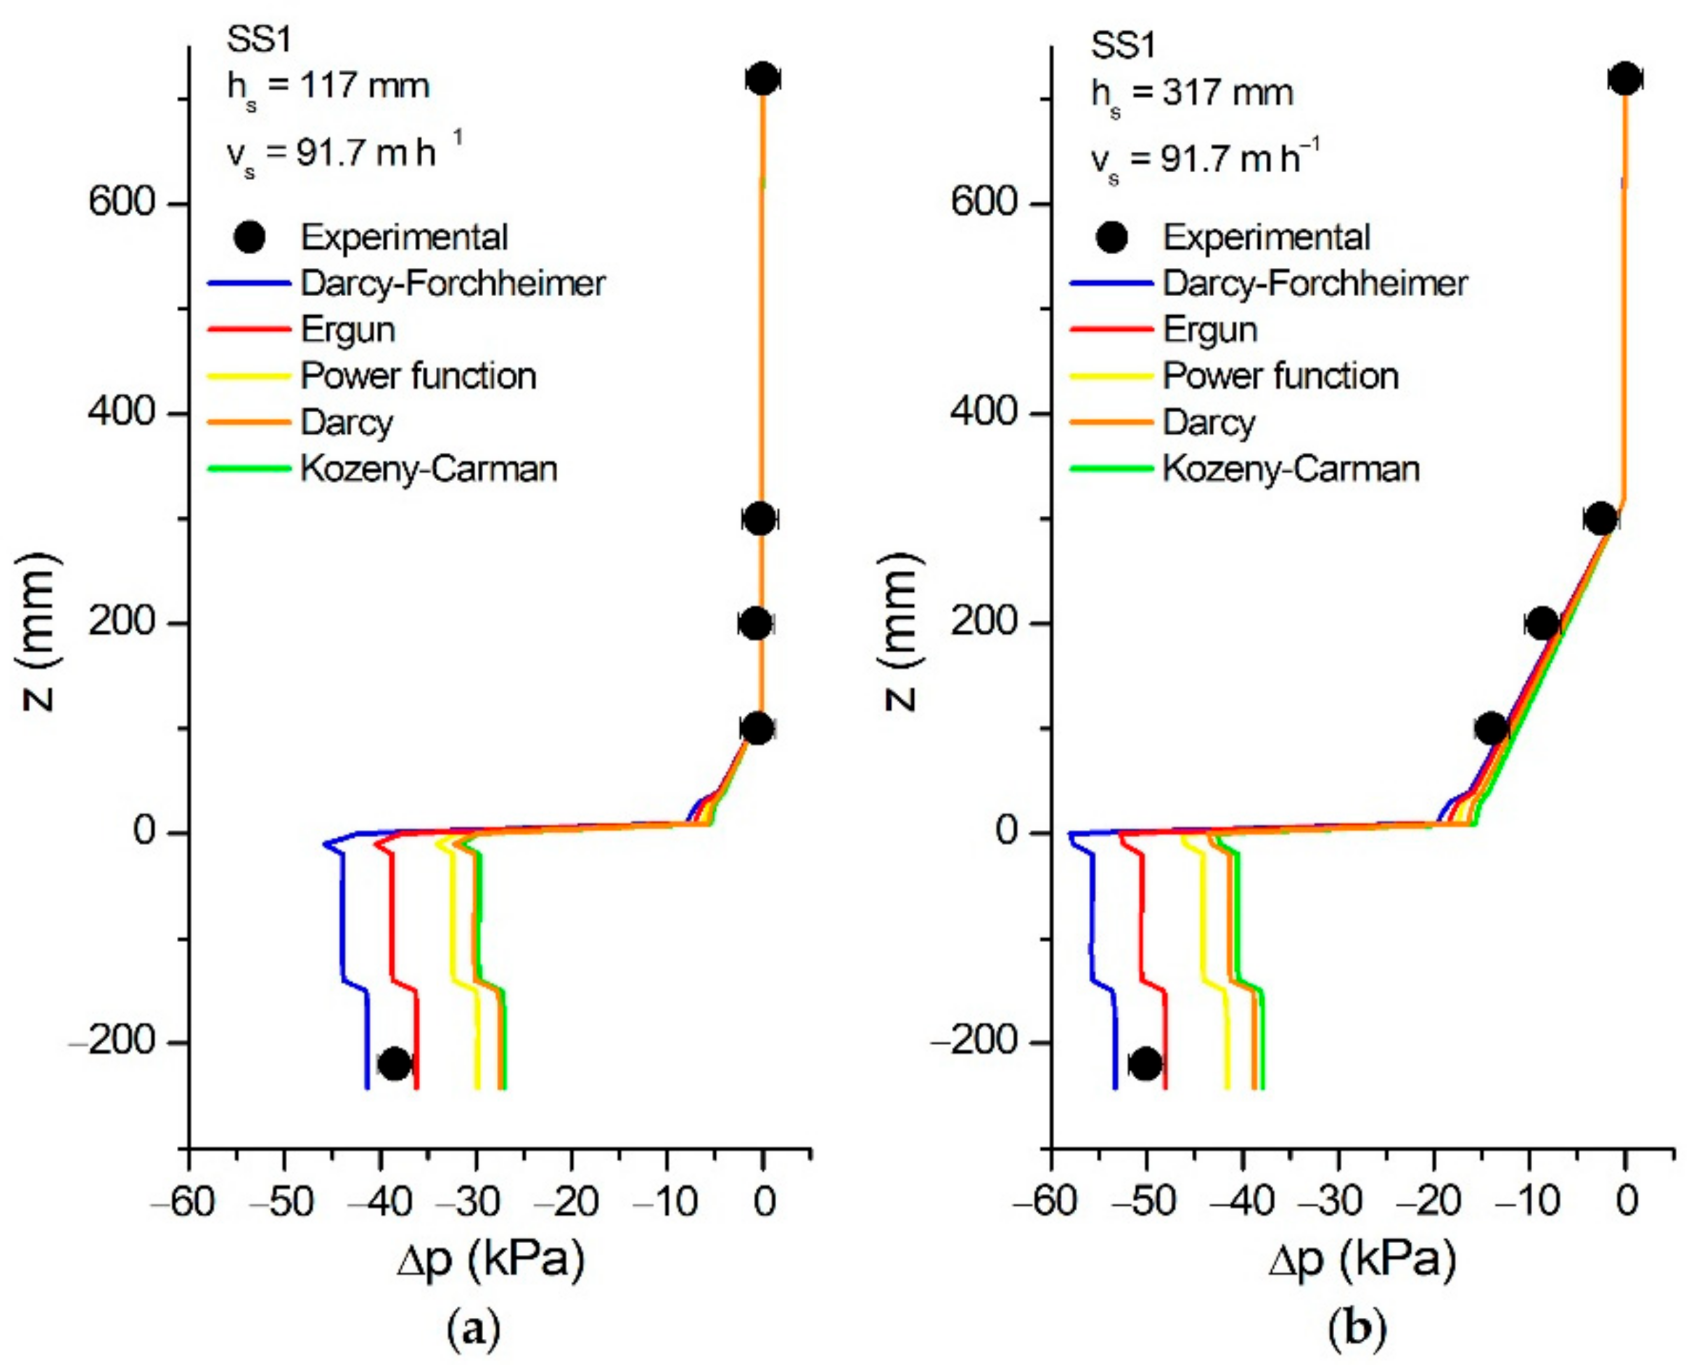
3.3. Averaged Pressure Vertical Profile
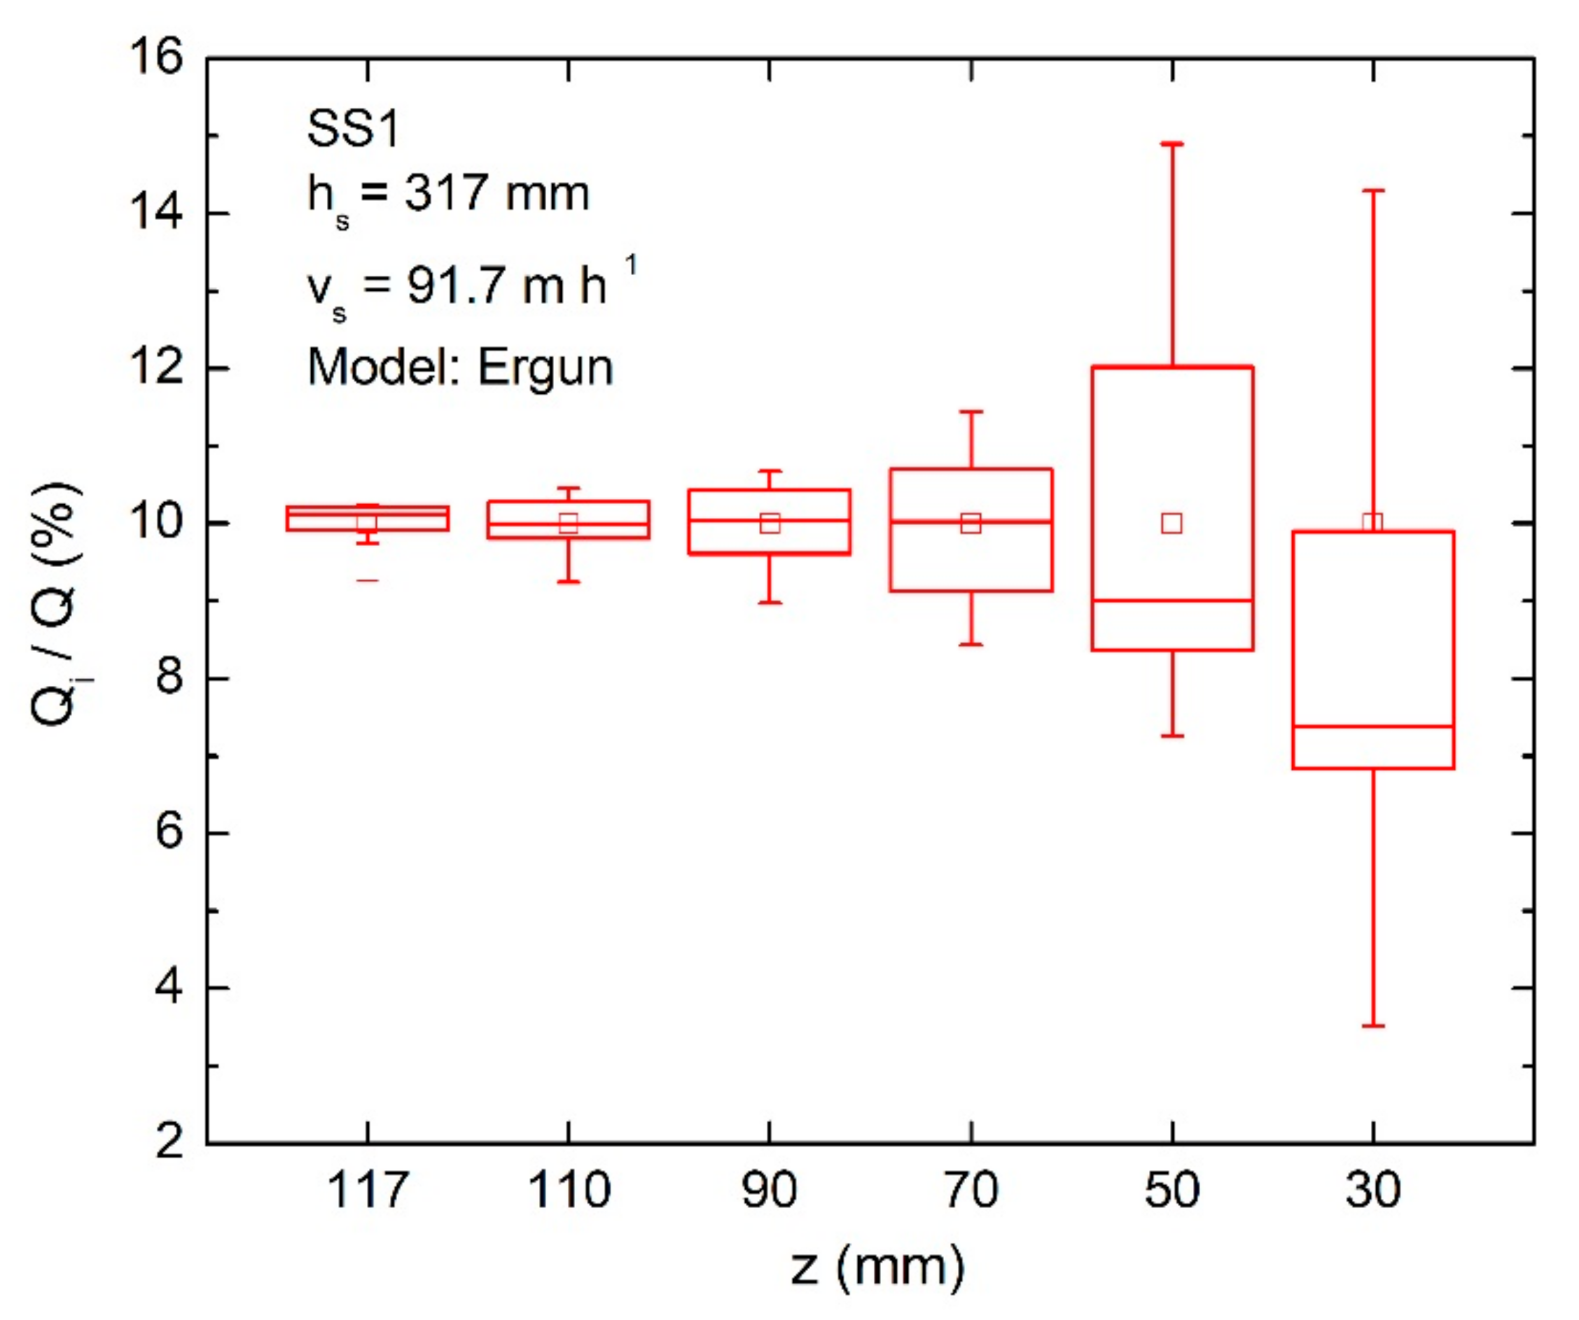
3.4. Flow Uniformity
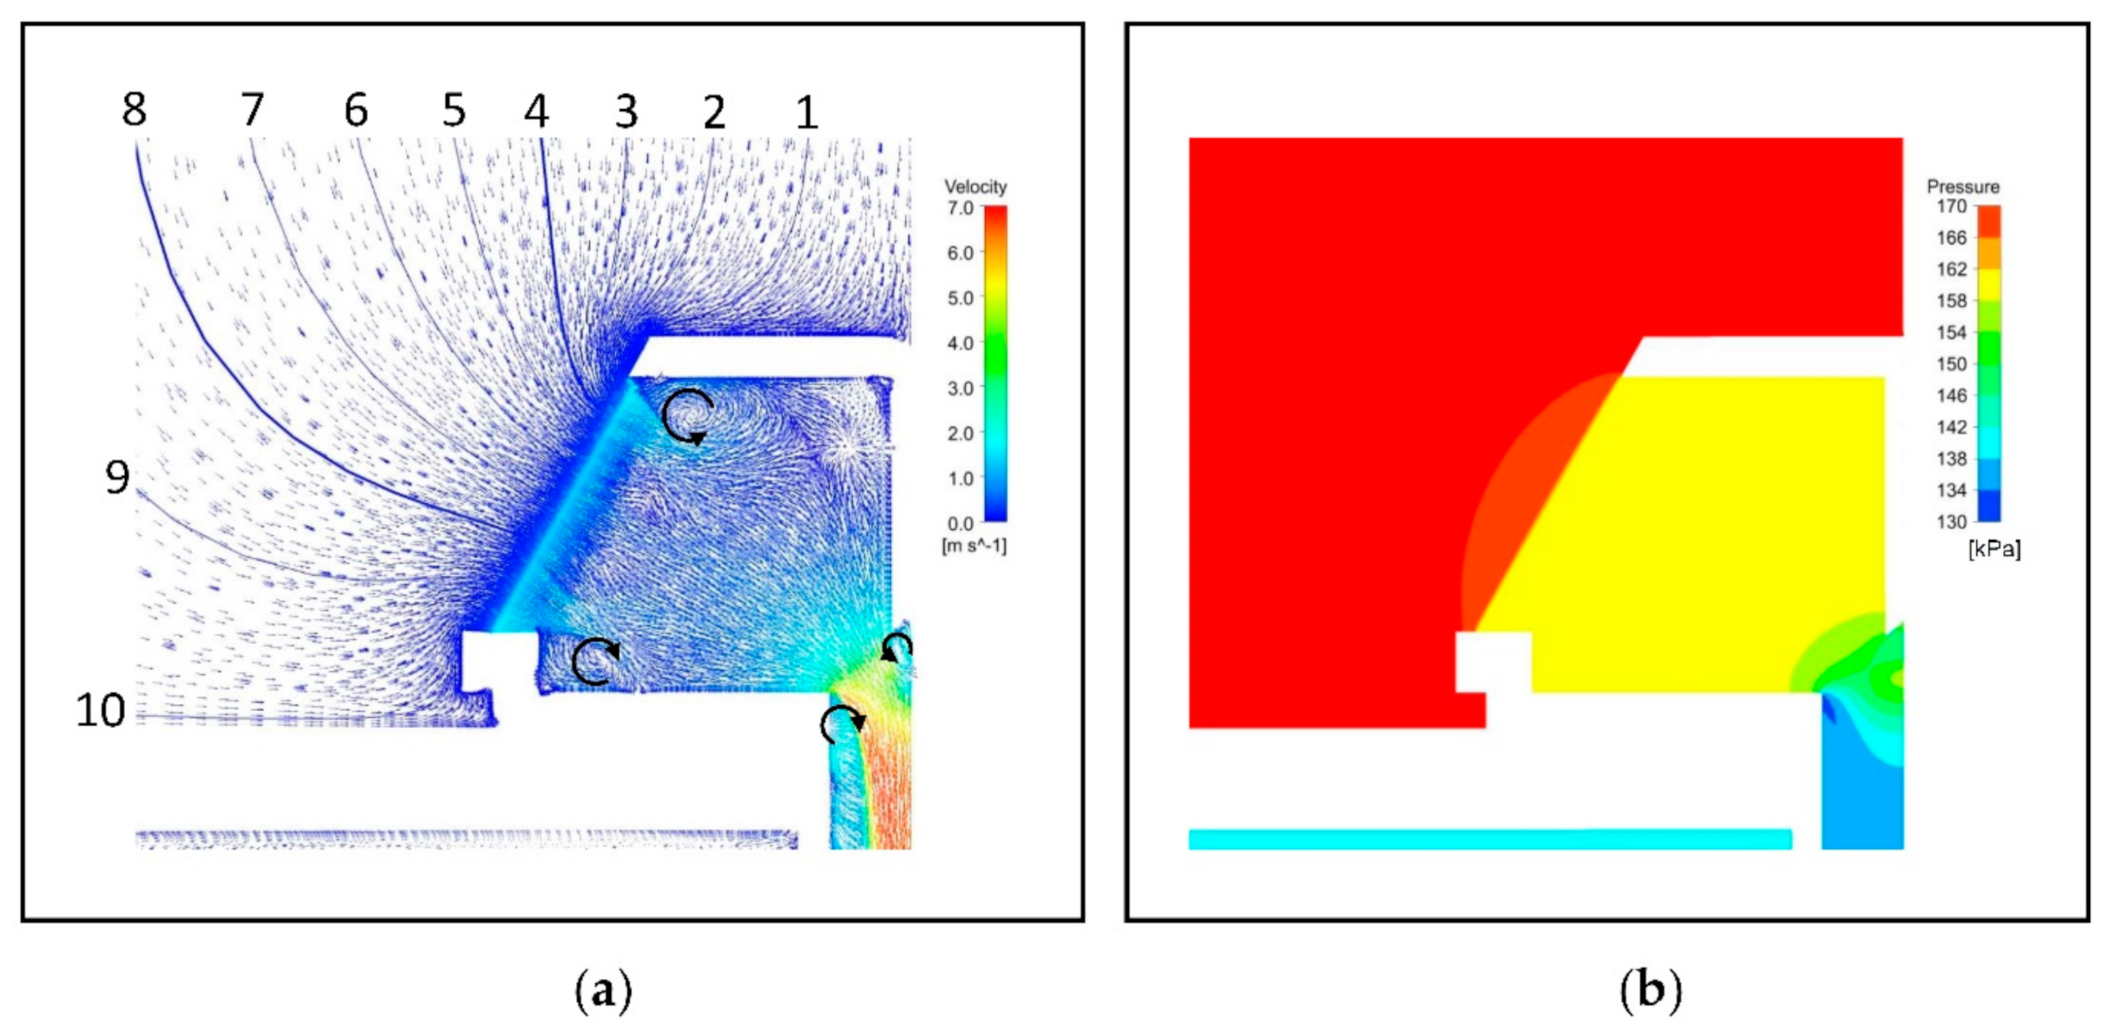
3.5. Flow and Pressure Behavior in the Underdrain Zone
4. Discussion
5. Conclusions
Author Contributions
Funding
Institutional Review Board Statement
Informed Consent Statement
Data Availability Statement
Acknowledgments
Conflicts of Interest
References
- WWAP (United Nations World Water Assessment Programme). The United Nations World Water Development Report 2017. Wastewater: The Untapped Resource; UNESCO: París, France, 2017. [Google Scholar]
- Fader, M.; Giupponi, C.; Burak, S.; Dakhlaoui, H.; Koutroulis, A.; Lange, M.A.; Llasat, M.C.; Pulido-Velazquez, D.; Sanz-Cobeña, A. 2020 Water. In Climate and Environmental Change in the Mediterranean Basin—Current Situation and Risks for the Future. First Mediterranean Assessment Report; Cramer, W., Guiot, J., Marini, K., Eds.; Union for the Mediterranean, Plan Belu, UNEP/MAP: Marseille, France, 2020. [Google Scholar]
- Galvis, A.; Jaramillo, M.F.; van der Steen, P.; Gijzen, H.J. Financial aspects of reclaimed wastewater irrigation in three sugarcane production areas in the Upper Cauca river Basin, Colombia. Agric. Water Manag. 2018, 209, 102–110. [Google Scholar] [CrossRef]
- Pedrero, F.; Alarcón, J.J. Effects of treated wastewater irrigation on lemon trees. Desalination 2009, 246, 631–639. [Google Scholar] [CrossRef]
- Ungureanu, N.; Vladut, V.; Voicu, G. Water scarcity and wastewater reuse in crop irrigation. Sustainability 2020, 12, 9055. [Google Scholar] [CrossRef]
- Solé-Torres, C. Underdrain Design and Operational Conditions in Sand Media Filters Using Reclaimed Effluents in Drip Irrigation Systems. Doctoral Thesis, University of Girona, Girona, Spain, 29 May 2020. [Google Scholar]
- Cescon, A.; Jiang, J.-Q. Filtration process and alternative filter media material in water treatment. Water 2020, 12, 3377. [Google Scholar] [CrossRef]
- Husseien Zaki, M.G.; EL-Sayed Abuarab, M.; Mahmoud Sultan, W.; El-Wahab Kassem, M.A. Evaluation of friction head loss as a function of media filter performance via different underdrain types and media specifications. Agric. Eng. Int. CIGR J. 2021, 23, 1–11. [Google Scholar]
- Burt, C.M. Hydraulics of commercial sand media filter tanks used for agricultural drip irrigation. In ITRC Report No. R 10001. Irrigation Training and Research Center; California Polytechnic State University: San Luis Obispo, CA, USA, 2010. [Google Scholar]
- Mesquita, M.; Testezlaf, R.; Ramirez, J.C.S. The effect of media bed characteristics and internal auxiliary elements on sand filter head loss. Agric. Water Manag. 2012, 115, 178–185. [Google Scholar] [CrossRef]
- Zong, Q.; Liu, Z.; Lu, H.; Yang, H. Backwashing performance of self-cleaining screen filters in drip irrigation systems. PLoS ONE 2019, 14, e0226354. [Google Scholar] [CrossRef] [PubMed]
- Arbat, G.; Pujol, T.; Puig-Bargués, J.; Duran-Ros, M.; Montoro, L.; Barragán, J.; Ramírez de Cartagena, F. An experimental and analytical study to analyze hydraulic behavior of nozzle-type underdrains in porous media filters. Agric. Water Manag. 2013, 126, 64–74. [Google Scholar] [CrossRef]
- Erdim, E.; Akgiray, Ö.; Demir, I. A revisit of pressure drop-flow rate correlations for packed beds of spheres. Powder Technol. 2015, 283, 488–504. [Google Scholar] [CrossRef]
- Pujol, T.; Puig-Bargués, J.; Arbat, G.; Vegas, A.; Duran-Ros, M.; Pujol, J.; Ramírez de Cartagena, F. Numerical study of the effects of pod, wand and spike type underdrain systems in pressurised sand filters. Biosyst. Eng. 2020, 200, 338–352. [Google Scholar] [CrossRef]
- Pujol, T.; Arbat, G.; Bové, J.; Puig-Bargués, J.; Duran-Ros, M.; Velayos, J.; Ramírez de Cartagena, F. Effects of the underdrain design on the pressure drop in sand filters. Biosyst. Eng. 2016, 150, 1–9. [Google Scholar] [CrossRef]
- ANSYS, Inc. ANSYS Fluent Theory Guide; ANSYS, Inc.: Canonsburg, PA, USA, 2021. [Google Scholar]
- Bové, J.; Puig-Bargués, J.; Arbat, G.; Duran-Ros, M.; Pujol, T.; Pujol, J.; Ramírez de Cartagena, F. Development of a new underdrain for improving the efficiency of microirrigation sand media filters. Agric. Water Manag. 2017, 179, 296–305. [Google Scholar] [CrossRef]
- Bové, J.; Arbat, G.; Pujol, T.; Duran-Ros, M.; Ramírez de Cartagena, F.; Velayos, J.; Puig-Bargués, J. Reducing energy requirements for sand filtration in microirrigation: Improving the underdrain and packing. Biosyst. Eng. 2015, 140, 67–78. [Google Scholar] [CrossRef]
- Mesquita, M.; Testezlaf, R.; de Deus, F.P.; da Rosa, L.M. Characterization of flow lines generated by pressurized sand filter underdrains. Chem. Eng. Trans. 2017, 58, 715–720. [Google Scholar] [CrossRef]
- Mesquita, M.; de Deus, F.P.; Testezlaf, R.; da Rosa, L.M.; Diotto, A.V. Design and hydrodynamic performance testing of a new pressure sand filter diffuser plate using numerical simulation. Biosyst. Eng. 2019, 183, 58–69. [Google Scholar] [CrossRef]
- Pujol, T.; Puig-Bargués, J.; Arbat, G.; Duran-Ros, M.; Solé-Torres, C.; Pujol, J.; Ramírez de Cartagena, F. Effect of wand-type underdrains on the hydraulic performance of pressurised and media filters. Biosyst. Eng. 2020, 200, 176–187. [Google Scholar] [CrossRef]
- Arbat, G.; Pujol, T.; Puig-Bargués, J.; Duran-Ros, M.; Barragán, J.; Montoro, L.; Ramírez de Cartagena, F. Using computational fluid dynamics to predict head losses in the auxiliary elements of a microirrigation sand filter. Trans. ASABE 2011, 54, 1367–1376. [Google Scholar] [CrossRef]
- Bové, J.; Arbat, G.; Duran-Ros, M.; Pujol, T.; Velayos, J.; Ramírez de Cartagena, F.; Puig-Bargués, J. Pressure drop across sand and recycled glass media used in micro irrigation filters. Biosyst. Eng. 2015, 137, 55–63. [Google Scholar] [CrossRef]
- Soyer, E.; Akgiray, O. A new simple equation for the prediction of filter expansion during backwashing. J. Water Supply Res. Technol. AQUA 2009, 58, 336–345. [Google Scholar] [CrossRef]
- Hunce, S.Y.; Soyer, E.; Akgiray, Ö. Use of filterability index in granular filtration: Effect of filter medium type, size and shape. Water Supply 2019, 19, 382–391. [Google Scholar] [CrossRef] [Green Version]
- Siwiec, T. The sphericity of grains of filtration beds applied for water treatment on examples of selected minerals. Electron. J. Pol. Agric. Univ. 2007, 10, 1. [Google Scholar]
- McCabe, W.L.; Smith, J.C.; Harriott, P. Unit Operations of Chemical Engineering, 6th ed.; McGraw-Hill: New York, NY, USA, 2000. [Google Scholar]
- Kramer, O.J.I.; de Moel, P.J.; Padding, J.T.; Baars, E.T.; Rutten, S.B.; Elarbab, A.H.E.; Hooft, J.F.M.; Boek, E.S.; van der Hoek, J.P. New hydraulic insights into rapid sand filter bed backwashing using the Carman-Kozeny model. Water Res. 2021, 197, 117085. [Google Scholar] [CrossRef] [PubMed]
- Cimolin, F.; Discacciati, M. Navier-Stokes/Forchheimer models for filtration through porous media. Appl. Numer. Math. 2013, 72, 205–224. [Google Scholar] [CrossRef] [Green Version]
- Yazdchi, K.; Luding, S. Towards unified draw laws for inertial flow through fibrous materials. Chem. Eng. J. 2012, 207–208, 35–48. [Google Scholar] [CrossRef]
- Lauria, A.; Alfonsi, G.; Tafarojnoruz, A. Flow pressure behavior downstream of ski jumps. Fluids 2020, 5, 168. [Google Scholar] [CrossRef]
- Calomino, F.; Alfonsi, G.; Gaudio, R.; D’Ippolito, A.; Lauria, A.; Tafarojnoruz, A.; Artese, S. Experimental and numerical study of free-surface flows in corrugated pipe. Water 2018, 10, 638. [Google Scholar] [CrossRef] [Green Version]
- Tafarojnoruz, A.; Lauria, A. Large eddy simulation of the turbulent flow field around a submerged pile within a scour hole under current condition. Coast. Eng. J. 2020, 62, 489–503. [Google Scholar] [CrossRef]
- Bové, J.; Pujol, J.; Arbat, G.; Duran-Ros, M.; Ramírez de Cartagena, F.; Puig-Bargués, J. Environmental assessment of underdrain designs for a sand media filter. Biosyst. Eng. 2018, 167, 126–136. [Google Scholar] [CrossRef]


| Silica Sand 1 (SS1) | Silica Sand 2 (SS2) | Microspheres (MS) | |
|---|---|---|---|
| Grain size range (mm) | 0.63–0.75 | 0.75–0.85 | 0.63–0.75 |
| Porosity ε (-) | 0.42 | 0.40 | 0.38 |
| Equivalent diameter Deq (mm) | 0.72 | 0.92 | 0.65 |
| Sphericity coefficient | 0.89 | 0.89 | 1.00 |
| Porous Media | Darcy (Equation (7)) | Darcy-Forchheimer (Equation (9)) | Power Function (Equation (11)) | ||
|---|---|---|---|---|---|
| SS1 | 2,114,586,482 | 1,426,866,416 | 67,809.7 | 5,031,366.8 | 1.2233 |
| SS2 | 1,664,032,173 | 1,135,357,857 | 53,907.3 | 3,957,284.9 | 1.2216 |
| MS | 3,256,477,408 | 2,770,785,713 | 52,576.0 | 5,133,053.6 | 1.1134 |
| Porous Media | Kozeny-Carman (Equation (8)) | Ergun (Equation (10)) | ||
|---|---|---|---|---|
| SS1 | 2,018,313,031 | 0 | 1,681,927,527 | 43,057.8 |
| SS2 | 1,503,672,221 | 0 | 1,253,060,184 | 39,987.0 |
| MS | 2,966,264,695 | 0 | 2,471,887,246 | 60,654.3 |
| Mesh #1 | Mesh #2 | Mesh #3 | Mesh #4 | |
|---|---|---|---|---|
| Maximum size at underdrain slots (mm) | 0.50 | 0.30 | 0.15 | 0.10 |
| Number of elements in lower water-only region (×106) | 1.27 | 1.70 | 3.14 | 6.47 |
| Total number of elements (×106) | 2.31 | 3.82 | 7.35 | 16.07 |
| Media | Coefficient | Ergun | Darcy-Forchheimer | Kozeny-Carman | Darcy | Power Function | |
|---|---|---|---|---|---|---|---|
| SS1 | 317 | RMSE (kPa) | 1.081 | 1.719 | 6.001 | 5.627 | 4.477 |
| NSE | 0.995 | 0.988 | 0.848 | 0.866 | 0.915 | ||
| 117 | RMSE (kPa) | 0.933 | 1.867 | 5.579 | 5.337 | 4.221 | |
| NSE | 0.994 | 0.975 | 0.780 | 0.799 | 0.874 | ||
| SS2 | 317 | RMSE (kPa) | 0.936 | 2.190 | 3.300 | 2.984 | 2.105 |
| NSE | 0.993 | 0.964 | 0.918 | 0.933 | 0.967 | ||
| 117 | RMSE (kPa) | 1.267 | 2.525 | 2.547 | 2.184 | 1.444 | |
| NSE | 0.978 | 0.914 | 0.913 | 0.936 | 0.972 | ||
| MS | 317 | RMSE (kPa) | 3.582 | 4.028 | 2.438 | 1.589 | 1.084 |
| NSE | 0.935 | 0.918 | 0.970 | 0.987 | 0.994 | ||
| 117 | RMSE (kPa) | 3.091 | 2.904 | 2.475 | 1.826 | 1.157 | |
| NSE | 0.905 | 0.916 | 0.939 | 0.967 | 0.987 |
| Equation | Advantages | Disadvantages |
|---|---|---|
| Ergun |
|
|
| Darcy-Forchheimer |
|
|
| Kozeny-Carman |
|
|
| Darcy |
|
|
| Power function |
|
|
Publisher’s Note: MDPI stays neutral with regard to jurisdictional claims in published maps and institutional affiliations. |
© 2021 by the authors. Licensee MDPI, Basel, Switzerland. This article is an open access article distributed under the terms and conditions of the Creative Commons Attribution (CC BY) license (https://creativecommons.org/licenses/by/4.0/).
Share and Cite
Graciano-Uribe, J.; Pujol, T.; Puig-Bargués, J.; Duran-Ros, M.; Arbat, G.; Ramírez de Cartagena, F. Assessment of Different Pressure Drop-Flow Rate Equations in a Pressurized Porous Media Filter for Irrigation Systems. Water 2021, 13, 2179. https://doi.org/10.3390/w13162179
Graciano-Uribe J, Pujol T, Puig-Bargués J, Duran-Ros M, Arbat G, Ramírez de Cartagena F. Assessment of Different Pressure Drop-Flow Rate Equations in a Pressurized Porous Media Filter for Irrigation Systems. Water. 2021; 13(16):2179. https://doi.org/10.3390/w13162179
Chicago/Turabian StyleGraciano-Uribe, Jonathan, Toni Pujol, Jaume Puig-Bargués, Miquel Duran-Ros, Gerard Arbat, and Francisco Ramírez de Cartagena. 2021. "Assessment of Different Pressure Drop-Flow Rate Equations in a Pressurized Porous Media Filter for Irrigation Systems" Water 13, no. 16: 2179. https://doi.org/10.3390/w13162179
APA StyleGraciano-Uribe, J., Pujol, T., Puig-Bargués, J., Duran-Ros, M., Arbat, G., & Ramírez de Cartagena, F. (2021). Assessment of Different Pressure Drop-Flow Rate Equations in a Pressurized Porous Media Filter for Irrigation Systems. Water, 13(16), 2179. https://doi.org/10.3390/w13162179