
Development of a Multivariate Model Focused on the Analysis of Water Availability in Mexico


Abstract
:1. Introduction
1.1. Literature Review
1.1.1. Analysis of Drought and Water Availability
1.1.2. Prediction Models for Drought and Water Availability
1.1.3. The Multivariate Model
1.1.4. The Assumptions and the Fit of the Model
1.1.5. Strategies to Correct for Adverse Effects on the Assumptions of the Model
1.1.6. Sequential Search Methods for Variables for the Model
2. Materials and Methods
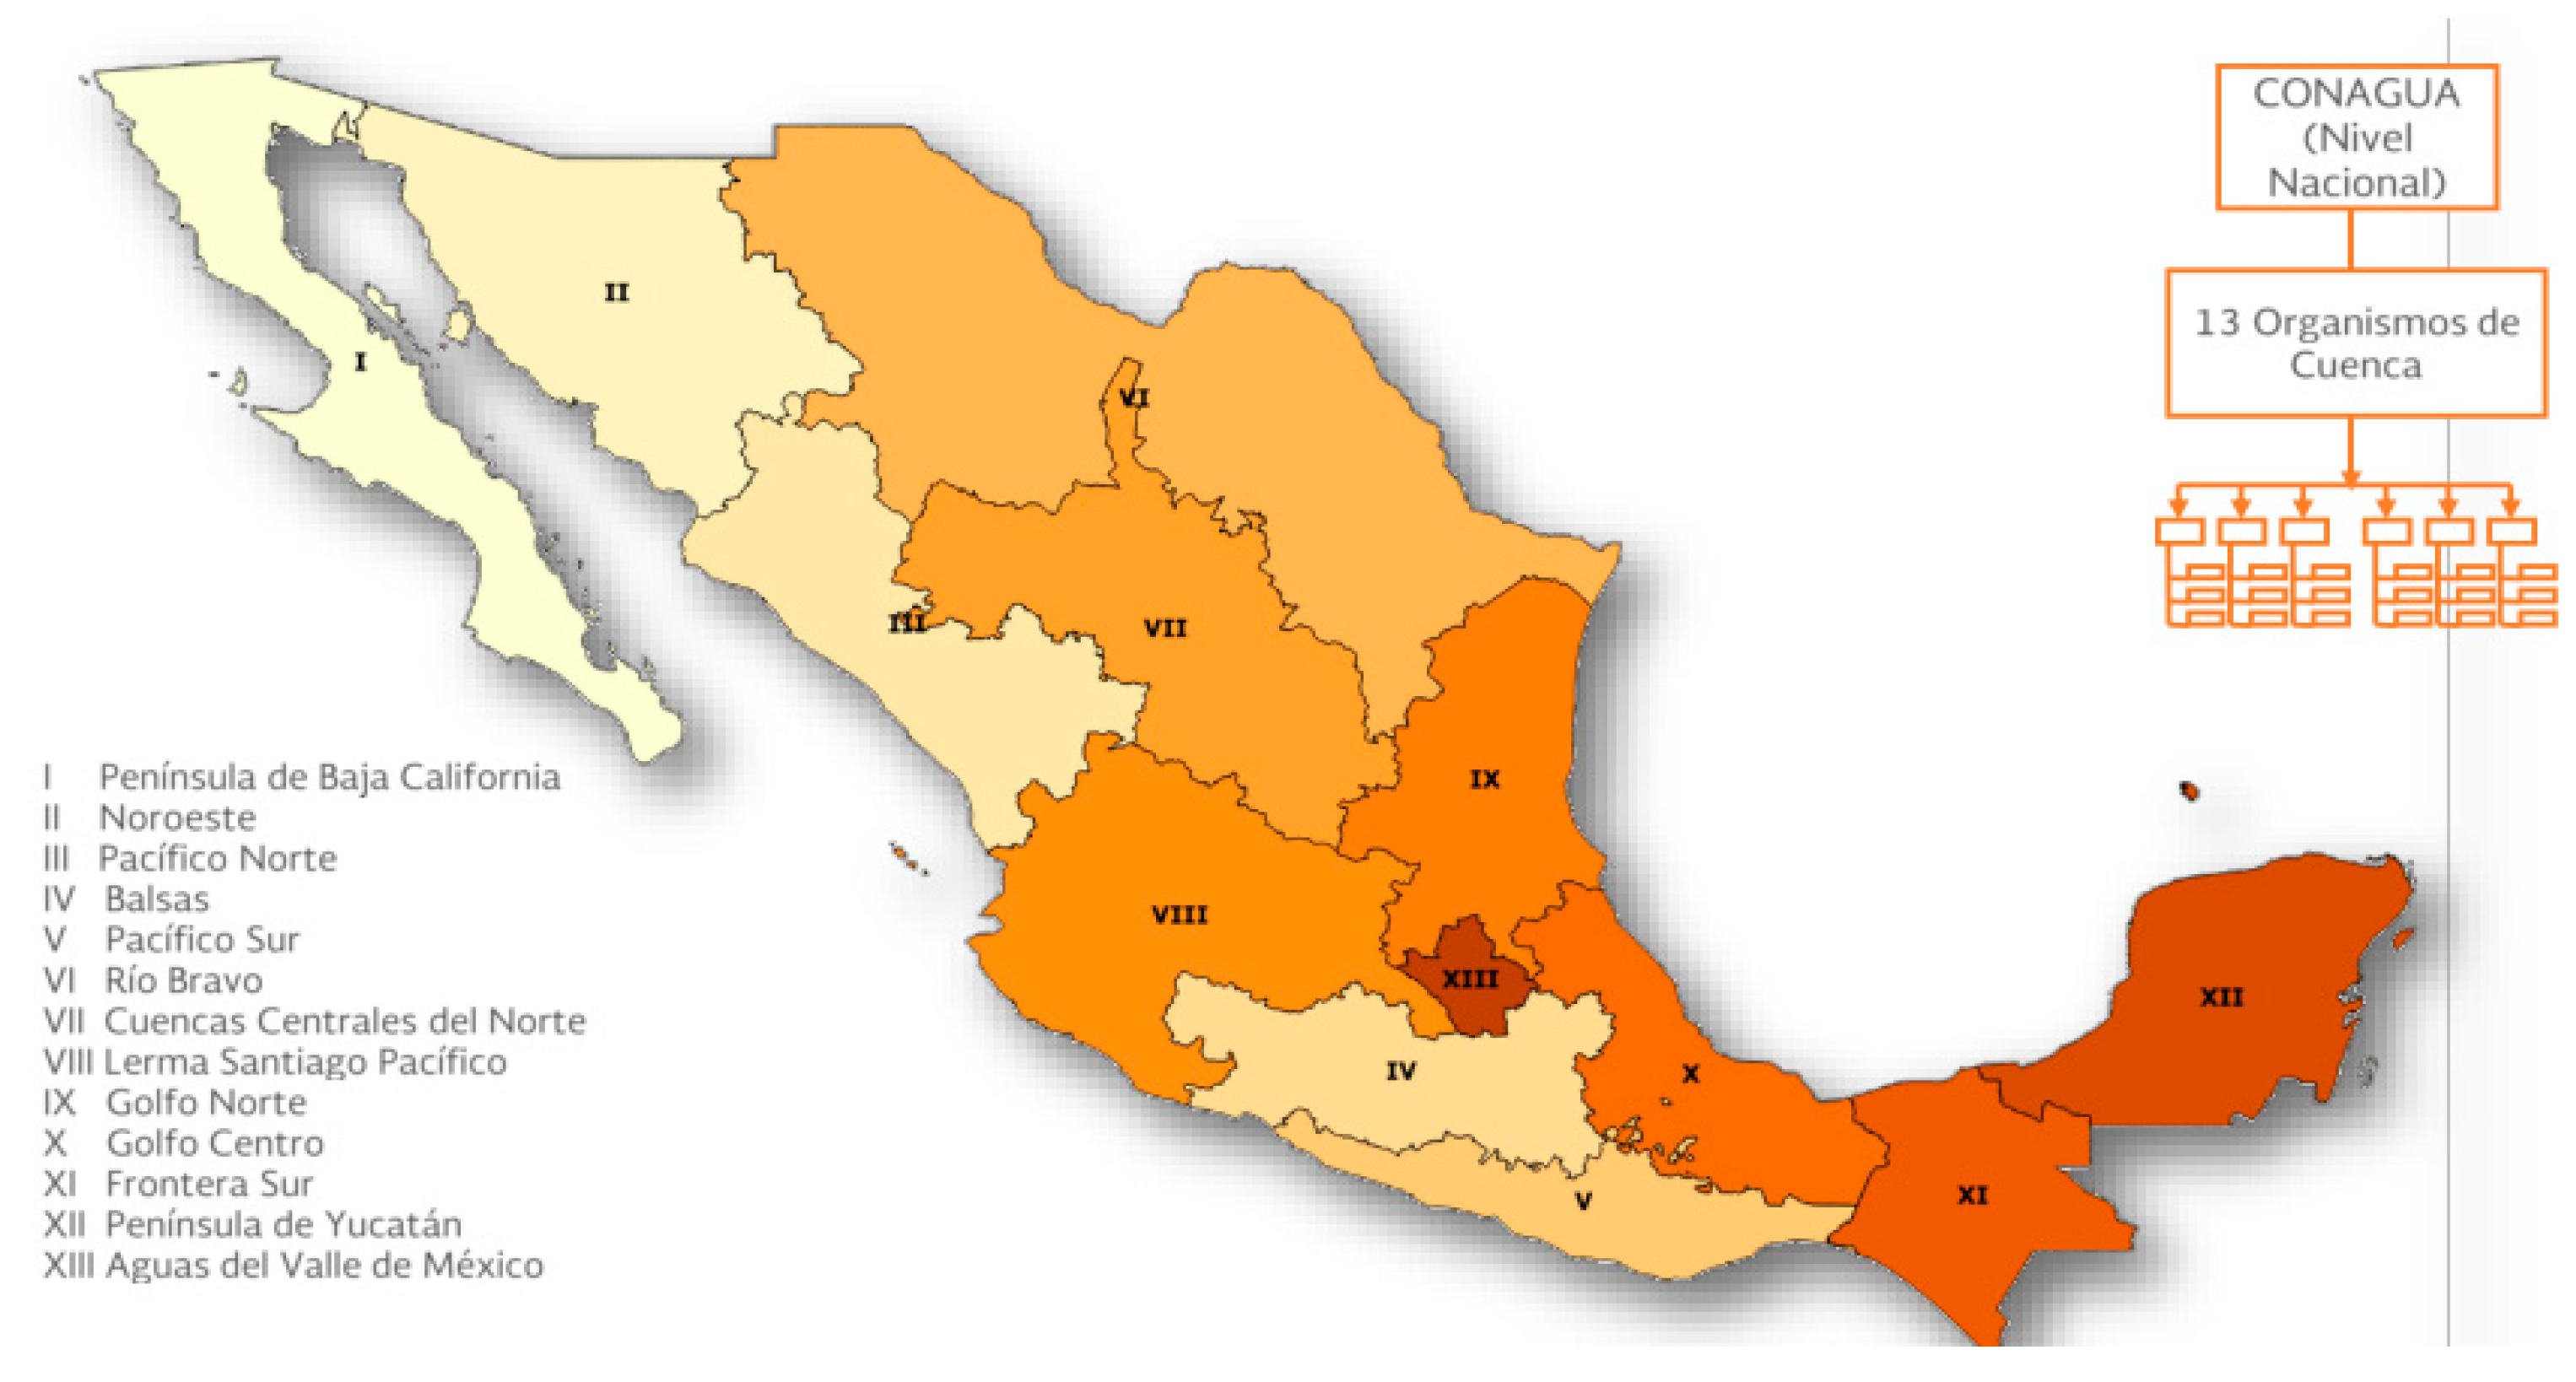
2.1. The Geographical, Social, and Natural Features Characterize the Place of Study
2.2. The SINA and the Data were Available to Deepen the Formation of the Variables Analyzed
2.3. The Proposed Methodological Design and Its Explanatory Scope
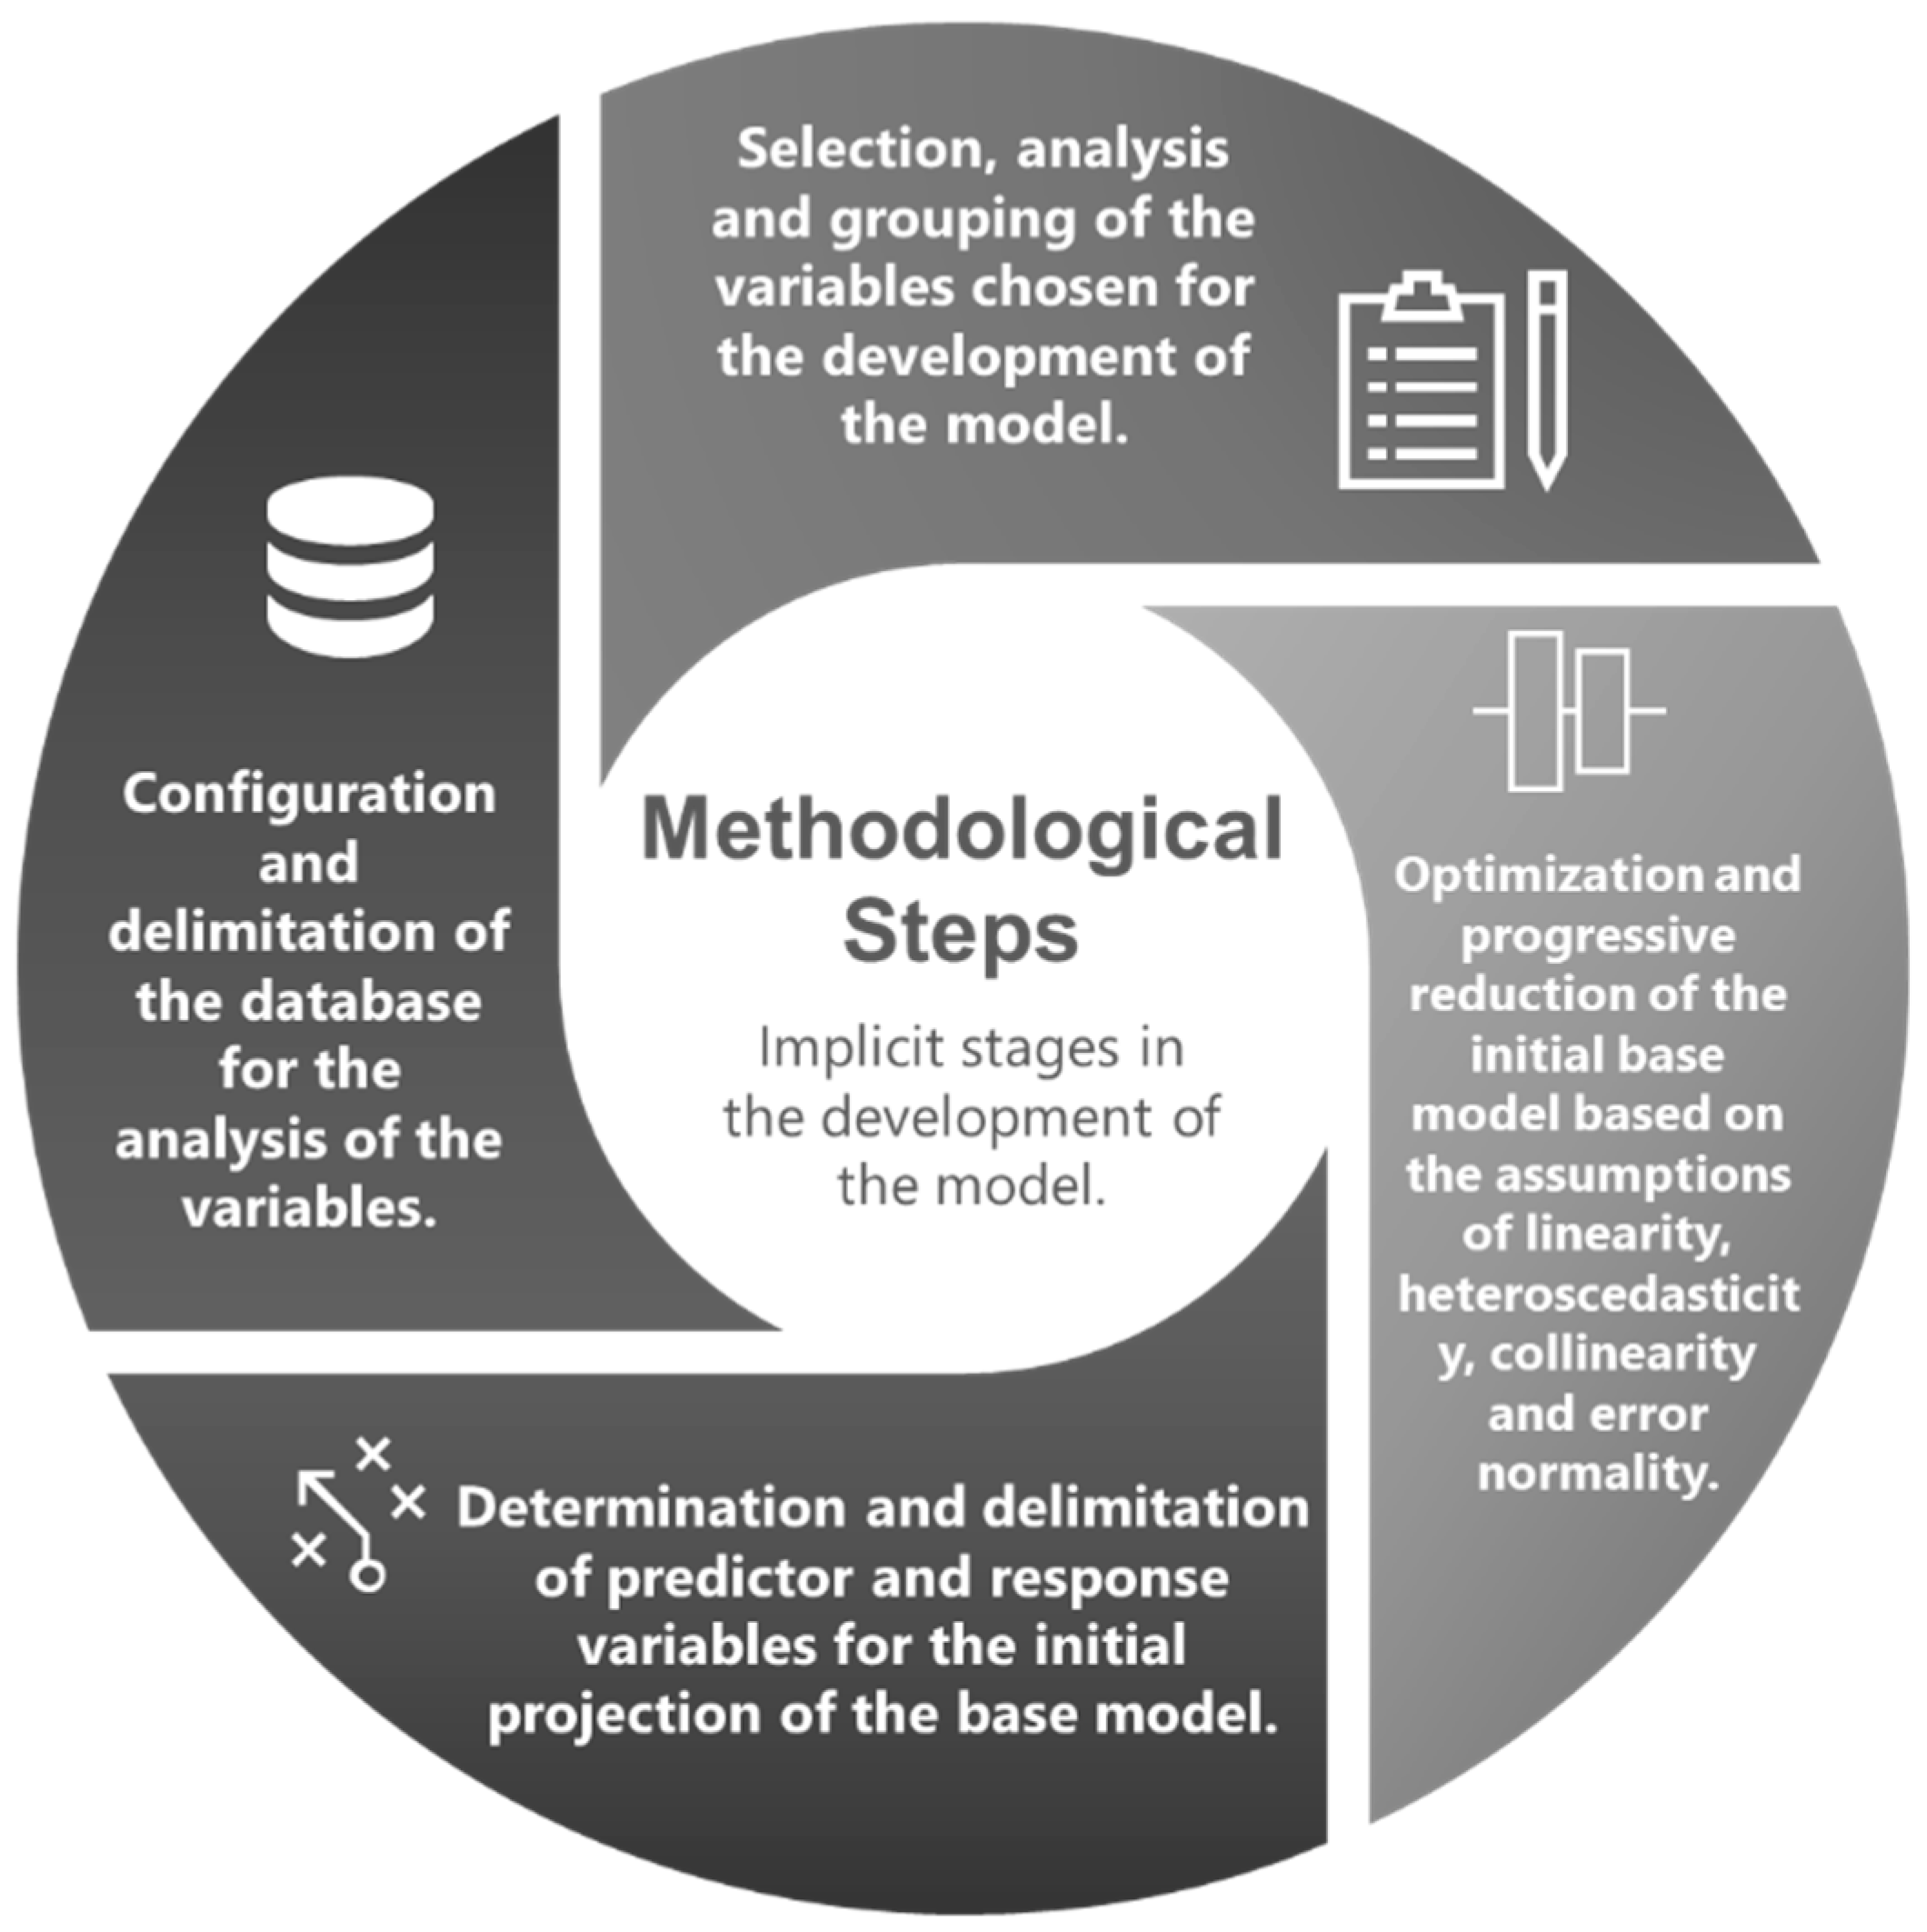
2.4. The Structure of the Proposed Methodology
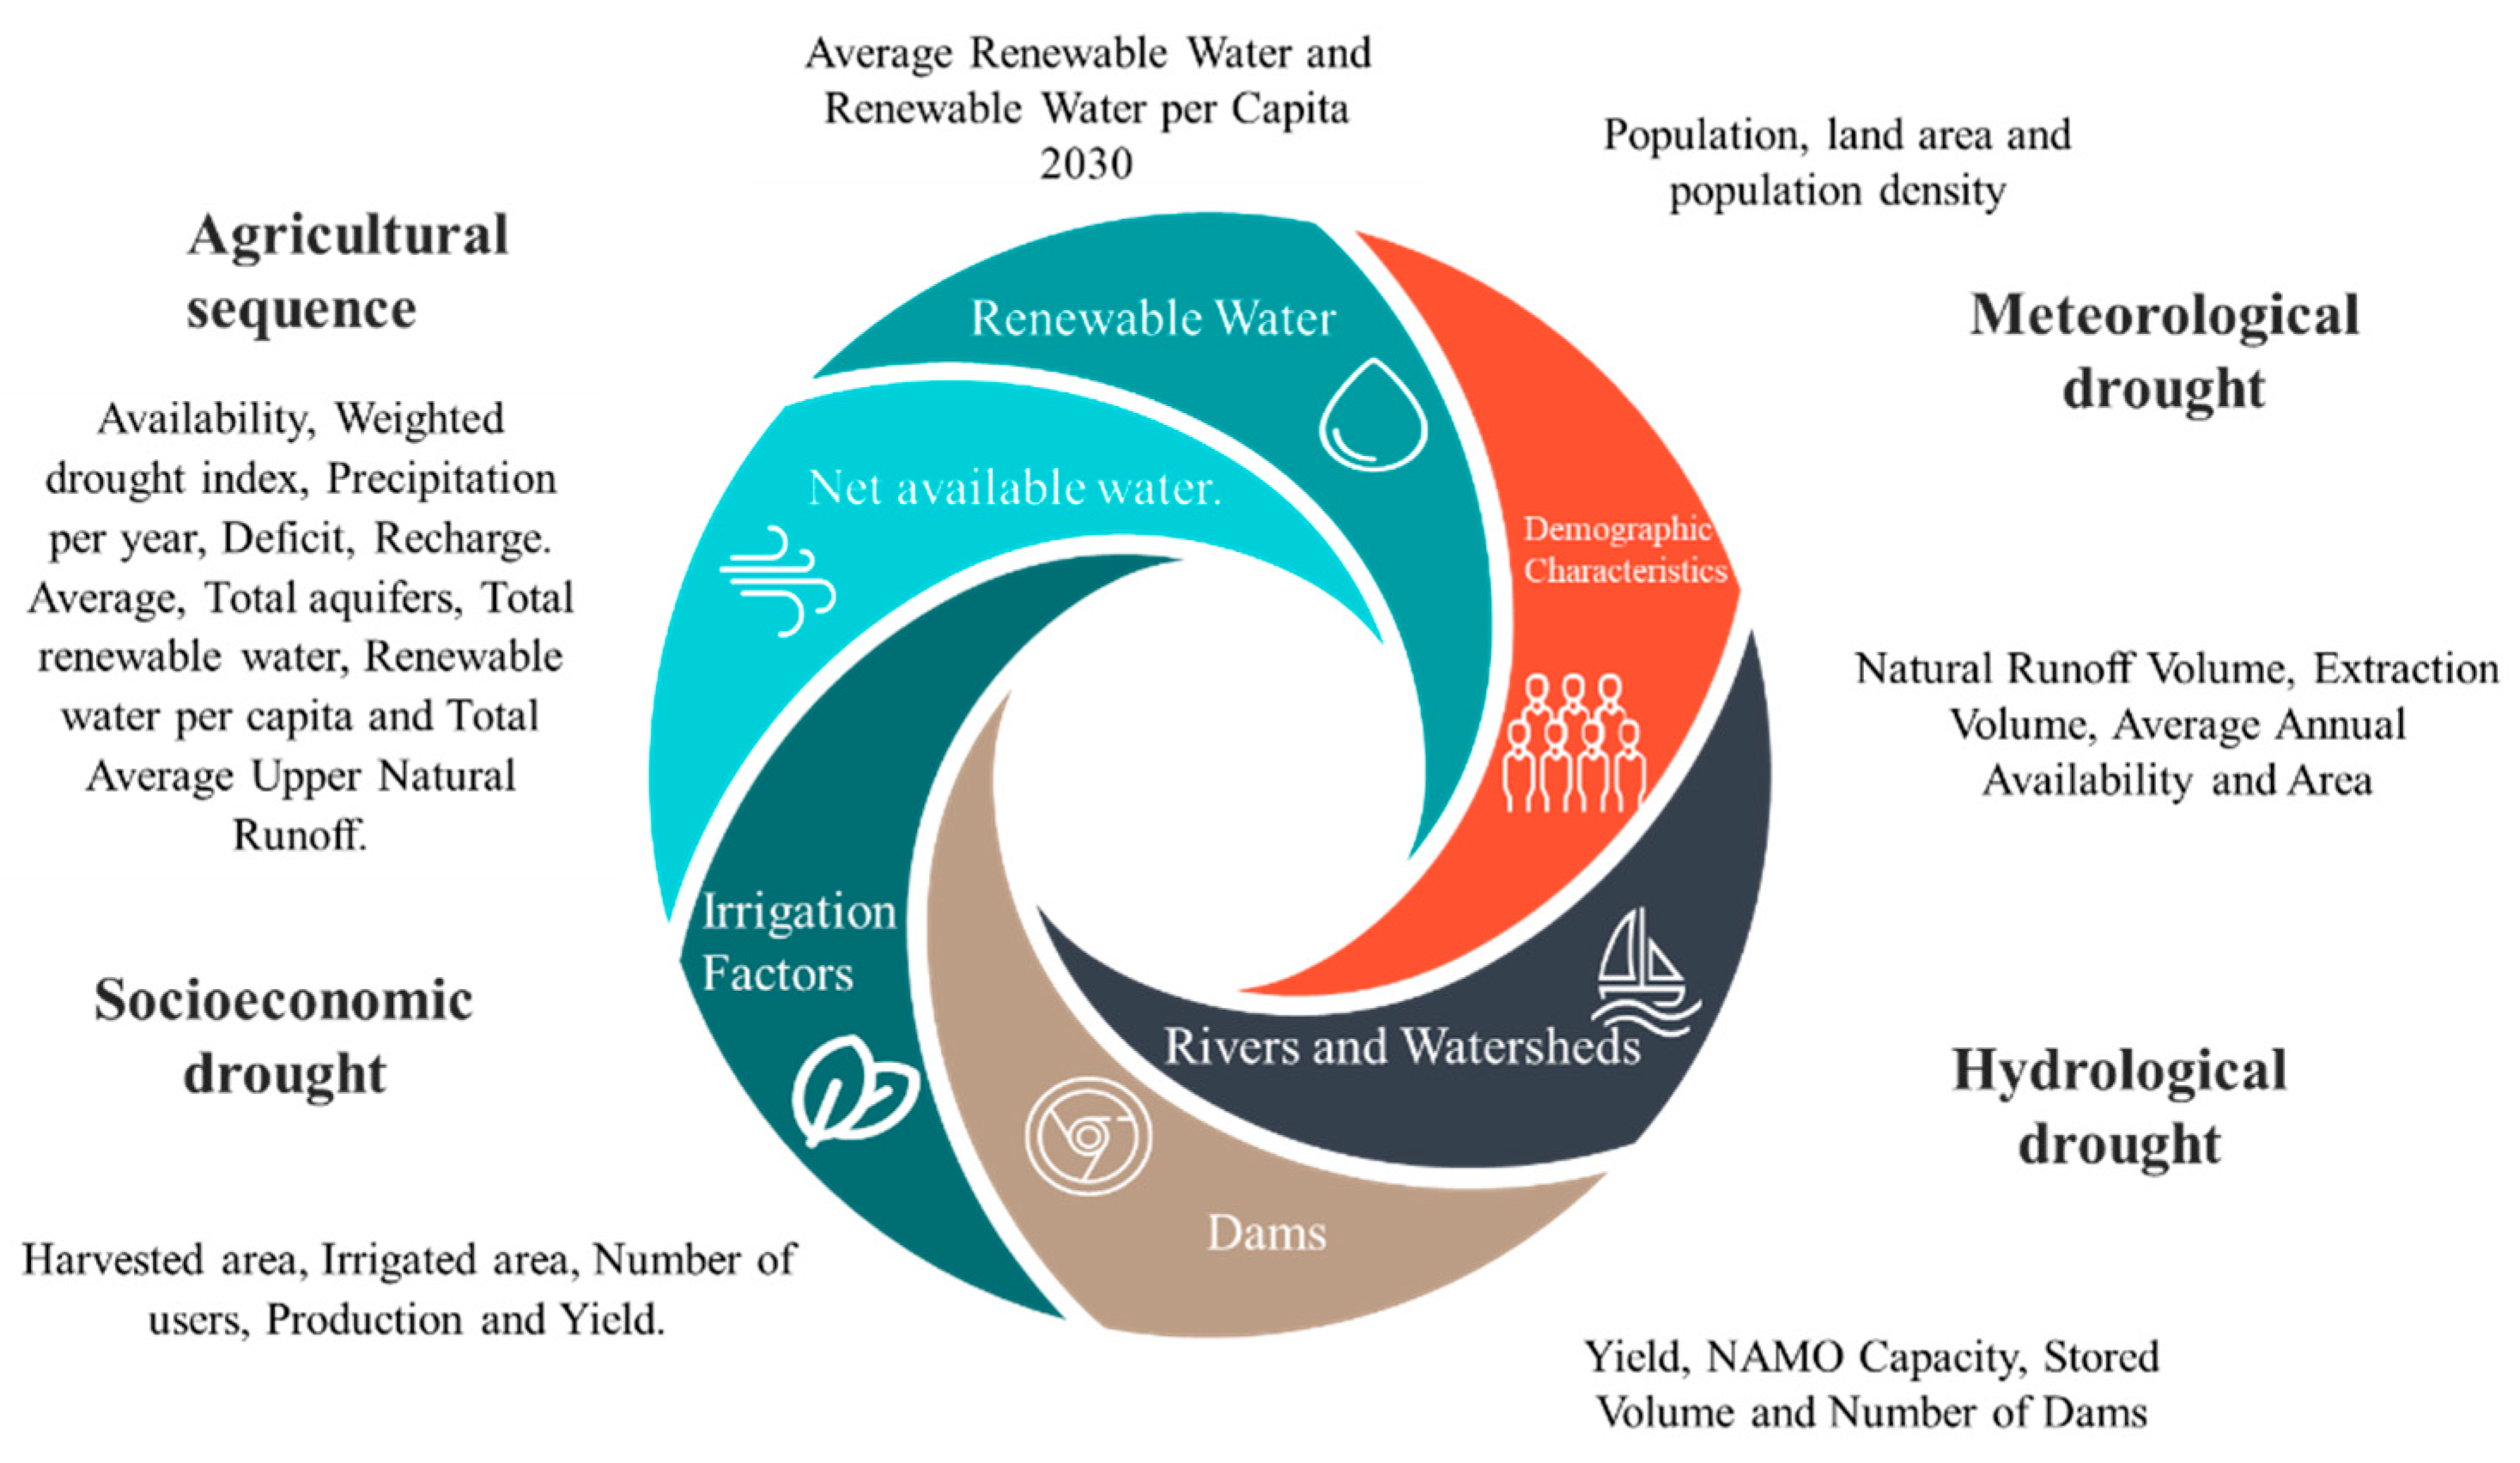
2.5. Selection, Analysis, and Grouping of the Variables Chosen for the Development of the Model
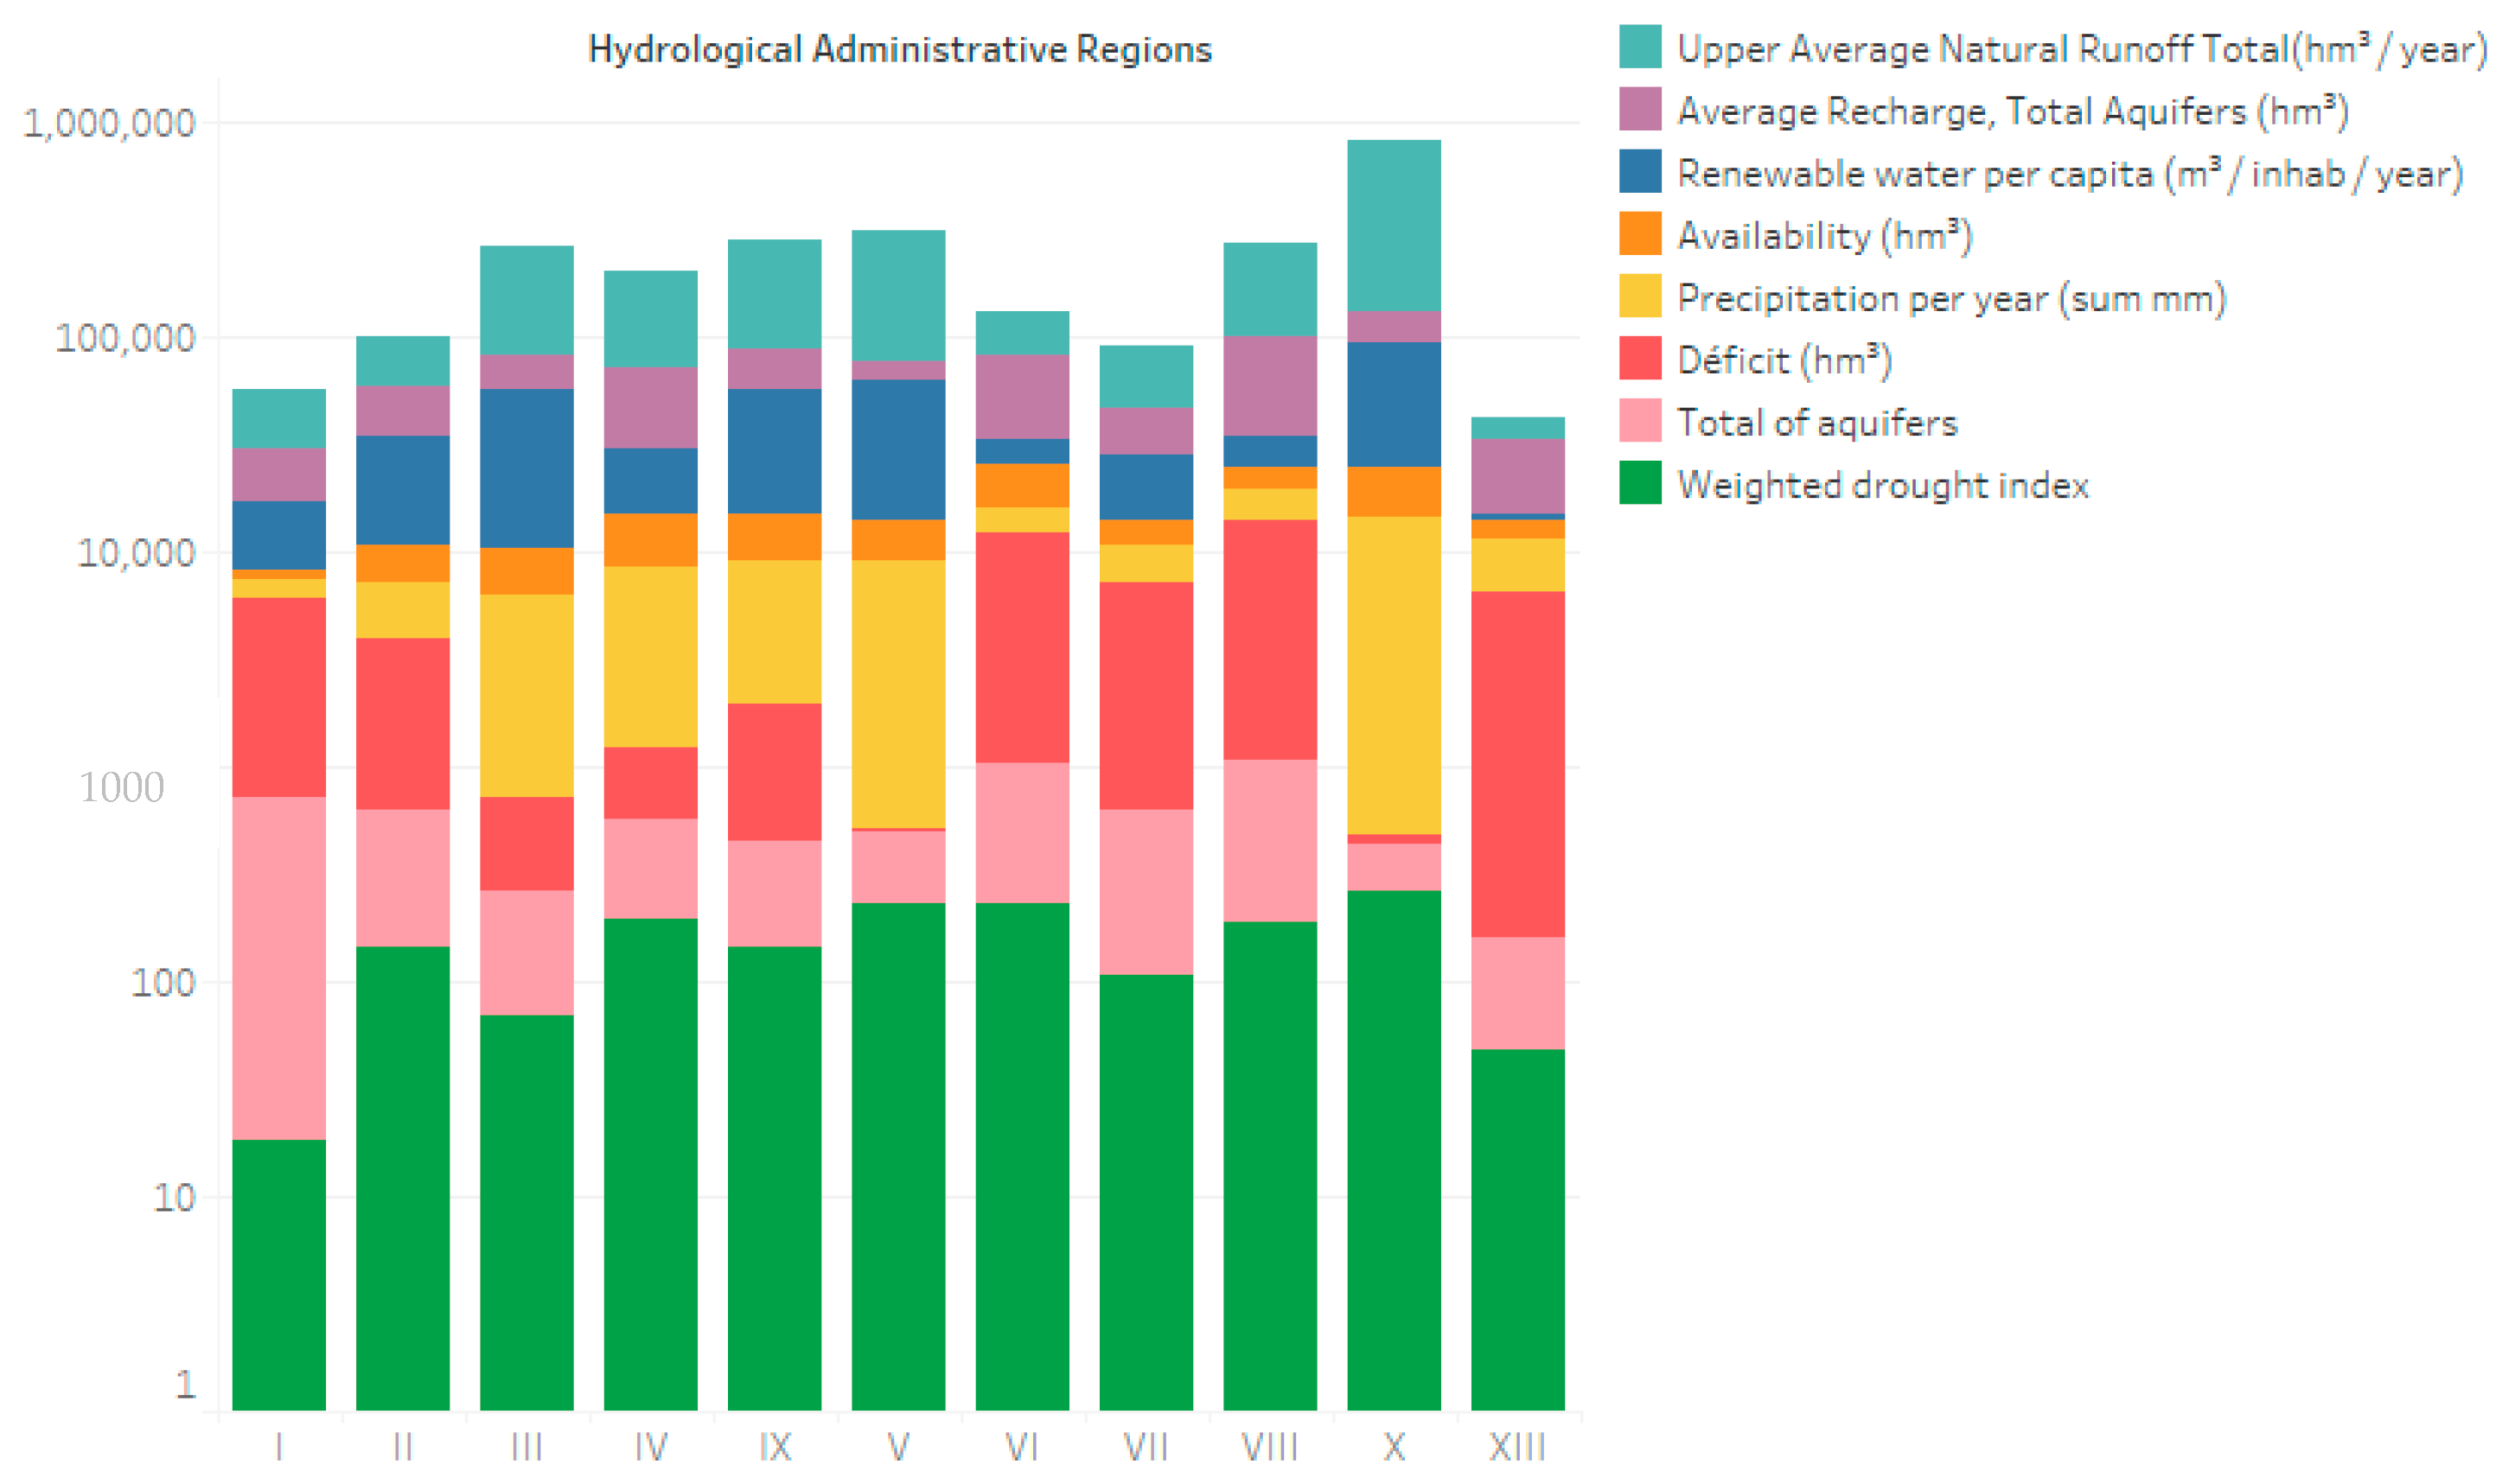
2.6. Configuration and Delimitation of the Data Structure for the Analysis of the Variables
2.7. Determination and Delimitation of the Predictor and Response Variables for the Initial Projection of the Base Model
2.8. The Initial Base Model’s Progressive Improvement Is Based on the Premises of Linearity, Heteroscedasticity, Collinearity, and Normality of the Errors
3. Results
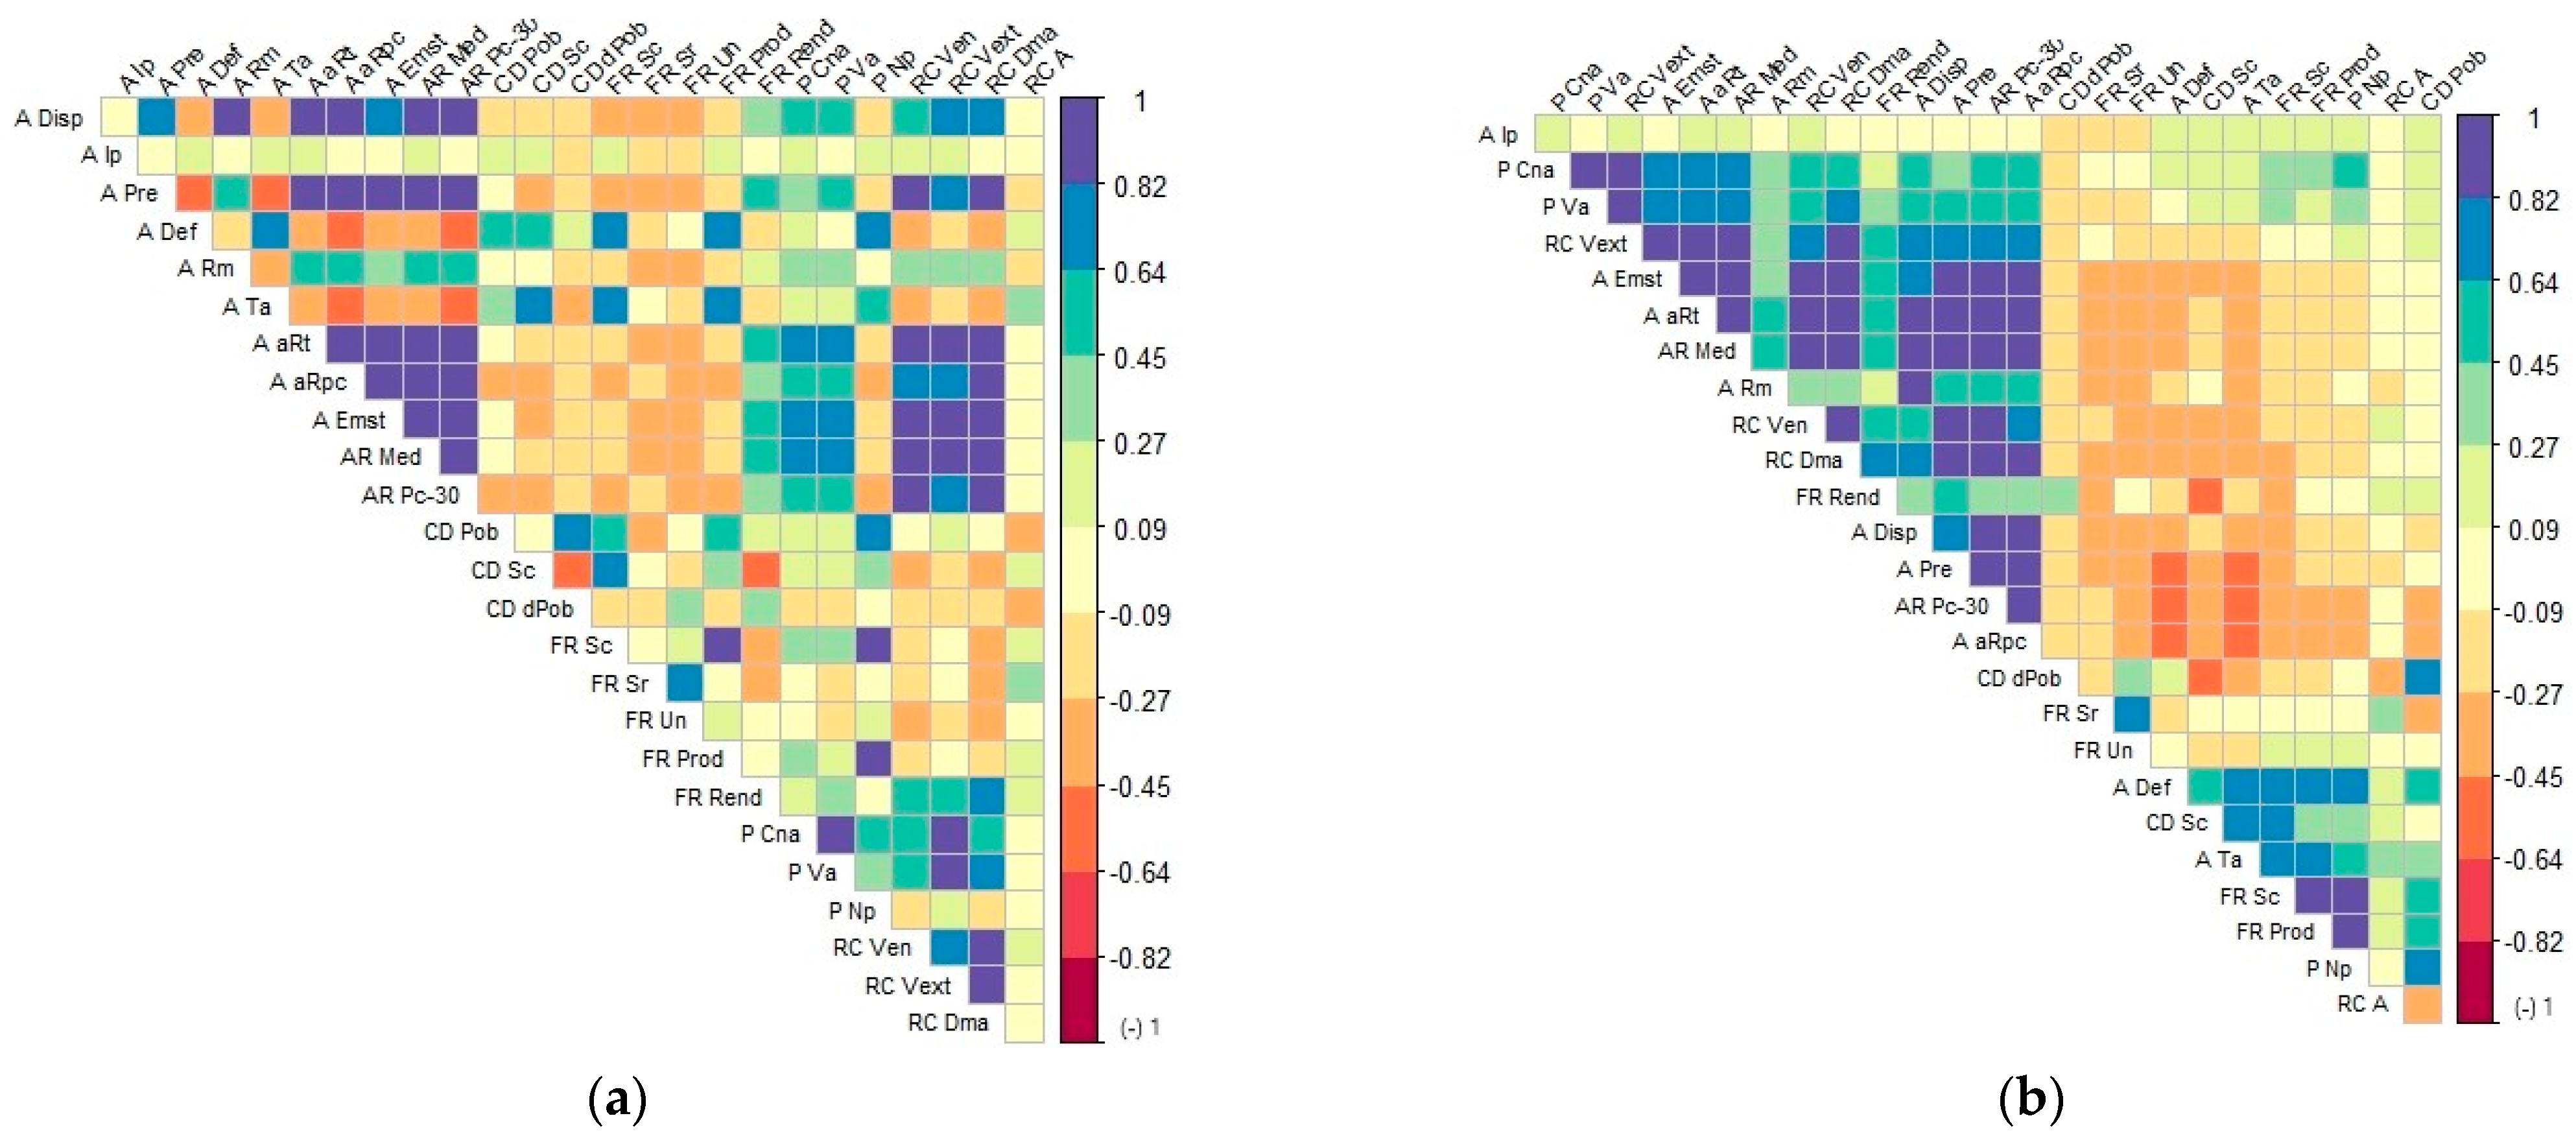
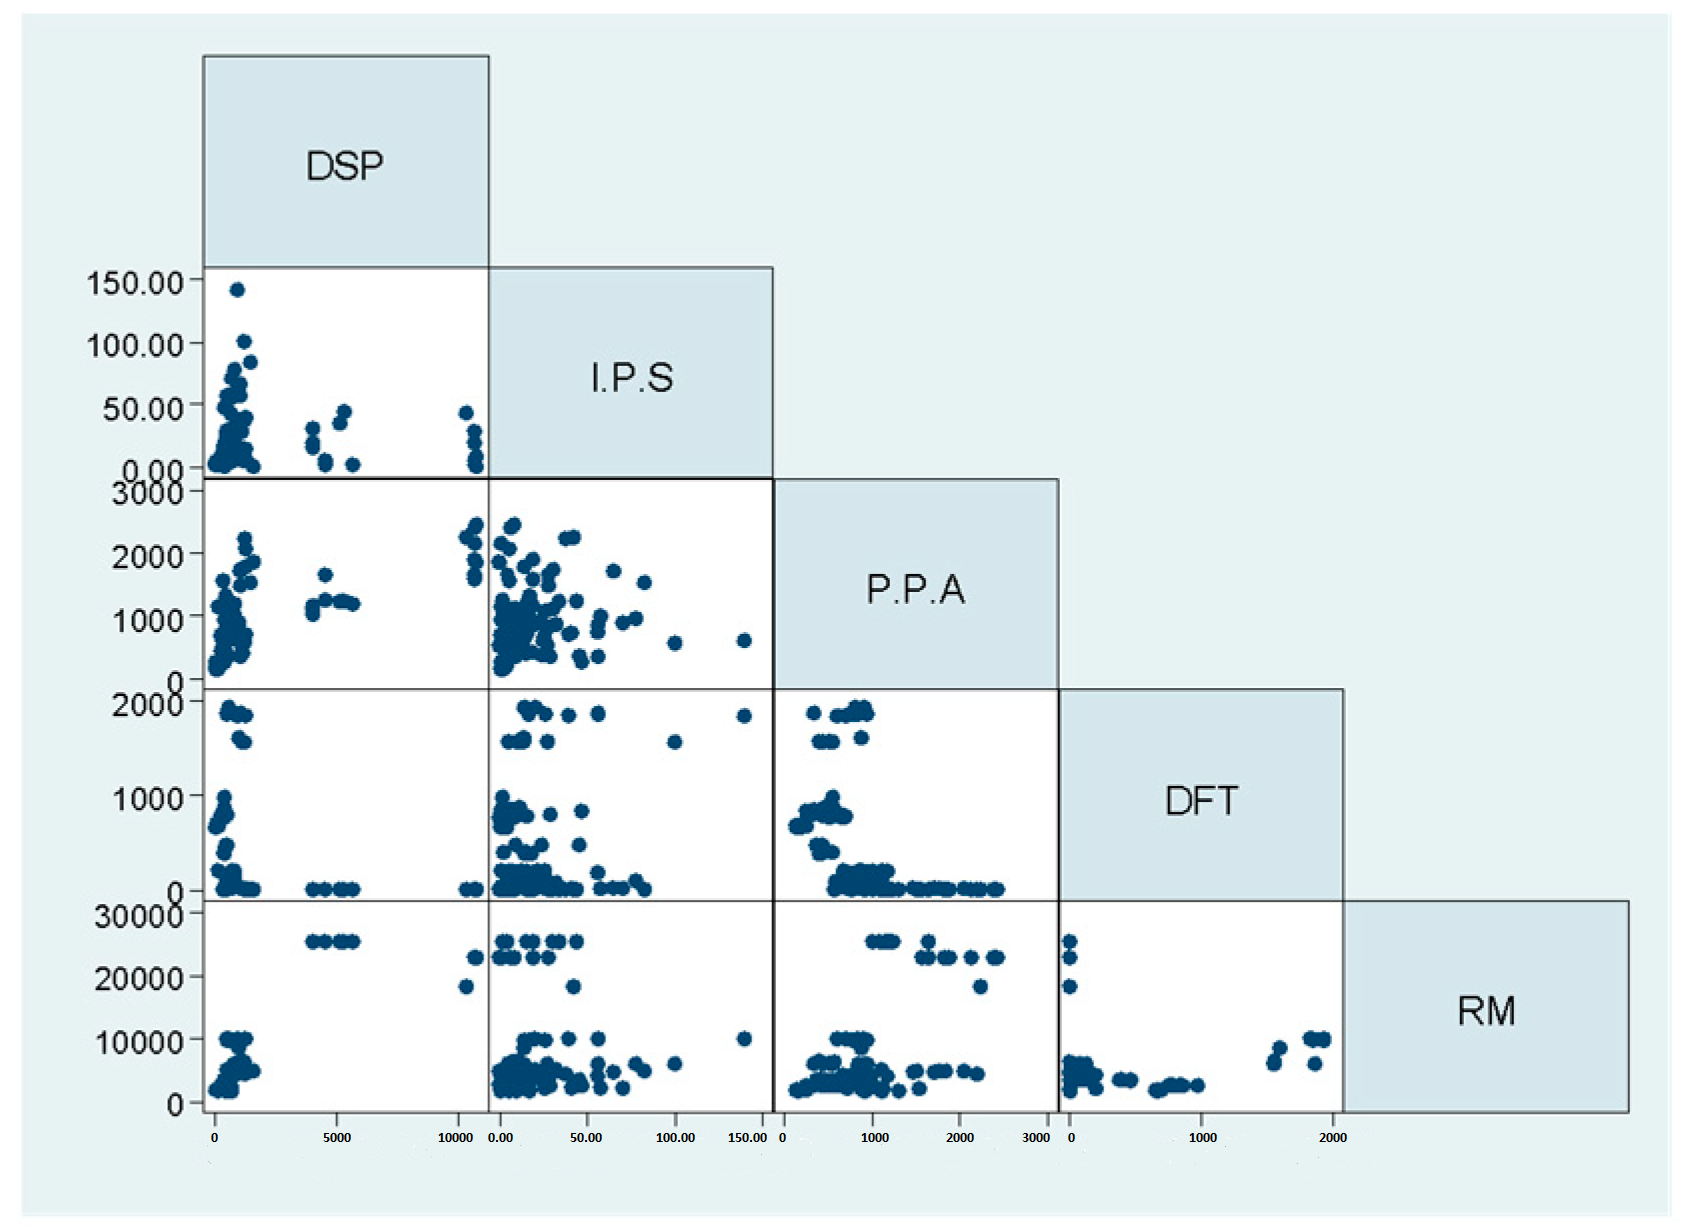
3.1. The Relationships Were Identified Between the 26 Variables from the Correlation Matrices
3.2. The Development of the Proposed Multivariate Base Model
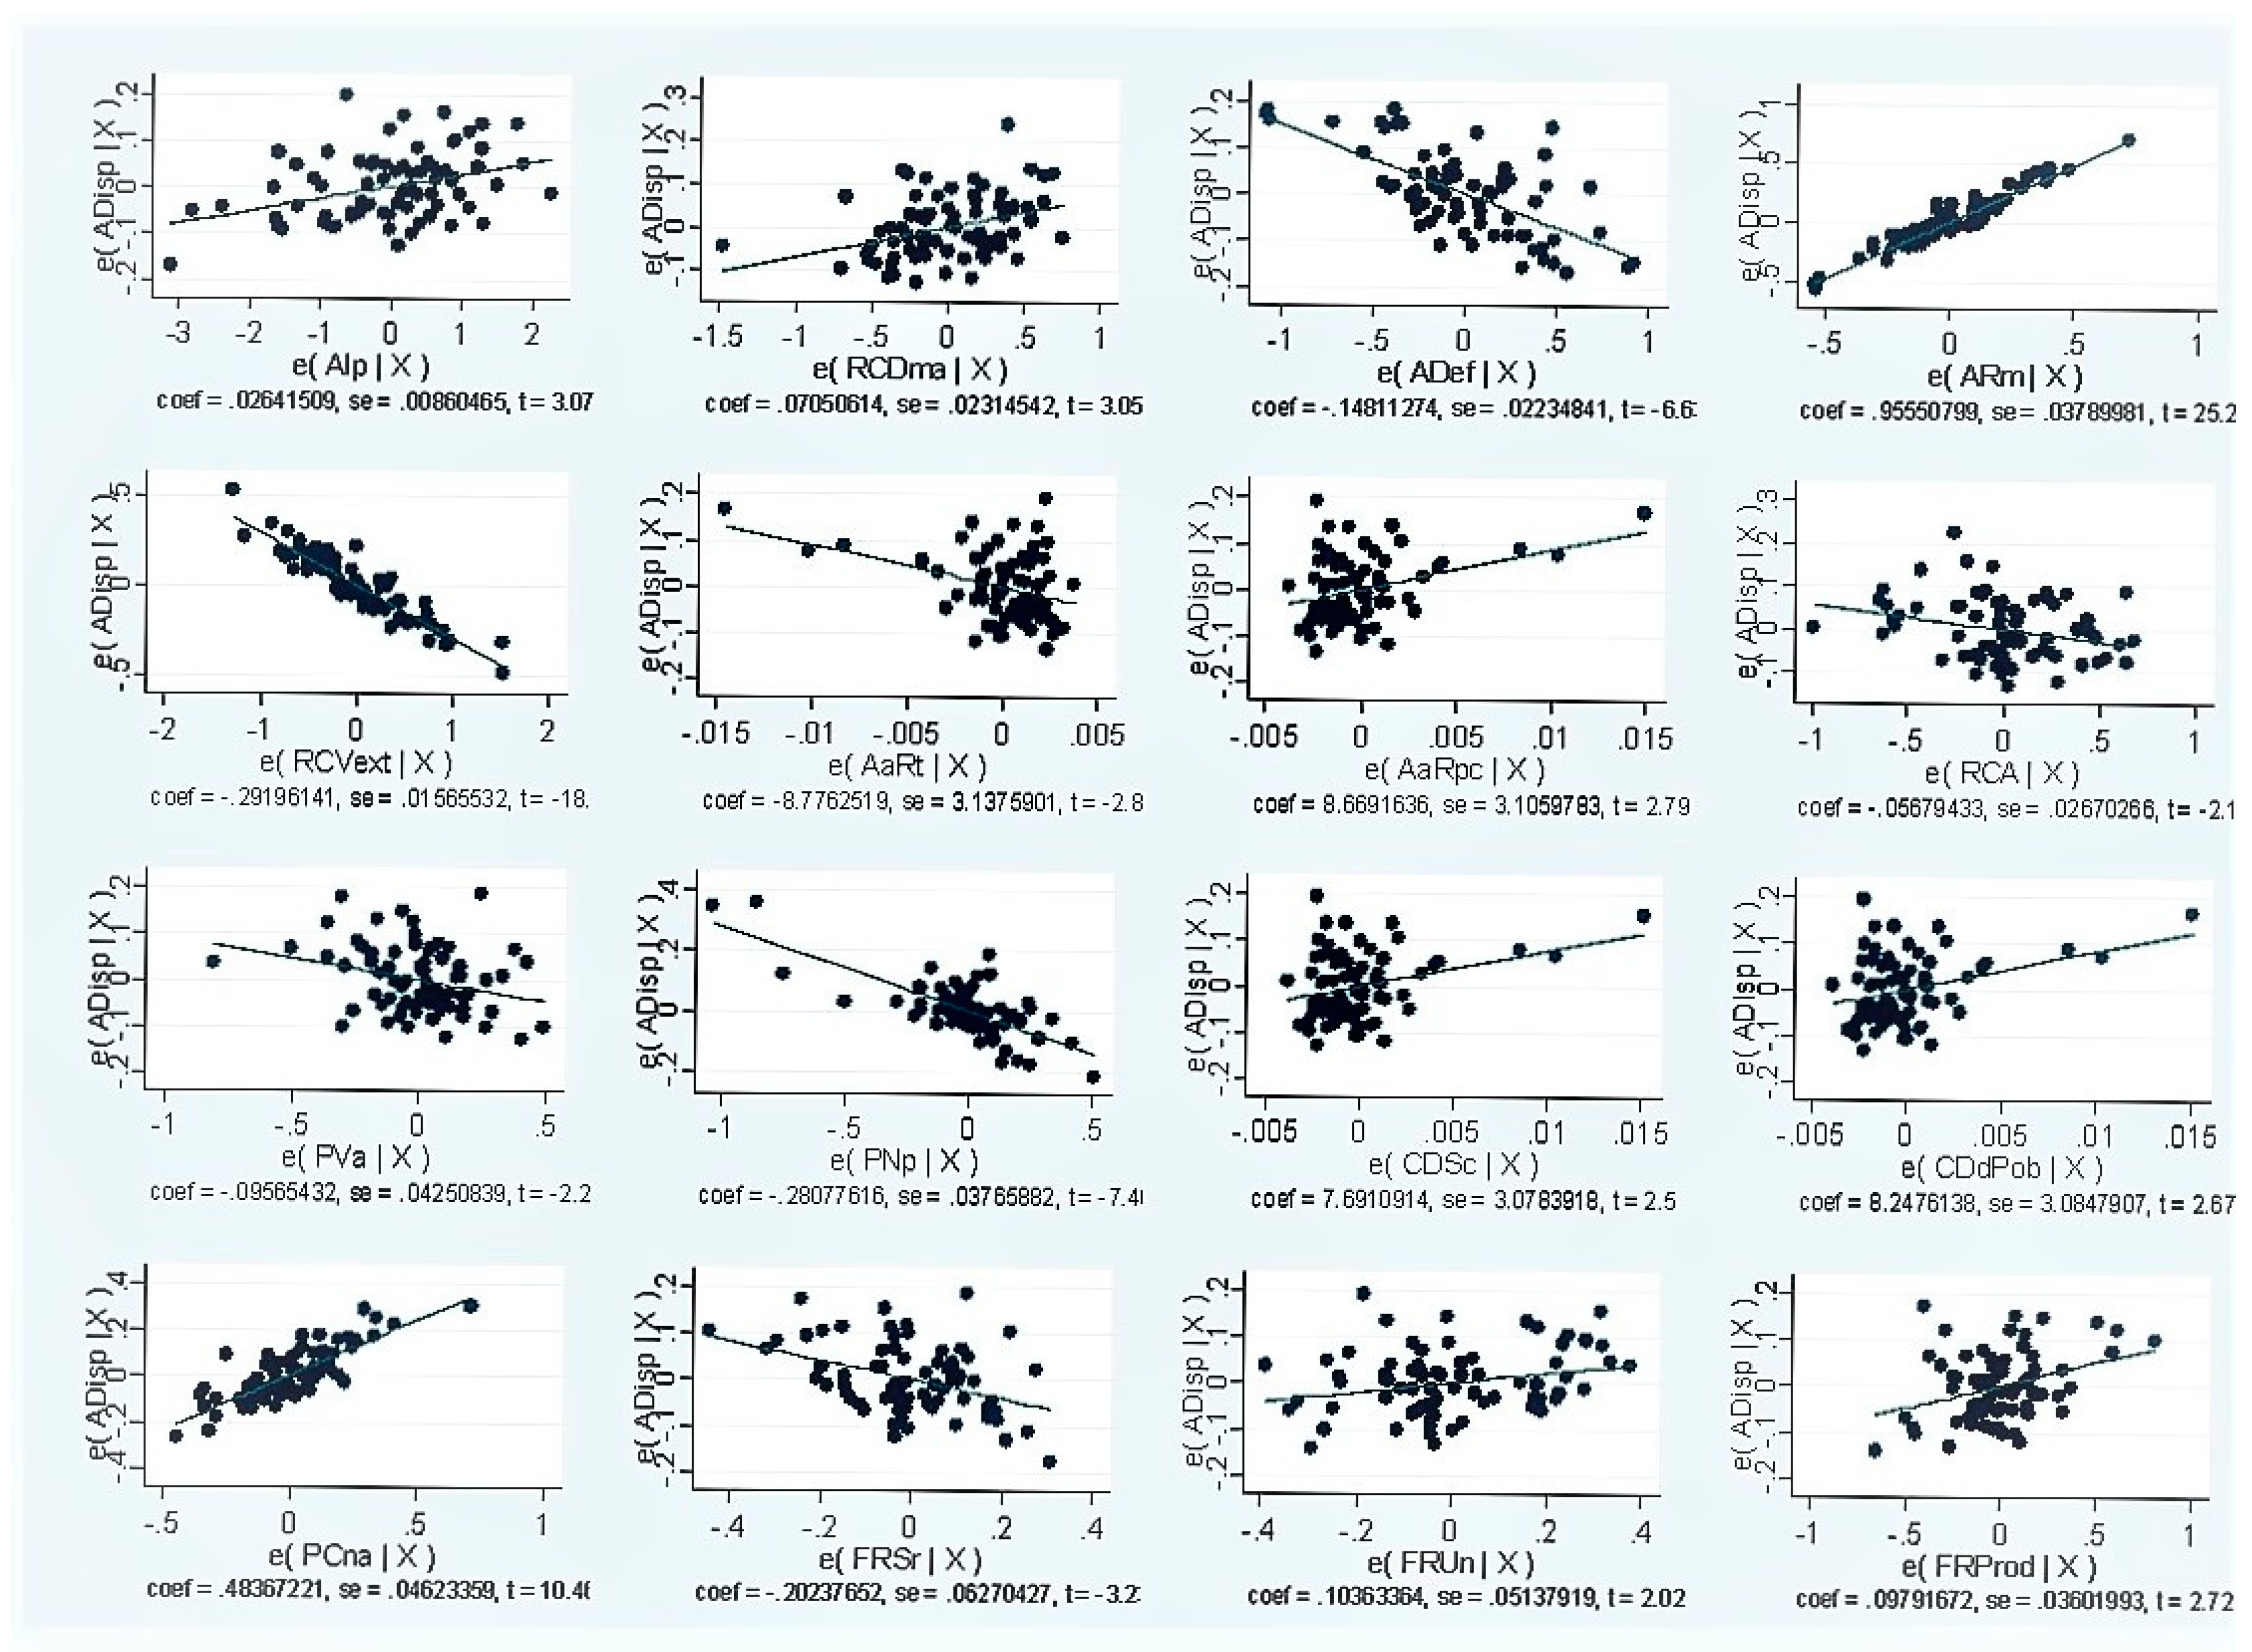
3.3. The Progressive Advance of the Base Model to Other Versions with Better Explanatory Conditions
4. Discussion
5. Conclusions
Author Contributions
Funding
Institutional Review Board Statement
Informed Consent Statement
Data Availability Statement
Conflicts of Interest
References
- Mundial, O.M.; Partnership, G.W. Directrices de Política Nacional Para la Gestión de Sequías: Modelo Para la Adopción de Medidas; OMM: Stockholm, Sweden, 2014; ISBN 9789187823145. Available online: https://library.wmo.int/index.php?lvl=author_see&id=94#.YNWfaGgzZPY (accessed on 22 January 2020).
- Bierkens, M. Interactive comment on “Drought in a human-modified world: Reframing drought definitions, understanding and analysis approaches” by A. F. Van Loon et al. Hydrol. Earth Syst. Sci. Discuss. 2016, 1–34. [Google Scholar] [CrossRef]
- Marta, S.R. Drought more than just a lack of rain. Greenpeace Magazine 2017, 24, 6–9. Available online: https://es.greenpeace.org/es/sala-de-prensa/informes/sequia-algo-mas-que-falta-de-lluvia-impactos-e-imagenes/ (accessed on 22 January 2020).
- David, O.; Israel, V.V.; Alberto, G.D.L.R.; Cortés, A.; Felipe, I.; Pérez, L. La Gestión de Sequías en México: Avances y Retos. XXIII Congr. Nac. Hidráulica 2014. [Google Scholar] [CrossRef]
- Centro Nacional Para la Prevención de Desastres. Sequias Serie Fascículos; Secretaría de Seguridady Protección Ciudadana: Ciudad de México, Mexico, 2007. [Google Scholar]
- Reddy, M.J.; Singh, V.P. Multivariate modeling of droughts using copulas and meta-heuristic methods. Stoch. Environ. Res. Risk Assess. 2014, 28, 475–489. [Google Scholar] [CrossRef]
- Hao, Z.; Aghakouchak, A. A nonparametric multivariate multi-index drought monitoring framework. J. Hydrometeorol. 2014, 15, 89–101. [Google Scholar] [CrossRef]
- Singh, N.P.; Bantilan, C.; Byjesh, K. Vulnerability and policy relevance to drought in the semi-arid tropics of Asia—A retrospective analysis. Weather Clim. Extrem. 2014, 3, 54–61. [Google Scholar] [CrossRef] [Green Version]
- Wickham, E.D.; Bathke, D.; Abdel-Monem, T.; Bernadt, T.; Bulling, D.; Pytlik-Zillig, L.; Stiles, C.; Wall, N. Conducting a drought-specific THIRA (Threat and Hazard Identification and Risk Assessment): A powerful tool for integrating all-hazard mitigation and drought planning efforts to increase drought mitigation quality. Int. J. Disaster Risk Reduct. 2019, 39, 101227. [Google Scholar] [CrossRef] [Green Version]
- Cantú-Martínez, P.C. Gestión del riesgo como un instrumento para prever los estragos de las sequías y de las inundaciones en México. Ambient. Desarro. 2017, 21, 27. [Google Scholar] [CrossRef] [Green Version]
- Francés, A.V.; Díaz-Delgado, C.; Albores, M.Á.; Bâ, K.M.; Piña, R.B.; Loza, C.A. Modelado de dinamica de incendios forestales en el estado de morelos, México. Aqua-LAC 2018, 10, 13–21. [Google Scholar] [CrossRef]
- Cisneros, B.J.; Armentia, M.L.T.; Aguilar, L.A. El Agua En México: Cauces y Encauces; Cisneros, B.J., Armentia, M.L.T., Aguilar, L.A., Eds.; Conagua: Chihuahua, Mexico, 2010; pp. 265–290. ISBN 9786079516611. [Google Scholar]
- Hao, Z.; Singh, V.P. Drought characterization from a multivariate perspective: A review. J. Hydrol. 2015, 527, 668–678. [Google Scholar] [CrossRef]
- Velasco, I.; Montesillo-cedillo, L. De Cuencas En Condiciones. Gestión Política Pública 2007, 16, 5–27. [Google Scholar]
- Marcos Valiente, Ó. Sequía: Definiciones, tipologías y métodos de cuantificación. Investig. Geográficas 2001, 26, 59–80. [Google Scholar] [CrossRef]
- Gutiérrez, C.; Ochoa, L.; Velasco, I. Sequía, un problema de perspectiva y gestión. Región Soc. 2005, 17, 35–71. [Google Scholar]
- Tu, X.; Wu, H.; Singh, V.P.; Chen, X.; Lin, K.; Xie, Y. Multivariate design of socioeconomic drought and impact of water reservoirs. J. Hydrol. 2018, 566, 192–204. [Google Scholar] [CrossRef]
- Comisión Nacional del Agua Política Pública Nacional para la Sequía. Programa Nacional Contra la Sequía. September 2018; p. 34. Available online: https://www.gob.mx/conagua/acciones-y-programas/programa-nacional-contra-la-sequia-pronacose-programas-de-medidas-preventivas-y-de-mitigacion-a-la-sequia-pmpms-para-ciudades (accessed on 22 January 2020).
- Velasco, I. Estrategia para Afrontar las Sequías; Tecnologías del Agua Resumen; Instituto Mexicano de Tecnología del Agua: Progreso, Mexico, 2018; pp. 1–14.
- De Michele, C.; Salvadori, G.; Vezzoli, R.; Pecora, S. Multivariate assessment of droughts: Frequency analysis and dynamic return period. Water Resour. Res. 2013, 49, 6985–6994. [Google Scholar] [CrossRef]
- Esparza, M. Drought and Water Shortages in Mexico: Current Status and Future Prospects. Secuencia 2014, 89, 193–219. [Google Scholar]
- Bandyopadhyay, N.; Bhuiyan, C.; Saha, A.K. Drought mitigation: Critical analysis and proposal for a new drought policy with special reference to Gujarat (India). Prog. Disaster Sci. 2020, 5, 100049. [Google Scholar] [CrossRef]
- Ayantobo, O.O.; Li, Y.; Song, S. Multivariate Drought Frequency Analysis using Four-Variate Symmetric and Asymmetric Archimedean Copula Functions. Water Resour. Manag. 2019, 33, 103–127. [Google Scholar] [CrossRef] [Green Version]
- Han, Z.; Huang, S.; Huang, Q.; Leng, G.; Wang, H.; Bai, Q.; Zhao, J.; Ma, L.; Wang, L.; Du, M. Propagation dynamics from meteorological to groundwater drought and their possible influence factors. J. Hydrol. 2019, 578, 124102. [Google Scholar] [CrossRef]
- Calvo, P.; Navarro, R.; Francisco, J. Estimacion de la demanda de agua para riego: Regresiones lineales versus aproximaciones neuronales. Av. Recur. Hidráulicos 2005, 12, 7–19. [Google Scholar]
- Wilhite, D.; Sivakumar, M.V.K.; Pulwarty, R. Managing drought risk in a changing climate: The role of national drought policy. Weather Clim. Extrem. 2014, 3, 4–13. [Google Scholar] [CrossRef] [Green Version]
- CEMDA El agua en México: El agua en México. Medio Ambient. y Desarrolo Hacia un Manejo Sustentable del Agua 2006, Enero-Marzo. p. 96. Available online: http://www.conagua.gob.mx/CONAGUA07/Publicaciones/Publicaciones/EL-AGUA-EN-MEXICO.pdf (accessed on 22 January 2020).
- Domínguez, J. Revisión histórica de las sequías en México: De la explicación divina a la incorporación de la ciencia. Tecnol. Cienc. Agua 2016, 7, 77–93. [Google Scholar]
- Arreguín-Cortés, F.I.; López-Pérez, M.; Ortega-Gaucin, D.; Ibañez-Hernández, Ó. La política pública contra la sequía en México: Avances, necesidades y perspectivas. Tecnol. Cienc. Agua 2016, 7, 63–76. [Google Scholar]
- Denzin, C.; Taboada, F.; Pacheco Vega, R.; Friedrich, E.S. El Agua en México. Actores, Sectores y Paradigmas Para una Transformación Social-Ecológica; Friedrich-Ebert-Stiftung: Ciudad de México, Mexico, 2017; ISBN 9786077833864. [Google Scholar]
- Dourojeanni, A.; Jouravlev, A.; Chávez, G. Gestión del Agua a Nivel de Cuencas: Teoría y Práctica; CEPAL: Santiago, Chile, 2002; Volume 47, ISBN 9213220707. [Google Scholar]
- Martínez-Austria, P.F.; Vargas-Hidalgo, A. Modelo dinámico adaptativo para la gestión del agua en el medio urbano. Tecnol. Cienc. Agua 2016, 7, 139–154. [Google Scholar]
- Blanquero, R.; Carriosa, E.; Pita, M.; Camarillo, J.; Álvarez, J. Modelo estocástico para la predicción del Índice Estandarizado de Sequía Pluviométrica (IESP) en Andalucía. Asoc. Española Climatol. 8 Congr. Int. 2012, 8, 261–270. [Google Scholar]
- Hao, Z.; AghaKouchak, A. Multivariate Standardized Drought Index: A parametric multi-index model. Adv. Water Resour. 2013, 57, 12–18. [Google Scholar] [CrossRef] [Green Version]
- Austin, S.H.; Nelms, D.L. Modeling Summer Month Hydrological Drought Probabilities in the United States Using Antecedent Flow Conditions. J. Am. Water Resour. Assoc. 2017, 53, 1133–1146. [Google Scholar] [CrossRef] [Green Version]
- Escalante, C. Identificación y análisis de sequías en la Región Hidrológica Número 10, Sinaloa. Ing. Hidráulica México 1998, 8, 23–43. [Google Scholar]
- Rueda, V.O.M.; Neri, C. Cambio climático y sequías en México. Ciencia 2012, 63, 26–35. [Google Scholar]
- Álvarez Olguín, G.; Hotait Salas, N.; Sustaita Rivera, F. Identificación de regiones hidrológicas homogéneas mediante análisis multivariado Identification of Homogeneous Hydrological Regions through Multivariate Analysis. Ing. Investig. Tecnol. 2011, XII, 277–284. [Google Scholar]
- Huang, S.; Huang, Q.; Chang, J.; Zhu, Y.; Leng, G.; Xing, L. Drought structure based on a nonparametric multivariate standardized drought index across the Yellow River basin, China. J. Hydrol. 2015, 530, 127–136. [Google Scholar] [CrossRef]
- Vargas, A.B.; Antonio, M.; Guzmán, M. Patrones de sequía en Centroamérica; Global Water Pathership Central America: Tegucigalpa, Honduras, 2014; Volume 53. [Google Scholar]
- Ortega-Gaucin, D. Sequía: Causas y efectos de un fenómeno global. Cienc. UANL 2013, 16, 8–15. [Google Scholar]
- Li, Z.; Chen, Y.; Fang, G.; Li, Y. Multivariate assessment and attribution of droughts in Central Asia. Sci. Rep. 2017, 7, 1–12. [Google Scholar] [CrossRef]
- AghaKouchak, A. A multivariate approach for persistence-based drought prediction: Application to the 2010-2011 East Africa drought. J. Hydrol. 2015, 526, 127–135. [Google Scholar] [CrossRef]
- Abuín, J.M.R. Kostengünstige Umformtechnik “mit Profil” VDI-Z Integr. Produktion 2008, 150, 22–23. [Google Scholar]
- Kologlu, Y.; Birinci, H.; Kanalmaz, S.I.; Ozyilmaz, B. A Multiple Linear Regression Approach for Estimating the Market Value of Football Players in Forward Position. arXiv 2018, arXiv:1807.01104. [Google Scholar]
- Carrasquilla-Batista, A.; Chacón-Rodríguez, A.; Núñez-Montero, K.; Gómez-Espinoza, O.; Valverde-Cerdas, J.; Guerrero-Barrantes, M. Regresión lineal simple y múltiple: Aplicación en la predicción de variables naturales relacionadas con el crecimiento microalgal. Rev. Tecnol. Marcha 2016, 29, 33. [Google Scholar] [CrossRef] [Green Version]
- Alexopoulos, E.C. Introduction to Multivariate Regression Analysis. Hippokratia 2005, 14, 23–28. [Google Scholar]
- Vilà, R.; Torrado, M.; Reguant, M. Análisis de Regresión Lineal Múltiple con SPSS. REIRE Rev. Innovació Recer. Educ. 2019, 12, 1–10. [Google Scholar] [CrossRef] [Green Version]
- Hair, J.F.; Anderson, R.E.; Tatham, R.L.; Black, W.C. Análisis Multivariante, Quinta ed.; Andrés, O., Ed.; Prentice Hall International: Hoboken, NJ, USA, 1999; ISBN 0-13-930587-4. [Google Scholar]
- García, J.d.l.G.; Serrano, B.N.M.; Cavazos, B.A.G. Análisi Estadistico Multivariante; Chacon, J.M., Arriaga, K.E., Martinez, M.R., Eds.; McGraw-Hill: Ciudad de México, Mexico, 2013; ISBN 978-607-15-0817-1. [Google Scholar]
- Instituto Nacional de Estadística y Geografía (INEGI). Referencias geográficas y extensión territorial de México. Geogr. México 2013, 17. [Google Scholar] [CrossRef] [Green Version]
- Perevochtchikova, M.; Arellano-Monterrosas, J.L. Gestión de cuencas hidrográficas: Experiencias y desafíos en México y Rusia River basin management: Experience and challenges in Mexico and Russia. Rev. Latinoam. Recur. Nat. 2008, 4, 313–325. [Google Scholar]
- Katz, E.; Lammel, A. Clima, metereologia, Mexico. Ciencias 2008, 90, 61–67. [Google Scholar]
- Sistema Nacional de Información del Agua (SINA)|Comisión Nacional del Agua|Gobierno|gob.mx. Available online: https://www.gob.mx/conagua/acciones-y-programas/sistema-nacional-de-informacion-del-agua-sina (accessed on 22 February 2020).
- Roberto Hernández Sampieri, C.F.C.; Lucio, M.d.P.B. Metodología de la Investigación; Mc Graw Hill Edo: Mexico City, Mexico, 2014; ISBN 9781456223960. [Google Scholar]
- Madrid, U.A. De Clasificación y descripción de las metodologías de investigación en Psicología. Int. J. Clin. Health Psychol. 2002, 2, 503–508. [Google Scholar]
- Ato, M.; López, J.; Benavente, A. Un sistema de clasificación de los diseños de investigación en psicología Introducción Un marco conceptual para la investigación. An. Psicol. 2013, 29, 1038–1059. [Google Scholar] [CrossRef] [Green Version]
- Sousa, V.; Driessnack, M.; Costa, I. Revisión de diseños de investigación resaltantes para enfermería. Parte1: Diseño de investigación cuantitativa. Rev. Latinoam. Enferm. 2007, 15, 6. [Google Scholar]
- Romero Navarrete, L.; Olvera Molina, M. Control del agua bajo el modelo de gestión por cuencas hidrológicas en México. Iztapalapa. Rev. Cienc. Soc. Humanid. 2019, 125–158. [Google Scholar] [CrossRef]
- Comisión Nacional del Agua Estadísticas del Agua en México; Comisión Nacional del Agua México, D.F.: Ciudad de México, Mexico, 2018; p. 303.
- Comisión Nacional del Agua Estadísticas del Agua en México; Comisión Nacional del Agua México, D.F.: Ciudad de México, Mexico, 2017; p. 294.
- CONAGUA Consejos de Cuenca|Comisión Nacional del Agua|Gobierno|gob.mx. Available online: https://www.gob.mx/conagua/documentos/consejos-de-cuenca (accessed on 30 July 2020).
- Mansfield, E.R.; Helms, B.P. Detecting Multicollinearity. Am. Stat. 1982, 36, 158–160. [Google Scholar] [CrossRef]
- Islam, M.Q.; Tiku, M.L. Multiple linear regression model under nonnormality. Commun. Stat. Theory Methods 2004, 33, 2443–2467. [Google Scholar] [CrossRef]
- Granados, R. Modelos de Regresión Lineal Múltiple; Departamento de Economía Aplicada, Universidad de Granada: Granada, Spain, 2016; p. 60. [Google Scholar]


| Category | Variable | Code | Description |
|---|---|---|---|
| Aquifers | Availability (hm3) | ADisp | The total volume of surface and underground renewable water that occurs naturally in a region. |
| Weighted drought index | AIp | Average calculation stipulated from the conditions referred to by the records of the national drought monitor. | |
| Precipitation per year (sum mm) | APre | Precipitation is any product of the condensation of atmospheric water vapor-deposited on the Earth’s surface. | |
| Deficit (hm3) | ADef | The water deficit is, in short, a scarcity of water, so the concept is closely related to drought or scarcity. | |
| Average Recharge, Total Aquifers (hm3) | ARmAquifer | Average Recharge is the average annual volume of water that enters an aquifer. | |
| Total of aquifers | ATa | Total number of underground structures that house water | |
| Total renewable (hm3/year) | AaRt | Renewable water is called the maximum amount of water that is feasible to exploit annually in a country without altering the ecosystem, and that is renewed by the middle of the rain. | |
| Renewable water per capita (m3/inhab/year) | AaRpc | The renewable water per capita of a country results from dividing its renewable resources by the number of inhabitants. | |
| Upper Average Natural Runoff Total (hm3/year) | AEmst | It is the average annual volume of surface water that is captured by the hydrological basin itself | |
| Renewable | Water Average renewable water (hm3/year) | ARMed | Renewable water is called the maximum amount of water that is feasible to exploit annually in a country without altering the ecosystem, and that is renewed through the rain. |
| Renewable water per capita 2030 (m3/inhab/year) | ARP30 | Renewable water at the maximum amount of water feasible to exploit per inhabitant in the country projected to 2030. | |
| Demographic Characteristics | Population (Habs.) | CDPob | Set of inhabitants of the country. |
| Continental Surface (km2) | CDSc | The continental surface refers to the national territory’s part articulated with the American Continent and the insular one to the country’s islands’ surface. | |
| Population Density (inhab/km2) | CDdPob | Population density is equivalent to the number of inhabitants divided by the area where they live. | |
| Irrigation Factors | Harvested area (ha) | FRSc | It is the area from which agricultural production was obtained. |
| area (ha) | IrrigatedFRSr | The area of all the parcels that during the census year has been effectively irrigated at least once | |
| Number of users | FRUn | Several agricultural users per region. | |
| Production (thousands of tons) | FRProd | It is the result of the practice of agriculture. | |
| Yield (ton/ha) | FRRend | It is the ratio of the total production of a particular crop harvested per hectare of land used. | |
| Dams | Capacity in Ordinary Maximum Water Level (NAMO) (hm3) | PCna | Maximum Ordinary Water Level, the maximum level at which the dam can be operated to meet the demands, it can be drinking water, power generation, and/or irrigation |
| Volume stored (hm3) | PVa | It is the amount of water stored by the dams | |
| Number of dams | PNp | Several dams are currently existing. | |
| Rivers and Basins | Natural runoff volume (hm3) | RCVen | It is the average annual volume of surface water captured by the hydrological basin’s natural drainage network. |
| Extraction volume (hm3) | RCVext | Amount of water extracted. | |
| The average annual availability of rivers and basins (hm3) | RCDma | It is the average annual volume of water s that, when positive, can be extracted from an aquifer for various uses, in addition to the extraction already granted and the natural discharge compromised, without putting in danger the balance of ecosystems. | |
| Area (km2) | RCA | Territorial delimitation of the regions expressed in Km2 |
| (1) Availability | (2) Coefficients from the Regression Equation | (3) p-Value | (4) Significance of the Coefficient at 5% | (5) Significance of the Coefficient at 1% |
|---|---|---|---|---|
| Weighted drought index | −0.8053803 | 0.638 | ||
| Precipitation per year (mm) | −0.0752947 | 0.756 | ||
| Deficit (hm3) | −0.0021905 | 0.993recharge | ||
| Average(hm3) | −1.226786 | 0.689 | ||
| Total, from aquifers | −4.085112 | 0.408 | ||
| Total renewable water (hm3/year) | 1.328022 | 0.664 | ||
| Renewable water per capita (m3/inhabitants/year) | 0.4585418 | 0.024 | 0.459 (2.30) * | |
| Average surface natural runoff total (hm3/year) | −1.350149 | 0.659 | ||
| Renewable water per capita by 2030 (hm3/year) | −0.0885943 | 0.681 | ||
| Population (inhabitants) | 0.0000391 | 0.402 | ||
| Continental surface (km2) | 0.0039529 | 0.04 | 0.04 (2.09) * | |
| Population density (inhab./km2) | 0.2932887 | 0.702 | ||
| Harvested area (ha) | 0.0001496 | 0.869 | ||
| Total irrigated area (ha) | −0.0006992 | 0.469 | ||
| Number of Users | −0.0059074 | 0.072 | ||
| Agricultural production (thousands of tons) | −0.0081616 | 0.816 | ||
| Yield (tons ha) | 19.45961 | 0.063 | ||
| NAMO Capacity (hm3) | 0.0033639 | 0.91 | ||
| Stored Volume (hm3) | −0.0009924 | 0.965 | ||
| Number of dams | −15.57708Esc | 0.13 | ||
| Vol. annual nat. (hm3) | −0.0620822 | 0 | −0.062 (5.59) * | −0.062 (5.59) ** |
| Extraction(hm3) | volume0.0403797 | 0.003 | 0.040 (3.04) * | 0.040 (3.04) ** |
| Average annual availability of rivers (hm3) | 0.0161765 | 0 | 0.016 (3.68) * | 0.016 (3.68) ** |
| Area (km2) | 0.0013894 | 0.361 | ||
| _cons | −1251.237 | 0.015 |
| Measure Analyzed | Result Obtained |
|---|---|
| Number of obs | 104 |
| Prob > F | 0.0000 |
| R-squared | 0.9927 |
| Adj R-squared | 0.9905 |
| Root MSE | 274.33 |
| Assumptions of the Regression | |||
|---|---|---|---|
| Model Proposed | Normality of the Residuals | Multicollinearity | Heteroscedasticity |
| A (104 obs.) | ✗ | ✓ | ✓ |
| B (88 obs.) | ✓ | ✓ | ✓ |
| C (80 obs.) | ✓ | ✓ | ✗ |
| D (75 obs.) | ✓ | ✓ | ✗ |
| Model | Number of Variables Included | Variables Significant at 5% | Variables Significant at 1% |
|---|---|---|---|
| E | 14 | 12 | 10 |
| F | 16 | 16 | 12 |
| Availability | Coefficient (β) from the Regression Equation | p-Value | Significance of the Coefficient at 5% | Significance of the Coefficient at 1% |
|---|---|---|---|---|
| Weighted drought index | 0.0264151 | 0.003 | * | ** |
| The average annual availability of rivers (hm3) | 0.0705061 | 0.003 | * | ** |
| Deficit (hm3) | −0.1481127 | 0 | * | * * |
| Average(hm3) | Recharge 0.955508 | 0 | * | ** |
| Extraction(hm3) | volume−0.2919614 | 0 | * | ** |
| Total renewable water (hm3/year) | −8.776252 | 0.007 | * | ** |
| Renewable water per capita (m3/inhab/year) | 8.669164 | 0.007 | * | ** |
| Area (km2) | −0.0567943 | 0.038 | * | |
| Stored Volume (hm3) | −0.0956543 | 0.028 | * | |
| Number of dams | −0.2807762 | 0 | * | ** |
| Continental surface (km2) | 7.691091 | 0.015 | * | |
| Population density (inhab./km2) | 8.247614 | 0.01 | * | ** |
| NAMO Capacity (hm3) | 0.4836722 | 0 | * | ** |
| Total irrigated area (ha) | −0.2023765 | 0.002 | * | ** |
| Number of Users | 0.1036336 | 0.048 | * | |
| Agricultural production (thousands of tons) | 0.0979167 | 0.009 | * | ** |
| _cons | −105.9004 | 0.015 | * |
| Assumptions of the Regression | |||
|---|---|---|---|
| Model Proposed | Normality of the Residuals | Multicollinearity | Heteroskedasticity |
| E (stepwise forward 75 obs.) | ✓ | ✓ | ✓ |
| F (stepwise backward 75 obs.) | ✓ | ✓ | ✗ |
| Availability | Coefficients from the Regression Equation Recharge | p-Value | Significance of the Coefficient at 5% | Significance of the Coefficient at 1% |
|---|---|---|---|---|
| Average(hm3) | 0.8696483 | 0 | * | ** |
| Deficit (hm3) | −0.1020095 | 0 | * | ** |
| Stored volume (hm3) | −0.0528958 | 0.219 | ||
| Vol. extraction (hm3) | −0.2832898 | 0 | * | ** |
| area Harvested(ha) | 0.0201653 | 0.559 | ||
| Number of dams | −0.3176423 | 0 | * | ** |
| Continental area (km2) | −0.549637 | 0 | * | ** |
| NAMO capacity (hm3) | 0.4871519 | 0 | * | ** |
| Renewable water per capita (m3/inhab./year) | 0.3211761 | 0 | * | ** |
| Area (km2) | −0.1068207 | 0 | * | ** |
| The average annual availability of rivers (hm3) | 0.1502486 | 0 | * | ** |
| Weighted drought index | 0.0201989 | 0.024 | * | |
| Total average surface natural runoff (hm3/year) | −0.4389393 | 0.002 | * | ** |
| Total irrigated area (ha) | −0.0774245 | 0.022 | * | |
| _cons | 7.8723 | 0 | * | ** |
| Summary of the Correlation Coefficients of the Models | |||||
|---|---|---|---|---|---|
| Model (1) | Number of Obs (2) | Prob > F (3) | R-Squared (4) | Adj R-Squared (5) | Root MSE (6) |
| A | 104 | 0.0000 | 0.9927 | 0.9905 | 274.33 |
| B | 88 | 0.0000 | 0.9981 | 0.9973 | 123.75 |
| C | 80 | 0.0000 | 0.9927 | 0.9995 | 0.10172 |
| D | 75 | 0.0000 | 0.9963 | 0.9945 | 0.07615 |
| E (Forward) | 75 | 0.0000 | 0.9950 | 0.9938 | 0.08066 |
| F (Backward) | 75 | 0.0000 | 0.9956 | 0.9944 | 0.07711 |
| Proposed Model | Multicollinearity | Heteroskedasticity Homoscedasticity | Residual Graph |
|---|---|---|---|
| A (104 obs.) | All VIFs are > 10. Only the weighted index variable is the only one whose value is within an acceptable range. There is multicollinearity in the | Breusch-Pagan/Cook-Weisberg test for heteroskedasticity Ho model: Constant variance = 0.000 There is heteroskedasticity in the model | 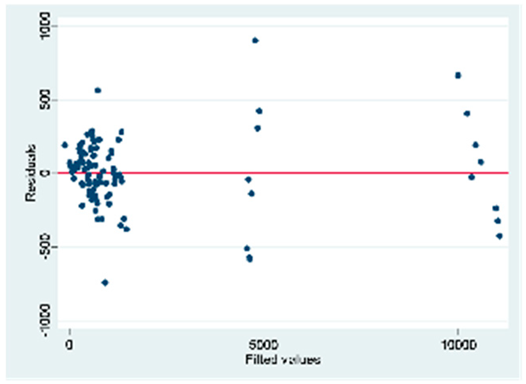 |
| B (88 obs.) | All the VIFs are > 10. Only the variable of the weighted index is the only one whose value is in an acceptable range. There is multicollinearity in the | Breusch-Pagan/Cook-Weisberg model test for heteroskedasticity Ho: Constant variance = 0.0254 There is heteroskedasticity in the model | 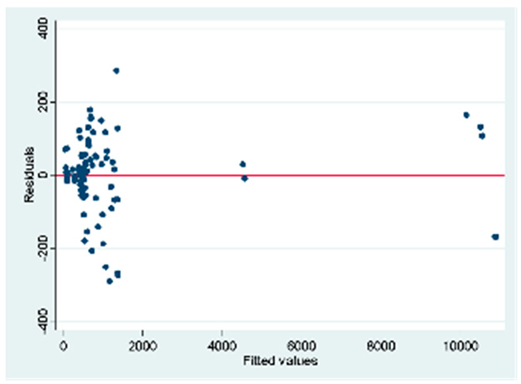 |
| C (80 obs.) | All the VIFs are > 10. Only the variable of the weighted index is the only one whose value is in an acceptable range. There is multicollinearity in the | Breusch-Pagan/Cook-Weisberg model test for heteroskedasticity Ho: Constant variance = 0.1032 There is no heteroscedasticity in the model | 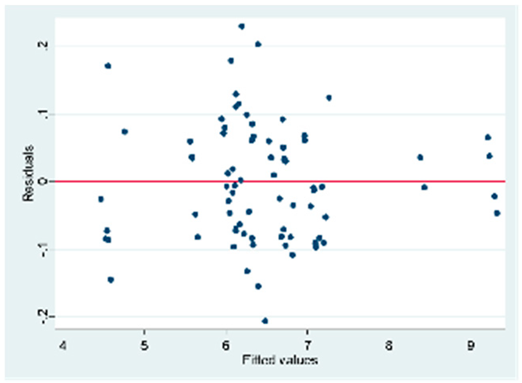 |
| D (75 obs.) | All VIFs are > 10. Only the variable weighted index is the only one whose value is in an acceptable range exists multicollinearity in the model | Ramsey RESET test using powers of the fitted values Ho: model has no variables omitted = 0.1636 There is no heteroscedasticity in the model | 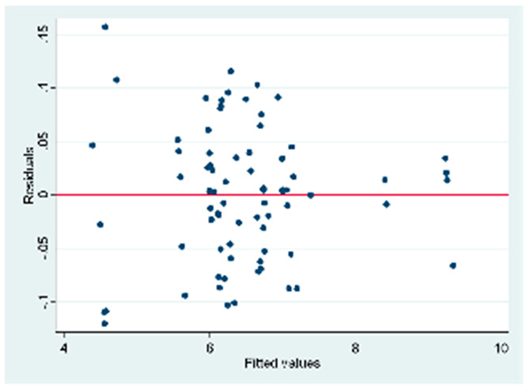 |
| Forward | Some values of the VIF are > 10. Except for the variables number of dams, area, average recharge, and the weighted drought index. There is multicollinearity in the | Breusch-Pagan/Cook-Weisberg test for heteroskedasticity Ho model: Constant variance = 0.0089 The model shows heteroscedasticity. Ramsey RESET test using powers of the fitted values Ho: model has no omitted variables = 0.0207 | 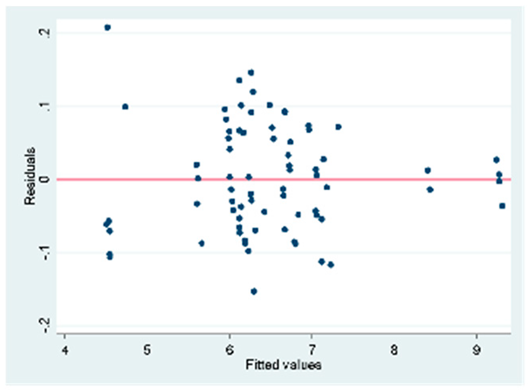 |
| Backward | Some VIF values are > 10. The variables weighted indexes, extraction volume, mean recharge, and area are in an acceptable range There is multicollinearity in the model | RamseyRESET test using powers of the fitted values Ho: model has no omitted variables = 0.0002 The model does not show heteroskedasticity of agreement with the first test Ramsey RESET test using powers of the fitted values Ho: model has no omitted variables = 0.0985 | 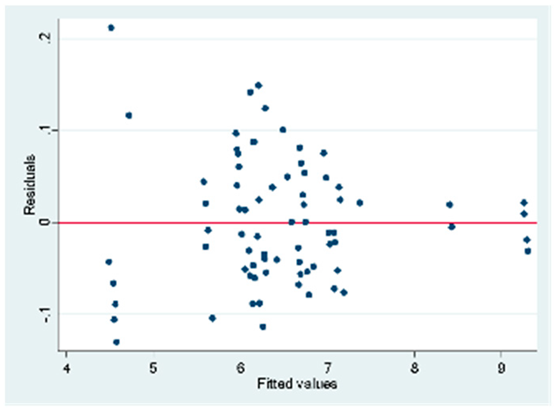 |
| Proposed Models | Graph of Normality of the Errors P. | Graph of Normality of the Errors Q. | Graph of the Density of the Errors. |
|---|---|---|---|
| A (104 Obs.) | 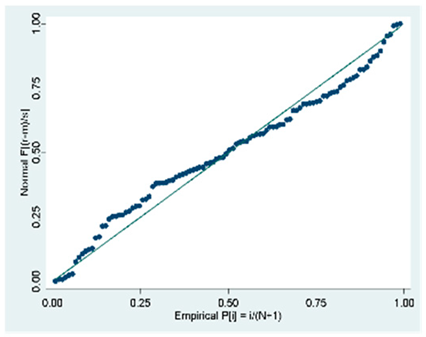 | 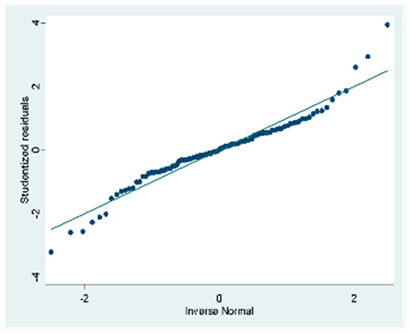 | 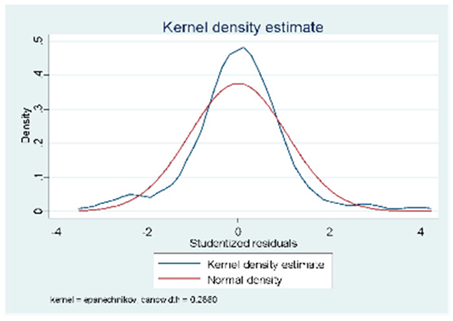 |
| B (88 Obs.) | 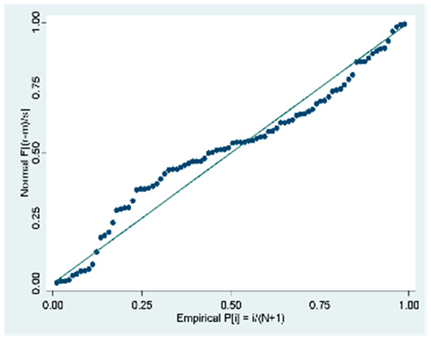 | 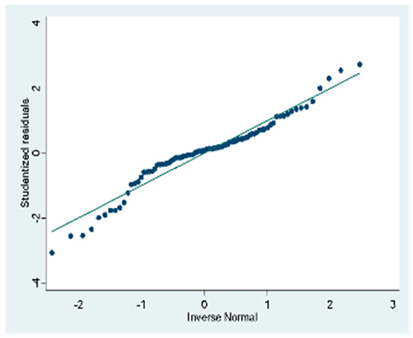 |  |
| C (80 Obs.) | 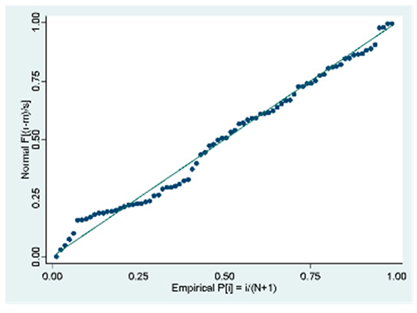 |  | 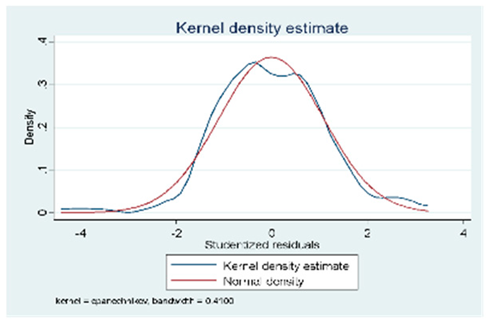 |
| D (75 Obs.) | 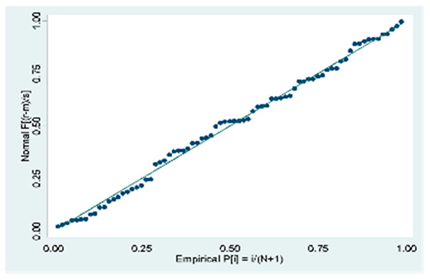 | 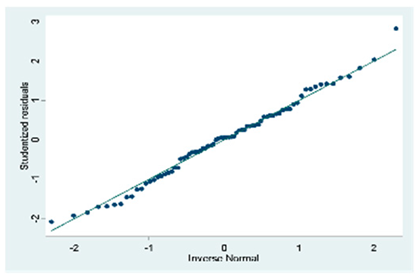 | 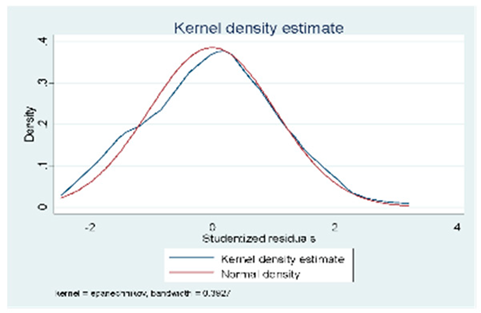 |
| Forward | 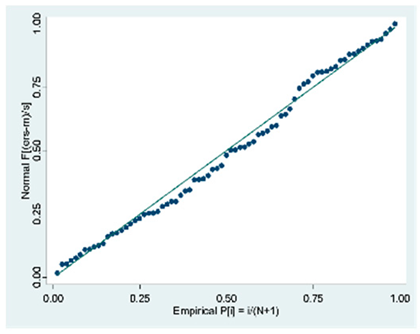 | 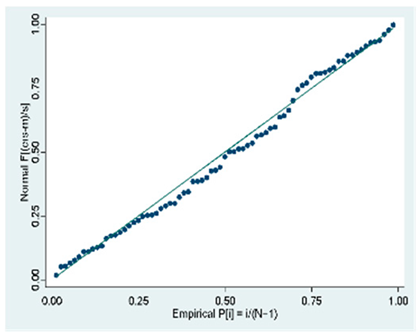 | 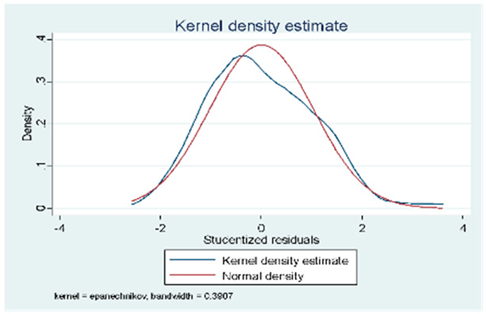 |
| Toward Backward | 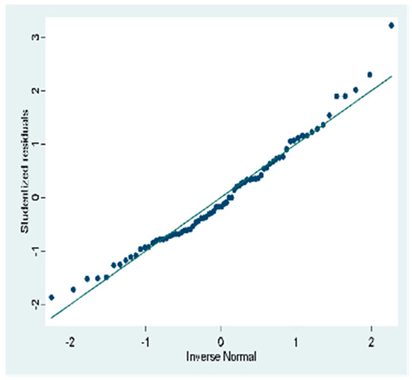 | 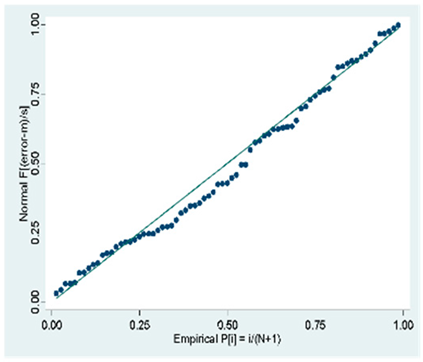 | 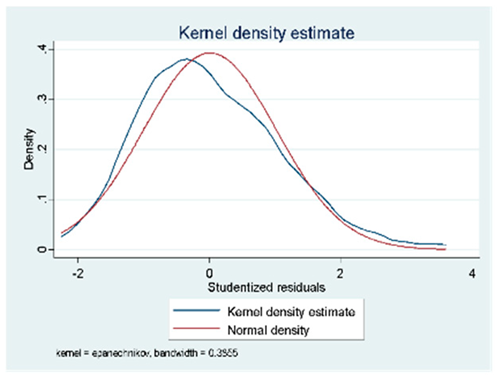 |
Publisher’s Note: MDPI stays neutral with regard to jurisdictional claims in published maps and institutional affiliations. |
© 2021 by the authors. Licensee MDPI, Basel, Switzerland. This article is an open access article distributed under the terms and conditions of the Creative Commons Attribution (CC BY) license (https://creativecommons.org/licenses/by/4.0/).
Share and Cite
Romero-Montoya, H.; Sánchez-Partida, D.; Martínez-Flores, J.-L.; Cano-Olivos, P. Development of a Multivariate Model Focused on the Analysis of Water Availability in Mexico. Water 2021, 13, 1779. https://doi.org/10.3390/w13131779
Romero-Montoya H, Sánchez-Partida D, Martínez-Flores J-L, Cano-Olivos P. Development of a Multivariate Model Focused on the Analysis of Water Availability in Mexico. Water. 2021; 13(13):1779. https://doi.org/10.3390/w13131779
Chicago/Turabian StyleRomero-Montoya, Hugo, Diana Sánchez-Partida, José-Luis Martínez-Flores, and Patricia Cano-Olivos. 2021. "Development of a Multivariate Model Focused on the Analysis of Water Availability in Mexico" Water 13, no. 13: 1779. https://doi.org/10.3390/w13131779
APA StyleRomero-Montoya, H., Sánchez-Partida, D., Martínez-Flores, J.-L., & Cano-Olivos, P. (2021). Development of a Multivariate Model Focused on the Analysis of Water Availability in Mexico. Water, 13(13), 1779. https://doi.org/10.3390/w13131779