
Microphytobenthos in the Hypersaline Water Bodies, the Case of Bay Sivash (Crimea): Is Salinity the Main Determinant of Species Composition?


Abstract
1. Introduction
2. Materials and Methods
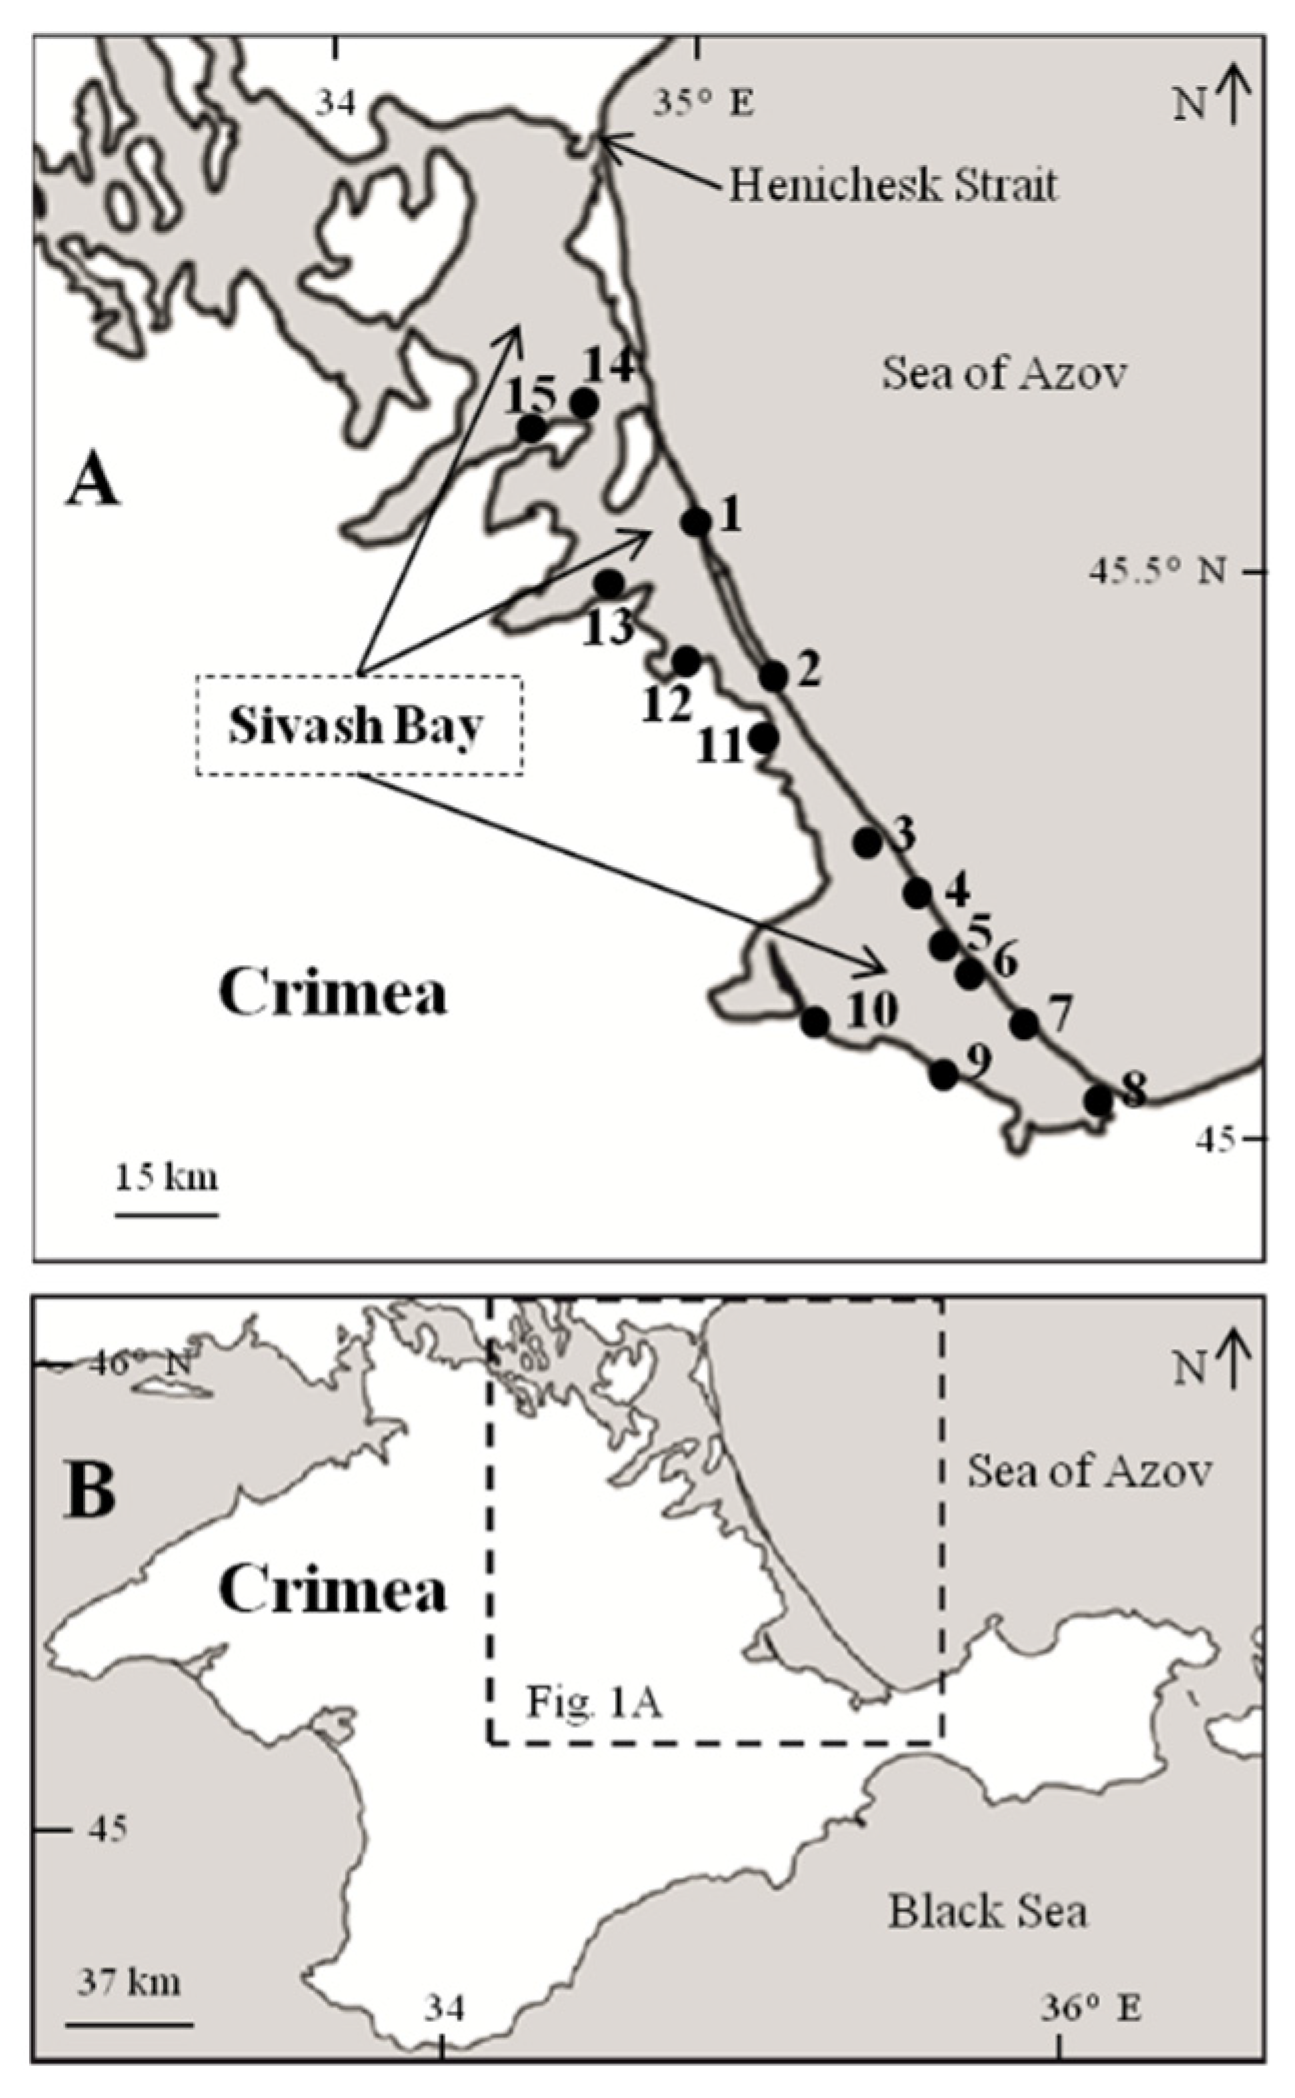
2.1. Study Area
2.2. Sampling and Processing
2.3. Data Analysis
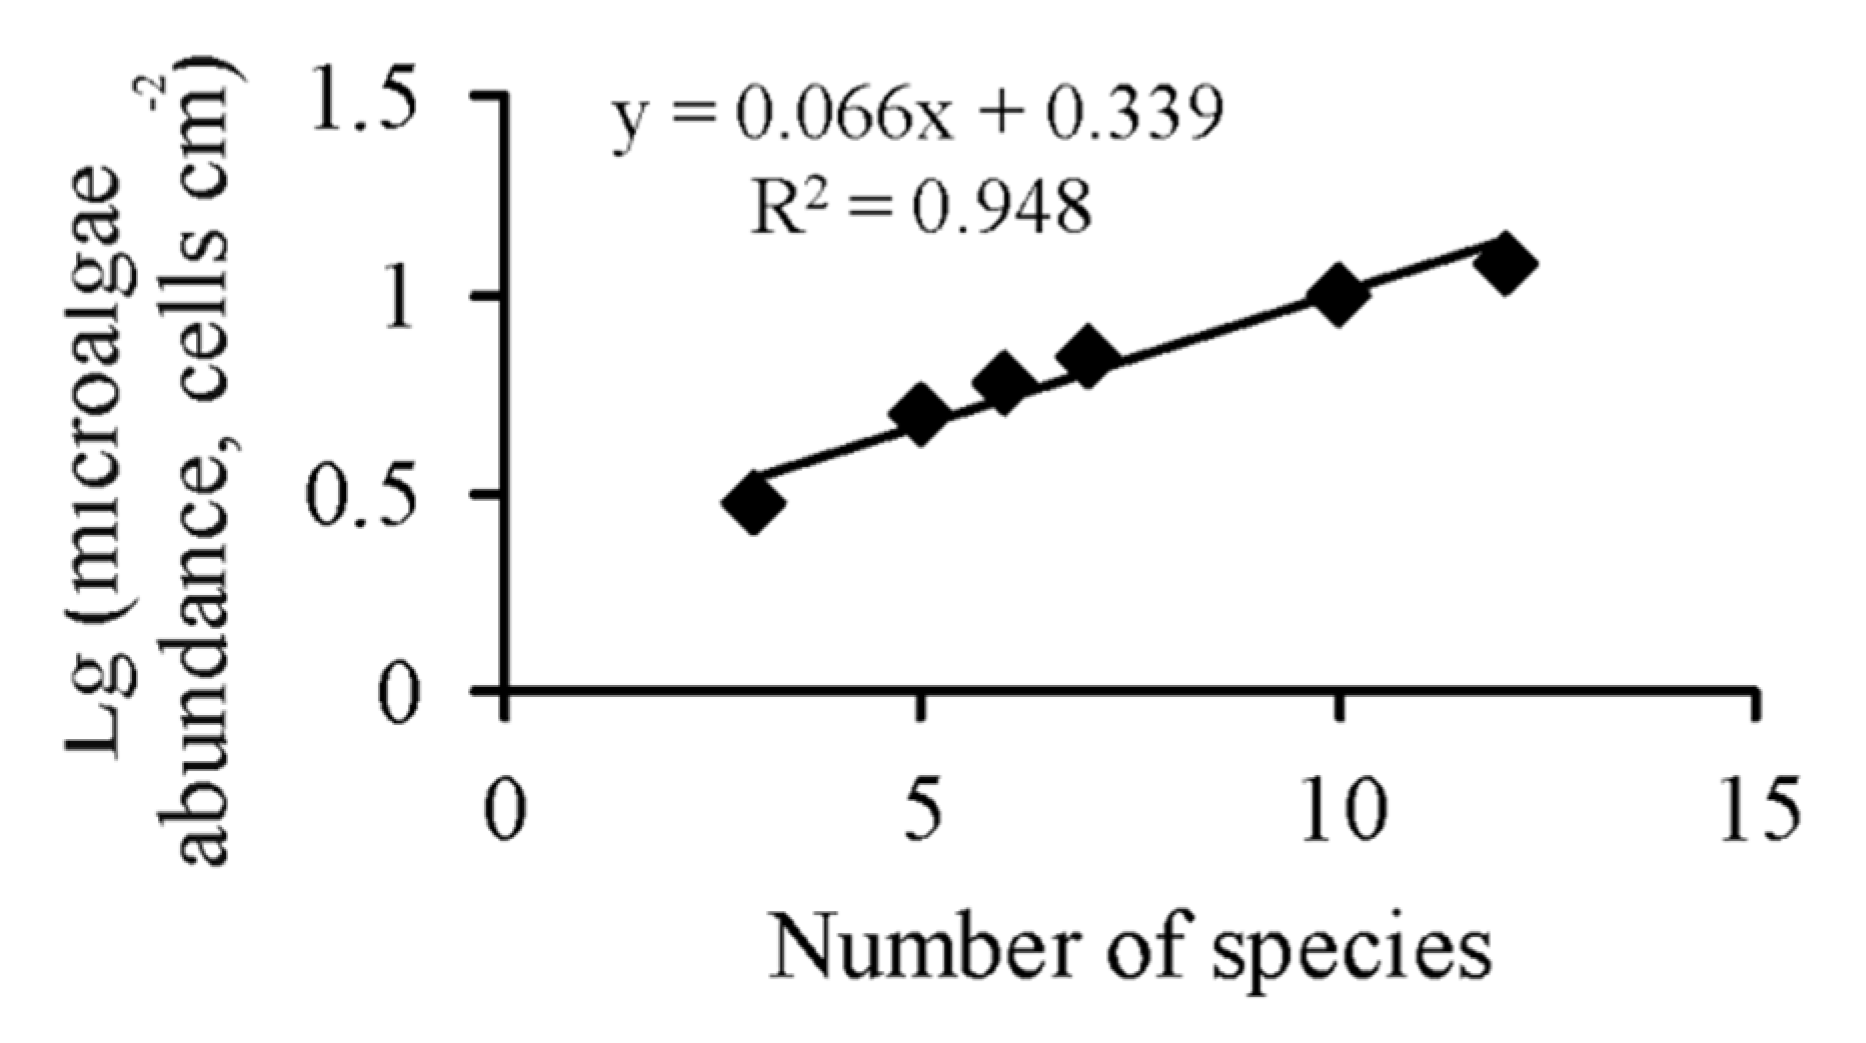
3. Results
4. Discussion
5. Conclusions
Author Contributions
Funding
Institutional Review Board Statement
Informed Consent Statement
Data Availability Statement
Acknowledgments
Conflicts of Interest
References
- Brito, A.; Newton, A.; Tett, P.; Fernandes, T.F. Temporal and spatial variability of microphytobenthos in a shallow lagoon: Ria Formosa (Portugal). Estuar. Coast. Shelf Sci. 2009, 83, 67–76. [Google Scholar] [CrossRef]
- Lake, S.J.; Brush, M.J. The contribution of microphytobenthos to total productivity in upper Narragansett Bay, Rhode Island. Estuar. Coast. Shelf Sci. 2011, 95, 289–297. [Google Scholar] [CrossRef]
- Belando, M.D.; Marin, A.; Aboal, M. Licmophora species from a Mediterranean hypersaline coastal lagoon (Mar Menor, Murcia, SE Spain). Nova Hedwig. 2012, 141, 275–288. [Google Scholar]
- Andersen, T.J.; Lund-Hansen, L.C.; Pejrup, M.; Jensen, K.T.; Mouritsen, K.N. Biologically induced differences in erodibility and aggregation of subtidal and intertidal sediments: A possible cause for seasonal changes in sediment deposition. J. Mar. Syst. 2005, 55, 123–138. [Google Scholar] [CrossRef]
- Kanaya, G.; Takagi, S.; Kikuchi, E. Dietary contribution of the microphytobenthos to infaunal deposit feeders in an estuarine mudflat in Japan. Mar. Biol. 2008, 155, 543–553. [Google Scholar] [CrossRef]
- Larson, F.; Sundbäck, K. Role of microphytobenthos in recovery of functions in a shallow-water sediment system after hypoxic events. Mar. Ecol. Prog. Ser. 2008, 357, 1–6. [Google Scholar] [CrossRef]
- Brito, A.C.; Fernandes, T.F.; Newton, A.; Facca, C.; Tett, P. Does microphytobenthos resuspension influence phytoplankton in shallow systems? A comparison through a Fourier series analysis. Estuar. Coast. Shelf Sci. 2012, 110, 77–84. [Google Scholar] [CrossRef]
- Dunn, R.J.; Welsh, D.T.; Jordan, M.A.; Waltham, N.J.; Lemckert, C.J.; Teasdale, P.R. Benthic metabolism and nitrogen dynamics in a sub-tropical coastal lagoon: Microphytobenthos stimulate nitrification and nitrate reduction through photosynthetic oxygen evolution. Estuar. Coast. Shelf Sci. 2012, 113, 272–282. [Google Scholar] [CrossRef]
- Schreiber, R.A.; Pennock, J.R. The relative contribution of benthic microalgae to total microalgal production in a shallow sub-tidal estuarine environment. Ophelia 1995, 42, 335–352. [Google Scholar] [CrossRef]
- Shadrin, N.V. Is it possible to quantitatively assess the role of algobacterial films in a water body? In Fossil and Recent Biofilms: A Natural History of Life on Earth; Krumbein, W.E., Paterson, D.M., Zavarzin, G.A., Eds.; Springer: Dordrecht, The Netherlands, 2003; pp. 353–361. [Google Scholar]
- Shadrin, N.V.; Mikhodyuk, O.S.; Naidanova, O.G.; Voloshko, L.N.; Gerasimenko, L.M. Bottom cyanobacteria of the hypersaline lakes of Crimea. In Microalgae of the Black Sea: Problems of Biodiversity Preservation and Biotechnological Use; Tokarev, Y.N., Finenko, Z.Z., Shadrin, N.V., Eds.; EKOSI-Gidrophyzika: Sevastopol, Ukraine, 2008; pp. 100–112. (In Russian) [Google Scholar]
- Senicheva, M.I.; Gubelit, Y.I.; Prazukin, A.V.; Shadrin, N.V. Phytoplankton of hypersaline lakes of Crimea. In Microalgae of the Black Sea: Problems of Biodiversity Preservation and Biotechnological Use; Tokarev, Y.N., Finenko, Z.Z., Shadrin, N.V., Eds.; EKOSI-Gidrophyzika: Sevastopol, Ukraine, 2008; pp. 93–99. (In Russian) [Google Scholar]
- Lukatelich, R.J.; McComb, A.J. Distribution and abundance of benthic microalgae in a shallow southwestern Australian estuarine system. Mar. Ecol. Prog. Ser. 1986, 27, 287–297. [Google Scholar] [CrossRef]
- Segal, R.D.; Waite, A.M.; Hamilton, D.P. Transition from planktonic to benthic algal dominance along a salinity gradient. Hydrobiologia 2006, 556, 119–135. [Google Scholar] [CrossRef]
- Asencio, A.D. Permanent salt evaporation ponds in a semi-arid Mediterranean region as model systems to study primary production processes under hypersaline conditions. Estuar. Coast. Shelf Sci. 2013, 124, 24–33. [Google Scholar] [CrossRef]
- Shadrin, N.; Anufriieva, E. Ecosystems of hypersaline waters: Structure and trophic relations. Zhurnal Obs. Biol. 2018, 79, 418–427. (In Russian) [Google Scholar]
- Siqueiros-Beltrones, D.A. Association structure of benthic diatoms in a hypersaline environment. Cienc. Mar. 1990, 16, 101–127. [Google Scholar] [CrossRef]
- Kociolek, J.P.; Herbst, D.B. Taxonomy and distribution of benthic diatoms from Mono Lake, California, U.S.A. Trans. Am. Microsc. Soc. 1992, 111, 338–355. [Google Scholar] [CrossRef]
- Wilson, S.E.; Cumming, B.F.; Smol, J.P. Diatom-salinity relationships in 111 lakes from the Interior Plateau of British Columbia, Canada: The development of diatom-based models for paleosalinity reconstructions. J. Paleolimnol. 1994, 12, 197–221. [Google Scholar] [CrossRef]
- Sylvestre, F.; Beck-Eichler, B.; Duleba, W.; Debenay, J.P. Modern benthic diatom distribution in a hypersaline coastal lagoon: The Lagoa de Araruama (RJ), Brazil. Hydrobiologia 2001, 443, 213–231. [Google Scholar] [CrossRef]
- Nevrova, E.L.; Shadrin, N.V. Benthic diatoms in Crimean saline lakes. Mar. Ecol. J. 2005, 4, 61–71. (In Russian) [Google Scholar]
- Sapozhnikov, F.V.; Ivanishcheva, P.S.; Simakova, U.V. Modern assemblage changes of benthic algae as a result of hypersalinization of the Aral Sea. J. Mar. Syst. 2009, 76, 343–358. [Google Scholar] [CrossRef]
- Schagerl, M. Soda Lakes of East. Africa; Springer Nature: Cham, Switzerland, 2016; p. 408. [Google Scholar]
- Prazukin, A.; Shadrin, N.; Balycheva, D.; Firsov, Y.; Lee, R.; Anufriieva, E. Cladophora spp. (Chlorophyta) modulate environment and create a habitat for microalgae in hypersaline waters. Eur. J. Phycol. 2020. [Google Scholar] [CrossRef]
- Shadrin, N.; Kolesnikova, E.; Revkova, T.; Latushkin, A.; Dyakov, C.; Anufriieva, E. Macrostructure of benthos along a salinity gradient: The case of Sivash Bay (the Sea of Azov), the largest hypersaline lagoon worldwide. J. Sea Res. 2019, 154, 101811. [Google Scholar] [CrossRef]
- Shadrin, N.; Kolesnikova, E.; Revkova, T.; Latushkin, A.; Chepyzhenko, A.; Drapun, I.; Dyakov, N.; Anufriieva, E. Do separated taxa react differently to a long-term salinity increase? The meiobenthos changes in Bay Sivash, largest hypersaline lagoon worldwide. Knowl. Manag. Aquat. Ecosyst. 2019, 420, 36. [Google Scholar] [CrossRef]
- Anufriieva, E.; Shadrin, N. The long-term changes in plankton composition: Is Bay Sivash transforming back into one of the world’s largest habitats of Artemia sp. (Crustacea, Anostraca)? Aquac. Res. 2020, 51, 341–350. [Google Scholar] [CrossRef]
- Bondarenko, A.V. Microalgae of the benthos of the Crimean coastal waters in the Sea of Azov. PhD Thesis, A.O. Kovalevsky Institute of Biology of the South Seas of RAS, Sevastopol, Russia, 2017; 176p. (In Russian). [Google Scholar]
- Shadrin, N.V.; Anufriieva, E.V.; Kipriyanova, L.M.; Kolesnikova, E.A.; Latushkin, A.A.; Romanov, R.E.; Sergeeva, N.G. The political decision caused the drastic ecosystem shift of the Sivash Bay (the Sea of Azov). Quat. Int. 2018, 475, 4–10. [Google Scholar] [CrossRef]
- Guiry, M.D.; Guiry, G.M. AlgaeBase. World-wide electronic publication, National University of Ireland, Galway, Ireland. 2020. Available online: http://www.algaebase.org (accessed on 13 May 2020).
- Oksiyuk, O.P.; Yurchenko, V.V. About the weight of diatoms. Hydrobiol. J. 1971, 7, 116–119. (In Russian) [Google Scholar]
- Bryantseva, J.V.; Lyakh, A.M.; Sergeeva, A.V. Calculation of Volumes and Surface Areas of the Black Sea Unicellular Algae; Publishing House of the Institute of Biology of the South Seas: Sevastopol, Ukraine, 2005; p. 25. (In Russian) [Google Scholar]
- Müller, P.H.; Neuman, P.; Storm, R. Tafeln der Mathematischen Statistik; VEB Fachbuchverlag: Leipzig, Germany, 1979; p. 272. [Google Scholar]
- Thode, H.C. Testing for Normality; Marcel Dekker Inc.: New York, NY, USA, 2002; 271p. [Google Scholar]
- Semkin, B.I. On the relation between mean values of two measures of inclusion and measures of similarity. Bull. Bot. Gard. Inst. Far East. Branch Ras 2009, 3, 91–101. (In Russian) [Google Scholar]
- Barinova, S.; Bondarenko, A.; Ryabushko, L.; Kapranov, S. Microphytobenthos as an indicator of water quality and organic pollution in the western coastal zone of the Sea of Azov. Oceanol. Hydrobiol. Stud. 2019, 48, 125–139. [Google Scholar] [CrossRef]
- Anufriieva, E.V.; Shadrin, N.V.; Shadrina, S.N. History of research on biodiversity in Crimean hypersaline waters. Arid Ecosyst. 2017, 7, 52–58. [Google Scholar] [CrossRef]
- Ryabushko, L.I. Microphytobenthos of the Black Sea; ECOSI- Gidrophyzika: Sevastopol, Russia, 2013; 416p. (In Russian) [Google Scholar]
- Sapozhnikov, P.V.; Kalinina, O.Y. Main Results of Observations of Changes in Bottom Biota and Ichthyofauna of the Large Aral Sea in the Period 2002–2017. Hydrosphere Ecol. 2018, 1. Available online: http://hydrosphere-ecology.ru/109 (accessed on 30 May 2021). (In Russian).
- Siqueiros-Beltrones, D.A.; Morzaria-Luna, H. New records of marine benthic diatom species for the Northwestern Mexican region. Oceanides 1999, 14, 89–95. [Google Scholar]
- Blinn, D.; Halse, S.; Pinder, A.; Shiel, R. Diatom and micro-invertebrate communities and environmental determinants in the western Australian wheatbelt: A response to salinization. Hydrobiologia 2004, 528, 229–248. [Google Scholar] [CrossRef]
- Taukulis, F.E.; John, J. Development of a diatom-based transfer function for lakes and streams severely impacted by secondary salinity in the south-west region of Western Australia. Hydrobiologia 2009, 626, 129–143. [Google Scholar] [CrossRef]
- Gasse, F.; Juggins, S.; Khelifa, L.B. Diatom-based transfer functions for inferring past hydrochemical characteristics of African lakes. Palaeogeogr. Palaeoclimatol. Palaeoecol. 1995, 117, 31–54. [Google Scholar] [CrossRef]
- Bate, G.; Smailes, P. The response of the diatom flora of St Lucia Lake and estuary, South Africa, to a severe drought. Afr. J. Aquat. Sci. 2008, 33, 1–15. [Google Scholar] [CrossRef]
- Gerasimiuk, V.P. Microalgae of the north-western Black Sea coast estuaries. Int. J. Algae 2018, 20, 109–120. [Google Scholar] [CrossRef]
- Dor, I.; Ehruch, A. The effect of salinity and temperature gradients on the distribution of littoral microalgae in experimental solar ponds, Dead Sea area, Israel. Mar. Ecol. 1987, 8, 193–205. [Google Scholar] [CrossRef]
- Clavero, E.; Hernández-Mariné, M.; Grimalt, J.O.; Garcia-Pichel, F. Salinity tolerance of diatoms from thalassic hypersaline environments. J. Phycol. 2000, 36, 1021–1034. [Google Scholar] [CrossRef]
- Dolapsakis, N.P.; Tafas, T.; Abatzopoulos, T.J.; Ziller, S.; Economou-Amilli, A. Abundance and growth response of microalgae at Megalon Embolon solar saltworks in northern Greece: An aquaculture prospect. J. Appl. Phycol. 2005, 17, 39–49. [Google Scholar] [CrossRef]
- Häusler, S.; Weber, M.; de Beer, D.; Ionescu, D. Spatial distribution of diatom and cyanobacterial mats in the Dead Sea is determined by response to rapid salinity fluctuations. Extremophiles 2014, 18, 1085–1094. [Google Scholar] [CrossRef] [PubMed]
- Abdullahi, A.S.; Underwood, G.J.; Gretz, M.R. Extracellular matrix assembly in diatoms (Bacillariophyceae). V. Environmental effects on polysaccharide synthesis in the model diatom, Phaeodactylum tricornutum. J. Phycol. 2006, 42, 363–378. [Google Scholar] [CrossRef]
- Steele, D.J.; Franklin, D.J.; Underwood, G.J. Protection of cells from salinity stress by extracellular polymeric substances in diatom biofilms. Biofouling 2014, 30, 987–998. [Google Scholar] [CrossRef]
- Abdel-Karim, M.S.; Ali, M.H.; Sayed, M.F. Spatial and temporal distribution of micro benthic algae in hyper saline Mediterranean Lagoon (Bardawil Lagoon, Egypt), multivariate analysis approach. Egypt. J. Aquat. Res. 2006, 32, 271–291. [Google Scholar]
- Blasutto, O.; Cibic, T.; De Vittor, C.; Umani, S.F. Microphytobenthic primary production and sedimentary carbohydrates along salinity gradients in the lagoons of Grado and Marano (Northern Adriatic Sea). Hydrobiologia 2005, 550, 47–55. [Google Scholar] [CrossRef]
- Christensen, N.L. Succession and natural disturbance: Paradigms, problems, and preservation of natural ecosystems. In Ecosystem Management for Parks and Wilderness; Agee, J.K., Johnson, D.R., Eds.; University of Washington Press, Institute of Forest Resources Contribution: Seattle, WA, USA, 1988; No. 65; pp. 62–86. [Google Scholar]
- Janousek, C.N.; Currin, C.A.; Levin, L.A. Succession of microphytobenthos in a restored coastal wetland. Estuaries Coasts 2007, 30, 265–276. [Google Scholar] [CrossRef]
- Pennesi, C.; Danovaro, R. Assessing marine environmental status through microphytobenthos assemblages colonizing the Autonomous Reef Monitoring Structures (ARMS) and their potential in coastal marine restoration. Mar. Pollut. Bull. 2017, 125, 56–65. [Google Scholar] [CrossRef]


| Station | Coordinates | May, 2018 | November, 2018 | June, 2019 | ||||||
|---|---|---|---|---|---|---|---|---|---|---|
| S, psu | TSS, mg L−1 | DOM, mg L−1 | S, psu | TSS, mg L−1 | DOM, mg L−1 | S, psu | TSS, mg L−1 | DOM, mg L−1 | ||
| 1 | 45°45′37.0″ N 34°57′57.0″ E | – | – | – | – | – | – | 70 | 3.72 | 3.40 |
| 2 | 45°37′9.0″ N 35°04′40.0″ E | – | – | – | 86 | 6.98 | 4.45 | 68 | 9.80 | 3.77 |
| 3 | 45°31′13.7″ N 35°11′12.9″ E | 76 | 16.95 | 4.16 | 90 | 1.88 | 3.76 | 84 | 26.66 | 13.32 |
| 4 | 45°29′04.7″ N 35°13′27.9″ E | 77 | 16.59 | 3.97 | 90 | 1.03 | 3.44 | 84 | 24.55 | 14.65 |
| 5 | 45°27′19.5″ N 35°13′27.9″ E | 77 | 23.15 | 3.68 | 82 | 4.56 | 4.36 | 86 | 28.46 | 15.35 |
| 6 | 45°24′43.5″ N 35°17′33.8″ E | 77 | 24.20 | 3.73 | 100 | 6.85 | 4.35 | 84 | 21.11 | 13.75 |
| 7 | 45°23′04.7″ N 35°19′44.6″ E | 77 | 20.81 | 4.09 | 89 | 6.47 | 4.31 | 84 | 15.95 | 12.85 |
| 8 | 45°17′14.3″ N 35°28′01.2″ E | 82 | 12.20 | 3.80 | 87 | 12.38 | 7.98 | 100 | 8.69 | 7.14 |
| 9 | 45°19′05.5″ N 35°14′59.8″ E | 75 | 18.56 | 4.12 | 92 | 70.16 | 42.14 | – | – | – |
| 10 | 45°21′04.2″ N 35°06′06.5″ E | 75 | 24.76 | 4.13 | 90 | 29.27 | 21.56 | 88 | 14.92 | 7.36 |
| 11 | 45°37′48.3″ N 35°01′54.8″ E | 56 | 5.64 | 3.21 | 63 | 3.55 | 3.76 | 70 | 14.32 | 6.46 |
| 12 | 45°40′48.8″ N 34°54′55.2″ E | 52 | 3.50 | 2.93 | 56 | 3.44 | 3.47 | 66 | 7.73 | 3.41 |
| 13 | 45°44′00.8″ N 34°48′10.3″ E | 39 | 5.53 | 2.90 | 42 | 23.83 | 11.92 | 54 | 4.83 | 3.36 |
| 14 | 45°52′38.8″ N 34°44′33.3″ E | 36 | 3.11 | 3.01 | 38 | 1.31 | 2.97 | 50 | 2.45 | 3.56 |
| 15 | 45°52′42.6″ N 34°42′09.0″ E | 30 | 2.37 | 2.66 | 30 | 24.02 | 11.84 | 35 | 9.87 | 2.98 |
| Species | Salinity Range for a Species, Psu | Frequency of Occurrence, % | Found Before | |||||
|---|---|---|---|---|---|---|---|---|
| May and June 2018 | November 2018 | June 2019 | ||||||
| Bottom | Mat | Bottom | Bottom | The Sea of Azov | Eastern Sivash Before 2014 | Crimean Hypersaline Lakes | ||
| Ochrophyta | ||||||||
| Achnanthes adnata Bory, 1822 | 52–92 | 67 | 100 | 78 | 56 | [28] | [28] | [21,24] |
| Amphitetras antediluviana Ehrenberg, 1840 | 88–90 | 0 | 0 | 11 | 11 | – | – | – |
| Amphora macilenta var. maeotica Proshkina-Lavrenko, 1963 | 87 | 0 | 0 | 11 | 0 | – | – | – |
| Amphora ovalis (Kützing) Kützing, 1844 | 100 | 0 | 0 | 0 | 11 | [28] | – | [21] |
| Amphora sp. | 77 | 17 | 17 | 0 | 0 | – | – | – |
| Ardissonea crystallina (C. Agardh) Grunow, 1880 | 66–92 | 0 | 0 | 11 | 11 | [28] | [28] | [21,24] |
| Campylodiscus neofastuosus Ruck and Nakov in Ruck et al., 2016 | 38–90 | 8 | 0 | 44 | 22 | – | – | [21] |
| Cocconeis kujalnitzkensis Gusliakov and Gerasimiuk, 1992 | 52–100 | 67 | 100 | 44 | 67 | – | – | [21] |
| Cocconeis placentula Ehrenberg, 1838 | 66–88 | 0 | 0 | 0 | 22 | [28] | – | [24] |
| Cocconeis scutellum Ehrenberg, 1838 | 35–70 | 0 | 0 | 0 | 44 | [28] | [28] | [21,24] |
| Coronia daemeliana (Grunow) Ruck and Guiry, 2016 | 52–70 | 8 | 0 | 0 | 11 | – | – | – |
| Diploneis bombus (Ehrenberg) Ehrenberg, 1894 | 52 | 8 | 0 | 0 | 0 | [28] | – | [21] |
| Grammatophora marina (Lyngbye) Kützing, 1844 | 54–88 | 8 | 0 | 0 | 22 | [28] | [28] | [21] |
| Gyrosigma balticum (Ehrenberg) Rabenhorst, 1853 | 35 | 0 | 0 | 0 | 11 | [28] | [28] | – |
| Gyrosigma fasciola (Ehrenberg) J.W.Griffith and Henfrey, 1856 | 56 | 8 | 0 | 0 | 0 | – | – | – |
| Halamphora coffeiformis (C.A. Agardh) Levkov, 2009 | 52–100 | 50 | 67 | 11 | 56 | [28] | [28] | [21,24] |
| Lyrella lyroides (Hendey) D.G. Mann, 1990 | 88 | 8 | 0 | 11 | – | – | – | |
| Mastogloia braunii Grunow, 1863 | 56–84 | 8 | 0 | 11 | 11 | [28] | – | [21,24] |
| Navicula menisculus Schumann, 1867 | 52–86 | 8 | 33 | 0 | 11 | [28] | – | [21,24] |
| Navicula sp. 1 | 52–100 | 58 | 100 | 0 | 33 | – | – | – |
| Navicula sp. 2 | 88 | 8 | 0 | 0 | 0 | – | – | – |
| Nitzschia hybrida var. hyalina Proschkina-Lavrenko, 1963 | 52–88 | 17 | 17 | 0 | 11 | [28] | – | [21,24] |
| Nitzschia sigma (Kützing) W. Smith, 1853 | 84 | 0 | 0 | 0 | 11 | [28] | [28] | [21,24] |
| Nitzschia tenuirostris Mereschkowsky, 1902 | 54–77 | 8 | 33 | 0 | 22 | [28] | – | [24] |
| Nitzschia sp. | 52–76 | 8 | 17 | 0 | 22 | – | – | – |
| Odontella aurita (Lyngbye) C.Agardh, 1832 | 88 | 0 | 0 | 0 | 11 | [28] | [28] | – |
| Parlibellus delognei (Van Heurck) E.J. Cox, 1988 | 54–100 | 0 | 0 | 0 | 22 | [28] | – | [24] |
| Pleurosigma elongatum W. Smith, 1852 | 35–75 | 17 | 0 | 0 | 11 | [28] | [28] | [24] |
| Rhabdonema adriaticum Kützing, 1844 | 75 | 8 | 0 | 0 | 0 | [28] | – | – |
| Rhopalodia musculus (Kützing) O.F. Müller, 1899 | 92 | 0 | 0 | 11 | 0 | [28] | [28] | [21] |
| Surirella striatula Turpin, 1828 | 88 | 0 | 0 | 0 | 11 | [28] | – | [21] |
| Tabularia tabulata (Agardh) Snoeijs, 1992 | 66–86 | 83 | 100 | 0 | 22 | [28] | [28] | [21] |
| Toxarium undulatum J.W. Bailey, 1854 | 92 | 0 | 0 | 11 | 0 | [28] | – | [21] |
| Tryblionella apiculata Gregory, 1857 | 52 | 8 | 0 | 0 | 0 | – | [28] | [21] |
| Total Diatoms | – | 21 | 10 | 10 | 25 | 22 | 12 | 26 |
| Haptophyta | ||||||||
| Calcidiscus leptoporus (G.Murray and V.H.Blackman) Loeblich Jr. and Tappan, 1978 | 70 | 0 | 0 | 0 | 11 | – | – | [24] |
| Oolithotus fragilis (Lohmann) Martini and C.Müller, 1972 | 52 | 8 | 17 | 0 | – | – | – | – |
| Miozoa | ||||||||
| Prorocentrum balticum (Lohmann) Loeblich III, 1970 | 69–84 | 17 | 0 | 11 | 0 | – | – | [24] |
| Cyanobacteria | ||||||||
| Oscillatoria limosa C.Agardh ex Gomont, 1892 | 54 | – | – | 0 | 11 | – | – | [11] |
| Oscillatoria tenuis C.Agardh ex Gomont, 1892 | 38–70 | – | – | 11 | 11 | – | – | – |
| Total number of species | – | 23 | 11 | 13 | 29 | 22 | 12 | 27 |
| Index | Compared Pairs | |||
|---|---|---|---|---|
| Critical Value | May–June 2018 vs. June 2019 | May–June 2018 vs. November 2018 | November 2018 vs. June 2019 | |
| Jaccard | 0.42 | 0.32 | 0.15 | 0.29 |
| Czekanowski–Sørensen–Dice | 0.59 | 0.48 | 0.26 | 0.45 |
| Characteristics | May 2018 | June 2018 | November 2018 | June 2019 | ||
|---|---|---|---|---|---|---|
| Bottom | Mat | Bottom | Bottom | Bottom | ||
| Abundance, cells ×105 cm−2 | Average | 0.67 | 1.30 | 0.6 | 111.1 | 8.95 |
| min | 0.45 | 0.07 | 0.05 | 0.8 | 0.02 | |
| max | 0.80 | 6.59 | 0.84 | 405.3 | 99.84 | |
| CV | 0.286 | 2.000 | 0.642 | 1.405 | 2.025 | |
| Biomass, mg cm−2 | Average | 0.06 | 0.143 | 0.13 | 6.57 | 0.26 |
| min | 0.009 | 0.038 | 0.01 | 0.002 | 0.004 | |
| max | 0.14 | 0.400 | 0.20 | 39.25 | 0.96 | |
| CV | 1.286 | 0.973 | 0.651 | 2.070 | 1.133 | |
| Average cell mass in a sample, µg | Average | 7.5 × 10⁻⁷ | 5.2 × 10⁻⁶ | 2.3 × 10⁻⁶ | 1.5 × 10⁻⁷ | 5.03 × 10⁻⁵ |
| min | 2.0 × 10⁻⁷ | 6.1 × 10⁻⁷ | 1.8 × 10⁻⁶ | 2.2 × 10⁻⁹ | 7.3 × 10⁻⁸ | |
| max | 1.7 × 10⁻⁶ | 1.3 × 10⁻⁵ | 3.1 × 10⁻⁶ | 5.3 × 10⁻⁷ | 3.3 ×10⁻⁴ | |
| CV | 1.276 | 0.844 | 0.231 | 1.406 | 2.195 | |
| Species | Average Contribution, % | Minimal Contribution, % | Maximal Contribution, % | CV of Contribution | How Many Times Dominated |
|---|---|---|---|---|---|
| May–June 2018, Bottom | |||||
| Achnanthes adnata | 9 | 0 | 28 | 1.300 | 0 |
| Cocconeis kujalnitzkensis | 8 | 0 | 23 | 1.265 | 0 |
| Grammatophora marina | 13 | 0 | 80 | 2.449 | 1 |
| Halamphora coffeiformis | 18 | 0 | 86 | 1.937 | 1 |
| Mastogloia braunii | 2 | 0 | 11 | 2.449 | 0 |
| Navicula menisculus | 6 | 0 | 21 | 1.590 | 0 |
| Navicula sp.1 | 27 | 0 | 62 | 0.767 | 3 |
| Prorocenrum balticum | 3 | 0 | 12 | 1.728 | 0 |
| Tabularia tabulata | 12 | 0 | 42 | 1.210 | 1 |
| May–June 2018, Floating Green Algae Mat | |||||
| Achnanthes adnata | 20 | 4 | 50 | 0.919 | 1 |
| Cocconeis kujalnitzkensis | 18 | 4 | 33 | 0.639 | 0 |
| Halamphora coffeiformis | 5 | 0 | 7 | 1.425 | 0 |
| Navicula sp.1 | 6 | 1 | 16 | 0.928 | 0 |
| Tabularia tabulata | 58 | 30 | 83 | 0.402 | 5 |
| November 2018, Bottom | |||||
| Achnanthes adnata | 34 | 0 | 100 | 1.244 | 3 |
| Amphitetras antediluviana | 2 | 0 | 20 | 2.980 | 0 |
| Ardessonea crystallina | 4 | 0 | 33 | 3.000 | 1 |
| Campylodiscus neofastuosus | 11 | 0 | 100 | 3.000 | 1 |
| Cocconeis kujalnitzkensis | 16 | 0 | 60 | 1.477 | 1 |
| Halamphora coffeiformis | 5 | 0 | 41 | 3.000 | 1 |
| Mastogloia braunii | 6 | 0 | 56 | 3.000 | 1 |
| Oscillatoria tenuis | 11 | 0 | 98 | 3.000 | 1 |
| Prorocentrum balticum | 9 | 0 | 79 | 3.000 | 1 |
| Rhopalodia musculus | 4 | 0 | 33 | 3.000 | 1 |
| Toxarium undulatuum | 2 | 0 | 17 | 3.000 | 0 |
| June 2019, Bottom | |||||
| Achnanthes adnata | 4 | 0 | 14 | 1.453 | 0 |
| Amphitetras antediluviana | 9 | 0 | 79 | 3.000 | 1 |
| Cocconeis kujalnitzkensis | 12 | 0 | 27 | 0.907 | 0 |
| Cocconeis placentula | 11 | 0 | 90 | 2.821 | 1 |
| Cocconeis scutellum | 10 | 0 | 65 | 2.106 | 1 |
| Grammatophora marina | 1 | 0 | 10 | 2.435 | 0 |
| Gyrosigma balticum | 6 | 0 | 50 | 3.000 | 1 |
| Halamphora coffeiformis | 17 | 0 | 67 | 1.658 | 2 |
| Mastogloia braunii | 2 | 0 | 14 | 3.000 | 0 |
| Navicula menisculus | 3 | 0 | 30 | 3.000 | 0 |
| Navicula sp. | 4 | 0 | 29 | 2.476 | 0 |
| Nitzschia sigma | 5 | 0 | 43 | 3.000 | 1 |
| Nitzschia tenuirostris | 1 | 0 | 10 | 2.859 | 0 |
| Nitzschia sp. | 3 | 0 | 14 | 2.016 | 0 |
| Oscillatoria limosa | 5 | 0 | 48 | 3.000 | 1 |
| Parlibellus delognei | 1 | 0 | 10 | 2.537 | 0 |
| Pleurosigma elongatum | 3 | 0 | 25 | 3.000 | 0 |
| Surirella fastuosa | 1 | 0 | 13 | 3.000 | 0 |
| Tabularia tabulata | 4 | 0 | 34 | 2.722 | 1 |
| Species | Cell Sizes | |||||||
|---|---|---|---|---|---|---|---|---|
| May–June 2018 | November 2018 | June 2019 | ||||||
| Bottom | Mat | Bottom | Bottom | |||||
| L, µm | H, µm | L, µm | H, µm | L, µm | H, µm | L, µm | H, µm | |
| Ochrophyta | ||||||||
| Achnanthes adnata | 52.5 | 17.5 | 57.9 | 23.3 | 61.1 | 18.0 | 42.0 | 20.3 |
| Amphitetras antediluviana | – | – | – | – | 94.0 | 76.0 | 81.0 | 75.0 |
| Amphora macilenta var. maeotica | – | – | – | – | 34.0 | 13.0 | – | – |
| Amphora ovalis | – | – | – | – | – | – | 31.0 | 13.0 |
| Amphora sp. | – | 35.0 | 15.0 | |||||
| Ardissonea crystallina | – | – | – | – | 76.0 | 6.0 | 67.0 | 7.0 |
| Campylodiscus neofastuosus | – | – | – | – | 93.0 | 76.0 | 97.0 | 83.0 |
| Cocconeis kujalnitzkensis | 13.8 | 10.6 | 16.8 | 12.1 | 14.3 | 8.3 | 12.8 | 6.7 |
| Cocconeis scutellum | – | – | – | – | – | – | 21.0 | 13.5 |
| Cocconeis placentula | – | – | – | – | – | – | 22.8 | 14.0 |
| Grammatophora marina | 62.5 | 15.0 | – | – | – | – | 33.0 | 14.5 |
| Gyrosigma balticum | – | – | – | – | – | – | 342.0 | 32.0 |
| Halamphora coffeiformis | 31.7 | 12.5 | 22.5 | 10.6 | 24.0 | 13.0 | 25.9 | 13.0 |
| Mastogloia braunii | 30.0 | 7.5 | – | – | 41.0 | 14.0 | – | – |
| Navicula menisculus | 20.0 | 5.0 | 25.0 | 4.4 | – | – | 18.0 | 3.0 |
| Navicula sp. 1 | 11.8 | 2.7 | 12.5 | 2.7 | – | – | 12.0 | 3.0 |
| Navicula sp. 2 | 10.0 | 2.5 | – | – | – | – | – | – |
| Nitzschia hybrida var. hyalina | 25.0 | 5.0 | 20.0 | 5.0 | – | – | 36.0 | 13.0 |
| Nitzschia sigma | – | – | – | – | – | – | 72.0 | 3.0 |
| Nitzschia tenuirostris | 29.5 | 2.5 | 22.5 | 2.0 | – | – | 20.5 | 3.0 |
| Nitzschia sp. | 50.0 | 2.5 | – | – | 52.0 | 3.5 | ||
| Odontella aurita | – | – | – | – | – | – | 56.0 | 40.0 |
| Parlibellus delognei | – | – | – | – | – | – | 26.5 | 6.0 |
| Pleurosigma elongatum | – | – | – | – | – | – | 319.0 | 34.0 |
| Rhopalodia musculus | – | – | – | – | 34.0 | 31.0 | – | – |
| Surirella fastuosa | – | – | – | – | 106.0 | 84.0 | – | – |
| Tabularia tabulata | 50.3 | 4.0 | 55.0 | 4.1 | – | – | 59.0 | 5.5 |
| Toxarium undulatum | – | – | – | – | 583.0 | 67.0 | – | – |
| Haptophyta | ||||||||
| Oolithotus fragilis | 15.0 | 15.0 | – | – | – | – | – | – |
| Miozoa | ||||||||
| Prorocenrum balticum | 12.5 | 8.8 | – | – | 15.0 | 13.0 | – | – |
| Cyanobacteria | ||||||||
| Oscillatoria limosa | – | – | – | – | – | – | 22.5 | 4.5 |
| Oscillatoria tenuis | – | – | – | – | 11.0 | 5.0 | – | – |
Publisher’s Note: MDPI stays neutral with regard to jurisdictional claims in published maps and institutional affiliations. |
© 2021 by the authors. Licensee MDPI, Basel, Switzerland. This article is an open access article distributed under the terms and conditions of the Creative Commons Attribution (CC BY) license (https://creativecommons.org/licenses/by/4.0/).
Share and Cite
Shadrin, N.; Balycheva, D.; Anufriieva, E. Microphytobenthos in the Hypersaline Water Bodies, the Case of Bay Sivash (Crimea): Is Salinity the Main Determinant of Species Composition? Water 2021, 13, 1542. https://doi.org/10.3390/w13111542
Shadrin N, Balycheva D, Anufriieva E. Microphytobenthos in the Hypersaline Water Bodies, the Case of Bay Sivash (Crimea): Is Salinity the Main Determinant of Species Composition? Water. 2021; 13(11):1542. https://doi.org/10.3390/w13111542
Chicago/Turabian StyleShadrin, Nickolai, Daria Balycheva, and Elena Anufriieva. 2021. "Microphytobenthos in the Hypersaline Water Bodies, the Case of Bay Sivash (Crimea): Is Salinity the Main Determinant of Species Composition?" Water 13, no. 11: 1542. https://doi.org/10.3390/w13111542
APA StyleShadrin, N., Balycheva, D., & Anufriieva, E. (2021). Microphytobenthos in the Hypersaline Water Bodies, the Case of Bay Sivash (Crimea): Is Salinity the Main Determinant of Species Composition? Water, 13(11), 1542. https://doi.org/10.3390/w13111542