
Removal of Fluorides from Aqueous Solutions Using Exhausted Coffee Grounds and Iron Sludge

Abstract
1. Introduction
2. Materials and Methods
2.1. Materials
2.2. Fluoride Removal Procedure
2.3. Analytical Methods
2.4. Statistical Methods
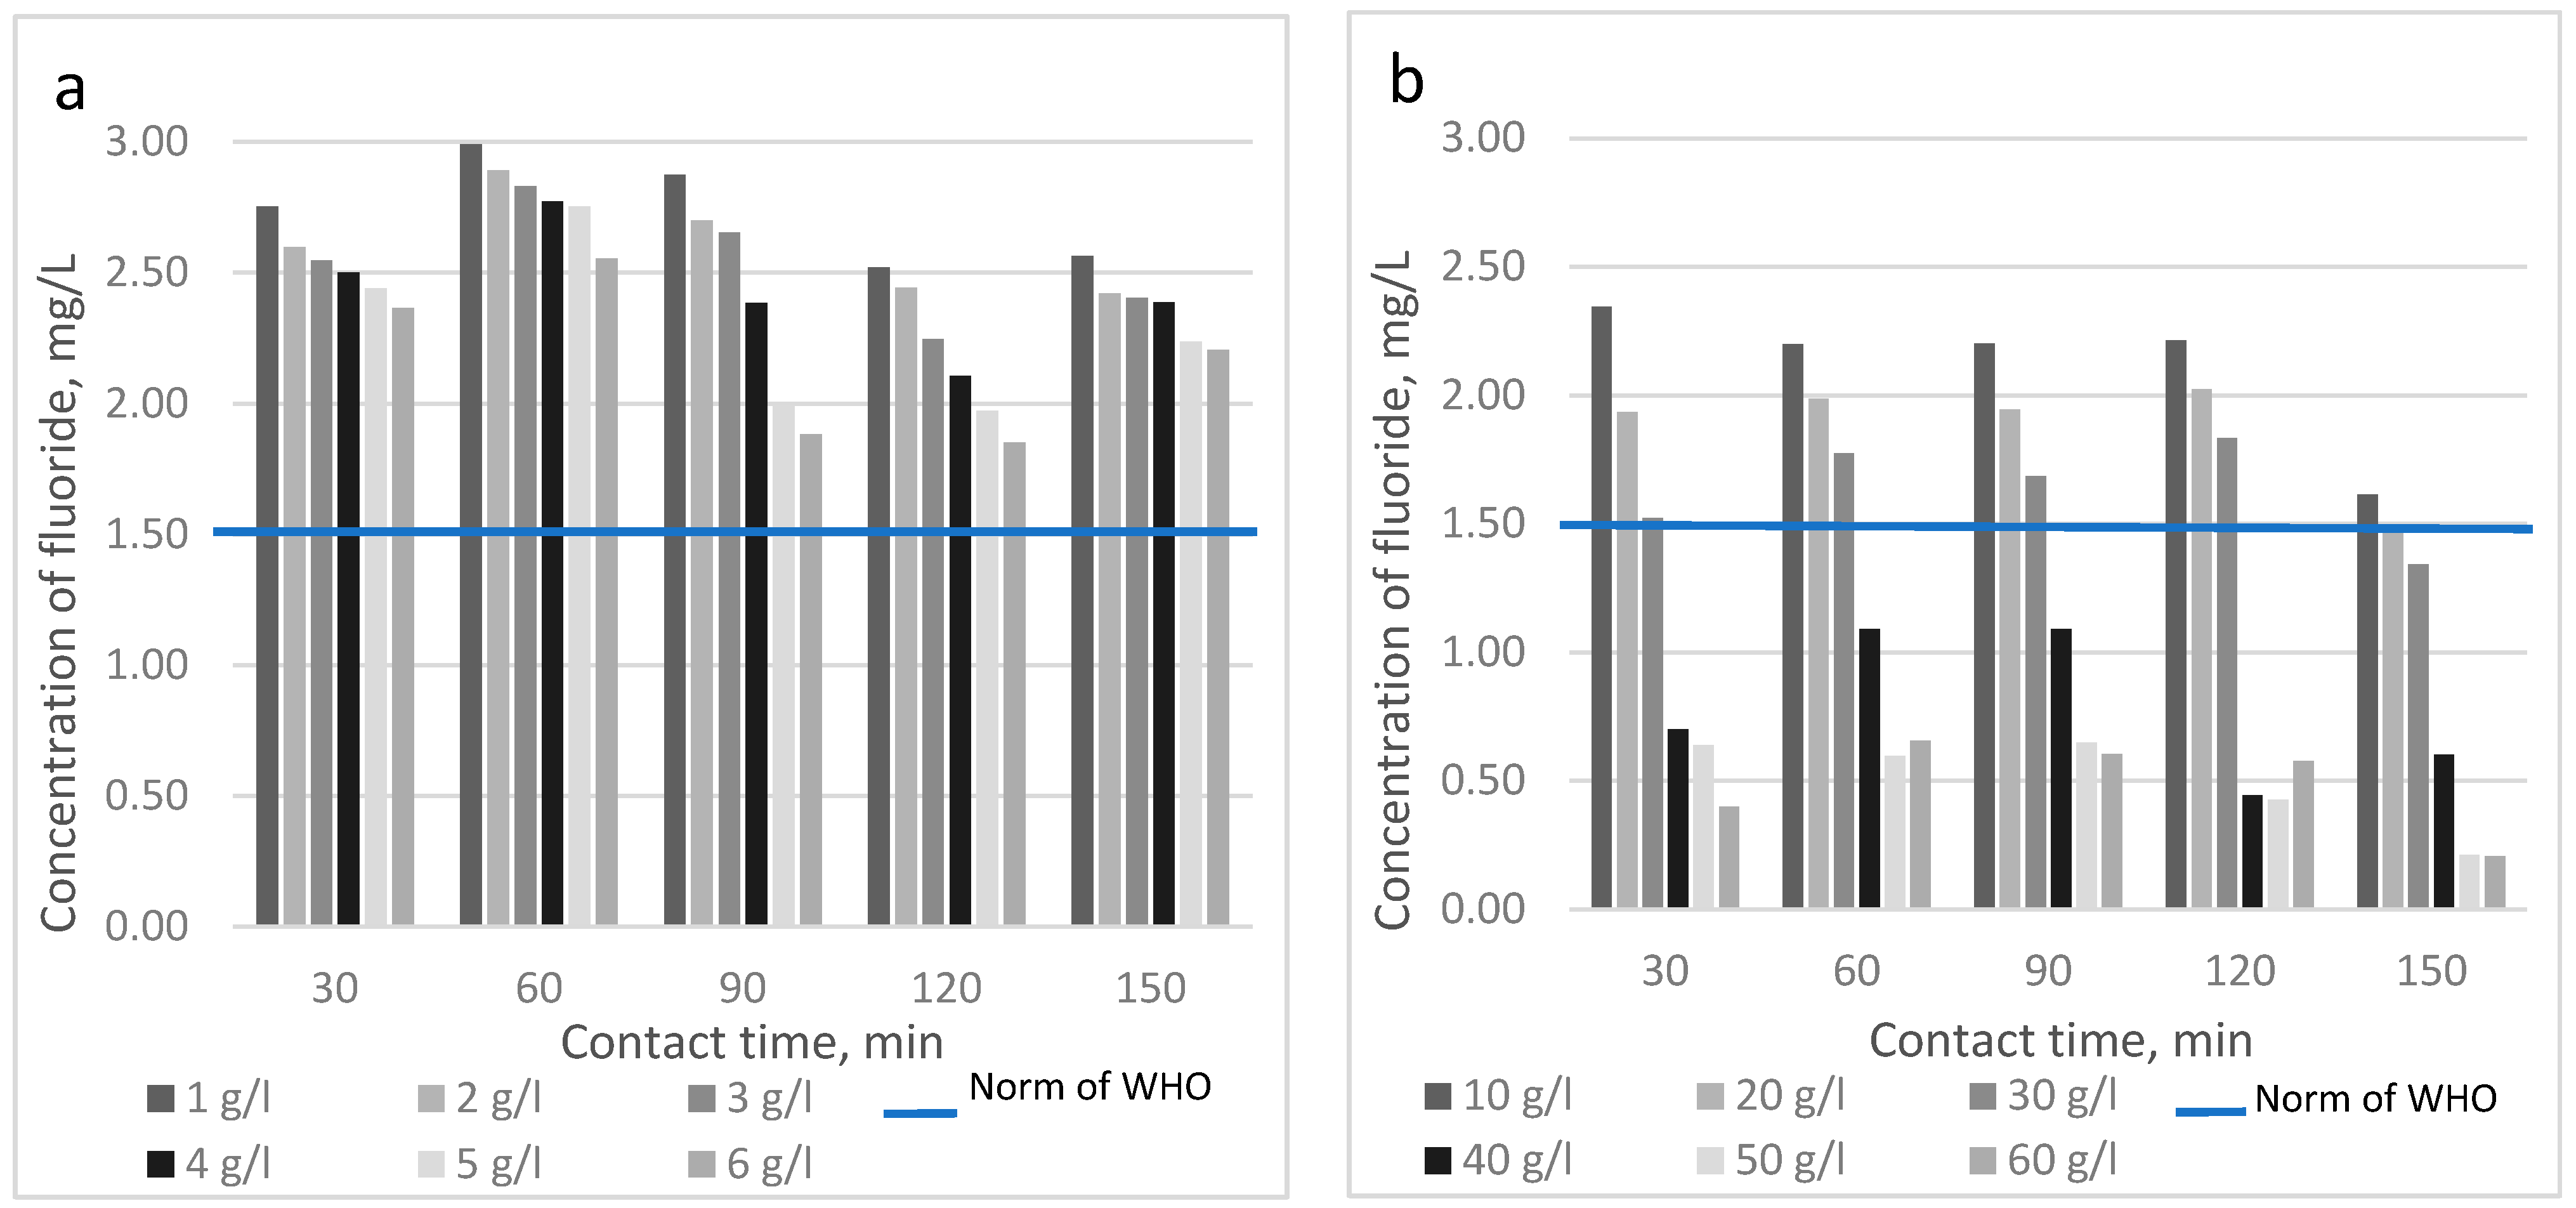
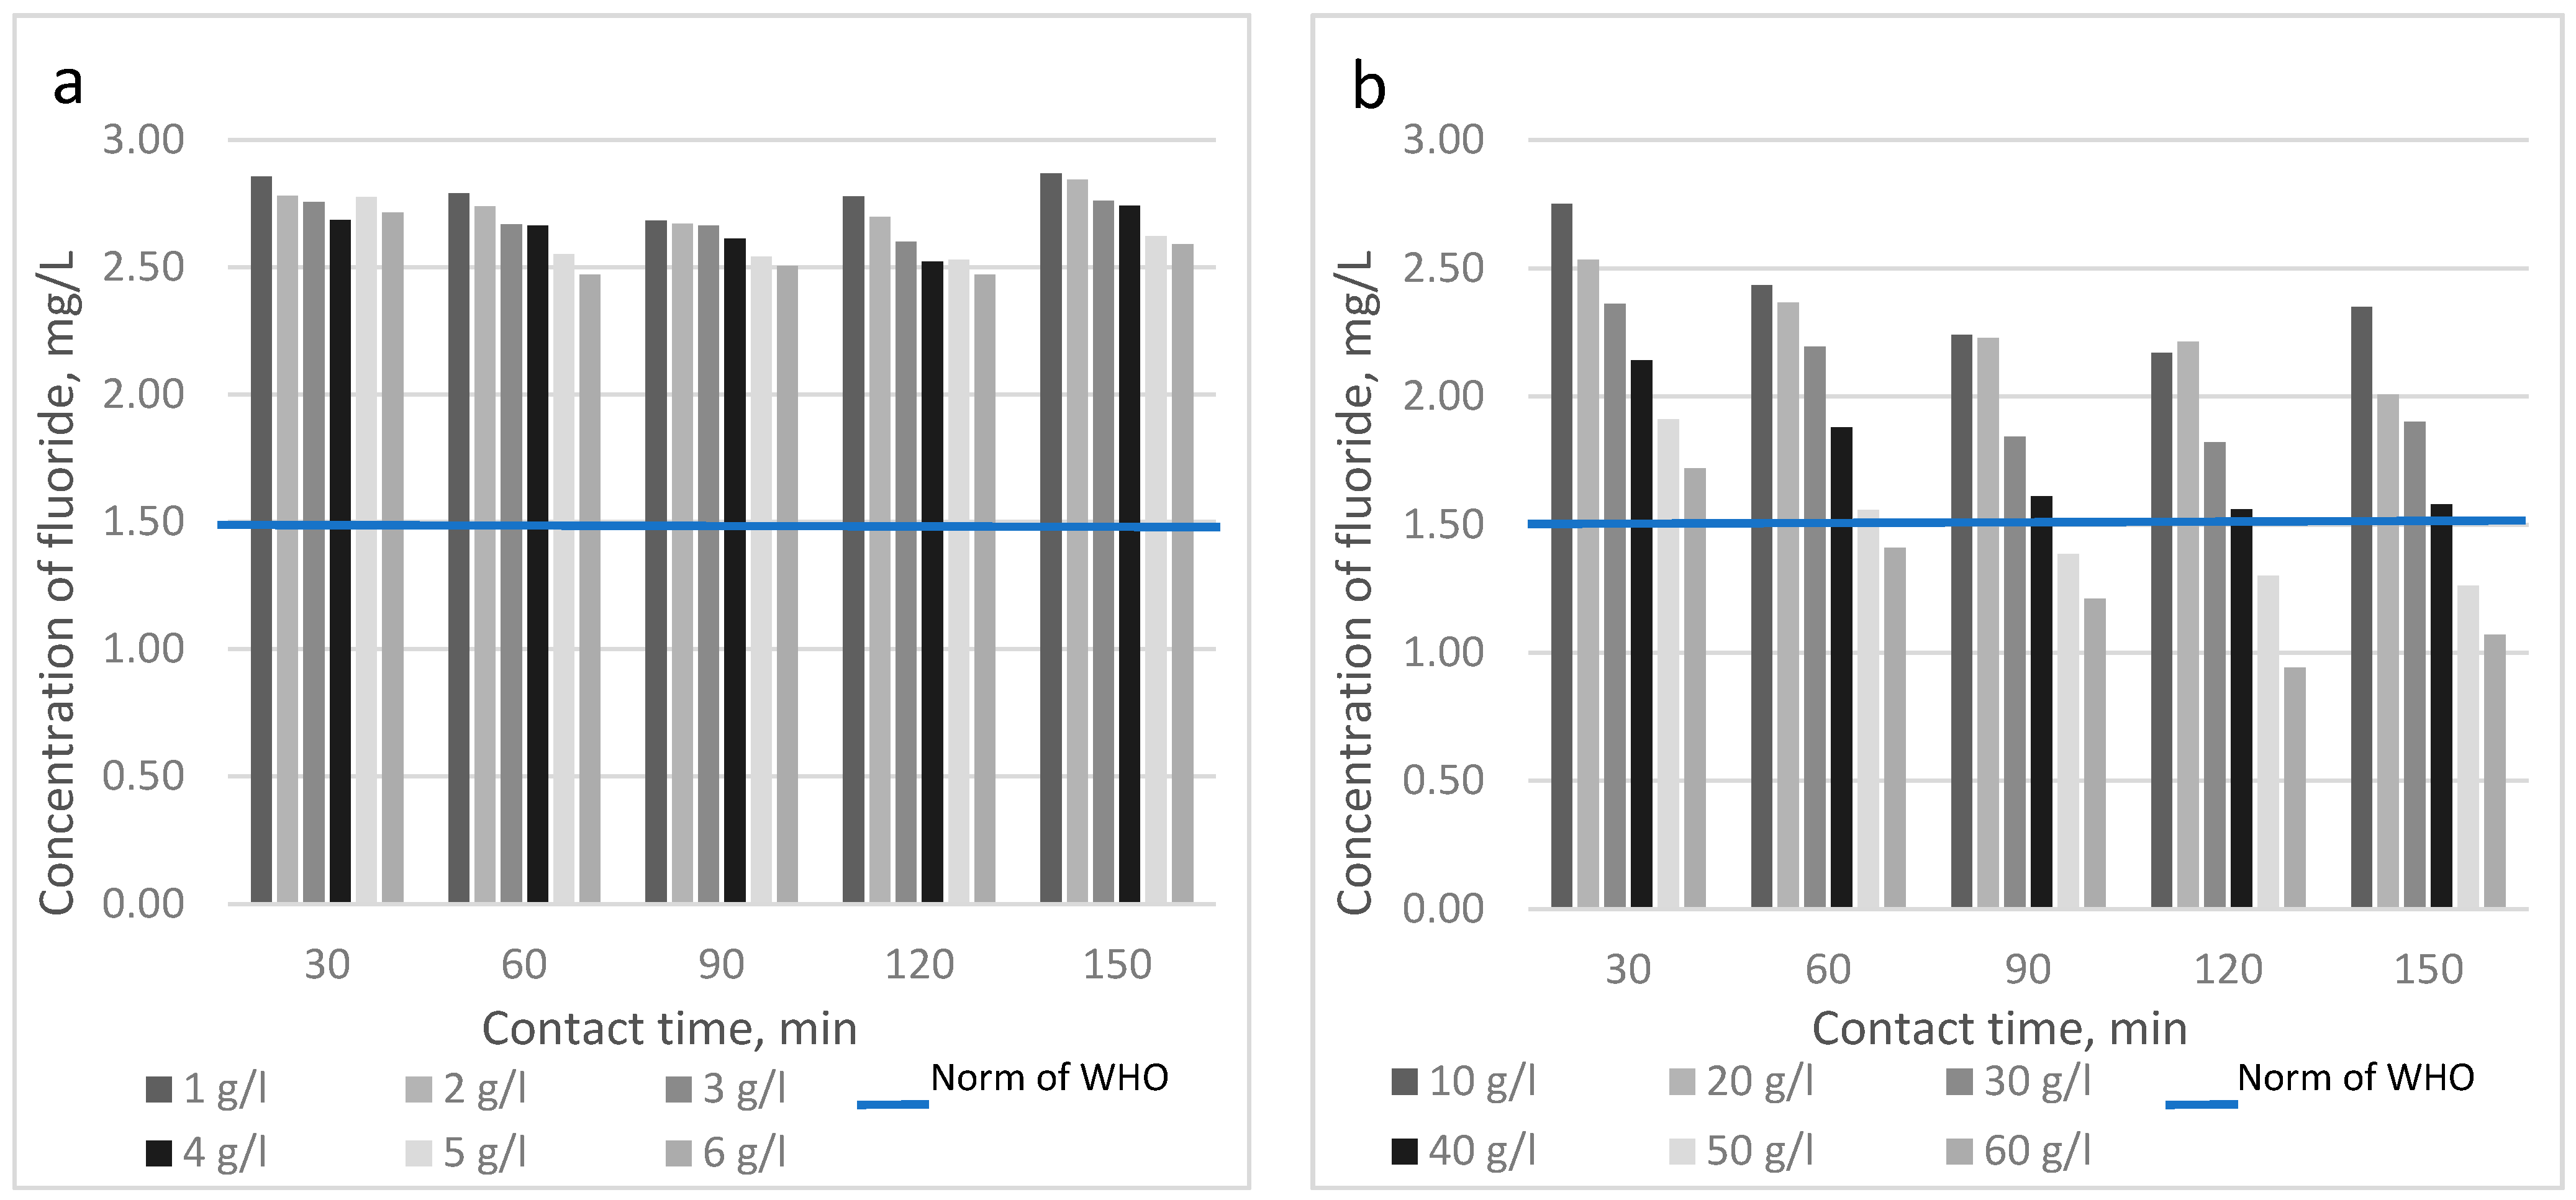
3. Results and Discussion
4. Discussion
5. Conclusions
Author Contributions
Funding
Institutional Review Board Statement
Informed Consent Statement
Data Availability Statement
Conflicts of Interest
References
- Takmil, F.; Esmaeili, H.; Mousavi, S.M.; Hashemi, S.A. Nano-magnetically modified activated carbon prepared by oak shell for treatment of wastewater containing fluoride ion. Adv. Powder Technol. 2020, 31, 3236–3245. [Google Scholar] [CrossRef]
- Jiménez-Núñez, M.L.; Olguín, M.T.; Solache-Ríos, M. Fluoride removal from aqueous solutions by magnesium, nickel, and cobalt calcined hydrotalcite-like compounds. Sep. Sci. Technol. 2007, 42, 3623–3639. [Google Scholar] [CrossRef]
- Singh, K.; Lataye, D.; Wasewar, K. Removal of fluoride from aqueous solution by using bael (Aegle marmelos) shell activated carbon: Kinetic, equilibrium and thermodynamic study. J. Fluor. Chem. 2017, 194, 23–32. [Google Scholar] [CrossRef]
- Dong, S.; Wang, Y. Characterization and adsorption properties of a lanthanum-loaded magnetic cationic hydrogel composite for fluoride removal. Water Res. 2016, 88, 852–860. [Google Scholar] [CrossRef]
- Canciam, C.A.; Pereira, N.C. Assessment of the Use of Epicarp and Mesocarp of Green Coconut for Removal of Fluoride Ions in Aqueous Solution. Int. J. Chem. Eng. 2019, 2019, 8. [Google Scholar] [CrossRef]
- Dissanayake, C.B. The fluoride problem in the groundwater of Sri Lanka—Environmental management and health. Int. J. Environ. Stud. 1991, 19, 195–203. [Google Scholar] [CrossRef]
- Mohapatra, M.; Anand, S.; Mishra, B.K.; Giles, D.E.; Singh, P. Review of fluoride removal from drinking water. J. Environ. Manag. 2009, 91, 67–77. [Google Scholar] [CrossRef] [PubMed]
- WHO. Guidelines for Drinking Water Quality; World Health Organization: Geneva, Switzerland, 1985; Volume 3, pp. 1–2. [Google Scholar]
- WHO. Guidelines for Drinking-Water Quality, First Addendum to 3rd ed.; World Health Organization: Geneva, Switzerland, 2006; Available online: http://www.who.int/water_sanitation_health/dwq/gdwq0506.pdf (accessed on 18 February 2021).
- Ahn, J.S. Geochemical occurrences of arsenic and fluoride in bedrock groundwater: A case study in Geumsan County, Korea. Environ. Geochem. Health 2012, 34, 43–54. [Google Scholar] [CrossRef]
- MEP of China (Ministry of Environmental Protection of the People’s Republic of China). Report on the State of the Environment in China; MEP of China: Beijing, China, 2008. [Google Scholar]
- Rango, T.; Bianchini, G.; Beccaluva, L.; Tassinari, R. Geochemistry and water quality assessment of central Main Ethiopian Rift natural waters with emphasis on source and occurrence of fluoride and arsenic. J. Afr. Earth Sci. 2010, 57, 479–491. [Google Scholar] [CrossRef]
- Haji, M.; Wang, D.; Li, L.; Qin, D.; Guo, Y. Geochemical Evolution of Fluoride and Implication for F− Enrichment in Groundwater: Example from the Bilate River Basin of Southern Main Ethiopian Rift. Water 2018, 10, 1799. [Google Scholar] [CrossRef]
- Edmunds, W.M.; Smedley, P.M. Fluoride in natural waters. In Essentials of Medical Geology, 2nd ed.; Springer: Dordrecht, The Netherland, 2013; pp. 311–336. [Google Scholar]
- Addison, M.J.; Rivett, M.O.; Robinson, H.; Fraser, A.; Miller, A.M.; Phiri, P.; Mleta, P.; Kalin, R.M. Fluoride occurrence in the lower East African Rift System, Southern Malawi. Sci. Total Environ. 2020, 712, 136260. [Google Scholar] [CrossRef] [PubMed]
- Addison, M.J.; Rivett, M.O.; Phiri, P.; Mleta, P.; Mblame, E.; Wanangwa, G.; Kalin, R.M. Predicting Groundwater Vulnerability to Geogenic Fluoride Risk: A Screening Method for Malawi and an Opportunity for National Policy Redefinition. Water 2020, 12, 3123. [Google Scholar] [CrossRef]
- Yousefi, M.; Goochani, M.; Mahvi, A.H. Health risk assessment to fluoride in drinking water of rural residents living in the Poldasht city, Northwest of Iran. Ecotoxicol. Environ. Saf. 2018, 148, 426–430. [Google Scholar] [CrossRef]
- Narsimha, A.; Vasa, S.K.; Li, P. Evaluation of groundwater quality, Peddavagu in Central Telangana (PCT), South India: An insight of controlling factors of fluoride enrichment. Model. Earth Syst. Environ. 2018, 4, 841–852. [Google Scholar]
- WHO. Environmental Health Criteria 36. Fluorine and Fluorides; World Health Organization: Geneva, Switzerland, 1984. [Google Scholar]
- Ayoob, S.; Gupta, A.K. Fluoride in Drinking Water: A Review on the Status and Stress Effects, Critical Reviews in Environmental. Sci. Technol. 2006, 36, 433–487. [Google Scholar]
- Nabbou, N.; Belhachemi, M.; Boumelik, M.; Merzougui, T.; Lahcene, D.; Harek, Y.; Zorpas, A.A.; Jeguirim, M. Removal of fluoride from groundwater using natural clay (kaolinite): Optimization of adsorption conditions. C. R. Chim. 2019, 22, 105–112. [Google Scholar] [CrossRef]
- Ganvir, V.; Das, K. Removal of fluoride from drinking water using aluminum hydroxide coated rice husk ash. J. Hazard. Mater. 2011, 185, 1287–1294. [Google Scholar] [CrossRef]
- Waghmare, S.S.; Arfin, T. Fluoride Removal from Water by various techniques: Review. Int. J. Innov. Sci. Eng. Technol. 2015, 2, 560–571. [Google Scholar]
- Grich, N.B.; Attour, A.; Mosfeta, M.P.; Guesmi, S.; Tlili, M.; Lapicque, F. Fluoride removal from water by electrocoagulation: Effect of the type of water and the experimental parameters. Electrochim. Acta 2019, 316, 257–265. [Google Scholar] [CrossRef]
- Shen, J.; Schäfer, A. Removal of fluoride and uranium by nanofiltration and reverse osmosis: A review. Chemosphere 2014, 117, 679–691. [Google Scholar] [CrossRef]
- Grzegorzek, M.; Majewska-Nowak, K. The influence of organic matter on fluoride removal efficiency during the electrodialysis process. Desalin. Water Treat. 2017, 69, 153–162. [Google Scholar] [CrossRef]
- Yang, Y.; Lu, Y.; Guo, J.; Zhang, X. Application of freeze concentration for fluoride removal from water solution. J. Water Process Eng. 2017, 19, 260–266. [Google Scholar] [CrossRef]
- Meenakshi, S.; Viswanathan, N. Identification of selective ion-exchange resin for fluoride sorption. J. Colloid Interface Sci. 2007, 308, 438–450. [Google Scholar] [CrossRef]
- Maliyekkal, S.M.; Sharma, A.K.; Philip, L. Manganese-oxide-coated alumina: A promising sorbent for defluoridation of water. Water Res. 2006, 40, 3497–3506. [Google Scholar] [CrossRef]
- Maliyekkal, S.M.; Shukla, S.; Philip, L.; Nambi, I.M. Enhanced fluoride removal from drinking water by magnesia-amended activated alumina granules. Chem. Eng. J. 2008, 140, 183–192. [Google Scholar] [CrossRef]
- Biswas, K.; Saha, S.K.; Ghosh, U.C. Adsorption of fluoride from aqueous solution by a synthetic iron(III)–aluminum(III) mixed oxide. Ind. Eng. Chem. Res. 2007, 46, 5346–5356. [Google Scholar] [CrossRef]
- He, Y.; Zang, L.; An, X.; Wan, G.; Zhu, W.; Luo, Y. Enhanced fluoride removal from water by rare earth (La and Ce) modified alumina: Adsorption isotherms, kinetics, thermodynamics and mechanism. Sci. Total Environ. 2019, 688, 184–198. [Google Scholar] [CrossRef]
- Yanf, W.; Tian, S.; Tang, Q.; Chai, L.; Wang, H. Fungus hyphae-supported alumina: An efficient and reclaimable adsorbent for fluoride removal from water. J. Colloid Interface Sci. 2017, 496, 496–504. [Google Scholar]
- Vinati, A.; Mahanty, B.; Behera, S.K. Clay and clay minerals for fluoride removal from water: A state-of-the-art review. Appl. Clay Sci. 2015, 114, 340–348. [Google Scholar] [CrossRef]
- Onyango, M.S.; Kojima, Y.; Aoyi, O.; Bernardo, E.C.; Matsuda, H. Adsorption equilibrium modeling and solution chemistry dependence of fluoride removal from water by trivalent-cation-exchanged zeolite F-9. J. Colloid Interface Sci. 2004, 279, 341–350. [Google Scholar] [CrossRef]
- Vences-Alvarez, E.; Velazquez-Jimenez, L.H.; Chazaro-Ruiz, L.F.; Diaz-Flores, P.E.; Rangel-Mendez, J.R. Fluoride removal in water by a hybrid adsorbent lanthanum–carbon. J. Colloid Interface Sci. 2015, 455, 194–202. [Google Scholar] [CrossRef] [PubMed]
- Kong, L.; Tian, Y.; Pang, Z.; Huang, X.; Li, M.; Yang, R.; Li, N.; Zhang, J.; Zuo, W. Synchronous phosphate and fluoride removal from water by 3D rice-like lanthanum-doped La@MgAl nanocomposites. Chem. Eng. J. 2019, 371, 893–902. [Google Scholar] [CrossRef]
- Ndé-Tchoupé, A.I.; Crane, R.A.; Mwakabona, H.T.; Noubactep, C.; Njau, K.N. Technologies for Decentralized Fluoride Removal: Testing Metallic Iron-Based Filters. Water 2015, 7, 6750–6774. [Google Scholar] [CrossRef]
- Roh, J.; Umh, H.N.; Yoo, C.M.; Rengaraj, S.; Lee, B.; Kim, Y. Waste coffee-grounds as potential biosorbents for removal of acid dye 44 from aqueous solution. Korean J. Chem. Eng. 2012, 29, 903–907. [Google Scholar] [CrossRef]
- Azouaou, N.; Sadaoui, Z.; Djaafri, A.; Mokaddem, H. Adsorption of cadmium from aqueous solution onto untreated coffee grounds: Equilibrium, kinetics and thermodynamics. J. Hazard. Mater. 2010, 184, 126–134. [Google Scholar] [CrossRef] [PubMed]
- Krishna Mohan, G.V.; Naga Babu, A.; Kalpana, K.; Ravindhranath, K. Removal of chromium (VI) from water using adsorbent derived from spent coffee grounds. Int. J. Environ. Sci. Technol. 2019, 16, 101–112. [Google Scholar] [CrossRef]
- Pujol, D.; Liu, C.; Gominho, J.; Olivella, M.À.; Fiol, N.; Villaescusa, I.; Pereira, H. The chemical composition of exhausted coffee waste. Ind. Crop. Prod. 2013, 50, 423–429. [Google Scholar] [CrossRef]
- Naga Babu, A.; Srinivasa Reddy, D.; Suresh Kumar, G.; Ravindhranath, K.; Krishna Mohan, G.V. Removal of lead and fluoride from contaminated water using exhausted coffee grounds based bio-sorbent. J. Environ. Manag. 2018, 218, 602–612. [Google Scholar] [CrossRef] [PubMed]
- Cornell, R.M.; Schwertmann, U. The Iron Oxides-Structure, Properties, Reactions, Occurrence and Uses; VCH Publishers: New York, NY, USA, 1996; p. 573. [Google Scholar]
- Deliyanni, E.A.; Bakoyannakis, D.N.; Zouboulis, A.I.; Matis, K.A. Sorption of as(V) ions by akaganéite-type nanocrystals. Chemosphere 2003, 50, 155–163. [Google Scholar] [CrossRef]
- Gupta, V.K.; Nayak, A. Cadmium removal and recovery from aqueous solutions by novel adsorbents prepared from orange peel and Fe2O3 nanoparticles. Chem. Eng. J. 2012, 180, 81–90. [Google Scholar] [CrossRef]
- Polowczyk, I.; Cyganowski, P.; Ulatowska, J.; Sawinski, W.; Bastrzyk, A. Synthetic Iron Oxides for Adsorptive Removal of Arsenic. Water Air Soil Pollut. 2018, 203, 1–10. [Google Scholar] [CrossRef]
- Gallegos-Garcia, M.; Ramirez-Muniz, K.; Song, S. Arsenic Removal from Water by Adsorption Using Iron Oxide Minerals as Adsorbents: A Review. Miner. Process. Extr. Metall. Rev. 2012, 33, 301–315. [Google Scholar] [CrossRef]
- Hao, L.; Liu, M.; Wang, N.; Li, G. A critical review on arsenic removal from water using iron-based adsorbents. R. Soc. Chem. 2018, 8, 545–560. [Google Scholar] [CrossRef]
- Diliunas, J.; Jurevicius, A.; Zuzevicius, A. Formation of iron compounds in the Quaternary groundwater of Lithuania. Geologija 2006, 55, 66–73. [Google Scholar]
- Marjani, A.; Nazari, A.; Seyyed, M. Alteration of iron level in drinking water by aeration in Gonbad Kavoos (North East of Iran). Am. J. Biochem. Biotechnol. 2009, 5, 94–97. [Google Scholar] [CrossRef]
- Yang, H.; Li, D.; Zhang, J.; Hao, R.; Li, B. Design of biological filter for iron and manganese removal from water. J. Environ. Sci. Health 2004, 39, 1447–1454. [Google Scholar] [CrossRef]
- Bruins, J.H.; Petrusevski, B.; Slokar, Y.M.; Kruithof, J.C.; Kennedy, M.D. Manganese removal from groundwater: Characterization of filter media coating. Desalin. Water Treat. 2015, 55, 1851–1863. [Google Scholar] [CrossRef]
- Albrektiene, R.; Karaliunas, K.; Baziene, K. Sustainable Reuse of Groundwater Treatment Iron Sludge for Organic Matter Removal from River Neris Water. Sustainability 2019, 11, 639. [Google Scholar] [CrossRef]
- Sakalauskas, A.; Sulga, V.; Jankauskas, J. Vandentieka; Technika: Vilnius, Lithuania, 2007; p. 575. [Google Scholar]
- Gegeckas, D.; Ofverstrom, S. Geležies paplavų panaudojimas fosfatų pašalinimui iš pūdyto dumblo vandens, Moksl. Liet. Ateitis 2016, 19, 2029–2035. [Google Scholar]
- Sun, J.; Pikaar, I.; Sharma, K.R.; Keller, J.; Yuan, Z. Feasibility of sulfide control in sewers by reuse of iron rich drinking water treatment sludge. Water Res. 2015, 71, 150–159. [Google Scholar] [CrossRef]
- Yoo, H.; Cho, S.; Ko, S. Modification of coagulation and Fenton oxidation processes for cost-effective leachate treatment. J. Environ. Sci. Health 2001, 36, 39–48. [Google Scholar] [CrossRef]
- Albrektiene, R.; Paliulis, D. Inverstigation of lead removal from drinking water using different sorbents. Ecol. Chem. Eng. 2020, 27, 67–82. [Google Scholar]
- Nde-Tchoupe, A.I.; Nanseu-Njiki, C.P.; Hu, R.; Nassi, A.; Noubactep, C.; Licha, T. Characterizing the reactivity of metallic iron for water defluoridation in batch studies. Chemosphere 2019, 219, 855–863. [Google Scholar] [CrossRef]
- Heimann, S.; Nde-Tchoupe, A.I.; Hu, R.; Licha, T.; Noubactep, C. Investigating the suitability of Fe0 packed-beds for water defluoridation. Chemosphere 2018, 209, 578–587. [Google Scholar] [CrossRef]
- Ab Ghani, Z.; Yusoff, M.S.; Zaman, N.Q.; Zamri, M.F.M.A.; Andas, J. Optimization of preparation conditions for activated carbon from banana pseudo-stem using response surface methodology on removal of color and COD from landfill leachate. Waste Manag. 2017, 62, 177–187. [Google Scholar] [CrossRef] [PubMed]
- Bykov, A.; Valentukeviciene, M. Fosfatų ̨Šalinimas iš Nuotekų Naudojant Geležies Prisotintas Paplavas, iš 17-Osios Lietuvos Jaunųjų Mokslininkų Konferencijos “Mokslas—Lietuvos Ateitis” Teminės Konferencijos “Pastatų Inžinerinės Sistemos”; Technika: Vilnius, Lithuania, 2014; pp. 13–16. [Google Scholar]
- Council Directive 98/83/EC of 3 November 1998 on the Quality of Water Intended for Human Consumption; European Union: Brussel, Belgium, 1998.
- Noubactep, C. The fundamental mechanism of aqueous contaminant removal by metallic iron. Water Sa 2010, 36, 663–670. [Google Scholar] [CrossRef]
- Sun, Y.; Li, J.; Huang, T.; Guan, X. The influences of iron characteristics, operating conditions and solution chemistry on contaminants removal by zero-valent iron: A review. Water Res. 2016, 100, 277–295. [Google Scholar] [CrossRef]
- Xu, C.; Zhang, B.; Zhu, L.; Lin, S.; Sun, X.; Jiang, Z.; Tratnyek, P.G. Sequestration of antimonite by zerovalent iron: Using weak magnetic field effects to enhance performance and characterize reaction mechanisms. Environ. Sci. Technol. 2016, 50, 1483–1491. [Google Scholar] [CrossRef]
- Li, S.; Ding, Y.; Wang, W.; Lei, H. A facile method for determining the Fe(0) content and reactivity of zero valent iron. Anal. Methods 2016, 8, 1239–1248. [Google Scholar] [CrossRef]
- Makota, S.; Nde-Tchoupe, A.I.; Mwakabona, H.T.; Tepong-Tsinde, R.; Noubactep, C.; Nassi, A.; Njau, K.N. Metallic iron for water treatment: Leaving the valley of confusion. Appl. Water Sci. 2017, 7, 4177–4196. [Google Scholar] [CrossRef]
- Noubactep, C. Research on metallic iron for environmental remediation: Stopping growing sloppy science. Chemosphere 2016, 153, 528–530. [Google Scholar] [CrossRef] [PubMed]
- Noubactep, C. No scientific debate in the zero-valent iron literature. Clean Soil Air Water 2016, 44, 330–332. [Google Scholar] [CrossRef]
- Noubactep, C. Designing metallic iron packed-beds for water treatment: A critical review. Clean Soil Air Water 2016, 44, 411–421. [Google Scholar] [CrossRef]
- Noubactep, C. The operating mode of Fe0/H2O systems: Hidden truth or repeated nonsense? Fresenius Environ. Bull. 2016, 28, 8328–8330. [Google Scholar]
- van Genuchten, C.M.; Bandaru, S.R.S.; Surorova, E.; Amrose, S.E.; Gadgil, A.J.; Pena, J. Formation of macroscopic surface layers on Fe (0) electrocoagulation electrodes during an extended field trial of arsenic treatment. Chemosphere 2016, 153, 270–279. [Google Scholar] [CrossRef] [PubMed]
- Khan, A.H.; Rasul, S.B.; Munir, A.K.M.; Habibuddowla, M.; Alauddin, M.; Newaz, S.S.; Hussam, A. Appraisal of a simple arsenic removal method for groundwater of Bangladesh. J. Environ. Sci. Health A 2000, 35, 1021–1041. [Google Scholar] [CrossRef]
- Reardon, J.E. Zerovalent irons: Styles of corrosion and inorganic control on hydrogen pressure buildup. Environ. Sci. Technol. 2005, 39, 7311–7317. [Google Scholar] [CrossRef] [PubMed]


| Fluoride Concentration, mg/L | Health Outcome |
|---|---|
| <0.5 | Dental caries |
| 0.5–1.5 | Optimum dental health |
| 1.5–4.0 | Dental fluorosis |
| 4.0–10 | Dental and skeletal fluorosis |
| >10.0 | Crippling fluorosis |
| Material | Comments | Availability |
|---|---|---|
| Metal oxides and hydroxides | Exhibit relatively low efficiency without physico-chemical modification | low |
| Biosorbents | Exhibit relatively low efficiency without physico-chemical modification | very high |
| Geomaterials | Exhibit relatively low efficiency without physico-chemical modification | high |
| Carbonaceous Materials | Typically require expensive physico-chemical activation | low |
| Bone char | Produced by carbonizing animal bones | high |
| Industrial by-Products | Typically require expensive physico-chemical activation | low |
| Metallic iron (Fe0) | Under natural conditions a ubiquitous (hydr)oxide layer is also present | high |
| Element | Quantity % |
|---|---|
| Iron (Fe) | 33.9 |
| Calcium (Ca) | 4.5 |
| Siliceous (Si) | 2.7 |
| Phosphorus (F) | 2.2 |
| Aluminium (Al) | 0.4 |
| Manganese (Mn) | 0.25 |
| Microelements (Zn, Ba, S, and ect.) | 1.05 |
| Element | Trueness | Precision |
|---|---|---|
| Average value, mg/L | 1.54 | 1.54 |
| Assigned value, mg/L | 1.5 | 1.5 |
| Standard deviation, mg/L | 0.01 | 1.01 |
| Relative standard deviation, % | 0.67 | 0.67 |
| Acceptable trueness, % | 2.47 | 1.34 |
| Dose of Sorbent, g/L A | 1–3 | 4–6 | 10–30 | 40–60 | 1–3 | 4–6 | 10–30 | 40–60 | Q0.05 | ||
|---|---|---|---|---|---|---|---|---|---|---|---|
| Tukey’s criterion of exhausted coffee grounds | Tukey’s criterion of exhausted iron sludge | ||||||||||
| 1–3 | - | 61.19 | 219.35 | 634.50 | - | 129.37 | 2.91.46 | 226.01 | >3.63 | ||
| 4–6 | 219.35 | - | 158.16 | 465.86 | 291.46 | - | 162.09 | 655.73 | >3.63 | ||
| 10–30 | 527.06 | 465.86 | - | 307.71 | 785.10 | 655.73 | - | 493.63 | >3.63 | ||
| 40–60 | 634.50 | 465.86 | 307.71 | - | 226.01 | 655.73 | 493.63 | - | >3.63 | ||
| Contact Time, min B | 30 | 60 | 90 | 120 | 150 | 30 | 60 | 90 | 120 | 150 | |
| 30 | - | 71.51 | 119.94 | 138.57 | 107.18 | - | 67.45 | 2.21 | 60.04 | 88.38 | >3.86 |
| 60 | 71.51 | - | 48.42 | 18.63 | 35.66 | 67.45 | - | 69.66 | 57.82 | 155.83 | >3.86 |
| 90 | 119.94 | 48.42 | - | 18.63 | 12.76 | 2.21 | 69.66 | - | 57.82 | 86.17 | >3.86 |
| 120 | 138.57 | 18.63 | 18.63 | - | 31.39 | 60.04 | 57.82 | 57.82 | - | 28.34 | >3.86 |
| 150 | 107.18 | 35.66 | 12.76 | 12.76 | - | 88.38 | 155.83 | 86.17 | 28.34 | - | >3.86 |
| Sum of Squares | Degrees of Freedom (Df) | Dispersion Estimates | Statistics (F) | Fisher Distribution ά = 0.05 | ω2 | Notes | |
|---|---|---|---|---|---|---|---|
| Sorption of iron sludge | |||||||
| A | 596.41 | 3 | 198.80 | 118166 | >2.37 | 0.68 | Makes an impact |
| B | 24.54 | 4 | 6.13 | 3646 | >2.60 | 0.03 | Makes an impact |
| AB | 254.01 | 12 | 21.17 | 12582 | >1.75 | 0.29 | There is an interaction |
| Sorption of exhausted coffee grounds | |||||||
| A | 231.49 | 3 | 77.16 | 55531 | >2.37 | 0.70 | Makes an impact |
| B | 16.62 | 4 | 4.15 | 2990 | >2.60 | 0.05 | Makes an impact |
| AB | 80.10 | 12 | 6.67 | 4803 | >1.75 | 0.24 | There is an interaction |
Publisher’s Note: MDPI stays neutral with regard to jurisdictional claims in published maps and institutional affiliations. |
© 2021 by the authors. Licensee MDPI, Basel, Switzerland. This article is an open access article distributed under the terms and conditions of the Creative Commons Attribution (CC BY) license (https://creativecommons.org/licenses/by/4.0/).
Share and Cite
Siaurusevičiūtė, I.; Albrektienė, R. Removal of Fluorides from Aqueous Solutions Using Exhausted Coffee Grounds and Iron Sludge. Water 2021, 13, 1512. https://doi.org/10.3390/w13111512
Siaurusevičiūtė I, Albrektienė R. Removal of Fluorides from Aqueous Solutions Using Exhausted Coffee Grounds and Iron Sludge. Water. 2021; 13(11):1512. https://doi.org/10.3390/w13111512
Chicago/Turabian StyleSiaurusevičiūtė, Irma, and Ramunė Albrektienė. 2021. "Removal of Fluorides from Aqueous Solutions Using Exhausted Coffee Grounds and Iron Sludge" Water 13, no. 11: 1512. https://doi.org/10.3390/w13111512
APA StyleSiaurusevičiūtė, I., & Albrektienė, R. (2021). Removal of Fluorides from Aqueous Solutions Using Exhausted Coffee Grounds and Iron Sludge. Water, 13(11), 1512. https://doi.org/10.3390/w13111512