Article

Exploring the Role of Reservoir Storage in Enhancing Resilience to Climate Change in Southern Europe

by
Alfredo Granados
1,*,
Alvaro Sordo-Ward
1,
Bolívar Paredes-Beltrán
1,2 and
Luis Garrote
1
1
Departamento de Ingeniería Civil, Hidráulica, Energía y Medio Ambiente, Universidad Politécnica de Madrid, 28040 Madrid, Spain
2
Carrera de Ingeniería Civil, Facultad de Ingeniería Civil y Mecánica, Universidad Técnica de Ambato, Ambato 180206, Ecuador
*
Author to whom correspondence should be addressed.
Water 2021, 13(1), 85; https://doi.org/10.3390/w13010085
Submission received: 10 November 2020 / Revised: 23 December 2020 / Accepted: 29 December 2020 / Published: 1 January 2021
(This article belongs to the Special Issue Water Resources Management Models for Policy Assessment)

Abstract

:
Recent trends suggest that streamflow discharge is diminishing in many rivers of Southern Europe and that interannual variability is increasing. This threatens to aggravate water scarcity problems that periodically arise in this region, because both effects will deteriorate the performance of reservoirs, decreasing their reliable yield. Reservoir storage is the key infrastructure to overcome variability and to enhance water availability in semiarid climates. This paper presents an analysis of the role of reservoir storage in preserving water availability under climate change scenarios. The study is focused on 16 major Southern European basins. Potential water availability was calculated in these basins under current condition and for 35 different climatic projections for the period 2070–2100. The results show that the expected reduction of water availability is comparable to the decrease of the mean annual flow in basins with large storage capacity. For basins with small storage, the expected reduction of water availability is larger than the reduction of mean annual flow. Additionally, a sensitivity analysis was carried out by replicating the analysis assuming variable reservoir volumes from 25% to 175% of current storage. The results show that increasing storage capacity attenuates the reduction of water availability and reduces its uncertainty under climate change projections. This feature would allow water managers to develop suitable policies to mitigate the impacts of climate change, thus enhancing the resilience of the system.

1. Introduction

Climate change, associated with the recorded rise of average temperatures, which are expected to continue increasing to a greater or lesser extent, may also influence other climatic variables such as precipitation, frost, or evapotranspiration [1]. All these changes may affect, in turn, the hydrological processes and consequently net water resources. This threatens the performance of water resource systems and their capability to supply demand and ecological need as presently planned. Therefore, it is necessary to assess both the impact on water resources and the behavior of water systems under such a scenario [2].
Many authors have devoted significant efforts to evaluate net water resources in climate change projections, on all scales from global to basin [3,4,5,6,7,8,9]. Their results show that climate change will affect, in varying ways and to different extents, each region of the planet. As a global result, it could be synthesized that there will be a reduction of water resources of between 10% and 30% [1]. This is an indicative value, useful for developing macro-policies and for raising awareness in the population.
With regard to Southern Europe, despite the dispersion of the various models, the general trend indicates that net resources will decrease, and that the variability of their distribution will increase, as shown in the results of the Prediction of regional scenarios and uncertainties for defining European climate change risks and effects (PRUDENCE) [10] and Climate change and its impacts at seasonal, decadal and centennial timescales (ENSEMBLES) [11] projects. In Southern Europe, the prognosis is that traditional water scarcity problems will be aggravated. In many basins in this region, the available resources can hardly meet the existing water demands [12]. These are areas with a benign climate, which favors the implementation of agriculture and the development of tourism and services. All these activities require substantial amounts of water. Although these regions have scarce water resources, they are also resilient as they have long experience in dealing with water scarcity and are well adapted to its management [13].
The present study focuses on understanding the effect of reservoir storage capacity on water availability in Southern European basins under climate change. As above mentioned, these basins are typically characterized by scarce and highly variable water resources. The adopted strategy for water resources development in the last century relied on reservoir storage, as it is necessary to store water during the wet periods for its use in the dry ones. In Spain, for example, the existing 1350 large dams helped to increase water availability from 10% to between 40% and 50% of mean natural flow during the last century [14]. As storage capacity grew in parallel with water use, this water availability is used strictly enough to serve current water needs. Alternative adaptation and mitigation measures are being developed in the current century: controlling irrigation water rights, increasing water use efficiency through localized and drip irrigation, developing non-conventional resources, such as water reutilization and desalination, among others [15,16]. Despite these efforts, projections of climate change suggest less water resources with higher variability, which will negatively affect system performance, so water availability is expected to reverse its growing trend [17].
The analysis of reservoir storage capacity and its relationship with safe yield has been a topic of study since the beginning of the development of large hydraulic systems [18]. Initially, graphical methods were developed to determine the reservoir capacity needed to satisfy a given demand with required reliability, and their use was restricted to single reservoir models. Later methods introduced uncertainty of future inflows and attempted to estimate required reservoir size through statistical analysis of inflows, leading to the concepts of risk of failure and reliability. The development of computing allowed the stochastic generation of synthetic series and the disaggregated analysis of multiple reservoirs in a system [19]. Löf and Hardison [20] provided storage-reliability-yield (SRY) relations for assessing the required storage capacity in the USA. The study was later revisited by Vogel et al. [21], who concluded that areas with lower variability tend to be equipped with within-year storage systems while those with large variability required larger over-year storage facilities. Further developments introduced the concepts of resilience and robustness [22] to complete the reliability-yield analysis [23]. An alternative approach is the simulation of the water resources system behavior, which in conjunction with the power of computers allows the development of complex models that reproduce a simulated operation of the system [24,25,26]. These models are useful as decision-support tools for allocating water among users and assessing the effectiveness of structural and managerial actions [27,28] and their capabilities are even extended to groundwater resources and social and economic considerations [29].
Focus is slowly being placed on the impact of climate change on water availability and the role of reservoir storage to increase resilience. Wurbs et al. [30] highlighted the need to introduce climate change in the analysis of water availability and proposed a methodology to couple climatic and system behavior models. Garrote et al. [31] developed a simulation model specifically suited to account for the role of reservoirs in providing water availability in the context of climate change. Several authors [32,33,34] have argued in favor of adaptive reservoir management as an effective mitigation measure during climate change. Adaptive management requires a good knowledge of the interplay between reservoir storage and the reliability, resilience, and vulnerability of a water supply system subject to uncertain input [35]. Water availability deriving from reservoir systems may become increasingly unstable under climate change [36] and knowledge on how regulated water supply systems react to flow alterations is essential for system managers to design climate adaptation policies.
This paper looks beyond the impact of climate change on water availability to provide insight into the performance of reservoir storage systems and their effectiveness of adaptation and mitigation measures. With this purpose we include a regional analysis of the performance of reservoir storage and a sensitivity analysis of the reservoir-yield relations under less abundant resources and larger variability conditions in 16 representative European basins. The objective of the research is to check if reservoir storage enhances resilience to climate change. Given the uncertainty of climate projections, the adopted approach is to evaluate basin response under a large ensemble of plausible future scenarios and to evaluate if reservoir storage plays a role in determining the response to changes in hydrologic forcing. System response is quantified in terms of the elasticity of water availability to climate change, comparing changes in potential water availability with changes in mean annual flow. Elasticity is evaluated with the help of two new indices proposed in this work, which characterize the attenuation of changes and the reduction of uncertainty provided by reservoir storage.

2. Data and Methods

2.1. Area under Analysis

We present results for 16 major river basins in Europe, which are shown in Figure 1. Basin selection was based on a regional focus on Southern Europe, but including different climates, hydrologic regimes, and storage capacities to allow for a more effective comparison. The selected basins cover a large fraction of the Atlantic and Mediterranean divides of Southern Europe and are representative of the variety of conditions that can be found across the region. The main characteristics of the basins considered in this study are shown in Table 1. Basin areas range from 17,550 km2 (Segura) to 115,910 km2 (Loire). Reservoir Storage Volume V includes all reservoirs, except those managed exclusively for hydropower. The basin with largest storage volume is Guadiana, which includes two of the largest reservoirs in Southern Europe: Alqueva (4.15 km3) and La Serena (3.21 km3). Basin hydrology is very variable, with Specific Runoff ranging from 11 mm/year in the Segura basin to 563 mm/year in the Po basin. The most relevant characteristic for this study is specific storage, defined as the ratio of Storage Volume V in km3 divided by Mean Annual Flow F in km3/year for the period 1960–1999. This ratio is usually called Residence Time (in years) and represents the regulation capacity of reservoirs in the basin. In the basins under study, it ranges across three orders of magnitude, from 0.01 years (Arno) to nearly 6 years (Segura).
The spatial support for the analysis is taken from the “Hydro1k” data set [37], derived from the Global 30 Arc-Second Elevation (GTOPO) 30 arc-second digital elevation model of the world. The dataset provides a digital elevation map and a set of topographically derived rasters at 1 km resolution, including streams and drainage basins divided into catchments. The original drainage basins in “Hydro1k” were processed to eliminate catchments which were too small (less than 1000 km2), which were merged to neighboring catchments. The merging was always done with downstream areas and avoiding catchments including reservoirs. The reservoir storage volume in every catchment was obtained from the International Commission on Large Dams (ICOLD) World Register of Dams [38]. We selected dams in the register with more than 0.005 km3 of storage capacity, excluding dams managed only for hydropower. The reservoirs were georeferenced and linked to the corresponding Hydro1k streams. All dams located in the same Hydro1k subbasin were grouped in an equivalent reservoir adding the storage volume and flooded area (to account for reservoir evaporation losses).

2.2. Methodological Overview

The methodological approach is presented in Figure 2. The analysis is structured in three steps: analysis of the forcing scenarios for water resources systems, analysis of system response in terms of potential water availability, and analysis of the sensitivity of system response to reservoir storage. The analysis of system forcing consists of the compilation of a large name of model runs producing monthly streamflow series in the basins under analysis, both for a historic control period and for a projected future period. Streamflow series for the control period were corrected for bias. Streamflow series for the future period were obtained under different climate scenarios. The scenarios were characterized in terms of the expected changes of mean, standard deviation, and coefficient of variation of annual streamflow. The analysis of system response is focused on the estimation of the potential water availability allowed by current reservoir storage in the basins under analysis. Uncertainty of potential water availability is first characterized for the control and the future periods. Then, the elasticity of water availability to climate changes is explored by comparing changes in potential water availability to changes in mean annual flow, both for individual projections and for the distribution of all projections in each basin. The focus of the analysis is to explore how this elasticity is affected by reservoir storage and streamflow variability. The third step is focused on exploring the sensitivity to reservoir storage. The analyses of the previous step are repeated considering variable storage in each basin. The performance of the system is characterized by two new indices proposed in this study: the attenuation index and the uncertainty index. These indices describe how the performance of the water supply system is affected by changes in streamflow. The main conclusions of the study are obtained by comparing how these indices change as a function of reservoir storage for all basins.

2.3. Current and Future Runoff Scenarios

The focus of the present study is the analysis of the role of reservoir storage to determine how water resources systems react to changes in hydrologic forcing. An effort was made to obtain a wide ensemble of scenarios that would represent the uncertainty linked to climate projections. Therefore, we chose to combine model results obtained under two sets of emission scenarios, the Special Report on Emission Scenarios (SRES) and Representative Concentration Pathways (RCP), in order to increase the size of the ensemble. Current and future runoff scenarios were compiled from three previous studies that include Southern Europe [39,40,41]. These studies were based on results from different climate models developed over the last 15 years under two sets of emission scenarios: SRES and RCP. They jointly describe the uncertainty that is currently challenging water managers.
The first set of scenarios was taken from the output of regional climate models from the PRUDENCE project [10]. The study by González-Zeas et al. [39] was based on the projections of surface runoff made by eight RCMs at 50 km resolution nested in a single global model, referred to as HadAM3H, in emission scenarios A2 and B2. They analyzed current (1960–1990) and future (2070–2100) time slices. The second set of scenarios was based on the results of the Regional Climate Models (RCMs) of the ENSEMBLES project [11]. The project produced many transient model runs for the time period from 1960 to 2100 using RCMs to characterize model uncertainty. The study by Garrote et al. [40] selected runoff output from four ENSEMBLES models at 25 km resolution under emission scenario A1B to study the major Mediterranean river basins of Europe. They worked with windows of analysis on the transient model runs in three time slices: historical (1960–1990), short term (2020–2050) and long term (2070–2100). In the first two sets of scenarios, monthly runoff time series were directly obtained from the “Total runoff” variable (mrro) produced by RCMs. The values of surface runoff flux available at the nodes of the native grid of the RCMs (50 km resolution in PRUDENCE and 25 km resolution in ENSEMBLES) were used to produce monthly runoff maps by interpolation at the finer grid provided by the Hydro1k dataset (1 km). The center of the RCM grid was taken as a point equal to the average for that cell. Interpolation was based on a weighted mean using the inverse of the distance squared as weight. These runoff maps were combined with the subbasin definitions of Hydro1k to obtain monthly streamflow values for each subbasin. The third set of scenarios was based on the results of the global hydrological model PCRaster GLOBal Water Balance (PCRGLOBWB) model [42] in the Inter-Sectorial Impact Model Intercomparison Project (ISIMIP) [43]. In ISIMIP, the PCRGLOBWB model was forced with five global climate models under historical conditions and climate change projections corresponding to four Representative Concentration Pathways scenarios: RCP-2., RCP-4., RCP-6. and RCP-8., corresponding to radiative forcing in the year 2100 of 2.6, 4.5, 6.0, and 8.5 W/m2, respectively. The study by Sordo-Ward et al. [41] used naturalized streamflow from PCRGLOBWB at 50 km resolution to analyze 1261 subbasins covering the entire territory of Western Europe. They considered two time slices in their analysis: historical (1960–1999) and long-term projection (2060–2099). The monthly streamflow time series in the subbasins were also obtained from monthly runoff maps derived from the runoff produced from the PCRGLOBWB model through interpolation at the Hydro1k 1 km grid.
A total of 16 model runs were compiled for the historical period (eight model runs from the PRUDENCE project, three model runs from the ENSEMBLES projects and five model runs from the PCRGLOBWB model). The windows of analysis in this period overlap for years 1960–1990. All these model runs produced different results in the basins under analysis. To assess the quality of these hydrological projections, the results obtained at the working scale of each model run were compared to a reference estimate of mean annual runoff under current conditions. The selected reference was the annual surface runoff layer (Global Composite Runoff Fields) of the University of New Hampshire Global Runoff Data Centre (GRDC) [44]. This data layer was produced by combining a database of observed river discharge information in more than 9900 gauging stations with a climate-driven water balance model to develop consistent runoff fields. The combination of direct readings from gauging stations with the water balance model preserves the spatial distribution of runoff generation and provides the best estimate of observed runoff over large domains. The mean values of the time series compiled for the historical period were compared with mean annual runoff produced by GRDC. The results are presented in Figure 3, which shows the scatterplot resulting from comparing catchment mean annual runoff produced from GRDC with that produced by model runs for the historical period. Model runs corresponding to the Special Report on Emissions Scenarios (SRES) (PRUDENCE and ENSEMBLES projects) show poor agreement. The models that performed best were Universidad de Castilla La Mancha (UCM) and Eidgenössische Technische Hochschule Zürich (ETHZ2), with coefficients of determination slightly lower than 0.6. This poor performance can be explained because runoff was obtained directly from RCM output. Model runs for the RCP scenarios (ISIMIP project) were produced by the hydrological model PCRGLOBWB. They show better performance, with coefficients of determination close to 0.7, but they reveal significant bias for low runoff. The discrepancies obtained in the comparison suggest that bias correction is necessary to overcome this very large model uncertainty. Using the monthly series of individual models without bias correction would imply significant distortion in the regulation provided by reservoirs in each basin. The ratio between reservoir storage capacity and mean annual flow would change for each model run, affecting the evaluation of the regulation capacity provided by the reservoirs. For this reason, runoff derived from RCM results and from PCRGLOBWB was corrected for bias in each location. The chosen method for bias correction was linear scaling [45]. This method is justified by data availability, because GRDC only provides monthly long-term means of runoff. Therefore, all model projections for the historical period have the same mean.
The number of model runs compiled for the long-term climate change projection was 35: eight model runs corresponding to the A2 scenario, four model runs corresponding to the B2 scenario, three model runs for the A1B scenario, five model runs for RCP-2 scenario, five model runs for RCP-4 scenario, five model runs for RCP-6 scenario and five model runs for RCP-8 scenario. The windows of analysis in the long-term projection overlap for the years 2070–2099. These projections were corrected for model bias by applying the same correction as in the corresponding model in the historical period. This ensemble of climate projections was put together from different projects developed over a 15-year period, running a range of global climate models under two sets of emission scenarios, and applying different methodologies. It can thus be considered a representative description of the range of scenarios that climate change science is projecting for the region. However, it should be noted that runoff projections derived from climate models are uncertain. Climate models provide a good overall representation of climate, but their performance degrades at the scale of individual grid boxes, indicating that they are not skillful at their smallest scale. The performance of RCMs generally improves after suitably removing bias. However, model errors still remain large, particularly for climatic variables relevant for hydrology, like precipitation or runoff [46]. Given this inherent uncertainty, a basic hypothesis of this work is that water management decisions based on the global analysis of a wide range of projections produces better results than decisions based on a very detailed analysis of a reduced number of projections.
The average annual runoff obtained from GRDC in the period 1960–2000 was also used to characterize the basins under analysis. The relationship between Specific Runoff and reservoir Residence Time is plotted in Figure 4 for all Hydro1k basins in Southern Europe, highlighting the 16 basins under analysis. As can be seen in Figure 4, there is a clear relation between both variables, with larger values of storage corresponding to basins with lower values of specific runoff. The selected basins produce a good coverage of the possible range of behaviors found in the region, from basins with large specific water resources and low storage capacity like Arno, Po or Loire, to others in the opposite situation with very low water resources and large storage volumes as Júcar, Guadiana or Segura.

2.4. Water Availability Analysis

The study is based on the analysis of how climate change affects water availability in the different basins, and how this affect is modified by available reservoir storage. Potential Water Availability ( PWA ) is defined as the annual water demand that can be satisfied in a point of the drainage network with a given reliability. PWA depends on the mean and variability of the streamflow series, the storage available for flow regulation, the monthly distribution of the demand and the reliability indicator adopted in the analysis. In this study, PWA was estimated with the Water Availability and Adaptation Policy Analysis (WAAPA) model [31,47]. WAAPA simulates the operation of a complex water resources system with many reservoirs. The basic topological unit of WAAPA is the river network. The main components are inflows, reservoirs and demands, all linked to nodes in the network. WAAPA computes the amount of water supplied to demands from a system of reservoirs accounting for ecological flows and evaporation losses. Input data for WAAPA are monthly inflows in relevant points of the river network, monthly demand values, and reservoir data. Reservoirs are described by monthly maximum and minimum capacity, storage-area relationship, monthly rates of evaporation, and monthly required environmental flow. WAAPA applies an algorithm with simple operating rules, where all reservoirs in the basin are jointly managed to satisfy the set of demands, drawing water preferably from reservoirs located upstream. This algorithm is applied to potential demands located in every node in the river network, and therefore water availability is obtained for the entire river network. The main results of WAAPA are time series of monthly volumes supplied to each demand, monthly storage values and monthly values of spills, environmental flows, and evaporation losses in every reservoir. From this output, demand reliability can be computed for the criterion of choice (volume reliability, time reliability at the monthly or annual scale, or more complex criteria).
WAAPA can obtain PWA for a given demand reliability criterion through an iterative scheme that changes local demand values until the reliability criterion is met with a given precision. In this study, PWA is estimated by considering only one type of demand in the system, with constant monthly distribution. This choice was made because the true monthly distribution of demands in each model node is unknown. Results therefore should be considered only approximate and could be fine-tuned if the ratio between urban and irrigation demand was known in every model node. Ecological flows were specified as the 10% percentile of the monthly marginal distribution of natural flows. System performance is evaluated as gross volume reliability. PWA is obtained for 92% volume reliability. This reliability level was chosen as an intermediate value between reliabilities required from urban demands (usually close to 100%) and those required from irrigation demand (usually close to 90%), assuming an approximate distribution of 20% urban demand and 80% irrigation demand, which is typical of Portugal, Spain, and Greece [48].

3. Results and Discussion

The WAAPA model was run for the European Mediterranean region for the 16 hydrologic scenarios corresponding to the historical period (1960–2000) and for the 35 hydrologic scenarios corresponding to climate projections for the long-term time horizon 2070–2100. The long-term time horizon was chosen for two reasons. Firstly, the results from PRUDENCE project were only available for this time horizon. Secondly, the changes in the long-term time horizon are usually more accentuated than in the mid-term time horizon and the effects are more apparent. Results were obtained for all catchments in the Hydro1k dataset, but, for the sake of simplicity, we only present global results for the 16 basins under analysis. We first analyze the climate projections, then we present the results obtained for PWA in the basins. Average values of these results are summarized in Table 2 and presented and discussed in detail in the following section. Finally, the role of storage is studied through a sensitivity analysis.

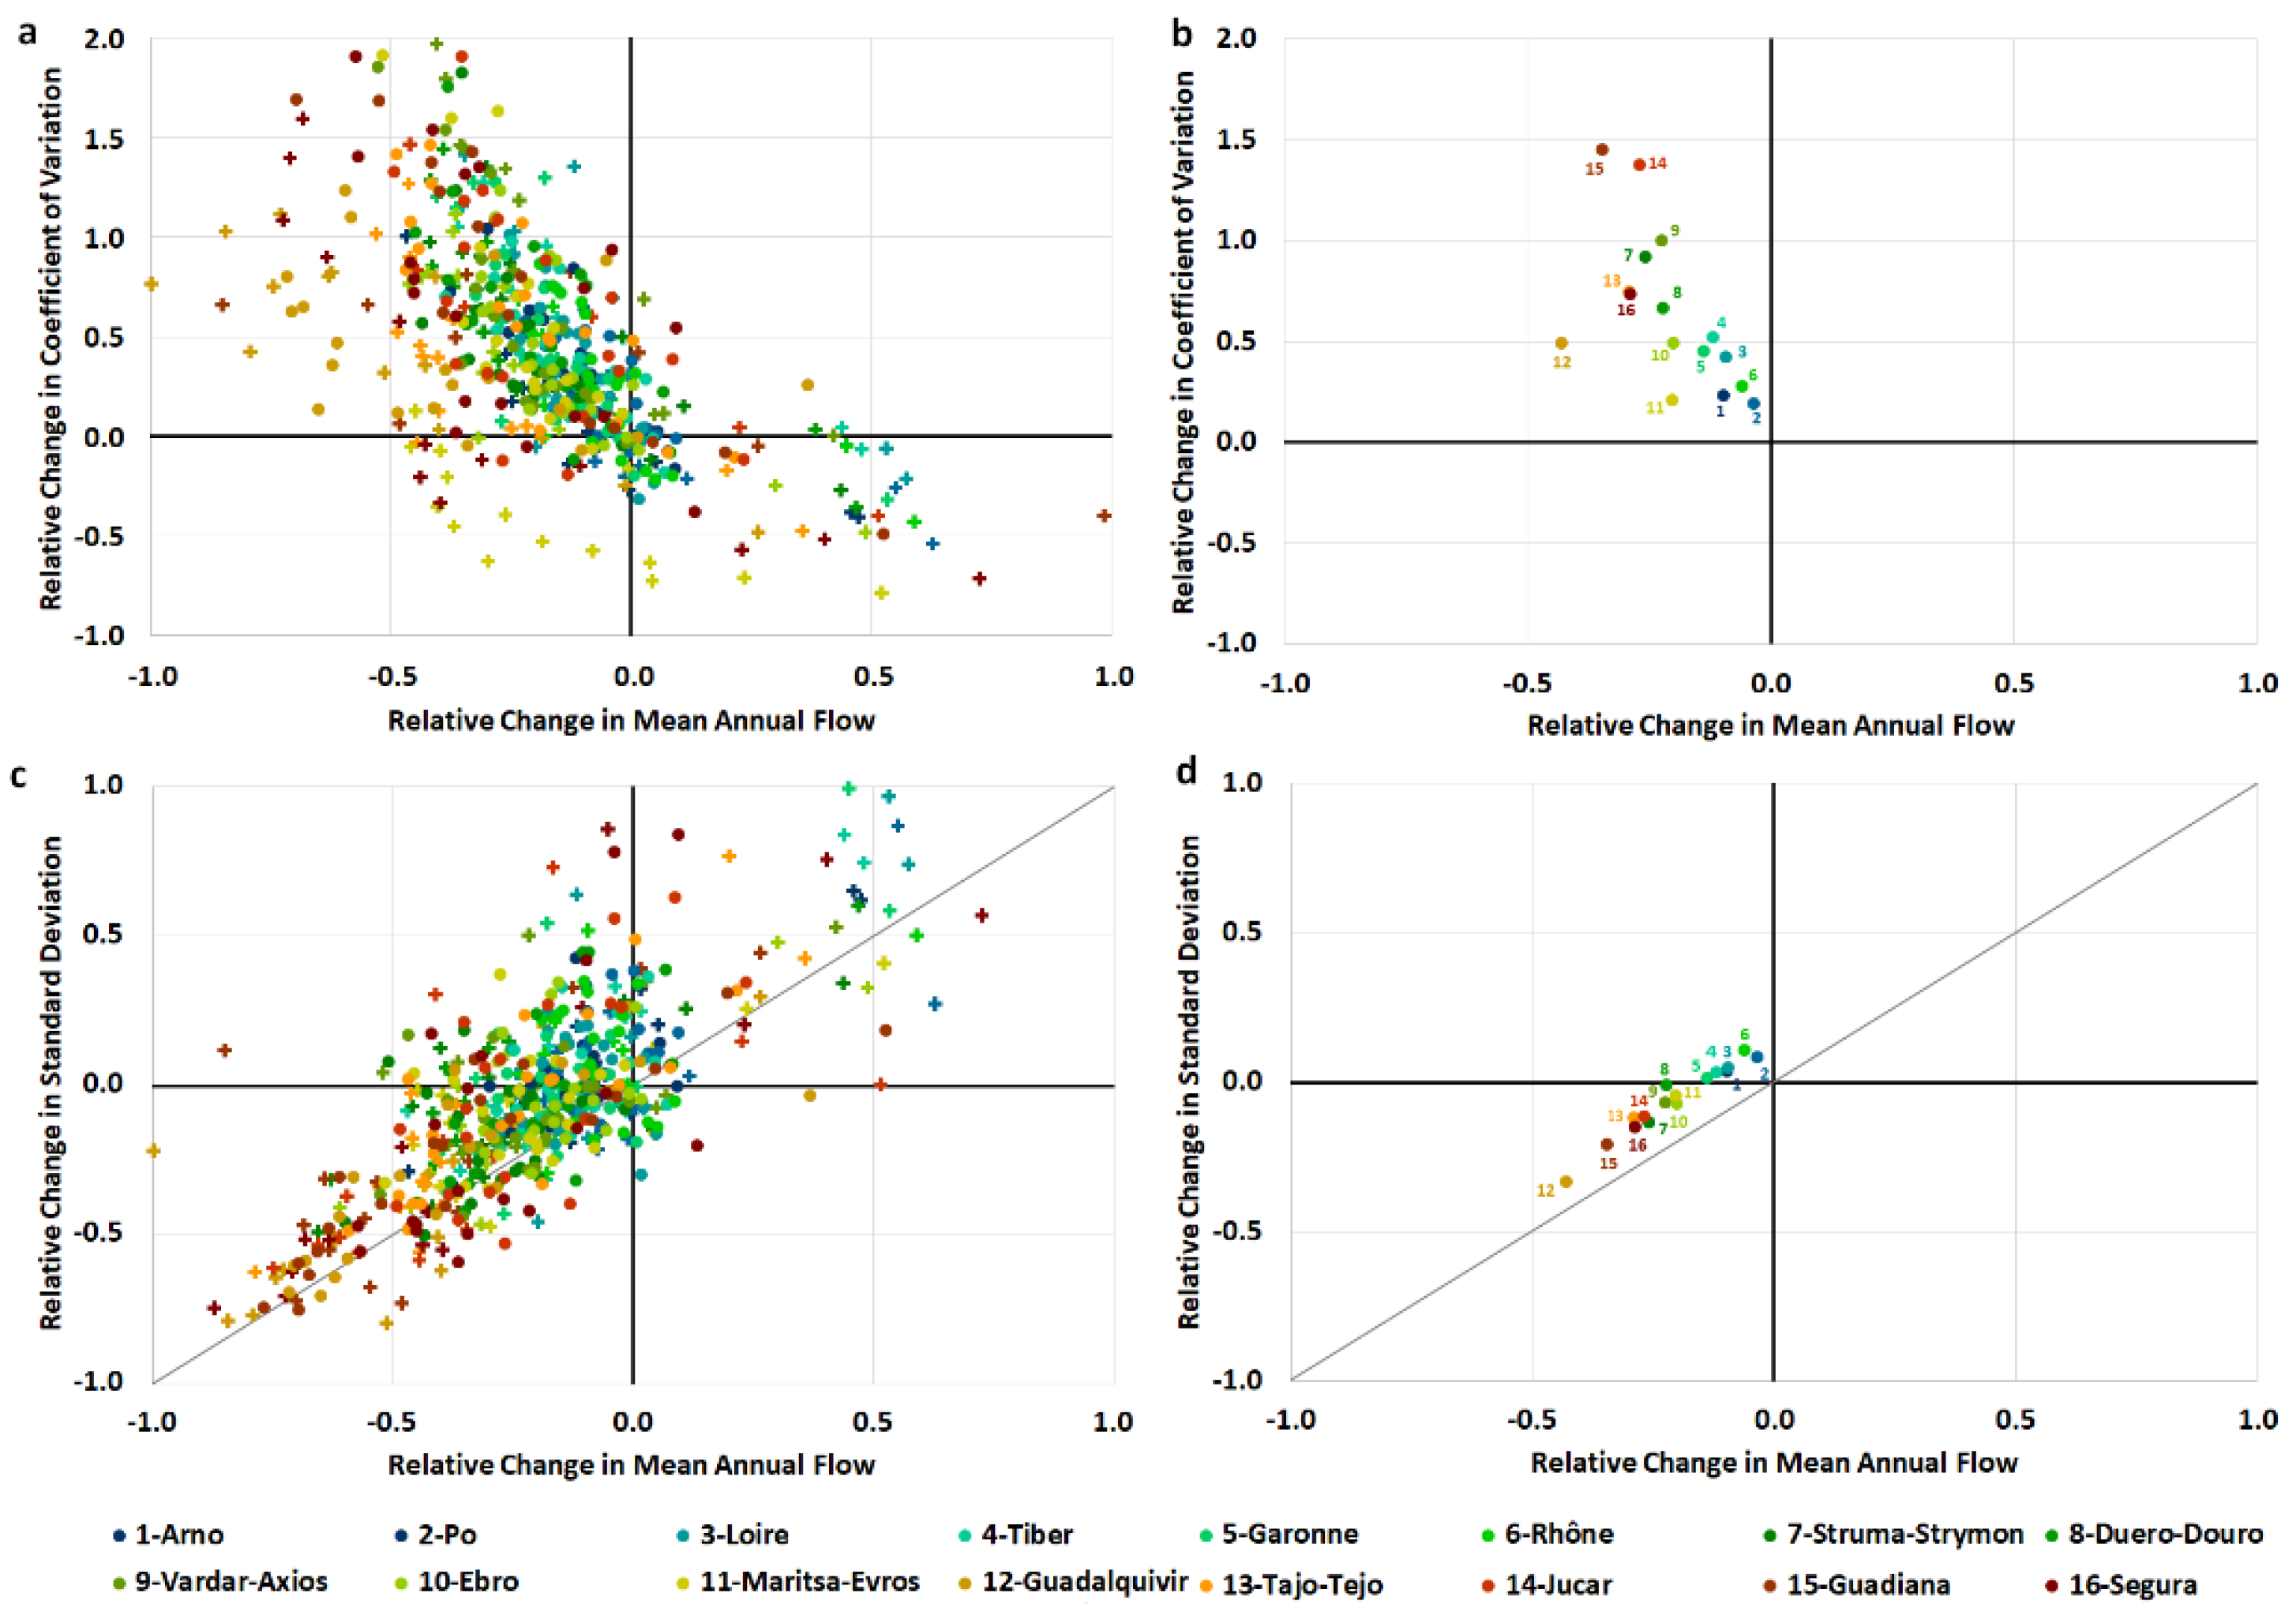
3.1. Climate Projections

We first present the characterization of climate projections for the basins under study. Climate projections were taken from the runoff variable of RCM models in the PRUDENCE and ENSEMBLES projects (under SRES emission scenarios) and of the PCRGBLOBWB hydrologic model (under RCP emission scenarios). Mean and coefficient of variation of annual flows were computed for each basin during the historical period and during the long-term projection. Changes in the long-term projection were estimated taking the control period as a reference, applying the following expressions:
Δ F = F PROJ F HIST F HIST   ;   Δ SD = SD PROJ SD HIST SD HIST   ;   Δ CV = CV PROJ CV HIST CV HIST  
where F is Mean Annual Flow, SD is the Standard Deviation of the annual time series of streamflow, and CV is the Coefficient of Variation of the annual time series of streamflow (standard deviation of the annual time series divided by mean annual flow). The sub-indices HIST and PROJ refer to the historical period and to the long-term projection.
The results are depicted in Figure 5, which compares the relative changes in Standard Deviation ( Δ SD ) and Coefficient of Variation ( Δ CV ) of annual flows versus changes in Mean Annual Flow ( Δ F ) for the 35 available projections in the 16 basins under study. All projections are shown together in the left plots of Figure 5, showing for basins the same color codes as in Table 1 and Figure 1. The plots on the right show the mean value for each basin. A plot of each basin is available in the Supplementary Materials, showing individual projections. Projections under SRES emission scenarios are represented as plus signs and projections under RCP scenarios are represented as circles. The analysis of chart (a) of Figure 5 shows positive correlation between changes in Mean Annual Flow Δ F and Standard Deviation Δ SD . If the changes of F and SD were similar, the scatter plot of Figure 5a would be centered around the main diagonal (highlighted in grey). The mean values of changes are above the main diagonal for all basins, suggesting a relative increase of variability in future projections. The joint analysis of all projections for all basins in chart (c) of Figure 5 shows negative correlation between changes in Mean Annual Flow Δ F and Coefficient of Variation Δ CV : reduction of F and increase of CV . The general shape of the scatter plot is similar in all basins in Southern Europe. This has clear implications for water management since both factors will negatively impact water availability. This tendency is stronger for basins with larger residence times that, as seen in Figure 4, are located in water scarce regions, already facing strong hydrologic irregularities. The dispersion of results is stronger for basins with larger residence times, presenting an additional challenge for water management. The ensemble of projections, jointly considered, suggests that water managers should be ready to cope with less abundant and more variable water resources in the future. Given the large dispersion of results, water managers should also be ready to deal with greater year-on-year variability or extreme events than in the past. Figure 5 also shows that expected changes in CV are much larger than changes in F , with many basins reaching extreme values close to 2 (a 100% increase). The basins showing more extreme projections are Guadalquivir, Júcar and Guadiana.

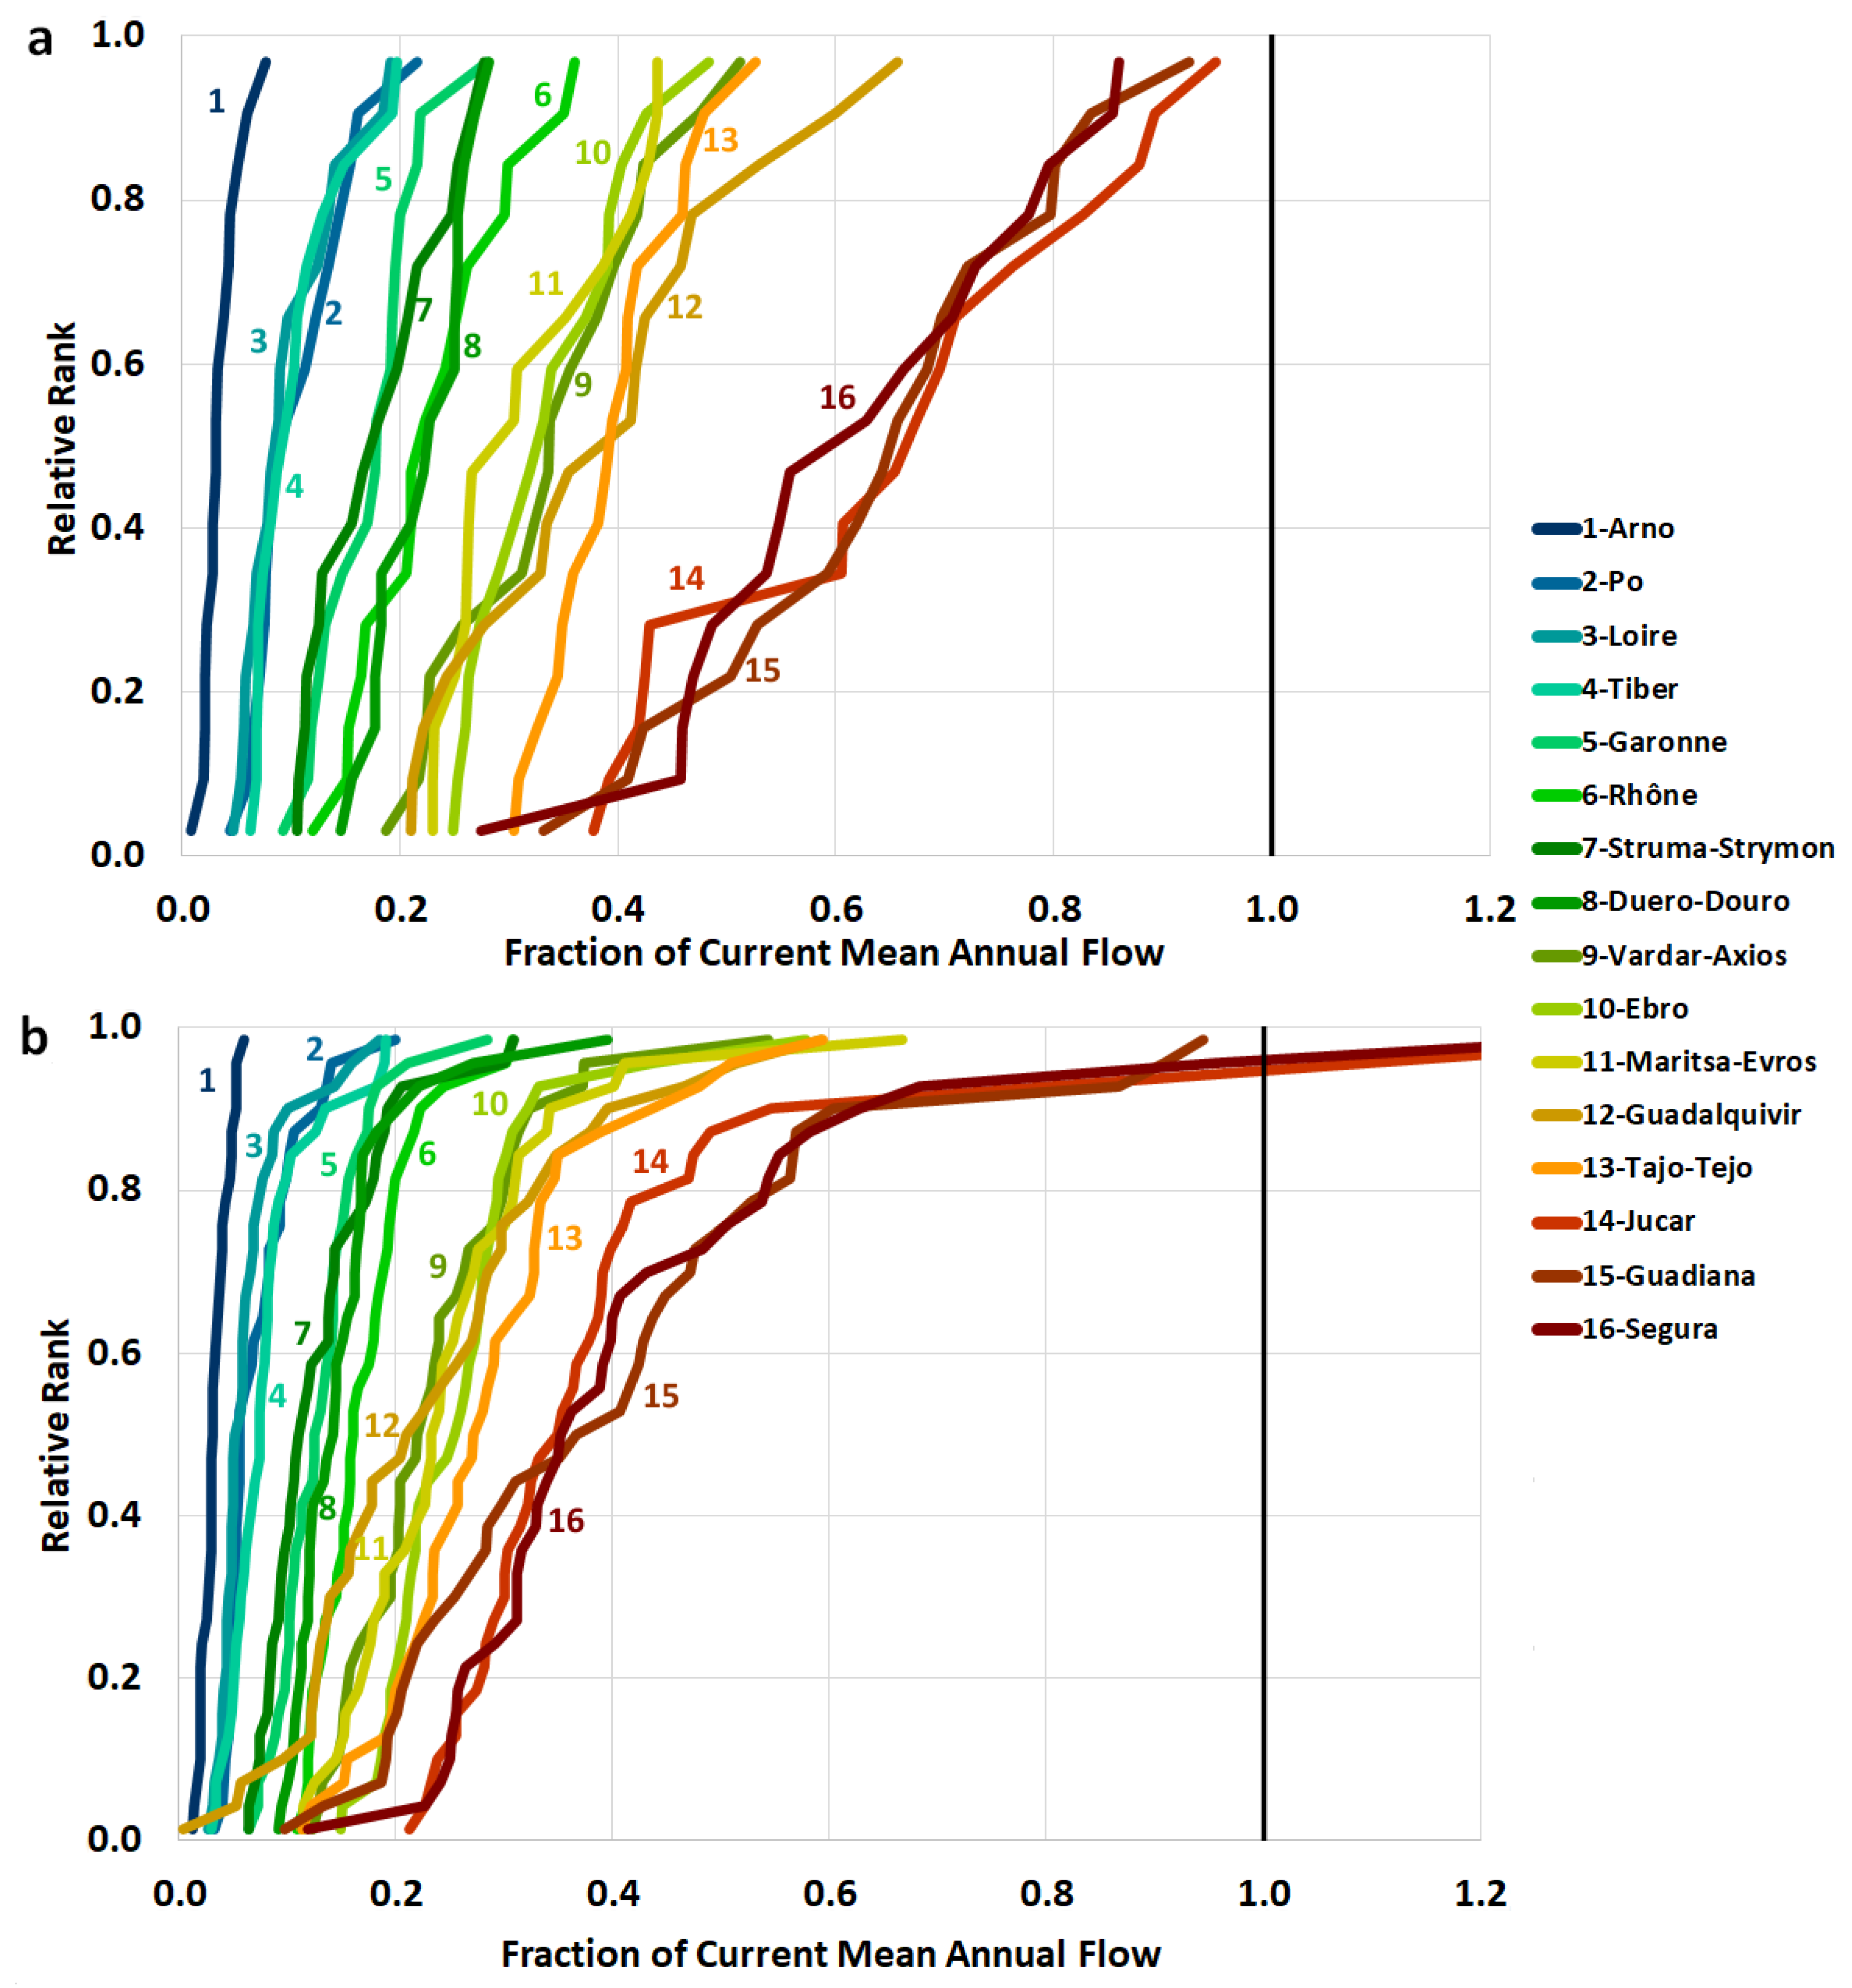
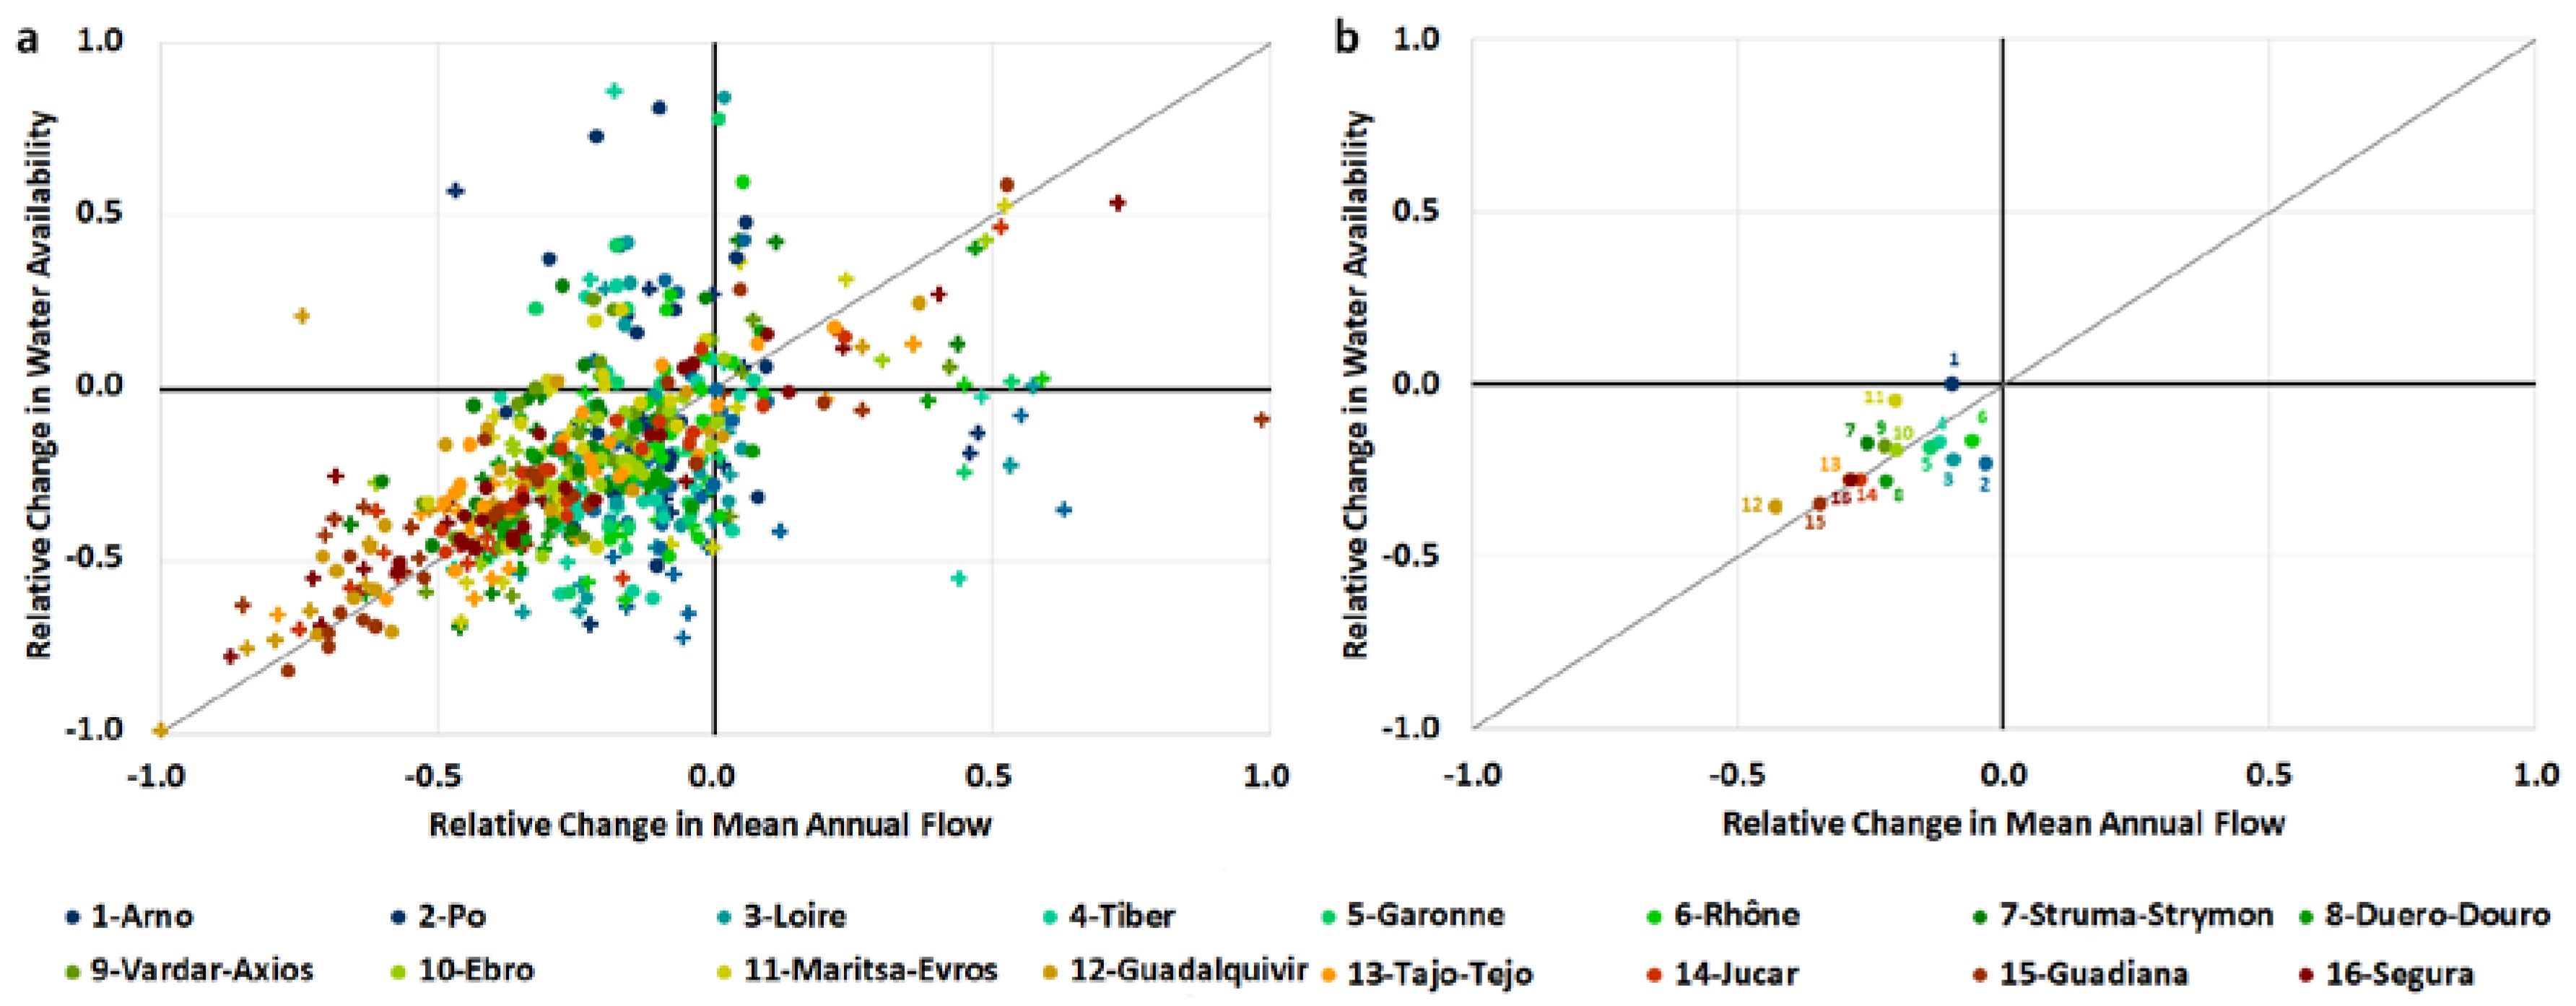
3.2. Water Availability

The WAAPA model was used to compute Potential Water Availability ( PWA ) for the historical period and for the long-term projection in the 16 basins under analysis. The results are shown in Figure 6, which presents the value of PWA obtained in each basin as a function of the relative rank of the corresponding projection. All 35 projections were used to prepare this figure, thus mixing projections under SRES and RCP emission scenarios. An individual plot of each basin is included in the Supplementary Materials, where the joint distribution is compared to the distributions of both sets of emission scenarios. The corresponding emission scenario is identified for each model run available in the long-term projection. These plots show that there is no clear correlation between the emission scenario and the projected PWA . Values corresponding to different emission scenarios are mixed and the most extreme scenarios (A2 and RCP-8) do not always produce the minimum values for PWA .
PWA is expressed as a fraction of Mean Annual Flow ( F ) in the historical period. Results for the historical period are shown in the upper chart (a) and results for the long-term projection are shown in the lower chart (b). If all model runs were assumed equiprobable, this plot would correspond to the empirical estimation of the probability distribution function of PWA expected in each basin. The results show that the relative value of PWA to F tends to be larger for basins with larger storage capacity, both in the historical and in the projection periods. This fact clearly illustrates the effectiveness of reservoir storage to increase water availability. The plots also show large uncertainty in the estimation of PWA . For the historical period, this result is remarkable because historical time series were corrected for bias with respect to the GRDC estimation of F and therefore all had the same Mean Annual Flow. The uncertainty in PWA reflects model uncertainty because the differences in PWA can only be attributed to the differences in the seasonal and interannual variability of the time series produced by each model run. Unfortunately, the skill of the models to reproduce current hydrological irregularity cannot be evaluated because there are no available regional data sets for Southern Europe on interannual naturalized streamflow variability.
Except in the Arno basin, PWA is expected to decrease significantly in the long-term projection with respect to the historical period, with average reductions between 15% and 35%. These reductions are the consequence of reduced F and increased CV . The most significant reductions are projected for the basins of South Western Europe: Guadiana and Guadalquivir (35% on average) and Duero (28% on average). The uncertainty of PWA in the long-term projection is larger than that in the historical period due to the additional variability introduced by emission scenarios. However, the large model uncertainty hinders the interpretation of results obtained for different emission scenarios.
The estimated changes in PWA are compared to estimated changes in F in Figure 7 and Figure 8. Figure 7 shows the scatter plot of changes in both variables for the set of emission scenarios analyzed in all basins. A plot of each basin is available in the Supplementary Materials, showing individual projections. Projections under SRES emission scenarios are represented as plus signs and projections under RCP scenarios are represented as circles. Figure 8 shows the comparison of the estimated probability distributions of F and PWA . All 35 projections were used to prepare this figure, thus mixing projections under SRES and RCP emission scenarios. An individual plot of each basin is included in the Supplementary Materials, where the joint distribution of PWA is compared to the distributions of both sets of emission scenarios.
In Figure 7 and Figure 8, the changes of F are estimated from the first expression shown in Equation (1). The changes of PWA are similarly estimated from the comparison of values obtained in the long-term projection and the control period for the same model, applying the following expression:
Δ PWA = PWA PROJ PWA HIST PWA HIST  
where PWA is Potential Water Availability and the sub-indices HIST and PROJ refer to the historical period and to the long-term projection.
The mean values plotted in chart (b) of Figure 7 reveal that basins with small storage capacity (Po, Loire, Tiber, Garonne and Rhône) show a larger reduction of PWA than the reduction of F . The Arno basin is the exception, with no reduction of PWA despite a small average reduction of F . The basins with larger storage capacity, in general, show a smaller reduction of PWA than the reduction of F . Struma-Strymon, Vardar-Axios, Ebro, Maritsa-Evros, Guadalquivir, Tajo-Tejo, Júcar, Guadiana and Segura belong to this group. Duero-Douro is an exception, with larger reduction of PWA than of F . This may be explained because Duero-Douro shows the largest difference between change in F and change in SD . The wide scatter of changes in F and PWA in chart (a) of Figure 7 shows that there is no exact relation between changes in Mean Annual Flow ( Δ F ) and changes in Potential Water Availability ( Δ PWA ). For individual projections, changes in PWA may be larger, equal or smaller than changes in F . This is, in part, a consequence of changes in hydrologic variability, which may explain why negative changes in F produce positive changes in PWA and vice versa. However, the comparison of Figure 5 and Figure 7 shows that changes in hydrologic variability alone cannot explain the diversity of behaviors seen in Figure 7. Hydrologic variability is measured in terms of Coefficient of Variation of annual flows and is therefore referred to interannual variability. Basins with small storage capacity show a behavior more exposed to changes in CV because, for them, water availability is almost directly determined by short-duration dry periods of the streamflow series. These dry periods show a large variability among model runs, which explains the variability observed in values of PWA . As basin storage grows larger, the reservoirs attenuate the effect of short-duration dry periods and the interannual variability becomes less important. Basins with storage capacity larger than mean annual flow show a much less sensitivity to changes in the coefficient of variation of mean annual flows.
Figure 8 is useful to analyze the effect of the uncertainty on emission scenarios. The estimated probability distributions shown in Figure 8 reveal a wide range of behaviors. The basins were classified in five groups (A1, A2, A3, B1 and B2), according to the relative value of the distributions of changes in F and PWA . Group A1 is integrated by basins where the distribution of expected reductions in PWA is to the left of the distribution of expected reductions in F , suggesting that the availability of reservoir storage tends to dampen the effect of climate change. Struma-Strymon, Vardar-Axios, Guadalquivir and Tajo belong to this group. In the second group, A2, the distributions of expected changes in F and PWA are very similar. This group is formed by Ebro, Júcar and Segura. The only basin in Group A3 (Douro-Duero) presents larger expected reductions in PWA than in F . In group B, the probability distributions of F and PWA cross each other. In group B1, the distribution of changes in PWA is to the left of the distribution of changes in F for low probability values. For high probability values, the distribution of changes in PWA is to the right of the distribution of changes in F . This results in larger uncertainty for changes in PWA than in F . This effect may be due to increased exposure to changes in variability due to lack of regulation storage. Arno, Po, Loire, Tiber, Garonne, Rhône and Maritsa-Evros belong to group B1. The only basin in group B2 is Guadiana, where the distribution of changes in PWA is to the right of the distribution of changes in F for low probability values and to the left for high probability values. Guadiana shows less uncertainty in changes of PWA than in changes in F , due to its large reservoir storage.
A remarkable effect shown in Figure 8 is that the uncertainty regarding changes in F (gray line) seems to grow as specific storage grows. The larger spreads of the estimated probability distributions appear in basins with larger specific storage, in the bottom row. Basins with comparatively smaller storage capacity, in the first row, show much less uncertainty on changes in F . This shows that reservoir storage was developed where it was required: in basins with large hydrologic variability. Furthermore, the difference in uncertainty between changes in F and changes in PWA , which is large in basins with small storage, is progressively reduced as specific storage increases.

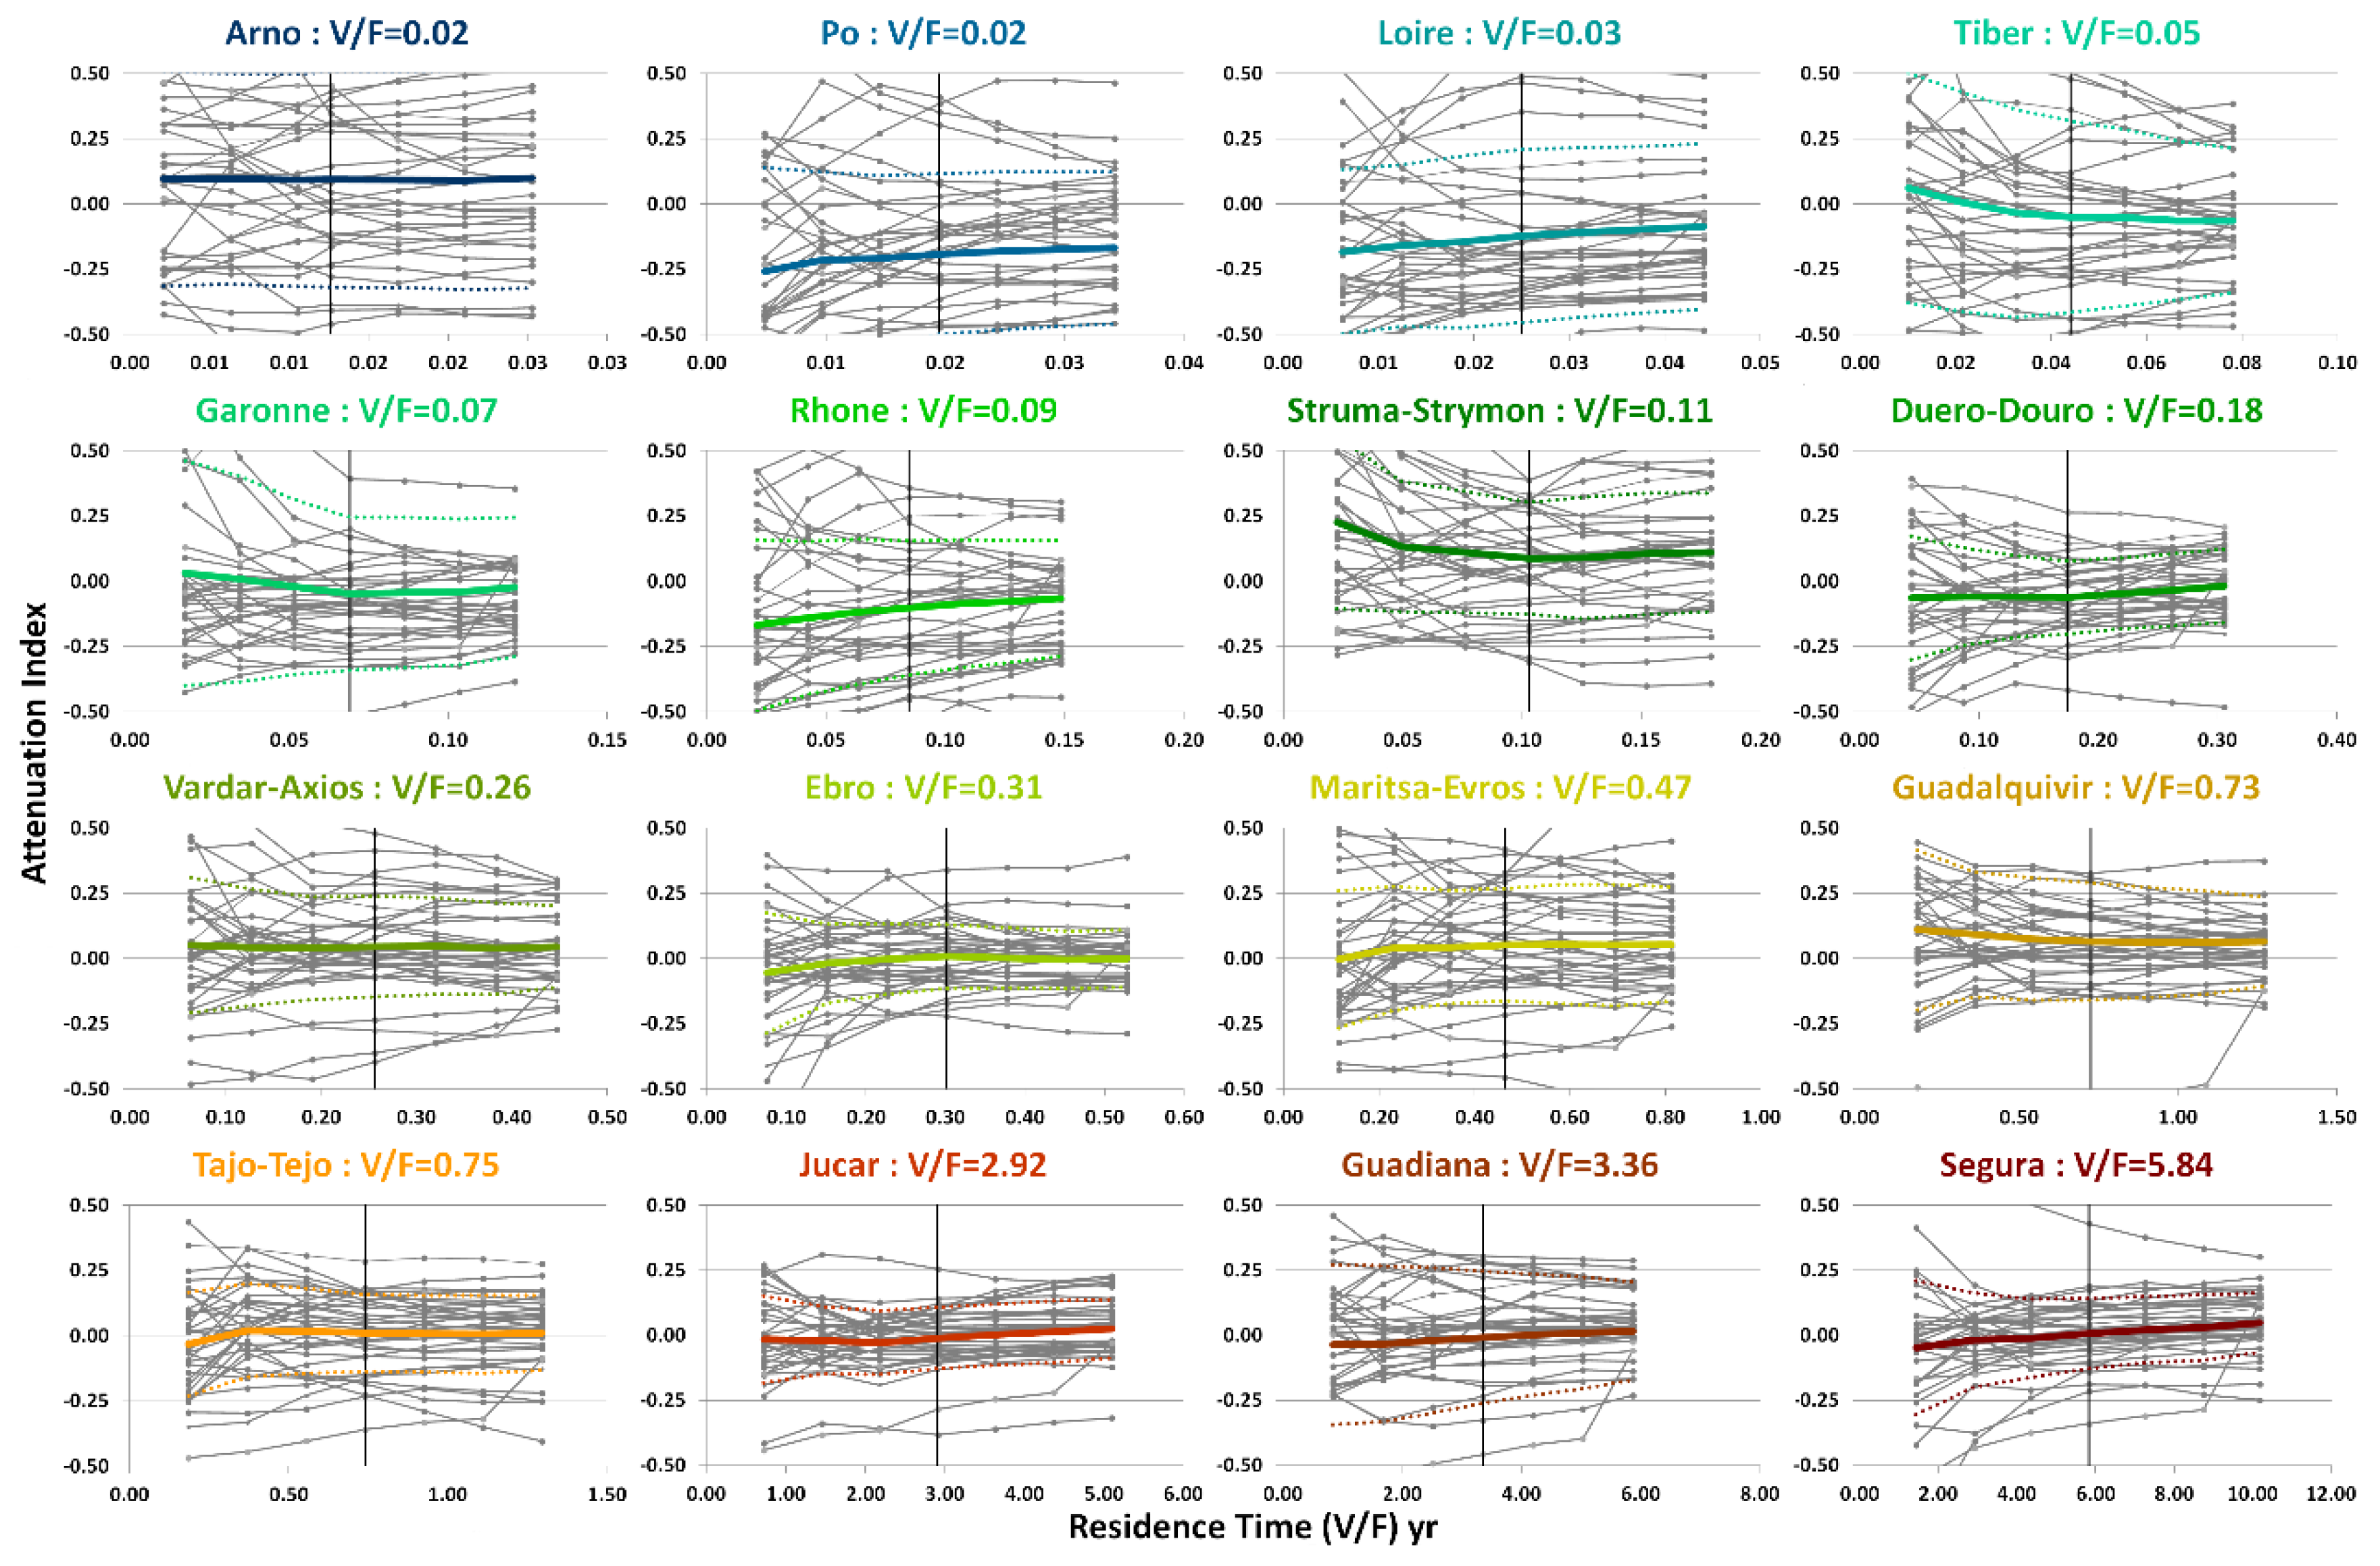
3.3. The Influence of Storage

The results obtained in Section 2.2 suggest that reservoir storage plays a relevant role in controlling how projected changes in Mean Annual Flow may be translated into changes in Potential Water Availability. However, the large variability of local conditions in the studied basins introduces uncertainties in the analysis. In this section we further explore the influence of reservoir storage on changes in water availability through a sensitivity analysis that discounts for local conditions. We repeated the water availability analysis but considering different storage volumes in each basin. Potential Water Availability was computed in current and future scenarios in the 16 basins, assuming changing reservoir volumes of 25%, 50%, 75%, 100%, 125%, 150% and 175% of current storage. Storage was proportionally reduced or increased in the same location of existing reservoirs. This choice was made for convenience, without any implications for projected future evolution of storage in the region. In fact, the most likely scenario in the future for European basins is a progressive reduction of available storage due to reservoir sedimentation, with very little additional storage being built. Figure 9 shows the scatter plots of changes in F versus changes in PWA for four basins covering a wide range of values of reservoir storage: Loire (V/F = 0.03), Ebro (V/F = 0.30), Guadalquivir (V/F = 0.73) and Guadiana (V/F = 3.35). Individual plots for all basins are included in the Supplementary Materials. Projections under SRES emission scenarios are represented as diamonds and projections under RCP scenarios are represented as circles. Results shown in Figure 9 reveal that the dispersion of the scatter plot gets reduced as the storage capacity is increased. This effect is more marked for the Guadiana basin, which has the largest reservoir storage.
In order to assess the global behavior, the values obtained for changes in F and PWA were classified according to the relative rank of the corresponding projection, obtaining an empirical estimate of their probability distributions, under the assumption that all scenarios analyzed are equally likely. The results are shown in Figure 10, which presents the estimate of the probability distribution of changes in Mean Annual Flow ( Δ F , blue line) and changes in Potential Water Availability ( Δ PWA ) for different storage values in colored lines from brown (25% of current storage volume) to green (175% of current reservoir storage). The basins analyzed showed variable sensitivity to storage. Some basins, like Arno, Ebro, Maritsa-Evros or Guadiana, showed very little sensitivity to storage capacity because the distributions of expected changes of PWA are very similar. Other basins, like Po, Tiber, Rhône or Struma-Strymon, presented significant differences in behavior depending on the storage volume assumed. In some of these basins, the estimated probability distributions of changes in PWA for high storage values (green color) were located to the right, indicating less reductions of PWA. Po, Loire, Rhône, Duero-Douro, Ebro, Júcar, Guadiana and Segura show this behavior. For other basins, however, the probability distributions for high storage values were located to the left. Tiber, Struma-Strymon and Guadalquivir belong to this group.
This range of behaviors illustrates the complex relations between hydrologic variability and reservoir storage in determining water availability in climate change scenarios, suggesting that a specific analysis for local conditions is required to translate projections of changes in mean annual flow into projections of changes in water availability in basins with significant storage capacity.
The influence of reservoir storage on the elasticity of water availability was analyzed by computing an attenuation index I A , defined in the following expression:
I A = Δ PWA Δ F
where Δ PWA is the change in Potential Water Availability and Δ F is the change in Mean Annual Flow. As seen in the previous sections, most changes in PWA and F are reductions and therefore Δ PWA and Δ F are negative. A positive value of this index indicates an attenuation of the effect of climate change: the absolute value of Δ PWA is smaller than the absolute value Δ F .
We explore how the attenuation index I A changes with reservoir storage. The results are shown in Figure 11, which presents the value of the attenuation index as a function of reservoir storage in each basin for all available projections (thin grey lines), the average values (solid lines in the color code corresponding to the basin) and average values plus and minus one standard deviation (dotted lines in the color code corresponding to the basin). The results show a large variability for individual projections, which translates into large uncertainty for water managers. The variability of the attenuation index appears to be progressively reduced as specific storage grows across basin locations (from top row to bottom row). This suggests that reservoir storage plays a relevant role in reducing uncertainty on the effects of climate change projections on water availability.
The effect of reservoir storage on the variability of the attenuation index I A is further explored by analyzing the uncertainty index I U , defined as:
I U = σ ( Δ PWA ) σ ( Δ F )
where σ ( Δ PWA ) is the standard deviation of the changes in Potential Water Availability for all projections and σ ( Δ F ) is the standard deviation of the changes in Mean Annual Flow for all projections. I U index compares the variability of the projections of changes in water availability to that of the projections of mean flow. A negative value of this index indicates a reduction of the uncertainty of climate change projections: the variability of Δ PWA is smaller than the variability Δ F .
The summary of results found in the analysis of the I A and I U indices is shown in Figure 12. Chart (a) of Figure 12 compares the average of the values of the I A index obtained in the sensitivity analyses of reservoir storage for all basins. Chart (b) of Figure 12 represents the corresponding values of the I U index.
The plots shown in Figure 12 indicate that increased reservoir storage results in larger values of the attenuation index I A in most basins and smaller values of the uncertainty index I U in all basins. The results for the attenuation index are less conclusive than those for the uncertainty index. Out of the 16 basins analyzed, I A is observed to decrease with increasing reservoir storage in four basins: Tiber, Garonne, Struma-Strymon and Guadalquivir. In the case of Garonne and Struma-Strymon, the decrease only covers the range from 25% to 100% of current reservoir storage. For storage volumes between 100% and 175% of current reservoir storage I A is increasing with increasing reservoir storage. The case of Tiber basin may be explained because reservoirs only cover 12% of the contributing area and therefore 88% of the flow is unregulated. Guadalquivir basin is exposed to the most extreme reduction of Mean Annual Flow (43% on average) and this may have an influence on the observed behavior. In the case of the uncertainty index, the reduction with increasing storage is observed for all basins. These results are valid for the range of storage volumes explored in the sensitivity analysis in each basin individually and for all basins as a whole, regardless of basin size and location in Southern Europe, and therefore show a clear picture of the role played by reservoir storage in attenuating the impact of reduced streamflow on water availability and on reducing the uncertainty of climate change projections. It is unlikely that reservoir storage will be further increased in Southern Europe. Most basins already have an adequate amount of storage and additional storage capacity would not increase water availability in a scenario of decreasing resources. However, water managers should be aware that proper management of currently available storage will be helpful to address the challenges posed by climate change.

4. Conclusions

Projected changes in hydrologic regime and water availability were analyzed in 16 basins in Southern Europe applying the WAAPA model to streamflow time series obtained from 35 climate projections under 7 emission scenarios. The analysis of climate projections concluded that a significant reduction of mean annual flow can be expected in most basins. The reduction in the mean is supplemented by a strong increase in the coefficient of variation, due to an increase of the variability of the projected series. This analysis is uncertain due to the very large variability introduced by the different models and emission scenarios examined. The overall result implies a corresponding reduction in potential water availability, with variable results across basins depending on hydrologic regime and reservoir storage. Basins with large storage values showed reductions of water availability comparable to the reductions of mean annual flow. Basins with small storage capacity showed a larger reduction of water availability than the reduction of mean annual flow. Although model and emission scenario uncertainties are larger than the expected reduction of water availability, a consistent picture emerges from the joint analysis of all projections, requiring significant adaptation measures to compensate for the projected reduction of water availability.
The influence of reservoir storage on basin response to climate change was studied through a sensitivity analysis where current reservoir storage was modified to examine its effects on water availability with values ranging from 25% to 175% of current storage values. The results showed very large variability, which illustrates the complex interplay between hydrologic regime, reservoir storage and water availability. Two indices were introduced to clarify the overall behavior: the attenuation index and the uncertainty index. The attenuation index compares the changes in water availability to the changes in mean annual flow. Positive values of this index indicate an attenuation of the impact of climate change projection on water availability. The uncertainty index compares the variability of changes in water availability and in mean annual flow. Positive values of this index indicate a reduction of the uncertainty of climate change projections on water availability. The results of the sensitivity analysis showed that increasing reservoir storage attenuates the reduction of water availability and reduces the uncertainty of climate projection. The results are valid for each individual basin within the range of storage volumes examined and for the set of 16 Southern European basins analyzed in this work. The effect observed for reservoir storage is a positive factor for system managers since decisions become harder as uncertainty grows. This feature would allow water managers to develop suitable policies to mitigate the impacts of climate change, thus enhancing the resilience of the system.

Supplementary Materials

The following are available online at https://www.mdpi.com/2073-4441/13/1/85/s1: High resolution images of Figure 1, Figure 2, Figure 3, Figure 4, Figure 5, Figure 6, Figure 7, Figure 8, Figure 9, Figure 10, Figure 11 and Figure 12 and individual plots for each basin in Figure 5, Figure 6, Figure 7, Figure 8, Figure 9, Figure 10 and Figure 11.

Author Contributions

Conceptualization, L.G., A.G. and A.S.-W.; methodology, A.G.; data processing, B.P.-B.; software, L.G. and B.P.-B.; validation, A.S.-W., A.G. and L.G.; writing—original draft preparation, A.G.; writing—review and editing, L.G.; visualization, A.S.-W.; supervision, L.G. All authors have read and agreed to the published version of the manuscript.

Funding

This research was funded by the Spanish Ministry of Science and Innovation, grant number PID2019-105852RA-I00: “Simulation of climate scenarios and adaptation in water resources systems (SECA-SRH)”. B.P.-B. would like to acknowledge Universidad Técnica de Ambato for the financial support through its doctoral student mobility program (award No. 1886-CU-P-2018 Resolución HCU).

Acknowledgments

Data from the PRUDENCE and ENSEMBLES projects were used in this work. PRUDENCE was funded by the EU FP5 (EVK2-CT2001-00132) and ENSEMBLES was funded by the EU FP6 (contract No. 505539). Support from both projects is gratefully acknowledged. Moreover, the authors acknowledge the World Climate Research Programme’s Working Group on Regional Climate, and the Working Group on Coupled Modelling, former coordinating body of CORDEX and responsible panel for CMIP5; and also thank the climate modelling groups for producing and making available their model output. Finally, the authors also acknowledge the Earth System Grid Federation infrastructure an international effort led by the U.S. Department of Energy’s Program for Climate Model Diagnosis and Intercomparison, the European Network for Earth System Modelling and other partners in the Global Organisation for Earth System Science Portals (GO-ESSP).

Conflicts of Interest

The authors declare no conflict of interest. The funders had no role in the design of the study; in the collection, analyses, or interpretation of data; in the writing of the manuscript, or in the decision to publish the results.

References

  1. IPCC. Climate change 2014: Impacts, adaptation and vulnerability. Part A: Global and sectoral aspects. In Contribution of Working Group II to the Fifth Assessment Report of the Intergovernmental Panel on Climate Change; Field, C.B., Barros, V.R., Dokken, D.J., Mach, K.J., Mastrandrea, M.D., Bilir, T.E., Chatterjee, M., Ebi, K.L., Estrada, Y.O., Genova, R.C., et al., Eds.; Cambridge University Press: Cambridge, UK; New York, NY, USA, 2014; p. 1132. [Google Scholar]
  2. Garrote, L. Managing Water Resources to Adapt to Climate Change: Facing Uncertainty and Scarcity in a Changing Context. Water Resour. Manag. 2017, 31, 2951–2963. [Google Scholar] [CrossRef]
  3. Arnell, N.W. The effect of climate change on hydrological regimes in Europe: A continental perspective. Glob. Environ. Chang. 1999, 9, 5–23. [Google Scholar] [CrossRef]
  4. Arnell, N.W. Effects of IPCC SRES* emissions scenarios on river runoff: A global perspective. Hydrol. Earth Syst. Sci. 2003, 7, 619–641. [Google Scholar] [CrossRef] [Green Version]
  5. Vörösmarty, C.J.; McIntyre, P.B.; Gessner, M.O.; Dudgeon, D.; Prusevich, A.; Green, P.; Glidden, S.; Bunn, S.; Sullivan, C.A.; Liermann, C.R.; et al. Global threats to human water security and river biodiversity. Nat. Cell Biol. 2010, 467, 555–561. [Google Scholar] [CrossRef]
  6. Krysanova, V.; Dickens, C.; Timmerman, J.G.; Varela-Ortega, C.; Schlüter, M.; Roest, K.; Huntjens, P.; Jaspers, F.; Buiteveld, H.; Moreno, E.; et al. Cross-Comparison of Climate Change Adaptation Strategies Across Large River Basins in Europe, Africa and Asia. Water Resour. Manag. 2010, 24, 4121–4160. [Google Scholar] [CrossRef] [Green Version]
  7. García-Ruiz, J.M.; López-Moreno, J.I.; Vicente-Serrano, S.M.; Lasanta–Martínez, T.; Beguería, S. Mediterranean water resources in a global change scenario. Earth-Sci. Rev. 2011, 105, 121–139. [Google Scholar] [CrossRef] [Green Version]
  8. Forzieri, G.; Feyen, L.; Rojas, R.G.; Flörke, M.; Wimmer, F.; A Bianchi, A. Ensemble projections of future streamflow droughts in Europe. Hydrol. Earth Syst. Sci. 2014, 18, 85–108. [Google Scholar] [CrossRef] [Green Version]
  9. Suárez-Almiñana, S.; Solera, A.; Andreu, J.; García-Romero, L. Análisis de incertidumbre de las proyecciones climáticas en relación a las aportaciones históricas en la Cuenca del Júcar. Ing. Agua 2020, 24, 89–99. [Google Scholar] [CrossRef]
  10. Christensen, J.H.; Carter, T.R.; Rummukainen, M.; Amanatidis, G. Evaluating the performance and utility of regional climate models: The PRUDENCE project. Clim. Chang. 2007, 81, 1–6. [Google Scholar] [CrossRef]
  11. Hewitt, C.D.; Griggs, D.J. Ensembles-based predictions of climate changes and their impacts. Eos 2004, 85, 566. [Google Scholar] [CrossRef]
  12. Sordo-Ward, A.; Granados, A.; Iglesias, A.; Garrote, L.; Bejarano, M.D. Adaptation Effort and Performance of Water Management Strategies to Face Climate Change Impacts in Six Representative Basins of Southern Europe. Water 2019, 11, 1078. [Google Scholar] [CrossRef] [Green Version]
  13. Iglesias, A.; Garrote, L.; Flores, F.; Moneo, M. Challenges to Manage the Risk of Water Scarcity and Climate Change in the Mediterranean. Water Resour. Manag. 2007, 21, 775–788. [Google Scholar] [CrossRef]
  14. MMA. White Paper on Water in Spain. In Spanish Ministry of the Environment; MMA: Madrid, Spain, 2000. [Google Scholar]
  15. Berbel, J.; Expósito, A.; Gutiérrez-Martín, C.; Mateos, L. Effects of the Irrigation Modernization in Spain 2002–2015. Water Resour. Manag. 2019, 33, 1835–1849. [Google Scholar] [CrossRef]
  16. Gil-Meseguer, E.; Bernabé-Crespo, M.B.; Gómez-Espín, J.M. Recycled Sewage—A Water Resource for Dry Regions of Southeastern Spain. Water Resour. Manag. 2019, 33, 725–737. [Google Scholar] [CrossRef]
  17. Garrote, L.; Granados, A.; Iglesias, A. Assessing water availability in Europe: A comparative study. In Proceedings of the EWRA Conference 2015, Istanbul, Turkey, 10–13 June 2015. [Google Scholar]
  18. Rippl, W. The Capacity of Storage-Reservoirs for Water-Slpply (Including Plate). Minutes Proc. Inst. Civ. Eng. 2007, 71, 270–278. [Google Scholar] [CrossRef]
  19. Klemeš, V. One hundred years of applied storage reservoir theory. Water Resour. Manag. 1987, 1, 159–175. [Google Scholar] [CrossRef]
  20. Löf, G.O.G.; Hardison, C.H. Storage requirements for water in the United States. Water Resour. Res. 2008, 2, 323–354. [Google Scholar] [CrossRef]
  21. Vogel, R.M.; Lane, M.; Ravindiran, R.S.; Kirshen, P. Storage Reservoir Behavior in the United States. J. Water Resour. Plan. Manag. 1999, 125, 245–254. [Google Scholar] [CrossRef]
  22. Hashimoto, T.; Stedinger, J.R.; Loucks, D.P. Reliability, resiliency, and vulnerability criteria for water resource system performance evaluation. Water Resour. Res. 1982, 18, 14–20. [Google Scholar] [CrossRef] [Green Version]
  23. Vogel, R.M.; Bolognese, R.A. Storage-Reliability-Resilience-Yield Relations for Over-Year Water Supply Systems. Water Resour. Res. 1995, 31, 645–654. [Google Scholar] [CrossRef]
  24. Andreu, J.; Capilla, J.; Sanchís, E. AQUATOOL, a generalized decision-support system for water-resources planning and operational management. J. Hydrol. 1996, 177, 269–291. [Google Scholar] [CrossRef]
  25. Wurbs, R.A. Assessing Water Availability under a Water Rights Priority System. J. Water Resour. Plan. Manag. 2001, 127, 235–243. [Google Scholar] [CrossRef]
  26. Yates, D.; Sieber, J.; Purkey, D.; Huber-Lee, A. WEAP21—A Demand-, Priority-, and Preference-Driven Water Planning Model. Water Int. 2005, 30, 487–500. [Google Scholar] [CrossRef]
  27. McMahon, T.A.; Adeloye, A.J. Water Resources Yield; Water Resources Publications: Highlands Ranch, CO, USA, 2005. [Google Scholar]
  28. McMahon, T.A.; Adeloye, A.J.; Zhou, S.-L. Understanding performance measures of reservoirs. J. Hydrol. 2006, 324, 359–382. [Google Scholar] [CrossRef]
  29. Pulido-Velazquez, M.; Andreu, J.; Sahuquillo, A.; Pulido-Velazquez, D. Hydro-economic river basin modelling: The application of a holistic surface–groundwater model to assess opportunity costs of water use in Spain. Ecol. Econ. 2008, 66, 51–65. [Google Scholar] [CrossRef]
  30. Wurbs, R.A.; Muttiah, R.S.; Felden, F. Incorporation of Climate Change in Water Availability Modeling. J. Hydrol. Eng. 2005, 10, 375–385. [Google Scholar] [CrossRef]
  31. Garrote, L.; Iglesias, A.; Martín-Carrasco, F.J.; Mediero, L. WAAPA: A model for water availability and climate change adaptation policy analysis. In Proceedings of the EWRA International Symposium—Water Engineering and Management in a Changing Environment, Catania, Italy, 29 June–2 July 2011. [Google Scholar]
  32. Georgakakos, A.; Yao, H.; Kistenmacher, M.; Graham, N.; Cheng, F.-Y.; Spencer, C.; Shamir, E. Value of adaptive water resources management in Northern California under climatic variability and change: Reservoir management. J. Hydrol. 2012, 412–413, 34–46. [Google Scholar] [CrossRef]
  33. Alimohammadi, H.; Bavani, A.M.; Roozbahani, A. Mitigating the Impacts of Climate Change on the Performance of Multi-Purpose Reservoirs by Changing the Operation Policy from SOP to MLDR. Water Resour. Manag. 2020, 34, 1495–1516. [Google Scholar] [CrossRef]
  34. He, S.; Guo, S.; Yang, G.; Chen, K.; Liu, D.; Zhou, Y. Optimizing Operation Rules of Cascade Reservoirs for Adapting Climate Change. Water Resour. Manag. 2019, 34, 101–120. [Google Scholar] [CrossRef]
  35. Biglarbeigi, P.; Strong, W.A.; Finlay, D.; McDermott, R.; Griffiths, P. A Hybrid Model-Based Adaptive Framework for the Analysis of Climate Change Impact on Reservoir Performance. Water Resour. Manag. 2020, 34, 4053–4066. [Google Scholar] [CrossRef]
  36. Gorguner, M.; Kavvas, M.L. Modeling impacts of future climate change on reservoir storages and irrigation water demands in a Mediterranean basin. Sci. Total Environ. 2020, 748, 141246. [Google Scholar] [CrossRef] [PubMed]
  37. EROS. HYDRO1k Elevation Derivative Database. Technical Report. Center for Earth Resources Observation and Science (EROS), U.S. Geological Survey (USGS). 2008. Available online: http://eros.usgs.gov/products/elevation/hydro1k.html-97 (accessed on 27 October 2020).
  38. Delliou. The History of the World Register of Dams. International Commission on Large Dams. 2020. Available online: https://www.icold-cigb.org/userfiles/files/CIGB/History%20of%20the%20WRD-PleDelliou.pdf (accessed on 27 October 2020).
  39. González-Zeas, D.; Garrote, L.; Iglesias, A.; Granados, A.; Chavez-Jimenez, A. Hydrologic Determinants of Climate Change Impacts on Regulated Water Resources Systems. Water Resour. Manag. 2015, 29, 1933–1947. [Google Scholar] [CrossRef]
  40. Garrote, L.; Iglesias, A.; Granados, A.; Mediero, L.; Martín-Carrasco, F. Quantitative Assessment of Climate Change Vulnerability of Irrigation Demands in Mediterranean Europe. Water Resour. Manag. 2014, 29, 325–338. [Google Scholar] [CrossRef]
  41. Bejarano, M.D.; Granados, I.; Iglesias, A.; Garrote, L. Blue Water in Europe: Estimates of Current and Future Availability and Analysis of Uncertainty. Water 2019, 11, 420. [Google Scholar] [CrossRef] [Green Version]
  42. Van Beek, L.P.H.; Bierkens, M.F.P. The Global Hydrological Model PCR-GLOBWB: Conceptualization, Parameterization and Verification; Department of Physical Geography, Utrecht University: Utrecht, The Netherlands, 2008; Available online: http://vanbeek.geo.uu.nl/suppinfo/vanbeekbierkens2009.pdf (accessed on 27 October 2020).
  43. Warszawski, L.; Frieler, K.; Huber, V.; Piontek, F.; Serdeczny, O.; Schewe, J. The Inter-Sectoral Impact Model Intercomparison Project (ISI–MIP): Project framework. Proc. Natl. Acad. Sci. USA 2014, 111, 3228–3232. [Google Scholar] [CrossRef] [Green Version]
  44. Fekete, B.M.; Vörösmarty, C.J.; Grabs, W. High-resolution fields of global runoff combining observed river discharge and simulated water balances. Glob. Biogeochem. Cycles 2002, 16, 15-1–15-10. [Google Scholar] [CrossRef]
  45. Tan, Y.; Guzman, S.M.; Dong, Z.; Tan, L. Selection of Effective GCM Bias Correction Methods and Evaluation of Hydrological Response under Future Climate Scenarios. Climate 2020, 8, 108. [Google Scholar] [CrossRef]
  46. Teutschbein, C.; Seibert, J. Bias correction of regional climate model simulations for hydrological climate-change impact studies: Review and evaluation of different methods. J. Hydrol. 2012, 12–29. [Google Scholar] [CrossRef]
  47. Sordo-Ward, A.; Bejarano, M.D.; Granados, I.; Garrote, L. Facing Future Water Scarcity in the Duero-Douro Basin: Comparative Effect of Policy Measures on Irrigation Water Availability. J. Water Resour. Plan. Manag. 2020, 146, 04020011. [Google Scholar] [CrossRef]
  48. Estrela, T.; Marcuello, C.; Dimas, M. Las Aguas Continentales en los Países Mediterráneos de la Unión Europea. CEDEX Report. 2000. Available online: http://hispagua.cedex.es/sites/default/files/aguas_continentales_union_europea.pdf (accessed on 22 December 2020).
Figure 1. Southern European basins considered in this study.
Water 13 00085 g001
Figure 2. Main methodological steps followed in the analysis. White circles show the figures that illustrate results from each step.
Water 13 00085 g002
Figure 3. Comparison of mean annual runoff in catchments produced from the Global Runoff Data Set (GRDC) dataset with that produced by model runs for the historical period.
Water 13 00085 g003
Figure 4. Relation between Specific Runoff ( F / A ) and reservoir Residence Time ( V / F ) for Hydro1K basins in Southern Europe. The 16 basins under study are highlighted using the same color coding and numbering as in Figure 1.
Water 13 00085 g004
Figure 5. Relative changes in Standard Deviation ( Δ SD ) and Coefficient of Variation ( Δ CV ) of annual flow versus changes in Mean Annual Flow ( Δ F ) for the 16 basins under study. (a) Δ F   vs .   Δ SD , all projections; (b) Δ F   vs .   Δ SD , mean values; (c) Δ F   vs .   Δ CV , all projections; (d) Δ F   vs .   Δ CV , mean values.
Water 13 00085 g005
Figure 6. Estimated cumulative probability distribution function of Potential Water Availability ( PWA ) expressed as a fraction of current Mean Annual Flow ( F ) in the 16 basins under study. (a) historical period; (b) long-term projection.
Water 13 00085 g006
Figure 7. Comparison of the estimated changes in Mean Annual Flow ( Δ F ) and the estimated changes in Potential Water Availability ( Δ PWA ) for the 35 available projections in the 16 basins under study. (a) Δ F   vs .   Δ PWA , all projections; (b) Δ F   vs .   Δ PWA , mean values.
Water 13 00085 g007
Figure 8. Estimated cumulative probability distribution function of changes in Mean Annual Flow ( Δ F , in gray) and changes in Potential Water Availability ( Δ PWA , in the color code for each basin) for the 16 basins under analysis.
Water 13 00085 g008
Figure 9. Comparison of the estimated changes in Mean Annual Flow ( Δ F ) and the estimated changes in Potential Water Availability ( Δ PWA ) for 25%, 50%, 75%, 100%, 125%, 150% and 175% (in rows, ordered from top to bottom) for four representative basins of the study: Loire (left column), Struma-Strymon (center-left column), Guadalquivir (center-right column) and Guadiana (right column).
Water 13 00085 g009
Figure 10. Probability distribution of changes in Mean Annual Flow ( Δ F , in blue) and changes in Potential Water Availability ( Δ PWA ) for different storage values (color-coded, from 25% to 175% of current storage volume) in the 16 studied basins.
Water 13 00085 g010
Figure 11. Values of the attenuation index I A for different relative storage volumes in the 16 studied basins. Current relative storage is marked with a vertical black line.
Water 13 00085 g011
Figure 12. Comparison of the values of average I A index and I U index obtained in the sensitivity analyses of reservoir storage in the 16 basins under study. (a) Average value of the attenuation index ( I A ) for the 35 available projections as a function of reservoir storage. (b) Value of the uncertainty index (   I U ) as a function of reservoir storage.
Water 13 00085 g012
Table 1. Basic characteristics of the basins analyzed in this study.
BasinBasin
Area (A)
(103 km2)
Mean Annual
Flow (F)
(km3/year)
Storage
Volume (V)
(km3)
Specific
Runoff (F/A)
(mm/year)
Residence
Time (V/F)
year
1-Arno10.304.750.074620.01
2-Po84.7347.680.935630.02
3-Loire115.9128.820.722490.02
4-Tiber17.317.950.364590.04
5-Garonne79.6726.211.813290.07
6-Rhône88.4343.793.724950.08
7-Struma-Strymon16.812.240.231330.10
8-Duero-Douro96.2419.913.482070.17
9-Vardar-Axios22.734.561.172010.26
10-Ebro84.9015.334.631810.30
11-Maritsa-Evros52.607.703.571460.46
12-Guadalquivir54.968.666.271580.72
13-Tajo-Tejo69.7311.998.881720.74
14-Júcar21.830.892.58412.91
15-Guadiana60.854.2314.19703.35
16-Segura17.550.201.17115.83
Table 2. Summary of the results of the analysis of changes in streamflow Δ F , Δ SD and Δ CV and Potential Water Availability, Δ PWA , in the basins analyzed in this study (Ave: average of values for the 35 projections; Std: standard deviation of the values for the 35 projections).
Basin Δ F Δ S D Δ C V Δ P W A
AveStdAveStdAveStdAveStd
1-Arno−0.100.190.040.220.230.360.000.36
2-Po−0.040.180.090.210.200.29−0.230.27
3-Loire−0.090.190.050.280.430.45−0.210.32
4-Tiber−0.120.190.030.260.530.53−0.170.32
5-Garonne−0.140.190.020.260.460.43−0.180.27
6-Rhône−0.060.170.110.260.280.33−0.160.26
7-Struma-Strymon−0.260.20−0.130.220.931.00−0.170.26
8-Duero-Douro−0.220.22−0.010.340.670.64−0.280.20
9-Vardar-Axios−0.230.19−0.060.221.011.06−0.180.23
10-Ebro−0.200.20−0.070.220.500.53−0.190.17
11-Maritsa-Evros−0.200.21−0.040.320.210.78−0.150.28
12-Guadalquivir−0.430.31−0.330.320.500.53−0.350.28
13-Tajo-Tejo−0.290.25−0.120.310.750.93−0.270.21
14-Júcar−0.270.27−0.110.381.381.63−0.270.24
15-Guadiana−0.350.40−0.210.431.461.42−0.350.29
16-Segura−0.290.33−0.150.470.741.40−0.270.28
Publisher’s Note: MDPI stays neutral with regard to jurisdictional claims in published maps and institutional affiliations.

