Article

Water Availability for Cannabis in Northern California: Intersections of Climate, Policy, and Public Discourse

by
Betsy Morgan
1,2,*,
Kaitlyn Spangler
2,3,
Jacob Stuivenvolt Allen
2,4,
Christina N. Morrisett
2,5,
Mark W. Brunson
2,3,6,
Shih-Yu Simon Wang
2,4 and
Nancy Huntly
2,6,7
1
Department of Civil and Environmental Engineering, Utah State University, Logan, UT 84322, USA
2
Climate Adaptation Science Program, Utah State University, Logan, UT 84322, USA
3
Department of Environment and Society, Utah State University, Logan, UT 84322, USA
4
Department of Plant, Soils, and Climate, Utah State University, Logan, UT 84322, USA
5
Department of Watershed Sciences, Utah State University, Logan, UT 84322, USA
6
Ecology Center, Utah State University, Logan, UT 84322, USA
7
Department of Biology, Utah State University, Logan, UT 84322, USA
*
Author to whom correspondence should be addressed.
Water 2021, 13(1), 5; https://doi.org/10.3390/w13010005
Submission received: 5 November 2020 / Revised: 12 December 2020 / Accepted: 18 December 2020 / Published: 23 December 2020
(This article belongs to the Section Water Resources Management, Policy and Governance)

Abstract

:
Availability of water for irrigated crops is driven by climate and policy, as moderated by public priorities and opinions. We explore how climate and water policy interact to influence water availability for cannabis (Cannabis sativa), a newly regulated crop in California, as well as how public discourse frames these interactions. Grower access to surface water covaries with precipitation frequency and oscillates consistently in an energetic 11–17 year wet-dry cycle. Assessing contemporary cannabis water policies against historic streamflow data showed that legal surface water access was most reliable for cannabis growers with small water rights (<600 m3) and limited during relatively dry years. Climate variability either facilitates or limits water access in cycles of 10–15 years—rendering cultivators with larger water rights vulnerable to periods of drought. However, news media coverage excludes growers’ perspectives and rarely mentions climate and weather, while public debate over growers’ irrigation water use presumes illegal diversion. This complicates efforts to improve growers’ legal water access, which are further challenged by climate. To promote a socially, politically, and environmentally viable cannabis industry, water policy should better represent growers’ voices and explicitly address stakeholder controversies as it adapts to this new and legal agricultural water user.

1. Introduction

Competing demands for water are intensifying globally, heightening concerns about water scarcity [1,2,3,4,5,6,7]. Among these demands is the availability of water for dry-season irrigation in the western United States (USA), where precipitation and agricultural water demand are temporally misaligned [8,9]. In particular, California agriculture produces a rich diversity of crops that rely on 80% of the state’s developed water for irrigation [10]. Although water allocation has a well-established regulatory framework [11,12], intensifying agricultural demands and an increasingly uncertain climate present social, political, and ecological challenges for California’s water future [13].
The regulatory framework for agricultural water use in California now includes cannabis (Cannabis sativa), a newly legal specialty crop [14]. After the legalization of adult-use recreational cannabis in 2016 [14], water access for legal cannabis cultivation was stipulated in the Cannabis Cultivation Policy (CCP) [15]. Given the established negative impacts of illicit cannabis cultivation on native salmonids [16], water quality [17,18], and terrestrial species [19,20,21], the CCP seeks to minimize effects on aquatic and riparian ecosystems from legal cannabis cultivation while meeting cannabis water needs and encouraging regulatory compliance.
However, these new water-use regulations pose several barriers for cannabis growers. At present, obtaining a Small Irrigation Use Registration (SIUR) permit is the most expedient way for a grower to gain a new cultivation water right and an SIUR only permits surface water diversions [15]. Whereas other producers may divert surface water during the summer growing season [22], cannabis cultivators may only divert surface water during winter months, when water supply is plentiful from precipitation [15,23] and does not compound or compete with other diversions. As a result, growers must store diverted water on-property until the summer irrigation season or rely on other means of water access, such as groundwater wells [24].
Furthermore, California’s inherent interannual to decadal variability of precipitation and episodic drought [25,26,27] adds uncertainty and places cannabis growers at risk for both climate- and policy-driven water scarcity. Due to the short history of legal cannabis, the extent to which climate variability threatens water access for cannabis cultivators is unknown. Additionally, water resources in the region are modulated by atmospheric rivers (ARs)—enhanced regions of moisture transport from the tropics to the poles—which account for 30–50% of California’s precipitation and can be solely responsible for ending drought [23,28,29]. Despite their importance to regional hydroclimate, we have limited knowledge of long-term AR variability due to the reliance on satellite-era data for tracking and observing ARs [30]. The CCPs stipulation that growers can only divert when water is plentiful makes the reliability of water access for cannabis cultivators partially dependent on the variability of ARs, precipitation, and subsequent streamflow.
In addition to these water access challenges, cannabis cultivation has a tumultuous history in California. Although medicinal cannabis use was legalized in 1996 and recreational use in 2016, illicit cannabis cultivation has long-standing associations with negative cultural, political, and ecological impacts. Perceptions and discussion of cannabis are fraught with stakeholder disagreements, regulatory debates, associations with organized crime, and concern for further environmental degradation [16,18,31,32,33]. Furthermore, cannabis is entrenched within moral quandaries, such as public health disputes [34], uncertainty over community well-being [35], and competing land use priorities [36]. As a result, cannabis growers are often framed as criminals rather than farmers [37]. These controversies complicate efforts to regulate cannabis water use and encourage grower compliance.
Given these concerns and challenges, we explore how long-term climate variability and contemporary water policy currently interact to influence water availability for legal cannabis in northern California, as well as how public discourse frames these interactions. Our approach reflects the need to examine agricultural water management as it intersects with hydroclimate and sociopolitical influences [3,5,6,38]. This is part of a growing body of literature examining the relationships between public and social interests, cultural values, and sustainable water management [39,40,41,42,43,44], with focus on the understudied nexus of cannabis and water in California.
Within a tri-county region of northern California, we integrated three methodological approaches to examine how water availability for cannabis varies and how current policies impact this variation. We first determined how cycles of precipitation and moisture transport influence water availability and how this fundamental hydroclimatic relationship relates to current cannabis water-use policies. We then explored the nature of public discourse around cannabis and water use through a content analysis of regional news media. We aimed to (1) assess how hydroclimate and water policy influence reliable, legal water access for cannabis growers in northern California and (2) explore how public discourse in news media frames perceptions of the evolving water-cannabis nexus.

2. Materials and Methods

2.1. Study Area

The Emerald Triangle (ET-CA)—Humboldt, Mendocino, and Trinity counties along California’s north Coast (Figure 1)—is one of the highest cannabis-producing regions in the United States [38]. Clandestine cannabis cultivation in the ET-CA has persisted unregulated since the mid-1900s, fostered by the region’s geographic remoteness and moderate climate [45].

2.2. Determining the Climate-Water Relationship

Due to the established importance of ARs on northern California’s moisture transport and precipitation [28], we used the frequency of ARs as the focal measure of hydroclimatic variability. To determine the relationship between AR frequency and ET-CA water availability, we used objective-tracking algorithms to count ARs that occurred directly over the ET-CA. An objective-tracking algorithm uses predetermined metrics to identify a feature of interest (e.g., ARs) and track its spatial and temporal characteristics. The variability or oscillations of ARs and other moisture variables were evaluated using power spectra analysis. The power spectrum is a Fourier decomposition of a timeseries that shows the contributions to variance from different sinusoidal frequencies embedded in the total variance. With the numerous regional climate cycles that occur at relatively constant periods [46,47,48], this analysis highlights the timescales of variability that are important for water availability in the region (e.g., interannual or decadal).

2.2.1. Data

Many objective-tracking algorithms have been developed to determine interannual variability in the frequency and intensity of ARs by evaluating the size and timing of enhanced moisture transport from the tropics to the mid-latitudes [49,50,51]. However, differences in objective-tracking methods often result in different event frequencies [52]. To produce a reliable and long-term history of ARs over the ET-CA (125° 122.5°W and 40°–42.5°N), we adapted an objective-tracking algorithm from Gershunov et al. [30] to be used in the National Center for Environmental Prediction’s (NCEP) Reanalysis 1 dataset. This dataset is available at 6-h intervals from 1948 to present day [53]. In order to count as an AR, values of integrated water vapor transport and column-integrated water vapor needed to reach or exceed 250 kg/m/s and 15 mm, respectively. This calculation requires the tropospheric (1000–100 mb) zonal and meridional components of wind, specific humidity, and surface pressure. All atmospheric data were collected from the NCEP Reanalysis 1 dataset. If integrated water vapor transport and column integrated water vapor values met the respective thresholds, the length of threshold values was computed by identifying relative maximums along changes in longitude and latitude. If these values met threshold conditions for ≥2500 km over the ET-CA, an AR was counted. If subsequent time steps also captured an AR, only one event was tallied. We validated results from this longer, ET-CA specific dataset with 1979–2017 results from the Atmospheric River Intercomparison Project’s (ARTMIP) published Tier One Catalog for the same region and time [52]. We correlated this new tracking algorithm with results from the mean of eight relevant ARTMIP tracking algorithms. These algorithms required a minimum time period (12–18 h) in which differing thresholds of total column integrated water vapor and column integrated water vapor transport were met to classify an AR.

2.2.2. Analysis

We computed the power spectra on identified features of the ET-CA that are important for water availability during the cold season (November–March), coinciding with the period of winter cannabis diversions: precipitation, AR frequency, streamflow, and soil moisture. Power spectra analyses help put the short era of legal cannabis cultivation into the context of climate variability by quantifying long-term variability in the ET-CA moisture variables. Highly coherent interannual variability is found between the developed tracking algorithm and the results from ARTMIP’s Tier One Catalog (r = 0.81 for the overlap period from 1980–2017). While disparities in AR characteristics from objective tracking have been explored in prior research [52], we focused on interannual and decadal variability in frequency. We computed the power spectra for the following time series: precipitation from the Global Precipitation Climatology Project [54], soil moisture from the National Center for Environmental Prediction’s Reanalysis 1 [55], streamflow from 11 gauges each with a period of record ≥65 years from the United States Geological Survey (USGS) [56], and the frequency of ARs from objective tracking. We applied a band-pass filter [57] to the detrended time series of precipitation, AR frequency, streamflow, and soil moisture to highlight low frequency variability. For moisture variables in the ET-CA, we removed the contributed variance from frequencies <20 years (i.e., the Pacific Decadal Oscillation) and >8 years (i.e., El Niño Southern Oscillation).

2.3. Assessing Current Water Policy

To evaluate the performance of current policy in providing water to cannabis growers, we applied current water-use regulations to historic streamflow data (1980–2019) within the ET-CA. Under the current regulations, cannabis SIUR permits restrict legal diversions to the wet season (1 November–31 March). To protect sensitive aquatic species [58], the diversion season begins once there are seven consecutive days with flow greater than the instream flow criteria [59] or after 15 December. Once the season begins, diversions can only occur when the daily average flow is greater than the instream flow criteria. Since many watersheds are ungauged, the CCP provides instream flow criteria for established streamflow gauges (e.g., USGS gauges), which serve as compliance gauges for growers in nearby areas [15]. Therefore, a grower is allowed to divert at their point of diversion (POD) depending on flows at their assigned compliance gauge.

2.3.1. Data

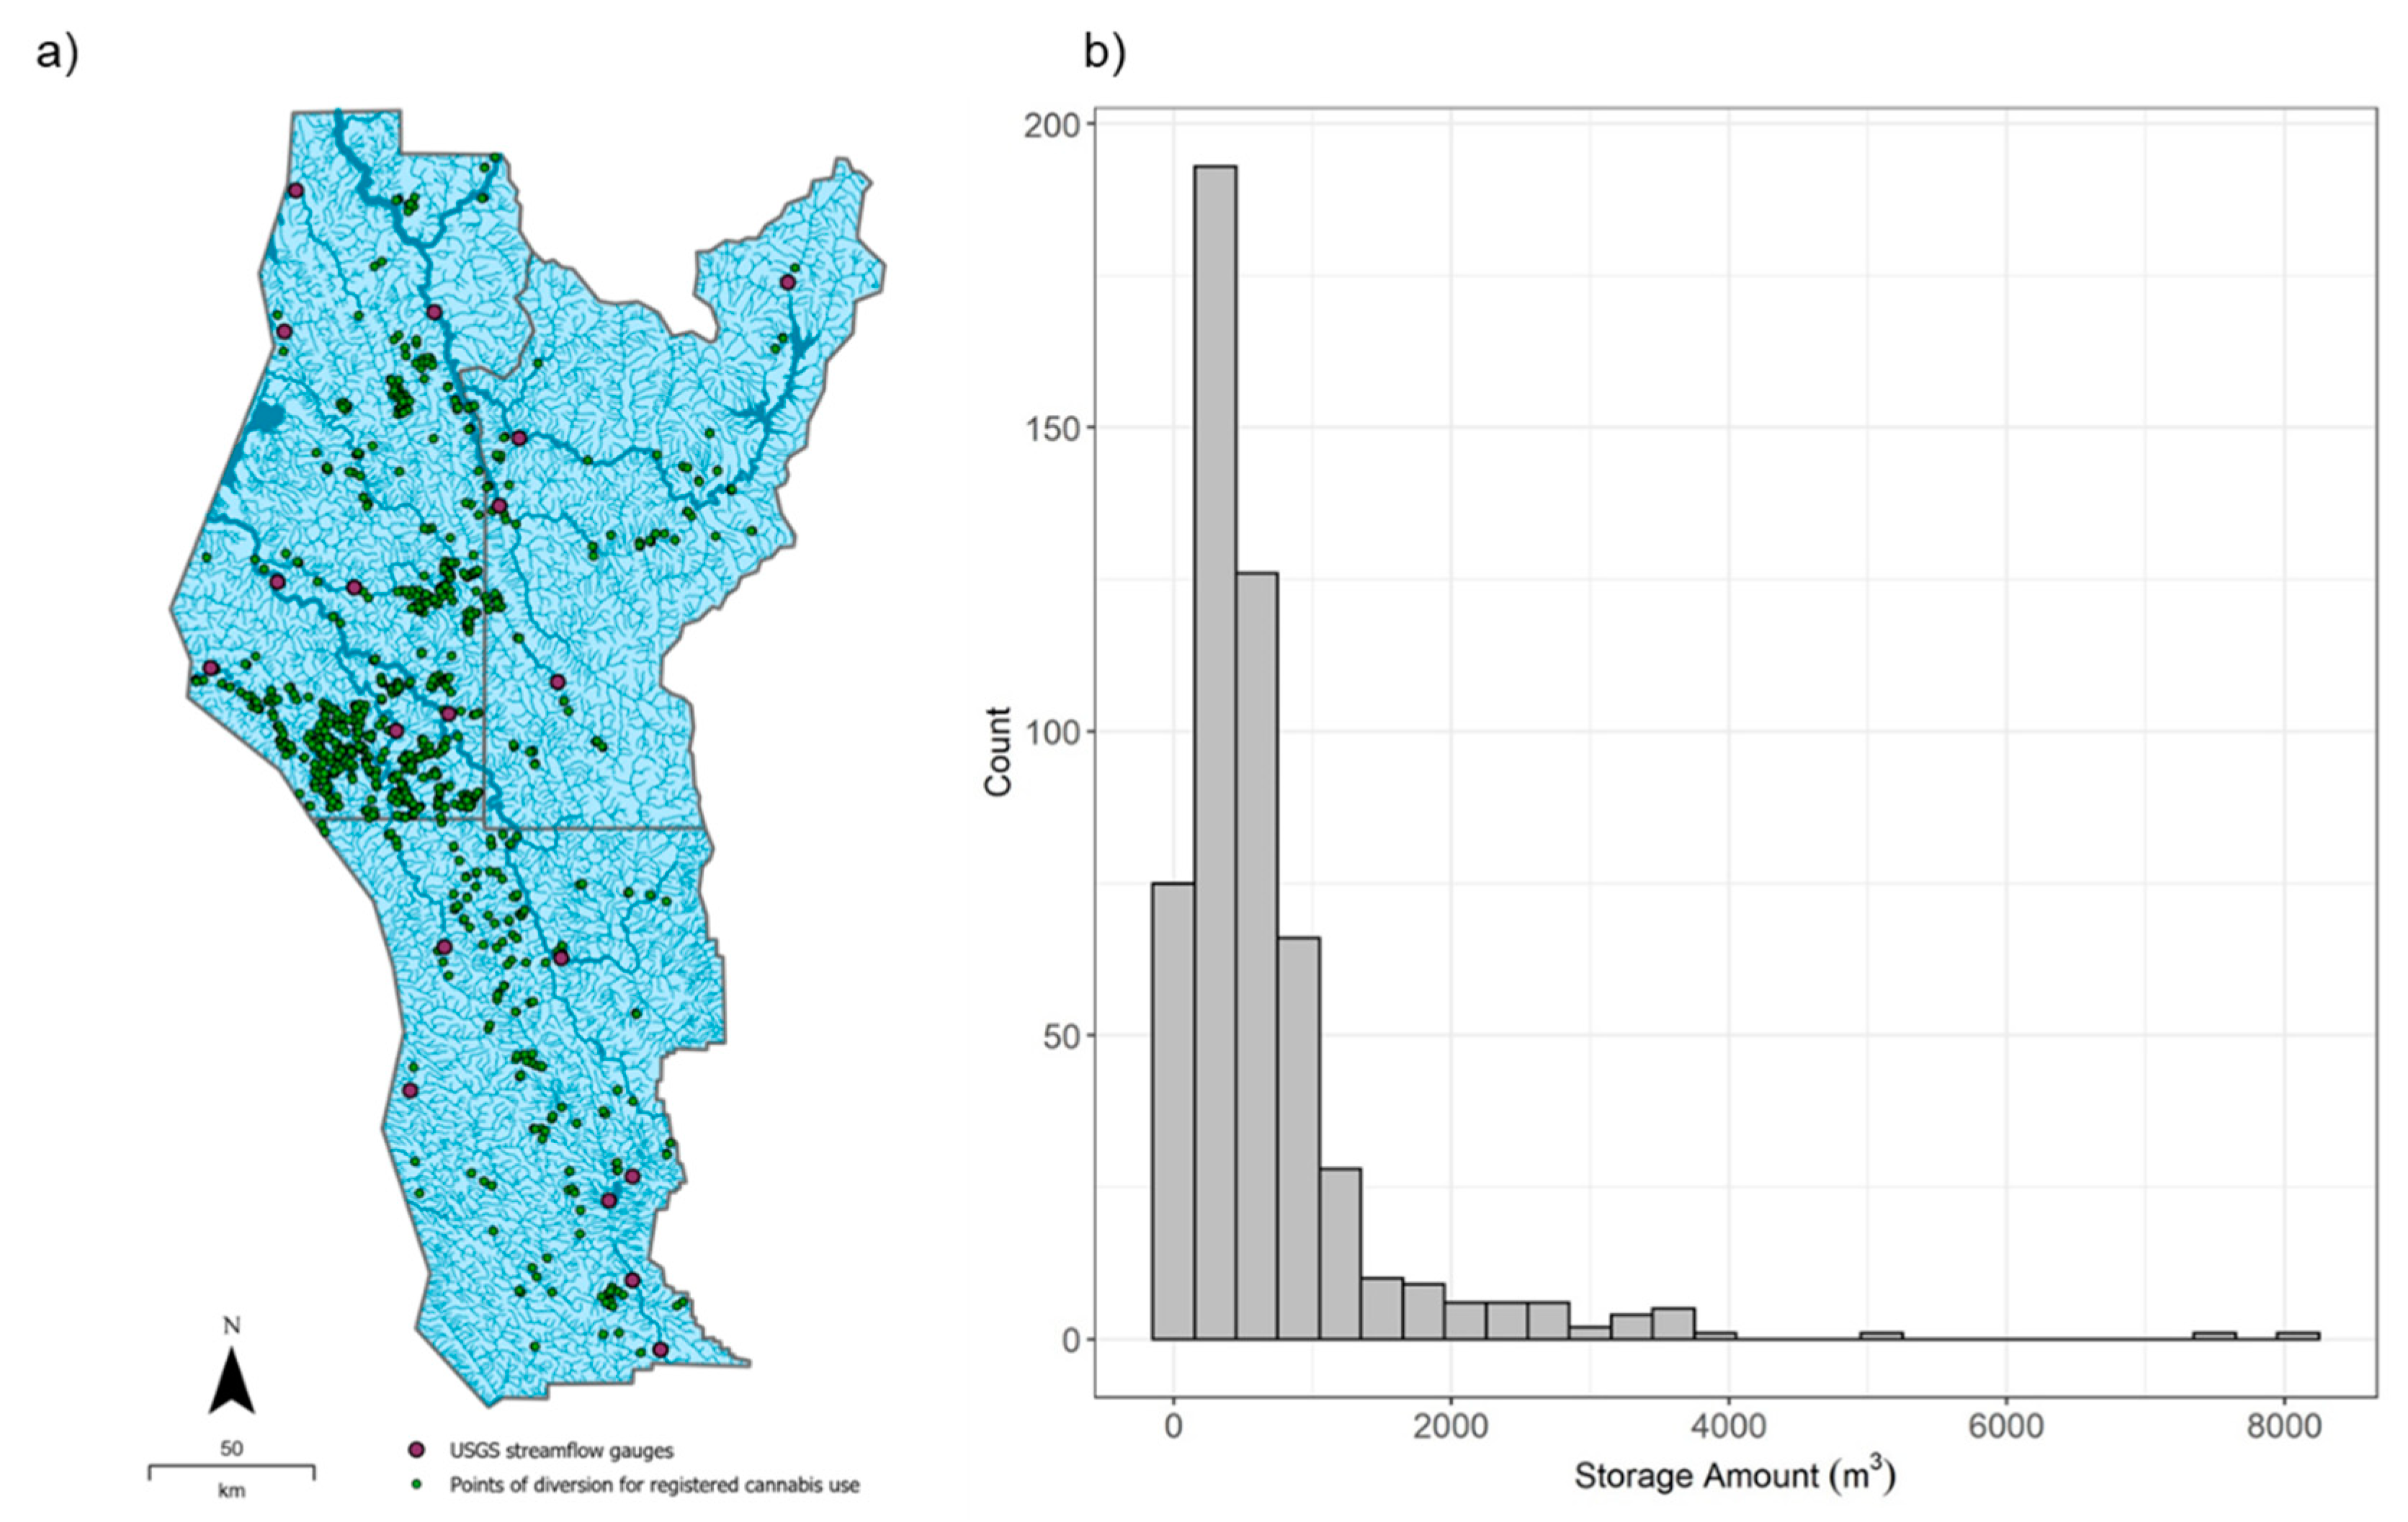
Using the dataRetrieval package in R [56], we downloaded daily average streamflow from 19 USGS gauges with a period of record ≥30 years (Table S1, Figure 2a). Each gauge is listed as a compliance gauge in the CCP and has a set of monthly instream flow criteria [15]. Since cannabis water demand estimates are still uncertain and vary based on farm size, storage capacity, and cultivation practices [60], we estimated water demand using registered cannabis water rights accessed through a public water rights database [61]. We downloaded registered cannabis water rights (type = registration cannabis) for Humboldt, Trinity, and Mendocino counties and considered those with a beneficial use of “irrigation,” a diversion rate of 37.85 L/min (10 gal/min), and diversion and storage dates of 1 November–31 March. These water rights match the current SIUR stipulations in the CCP and range from 5 to 8018 m3, with a median size of 456 m3 (Figure 2b).

2.3.2. Analysis

Using the monthly instream flow criteria associated with each gauge, we calculated the diversion season start date and number of permitted legal diversion days for each water year (October–September). Diversion days at each gauge were summed for the wet season for each water year. Using correlation, we assessed whether diversion days were similar across space, time, and with AR frequency.
We evaluated surface water availability through three water resource performance metrics: (1) the likelihood of meeting a specific demand threshold (Reliability); (2) the likelihood of meeting the demand threshold after a period of not being met (Resiliency); and (3) the average deficit in the case where demands are not met (Vulnerability) [62,63]. Our demand threshold was the number of diversion days required by growers to secure a permitted water right in full, which we evaluated against average historical diversion days. Since cultivation practices vary [64], we used a scenario approach to evaluate a range of thresholds under different combinations of registered water right permits (300–3600 m3, Figure 2b) and operational conditions (diverting for 8–24 h/day). We assumed that growers divert when a legal diversion day occurs and use the maximum diversion rate specified in the CCP (37.85 L/min).

2.4. Exploring Public Discourse Through Media Coverage

Finally, we investigated public discourse—defined as the exchange of reasoned arguments about a topic within the public sphere—regarding cannabis and water to identify beliefs expressed by interest groups that may influence decisions about water availability for cannabis cultivation. We used a qualitative and quantitative content analysis of news media to assess the framing of the climate-water-cannabis relationship and cannabis water demand and regulation, and to examine differences in perspectives of various interest groups. Content analysis is a systematic way of capturing the frequency of ideas and assessing the content of textual data, particularly in the media [65,66]. Rather than an objective representation, news media provide a subjective construction of reality through the purposeful selection of perspective and facts [67,68]. Thus, news media can help set the agenda of public opinion and frame messages within a debate [69,70,71,72,73], as well as present perspectives of various interest groups [66,74,75,76]. Recent research has highlighted how news media can impact water demand and resource management by influencing perceptions of controversies and heightening concerns [77,78,79].

2.4.1. Data

We used two sources to collect newspaper articles: databases and online newspaper archives. To access articles from national and regional outlets, we used the Proquest Newsstand and Newspaper Source Plus databases. We also collected local news articles from one source per county—The Mendocino Voice (Mendocino County; via website archive), The Trinity Journal (Trinity County; via website archive), and the Times-Standard (Humboldt County; via Nexis Uni database). For database searches with robust search engine capacity, we used search terms related to the study area, cannabis, climate, and water; for online newspaper archives with simpler search engine capacity, we limited search terms (Table 1). To capture articles published before the November 2016 legalization of adult-use recreational cannabis up to present day, we limited document inclusion to those published between January 2015 and December 2019. The initial search yielded 3845 articles. We pre-screened articles and excluded duplicates, articles outside the ET-CA, articles discussing cannabis manufacturing, and articles with references to water solely in the context of quality, rather than quantity. After applying the exclusion criteria, we included a total of 416 articles in our analysis.

2.4.2. Analysis

We used qualitative and quantitative coding to draw out themes and assess their prevalence through article text. Our preliminary coding scheme was structured based on article pre-screening and a prior literature review, reflecting themes of interest [80]. With the qualitative data analysis platform ATLAS.ti, we iteratively tested the codebook on a random sample of 40 articles independently coded by four researchers. Inter-coder reliability (the consistency of the coding process between coders) was assessed based on the threshold of Krippendorf’s c-α-binary coefficient of 0.80 as accepted in prior literature [81]. After two rounds of testing, we reached a range of Krippendorf’s c-α-binary coefficient of 0.44–0.98 across code groups. Wherever code groups were below 0.80, we collectively clarified any discrepancies among coders [72,82,83].
The final codes reflected multiple themes, including specific discussions related to climate, policy, water use, and associated impacts (Table 2). We coded for direct references to water source (i.e., surface water versus groundwater) and identified the following interest group perspectives: (1) general public, (2) government, (3) grower, (4) non-governmental organization (NGO), and (5) Tribal. Government perspectives represent individuals such as local county representatives, law enforcement, or Department of Fish and Wildlife agents. NGOs represent private interest organizations such as Humboldt Redwood Healing or fishermen associations, and growers represent growers themselves and grower alliances, such as the Humboldt County Growers Alliance. Tribal perspectives refer specifically to representatives from the Yurok and Karuk Tribes, which have federally recognized reservations on land within and adjacent to the ET-CA. The general public represents residential citizens beyond these other groups. All articles were divided evenly among and independently coded by four researchers. After coding all articles, we grouped and synthesized coded quotations by theme, assessed trends in article content, tone, language, and thematic frequency, and identified illustrative quotes. We also used code co-occurrence tables to interpret how interest group perspectives intersected with content themes (Table 2).

3. Results

Results are synthesized to address the two main aims: (1) to assess how hydroclimate and water policy influence reliable, legal water access for cannabis growers in northern California, and (2) explore how public discourse in news media frames perceptions of the evolving water-cannabis nexus. The first section encompasses how hydroclimatic factors influence water availability for cannabis, as well as how news media framed this climate-water relationship. The second section presents the implications of current water policy on legal water access for cannabis and how news media framed these policies and regulations, as well as the perspectives of related interest groups.

3.1. The Climate-Water Relationship

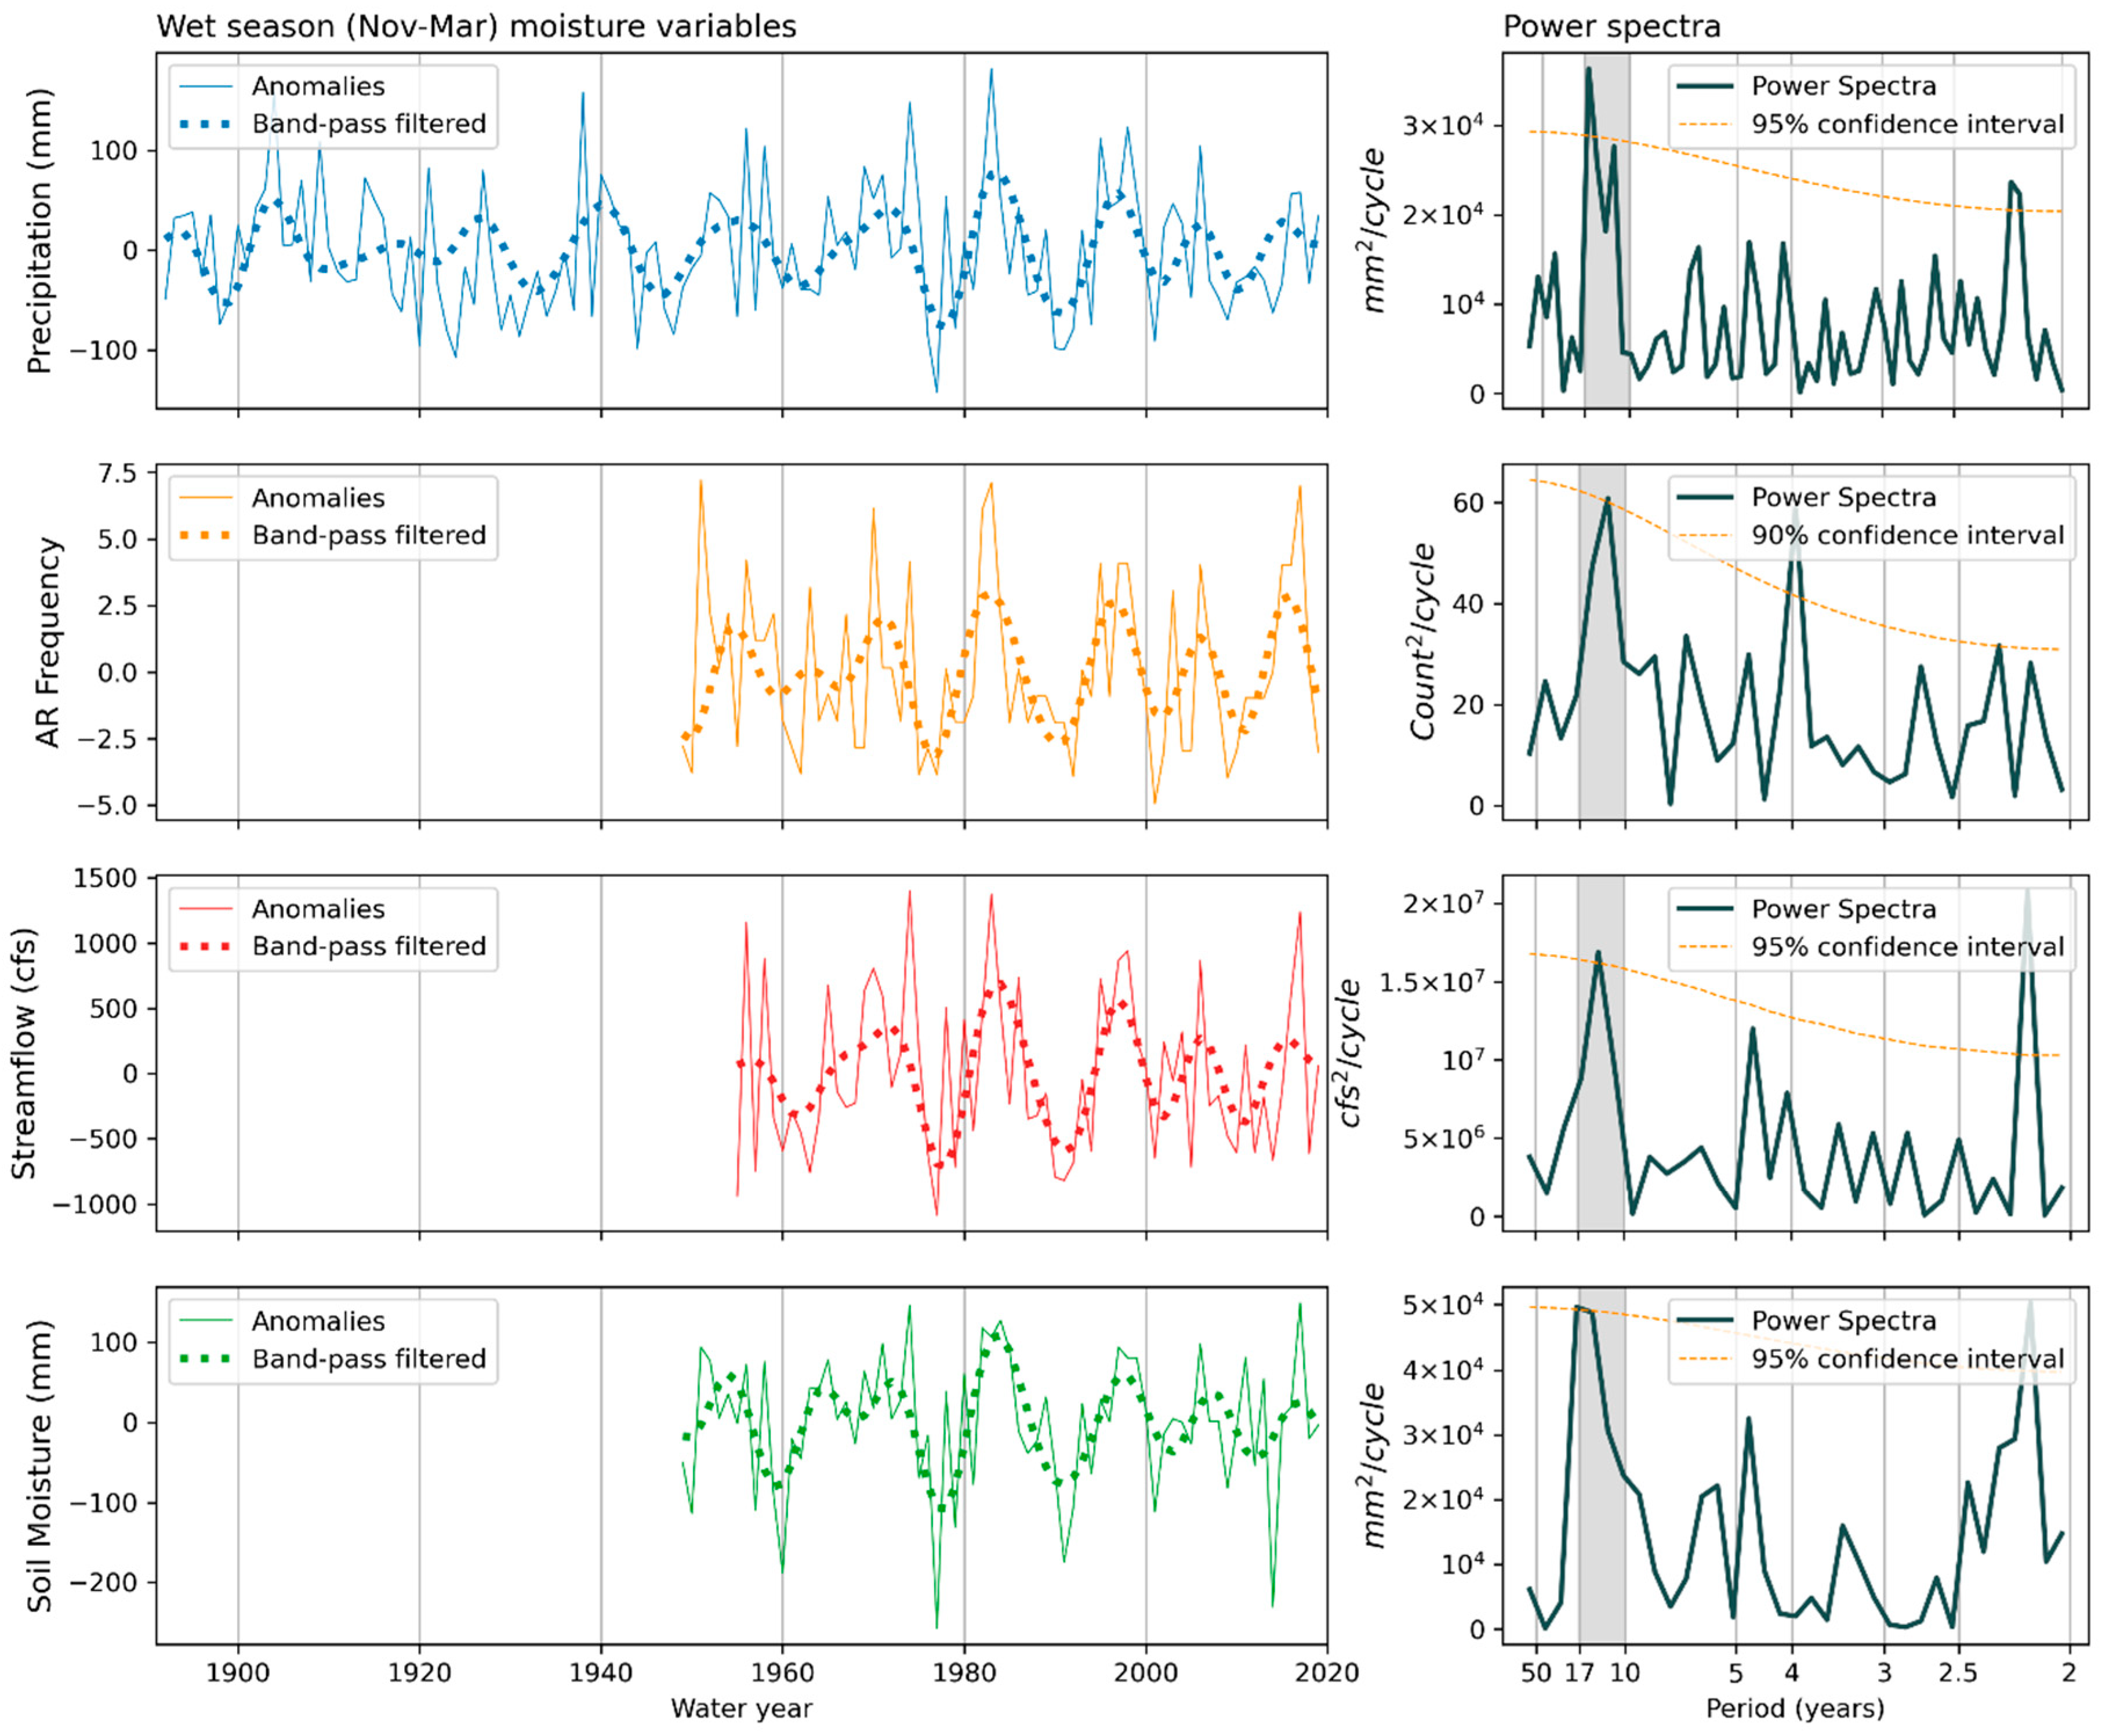
The frequency of ARs from all nine tracking algorithms correlated strongly with aggregated and standardized streamflow in the ET-CA. Correlation coefficients range from 0.57–0.82 for ARTMIP algorithms during the 1981–2017 period, and r = 0.66 for our tracking algorithm in NCEP Reanalysis 1 from 1954–2020. Further, all variables had highly coherent signals in the 8- to 20-year band-pass filtered time series (Figure 3 left), showing a distinct periodicity between wet and dry periods. This 11- to 17-year cycle is prominent in the resulting power spectra with a spectral peak above the 95% confidence interval, responding to the periodicity shown in the band-pass filtered data (Figure 3 right). The 2–3 year frequency band showed a significant peak in the power spectra for soil moisture, precipitation and streamflow, consistent with the previously researched 2–3 year variability that is characteristic to western North America’s hydroclimate [84]. Precipitation and AR frequency had high interannual variability, which can result in relatively dry seasons within a wet phase of the decadal cycle, and vice versa. However, the quasi-decadal variability was consistent and coherent between atmospheric moisture (precipitation and AR frequency) and surface water (soil moisture and streamflow) on a seasonal timescale.
Despite this prominent relationship between climatic cycles and water availability, media content discussing cannabis and water from 2015–2019 rarely discussed climate and weather as a mediating factor for water availability concerns. Discussions of cannabis water use were mostly focused on surface water, whereby references to surface water were found in 48.3% of articles and groundwater in only 6.5% of articles. General discussions of climate and weather were only identified in 17.5% of the articles, and references to climate change were far fewer at 1%. The 2011–2015 drought was sometimes referenced as “historic” or “unprecedented,” but specific references to changing climate patterns were rare.
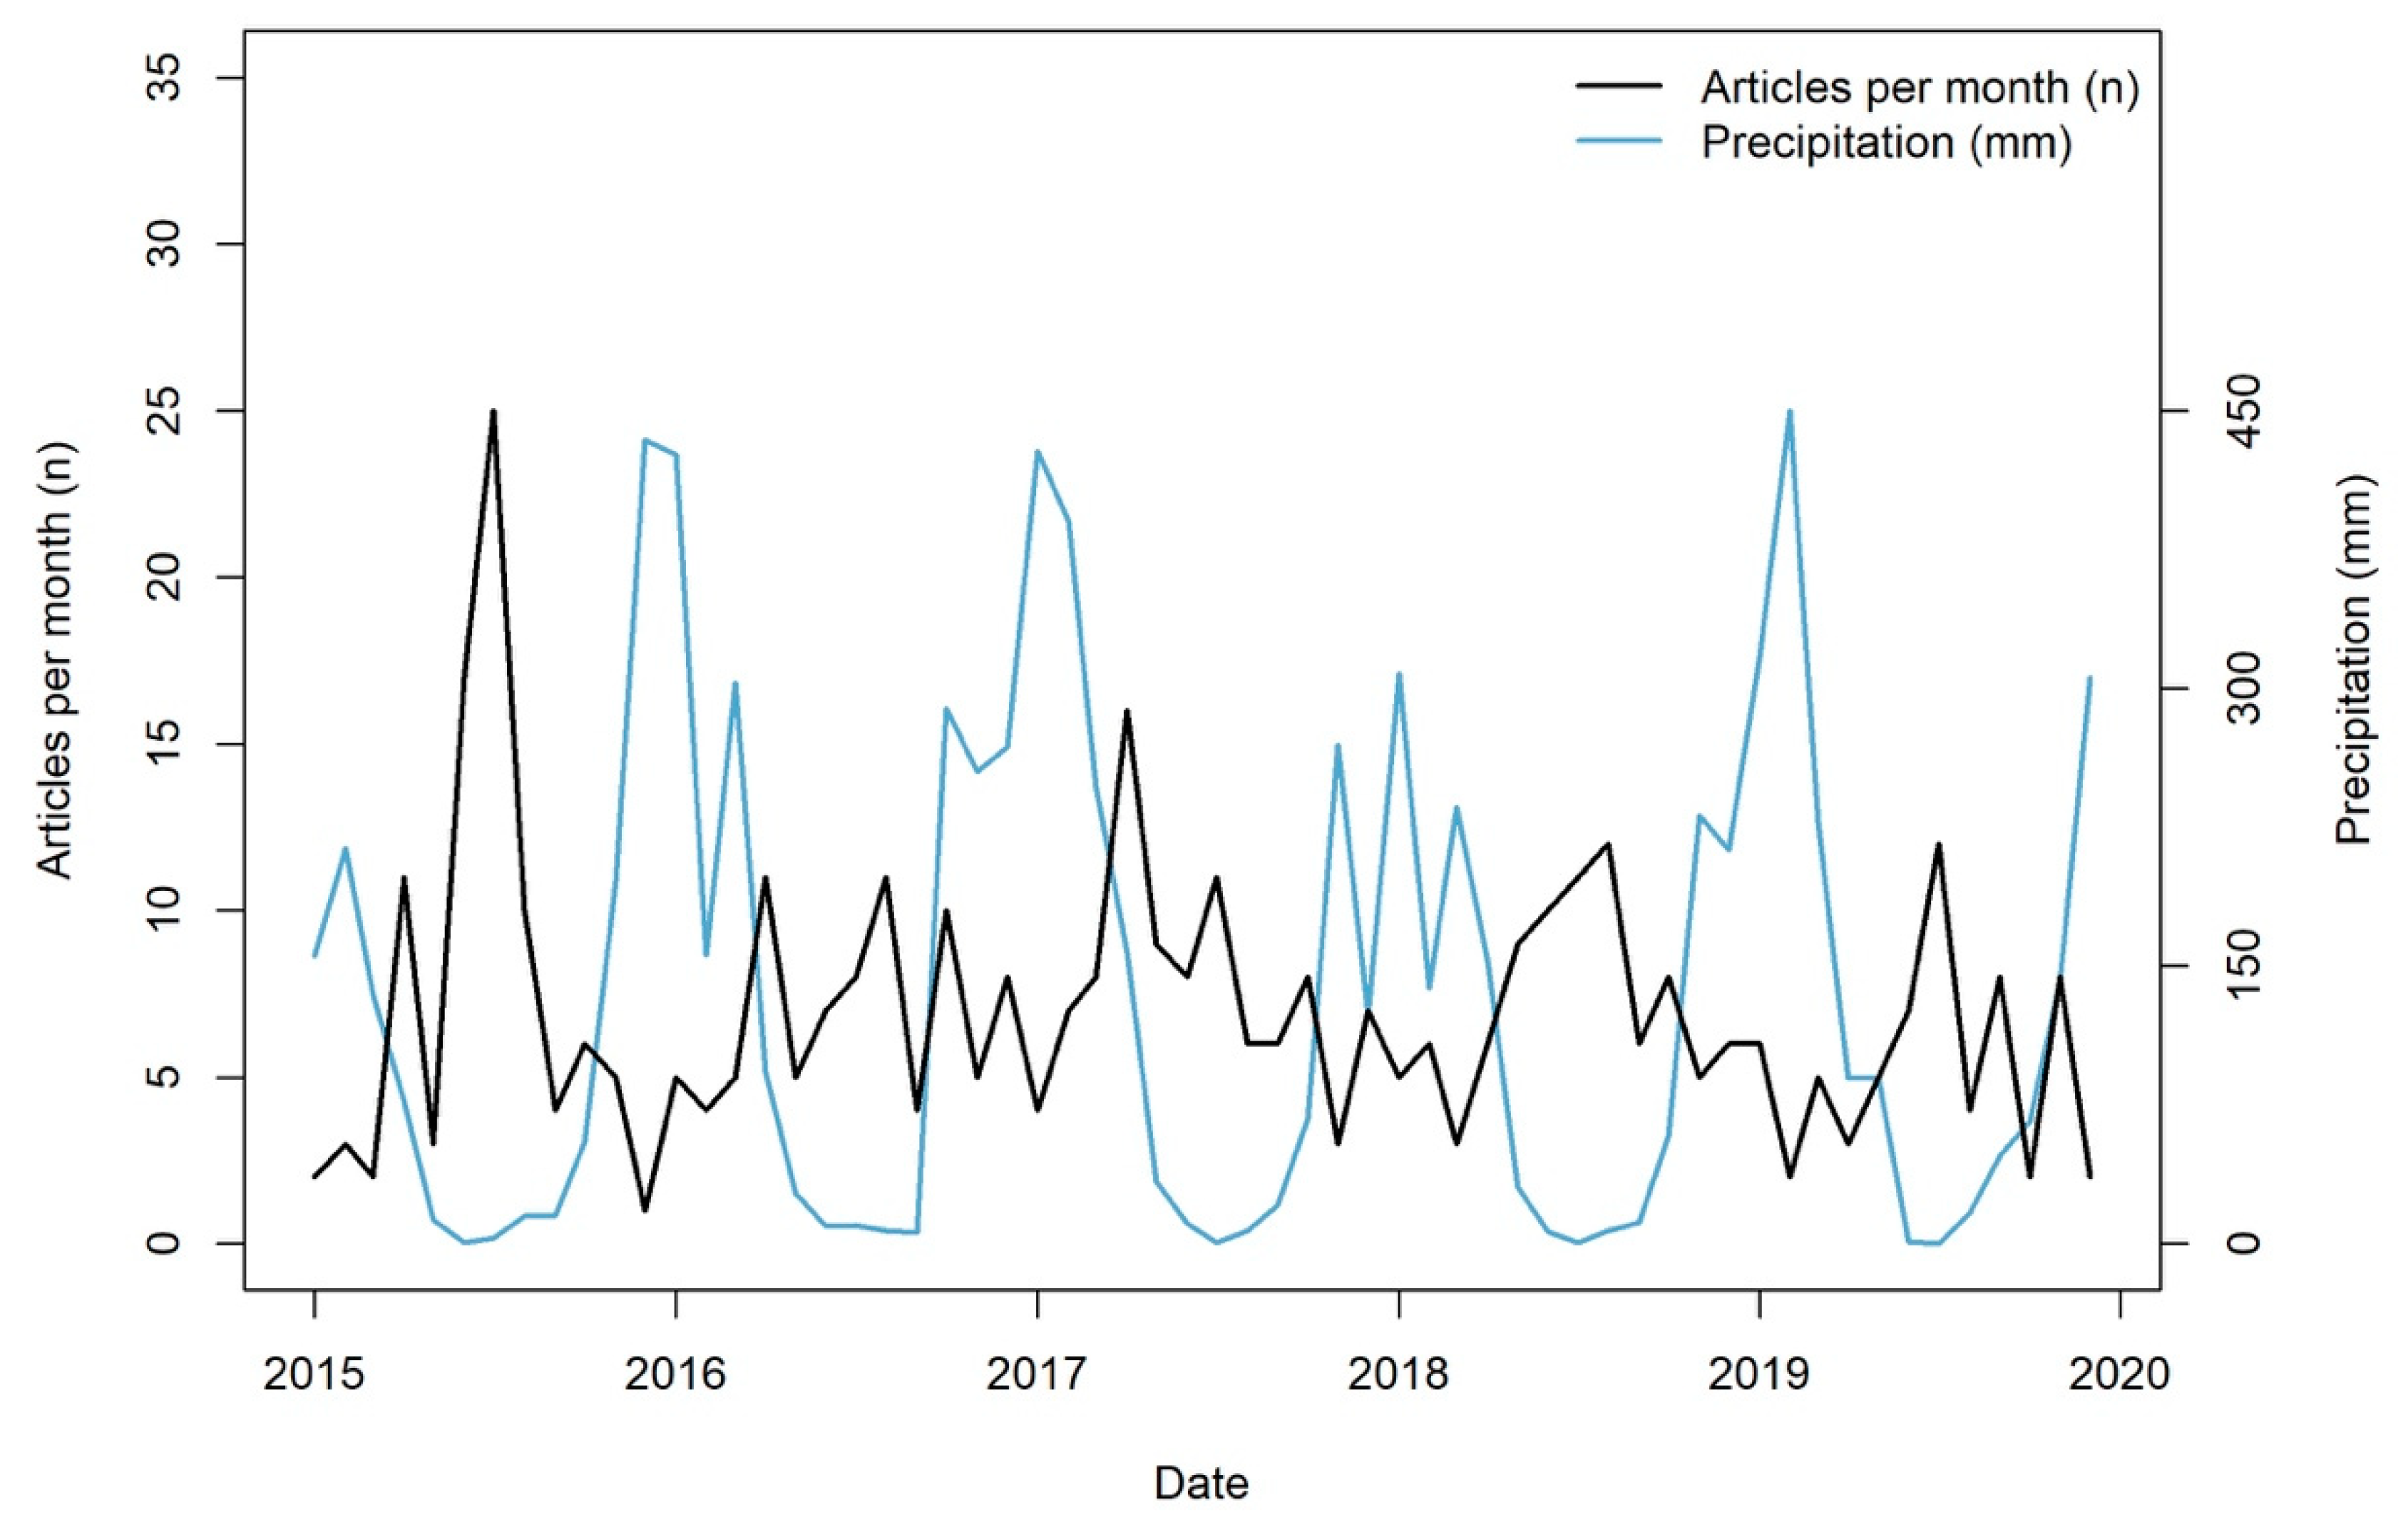
Nonetheless, publication of news articles discussing cannabis and water across these five years did follow an intra-annual seasonal pattern. Article prevalence peaked in the summer months each year, coinciding with the visibility of summer low flows and seasonality of precipitation (Figure 4). For example, reporting was highest in July 2015—the apex of a severe drought in the region.
Thus, short- and long-term climate and weather trends were not often directly discussed in relation to cannabis and water availability, but they are seemingly related to the prevalence of relevant news articles.

3.2. Implications of Current Water Policy

Wet-season diversion days calculated from 19 USGS gauges had coherent interannual variability between 1981 and 2017 (0.45 < r < 0.98; Figure S1). The annual average of diversion days varied between 24 days (2014) and 128 days (2017), occurring within a range of three years. The average across all years was 71 days. In addition, years with more ARs had increased diversion days, (0.45 < r < 0.75 for 1981–2017).
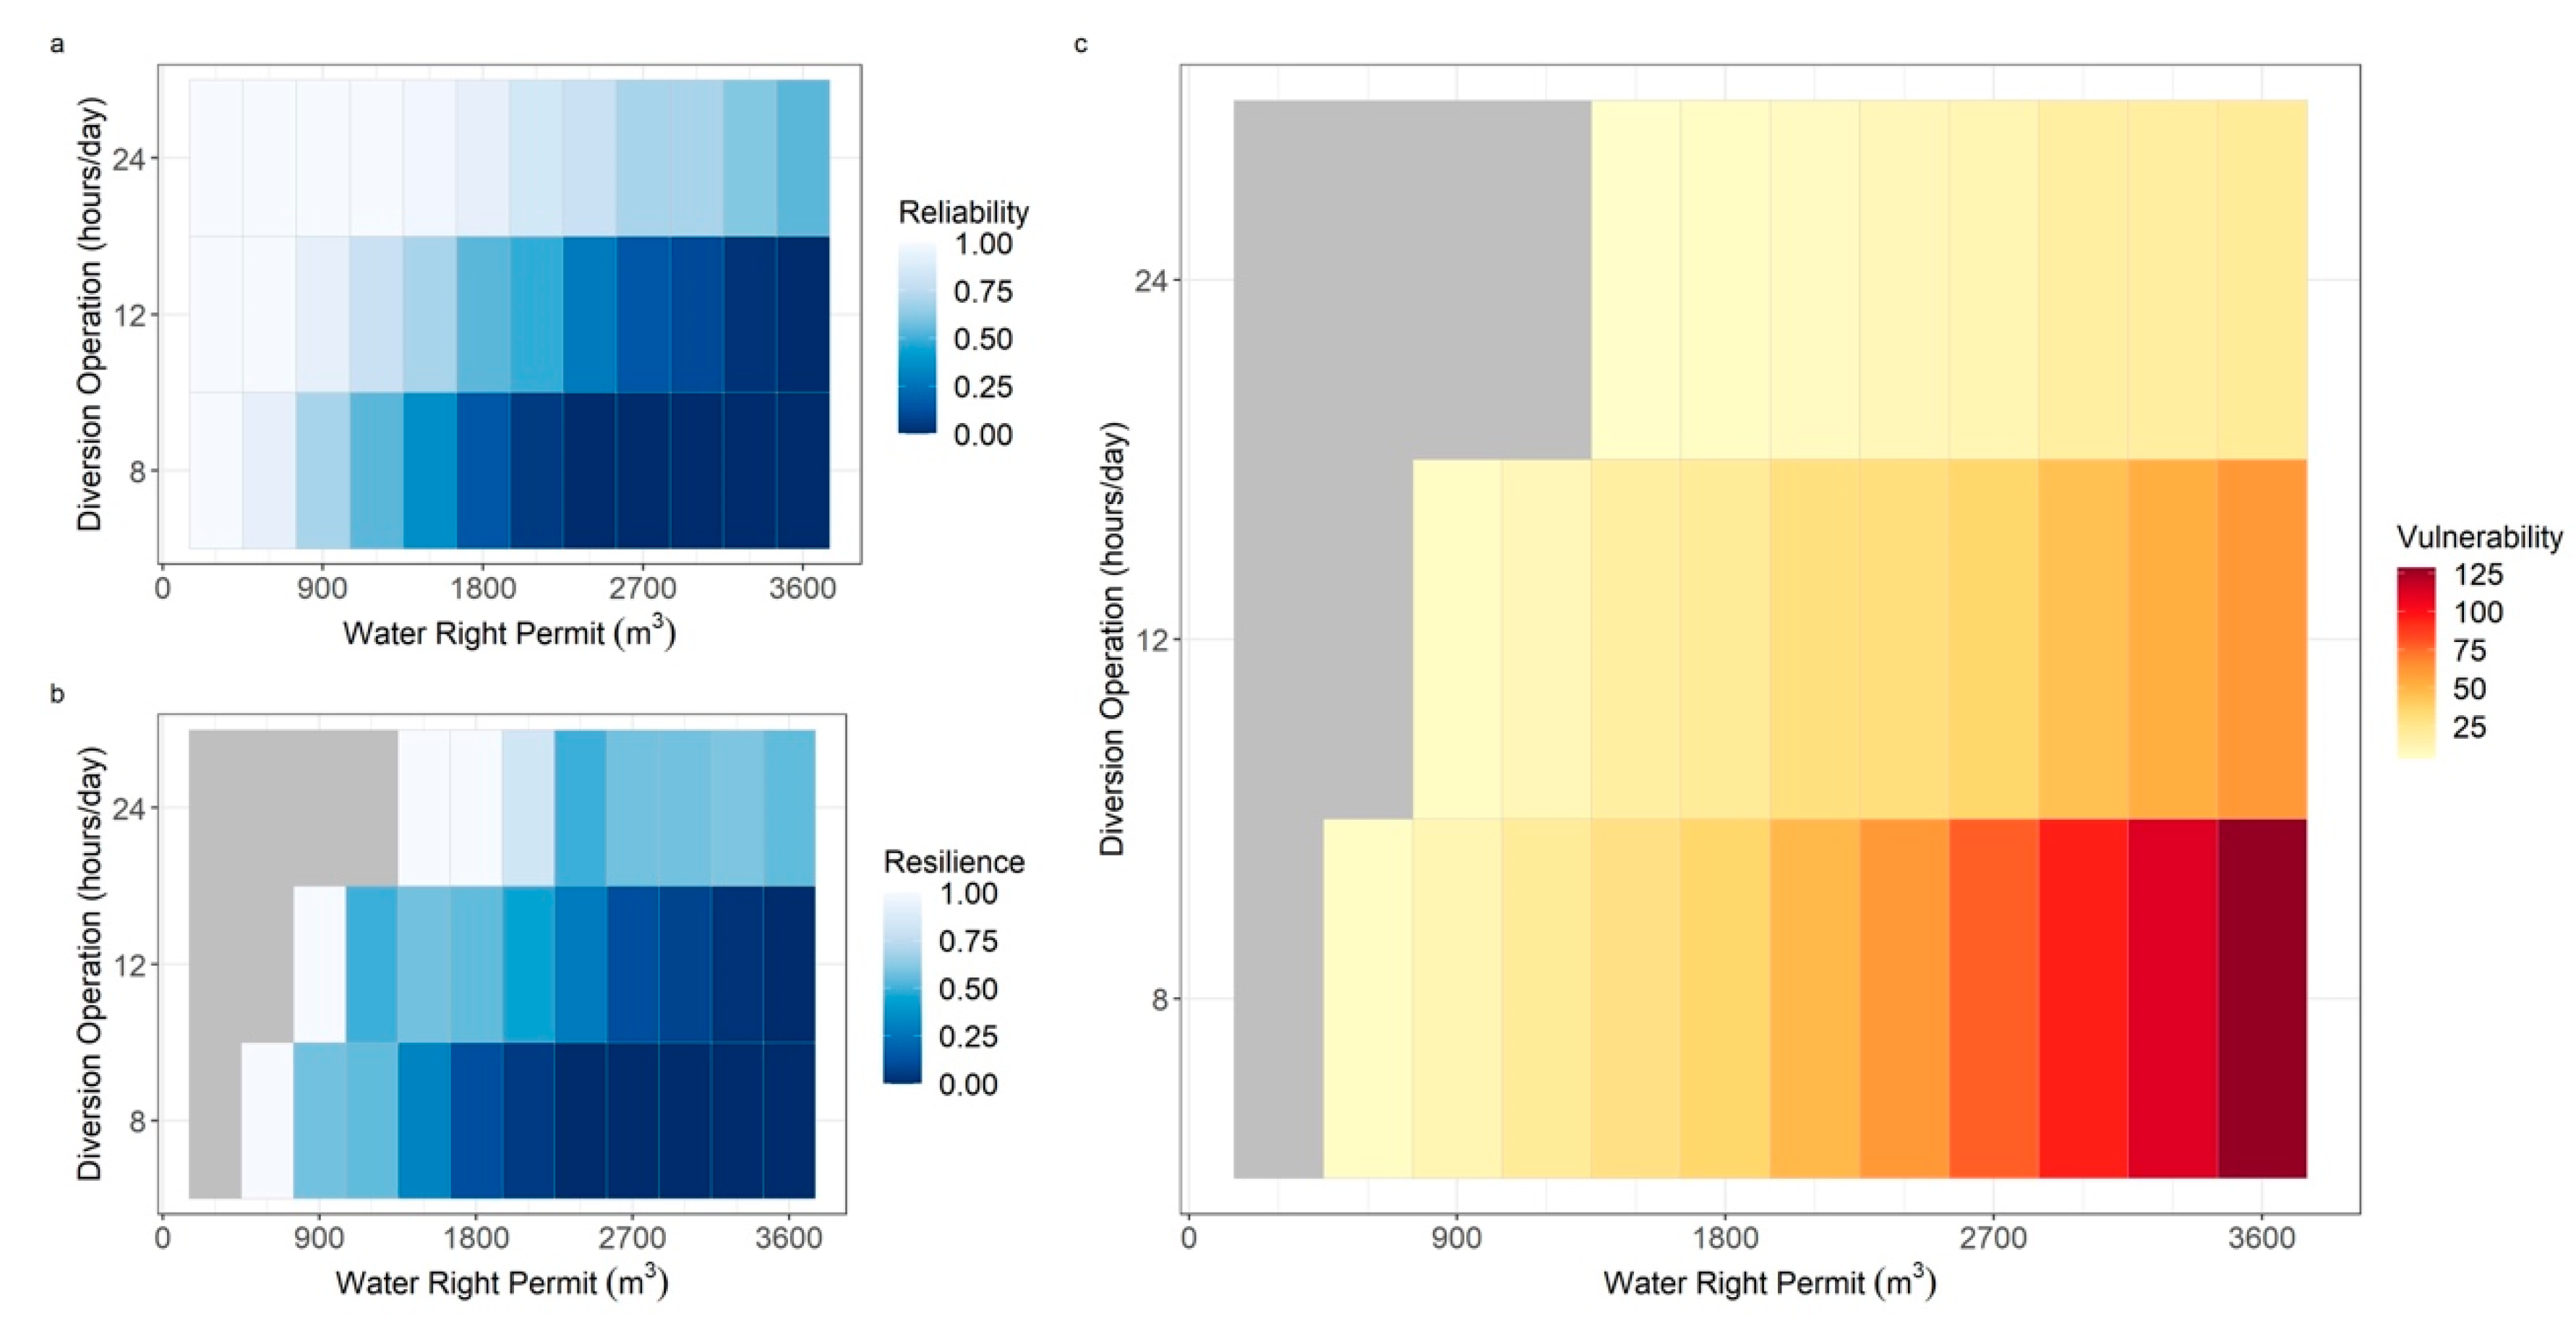
Water availability varied depending on the water right permit volume and diversion operation (Figure 5). Small water rights, such as those ≤600 m3, would have secured their water right in full more than 90% of years between 1980 and 2019. This makes up 65% of registered cannabis water rights. However, historical diversion days were often insufficient to secure full surface water rights for permits ≥900 m2, which represents nearly 20% of registered cannabis water rights. For example, a grower with a 900 m3 (0.75 acre-ft) water right permit, diverting for 8 h on legal diversion days, would have secured their full water right in only 69% of years between 1980 and 2019 (Reliability = 0.69). When their full water right was not secured, the average diversion shortage was 11 days (Vulnerability = 11 days) and there was only a 58% likelihood (Resilience = 0.5) that the following year would provide enough diversion days to secure their full water right. The reliability of securing a 1200 m3 water right (1 acre-ft) over the last 30 years was just 54%.
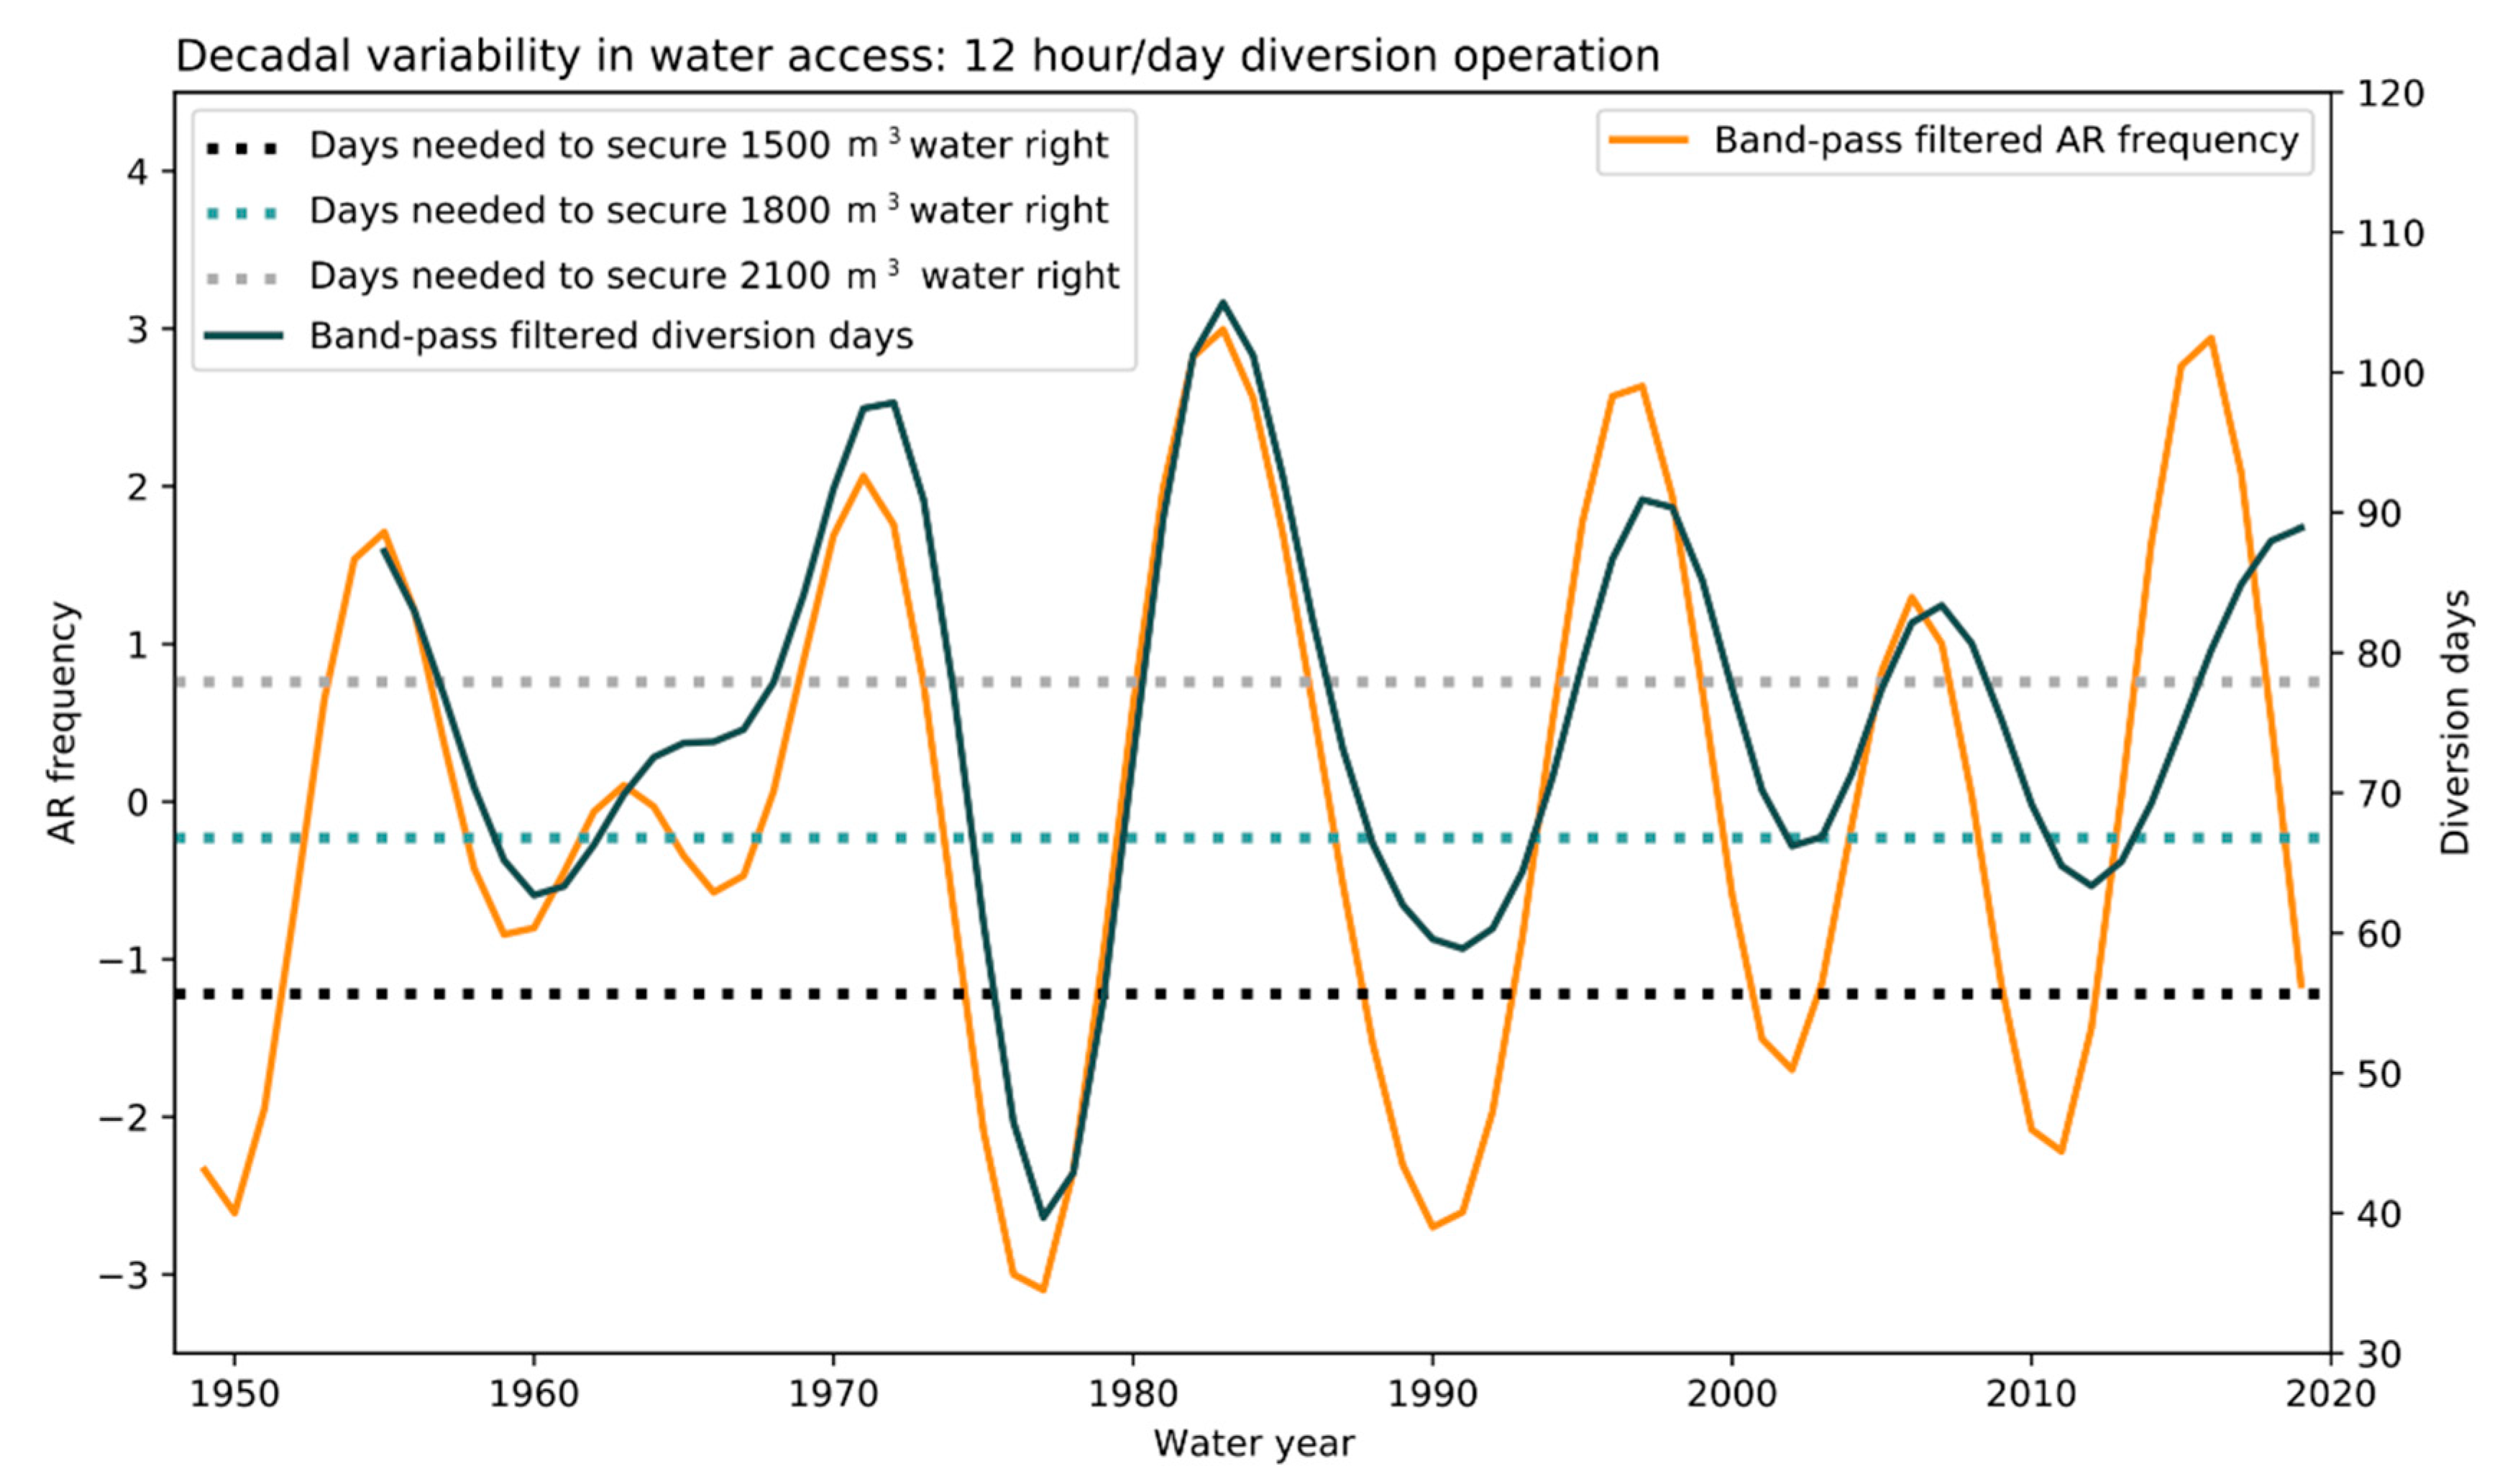
The decadal variability in ARs limited full security of large water rights (Figure 6). Based on the number of days required to reach a full water right under a 12 h/day diversion operation, water access stipulated by the CCP would have been impacted by the low-frequency variability in climate and AR frequency, sometimes facilitating, but other times inhibiting the ability to fulfill a water right. Interannual variability (less than 8-year periods) is not included in the variance of this time series, highlighting that this climate-driven quasi-decadal cycle alone drives periods of water security or deficit.
Estimates of cannabis’s actual water demand varied greatly across news articles related to cannabis and water. Reported irrigation requirements for cannabis cultivation ranged from 8.7 to 56.7 L/day (3–15 gal/day). Cannabis water demand was also often compared to the water demand of other regional crops. For example, articles characterized cannabis, without substantiation, as requiring double the amount of water required to grow grapes—a known water-intensive crop [85] or that it “uses about as much water as corn.” Only two articles contextualized water demand in terms of yield or consumer product. One stated that the water required to produce a “joint” (i.e., cannabis cigarette) is <2 L (0.5 gal), while the water required to produce a glass of wine, a comparable luxury item, ranges from 98.4 to 109.8 L (26–29 gal).
Elements of cannabis’ illicit history permeated the discourse over cannabis water regulation. In 2015—prior to recreational cannabis legalization and during a period of highly publicized enforcement raids—news media portrayed illicit cannabis as culpable for “literally sucking rivers dry” as dry-season diversions coincided with drought to diminish flow. Concerns over developing effective regulations for cannabis water use were largely discussed from 2016 onward, as recreational cannabis was legalized. Some articles reflected that, despite legalization, illicit cannabis was still a large concern, potentially causing streams to “dwindle down to near trickles.” Yet, even newly legal cannabis was still a cause of concern. One media source offered that under the current law, “a vegetable garden is an acceptable use but a cannabis garden of the same size is now environmental degradation.” Associated legalization challenges became a prevalent topic, namely developing and implementing a regulatory framework that, as a government official noted, “touch[ed] every aspect of the cannabis business, including farming, water use, shipping, retail and consumption, and required the construction of an online licensing system.” These discussions also acknowledged water-use tensions from diverse interests in addition to cannabis, including cities, forests, vineyards.
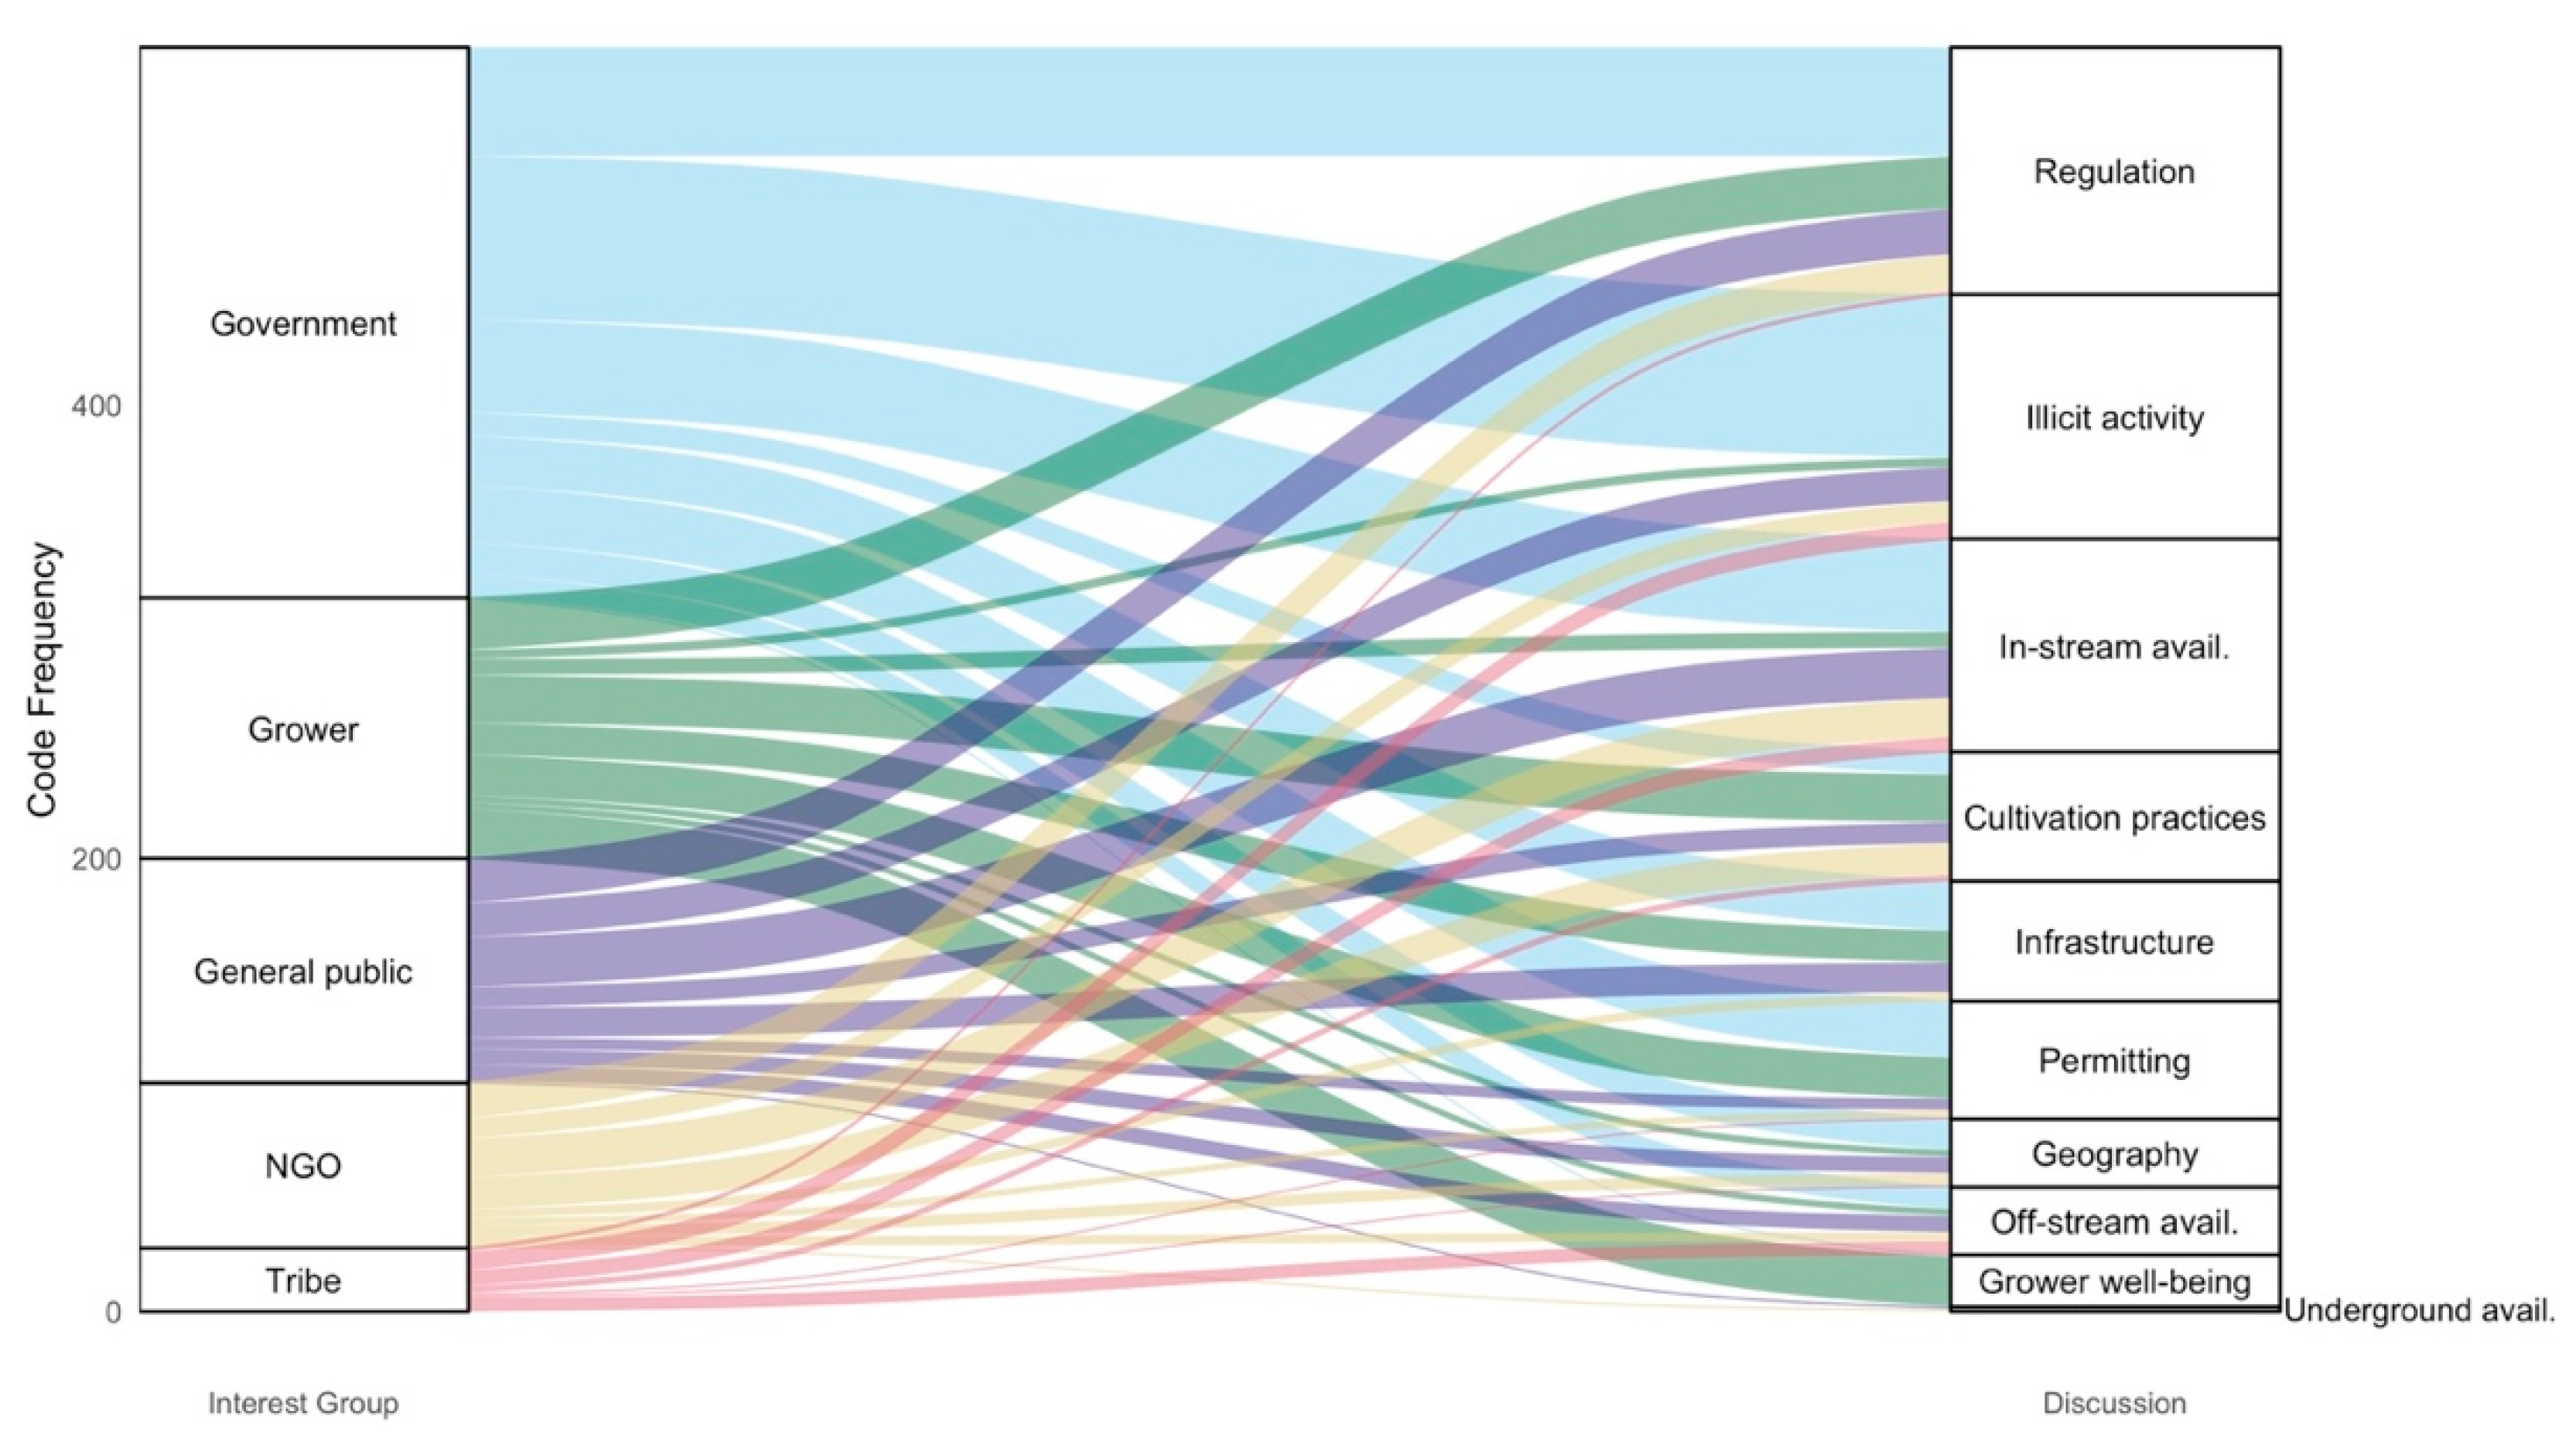
Identified interest groups (i.e., government, grower, NGO, general public, and Native Tribes) presented differing, sometimes opposing, views on cannabis-water concerns and regulations. Government perspectives were the most widely represented (43.5% of all interest group codes), followed by growers (20.6%), the general public (17.7%), NGOs (13.1%), and Native Tribes (5%). This imbalance in presented perspectives is reflected in the breakdown of code frequency by interest group (Figure 7).
These perspectives reflect the often-divergent priorities and concerns of each interest group. Issues of in-stream availability were most frequently presented by the general public, NGOs, and government, representing concerns such as de-watering streams or destroying salmonid habitat; off-stream availability concerns, such as water for municipal use, were expressed by all interest groups except growers. Regulation and illicit activity were the most prevalent topics, and government interest groups were most often represented in these discussions. Regulation discussions mostly encompassed concerns and ideas for building a viable regulatory framework, such as how to regulate where cannabis is grown (e.g., in neighborhoods, in proximity to waterways, or within sensitive watersheds, etc.) and where it can expand, and how cannabis water use affects downstream communities and water users. Following the enactment of the CCP in 2017, news articles began to advertise local cannabis-water workshops hosted by government agencies and NGOs. Illicit activity discussions largely focused on the environmental impact of illicit cannabis and reported on law enforcement raids.
Grower perspectives differed from those represented by other interest groups and were not equally represented in discussions of regulation and illicit activity. Growers and grower advocates were largely the only interest group discussing cannabis cultivation practices (e.g., water conservation strategies), and were the only group to represent concerns for grower well-being. Prior to legalization, growers were quoted asking for regulations to effectively legalize cannabis and uphold their farmer identities. As one grower in 2015 mentioned, without regulation, authorities could not determine “who’s a good farmer and who’s bad. And so, farmers live under this constant shadow of fear.” As regulations were proposed and instituted, the cost of compliance (e.g., cost of permitting and water storage infrastructure) was a prevalent and well-discussed concern for their well-being. Following legalization, another grower was quoted saying, “After 40 years of feeling pretty spunky and loose, we are wallowing in a miasma of regulations and permits, ordinances, tariffs. The costs are crushing. Small farmers can’t realize a profit.” In 2016, a Humboldt County grower noted that, “We were all criminals a year ago, so it’s hard to get into that mindset where you’re given rules that we really didn’t have before. It’s a lot to take into account to try and conform.”
Despite these regulatory concerns, growers and NGO representatives did present adaptive cultivation strategies for legal cannabis. ET-CA growers were described as “master breeders” in producing drought-tolerant strains, and many echoed a desire for “rain-grown cannabis” as an environmentally friendly branding opportunity that also worked within regulatory constraints for water. Toward this goal, one farmer advocated for “a concerted government effort to support tank programs and rainwater catchment ponds.” NGO representatives also described ongoing initiatives to support cannabis growers, such as creating maps of growers’ parcels (upon their request) to help identify “… where landslides will happen if you punch a road… or where you should stay out of the riparian zone with your garden enterprises.” Such support also included calls for “financial help for things like the $70,000 to $100,000 needed for a water storage tank.” Although these strategies did not represent the majority of news media coverage, they exhibit potential solutions for the sustained viability of legal cannabis in the ET-CA.

4. Discussion

Water use allocations are constrained not only by climate-driven water availability, but also by water policies that are in part artifacts of historic use and political power dynamics that are moderated by public opinion. When a new use is demanded, each of these factors can be influential. We examined how these factors operate in tandem to influence surface water availability for legal cannabis in the ET-CA.
Surface water availability for legal cannabis in the ET-CA is highly dynamic and driven by climatic variability, yet public discourse may not reflect these climate trends. Our results illustrate that under current regulations, grower access to surface water covaries with AR and precipitation frequency. Because slow oscillations in climate affect physical water availability, securing a full water right partially hinges on the phase of the climate cycle. Furthermore, amidst a rapidly changing climate, decadal wet and dry fluctuations are larger in magnitude than the linear trends in precipitation, soil moisture, streamflow, and AR frequency (Figure S2). Although this decadal variability has been inconsistent in the last 350 years [86], more extreme North Pacific pressure regimes tied to anthropogenic climate change [29,87] may exacerbate the prominent cycles noted in more recent years. Nonetheless, climate and weather patterns were rarely discussed in news media as a mediating factor for surface water availability. Additionally, references to groundwater were few, perhaps due to its lack of physical visibility [76], even though the impact of unregulated groundwater withdrawals for cannabis cultivation is a growing concern [24,88]. Thus, while water access for cannabis has been and will continue to be largely influenced by climate and weather, public discourse in the news does not appropriately acknowledge this relationship.
While hydroclimatic variability plays a large role in surface water availability [89], policies stipulate how, when, and to whom water is available for use. We found that current water-use regulations, coupled with the multi-year drought phase of northern California’s inherent wet and dry cycles [13,38], have unbalanced impacts on water availability depending on the water right volume. Small water rights were more likely to be completely filled on a year-to-year basis, and the Reliability never dropped below 90%. In contrast, water access was particularly unreliable (<50%) for registered water rights ≥1200 m3 and for growers who are unable to divert for a full 24 h/day. Although 65% of registered cannabis water rights are less than 600 m3, the State Water Resources Control Board does issue larger water rights that are difficult to fulfill during most years. Moreover, our estimates of legal surface water availability represent a best-case scenario. While diverting for 8-24 h/day is quite realistic, we also assume that growers take advantage of each legal diversion day. The reliability of securing a full 900 m3 water right over the past 30 years, for example, declines from 69% to 54% for a grower diverting on ¾ of legal diversion days for 8 h/day. This scenario pertains to nearly 20% of legal growers that have a registered water right permit ≥900 m3. Such policy-mediated water scarcity compounds on the existing grower concern of physical water storage limitations [60].
Analysis of public discourse in cannabis-water news media exhibits several challenges of regulating and incentivizing legal cannabis cultivation in northern California. Media coverage largely focused on illicit cannabis cultivation and surface water use, despite roughly 20 years of legalized medicinal cannabis and four years of legalized recreational cannabis. The language and framing of water demand for cannabis underscores the controversies of incorporating cannabis into the current regulatory framework, particularly how it is associated with a “voracious thirst” while its actual water needs remain unclear. Furthermore, the interest group perspectives represented across articles reflect preexisting controversies surrounding cannabis water use, as well as divergent interests. Regulation and illicit activity were the main focus of cannabis-water news reports, but they were mostly discussed from a government perspective and not by growers themselves. Moreover, grower well-being was not explicitly discussed by any interest group other than growers and grower organizations. This divergence highlights how these perspectives may often be represented at odds with each other, rather than synergistically, as well as how grower perspectives may not be appropriately considered in developing a regulatory framework for cannabis water use. Additionally, certain perspectives, particularly members and Tribal government representatives of the Yurok and Karuk Tribes, are rarely represented in popular news media in comparison to those of federal or state government personnel—an unfortunately common occurrence in water management [41]. Given the importance of media coverage in framing and reflecting public opinion [69,70,71] and creating narratives around natural resource management [76,79], this imbalanced representation of key stakeholders and their priorities may exacerbate controversies regarding legal cannabis and its water use regulations.

Limitations and Future Work

We were not able to explore factors that influence streamflow and diversion days at the scale of individual watersheds or drainages. The direct impact of climate on streamflow in this region is influenced by rock and soil moisture [90], differences in underlying lithology [91], and the extent to which ARs produce local precipitation [92]. Knowledge about how climate interacts with watershed characteristics could help refine water-use regulations. We were not able to explore how alternative water-use regulations (e.g., using different methods for calculating instream flow requirements) impact the reliability of water right permits. A more in-depth sensitivity analysis could provide additional insight into policy-mediated water availability. This study primarily considers surface water availability for legal cannabis, and therefore did not account for illegal cannabis diversions or groundwater extractions. Qualitative insight, such as from interviews, can help illuminate the situations faced by legal (or transitioning) cannabis growers and related stakeholders, and could provide in-depth perspectives for further interpreting and contextualizing our results.

5. Conclusions

Legal cannabis cultivation is an agricultural frontier, subject to new resource-use regulations. These regulations and their implications are a nascent area of research, especially since cannabis is often considered in its illicit capacity as a source of environmental degradation. We provide evidence that natural climate oscillations, in combination with restrictive water-use policies, can limit water availability for legal cannabis cultivation. Public discourse frames the relationships between hydroclimate factors, water policy, and water availability in ways that exacerbate stakeholder controversies and widen the chasm toward effectively managing legalized cannabis.
In a water-scarce environment like the ET-CA, change toward a more equitable water allocation policy will be difficult. The apparent differences across interest group perspectives suggest that garnering public support for any change may be difficult without a careful and inclusive search for novel allocation solutions, starting with bringing compliant cannabis growers to the table. An increasing number of states in the USA are legalizing cannabis cultivation and facing a new regulatory era for cannabis. If policies do not account for hydroclimatic variability, respond to grower concerns, and address sociocultural controversies, grower compliance and industry viability will remain elusive. By assessing policy through broad social and ecological drivers, cannabis cultivation—in the ET-CA and beyond—can be more sustainably integrated into agricultural resource management and better adapt to current and future climatic variability and water-use concerns.

Supplementary Materials

The following are available online at https://www.mdpi.com/2073-4441/13/1/5/s1, Table S1: USGS gages and instream flow criteria sourced from the Cannabis Cultivation Policy [15], Figure S1: Time series of diversion days calculated at 19 USGS gages within the ET-CA, with individual gages depicted as colored lines (a) and the associated correlation matrix for diversion days across gages (b)., Figure S2: Time series of (a) atmospheric river frequency, (b) streamflow, (c) precipitation, and (d) soil moisture with linear trend and p-value related to trend significance.

Author Contributions

Conceptualization, B.M.; data curation, B.M., K.S., J.S.A. and C.N.M.; formal analysis, B.M., K.S., J.S.A. and C.N.M.; investigation, B.M., K.S., J.S.A. and C.N.M.; methodology, B.M., K.S., J.S.A., C.N.M., M.W.B., S.-Y.S.W. and N.H.; Project administration, N.H.; supervision, M.W.B., N.H. and S.-Y.S.W.; visualization, B.M., K.S., J.S.A. and C.N.M.; writing—original draft, B.M., K.S., J.S.A. and C.N.M.; writing—review and editing, B.M., K.S., J.S.A., C.N.M., M.W.B., and N.H. All authors have read and agreed to the published version of the manuscript.

Funding

This project was supported by the National Science Foundation under Grant No. 1633756.

Data Availability Statement

The data and code that support the findings of this study are assembled in an online data repository through Hydroshare (https://doi.org/10.4211/hs.699227b982f5498281709e3d23a8cfce) [93].

Acknowledgments

We acknowledge the help, feedback, and support of students, faculty, and mentors within the Climate Adaptation Science (CAS) program.

Conflicts of Interest

The authors declare no conflict of interest.

References

  1. Boelens, R.; Hoogesteger, J.; Swyngedouw, E.; Vos, J.; Wester, P. Hydrosocial territories: A political ecology perspective. Water Int. 2016, 41, 1–14. [Google Scholar] [CrossRef] [Green Version]
  2. Linton, J.; Budds, J. The hydrosocial cycle: Defining and mobilizing a relational-dialectical approach to water. Geoforum 2014, 57, 170–180. [Google Scholar] [CrossRef]
  3. Graham, N.T.; Hejazi, M.I.; Chen, M.; Davies, E.G.R.; Edmonds, J.A.; Kim, S.H.; Turner, S.W.D.; Li, X.; Vernon, C.R.; Calvin, K.; et al. Humans drive future water scarcity changes across all Shared Socioeconomic Pathways. Env. Res. Lett. 2020, 15, 014007. [Google Scholar] [CrossRef]
  4. Haddeland, I.; Heinke, J.; Biemans, H.; Eisner, S.; Flörke, M.; Hanasaki, N.; Konzmann, M.; Ludwig, F.; Masaki, Y.; Schewe, J.; et al. Global water resources affected by human interventions and climate change. Proc. Natl. Acad. Sci. USA 2014, 111, 3251–3256. [Google Scholar] [CrossRef] [PubMed] [Green Version]
  5. Veldkamp, T.I.E.; Wada, Y.; Aerts, J.C.J.H.; Ward, P.J. Towards a global water scarcity risk assessment framework: Incorporation of probability distributions and hydro-climatic variability. Env. Res. Lett. 2016, 11, 024006. [Google Scholar] [CrossRef] [Green Version]
  6. Schewe, J.; Heinke, J.; Gerten, D.; Haddeland, I.; Arnell, N.W.; Clark, D.B.; Dankers, R.; Eisner, S.; Fekete, B.M.; Colón-González, F.J.; et al. Multimodel assessment of water scarcity under climate change. Proc. Natl. Acad. Sci. USA 2014, 111, 3245–3250. [Google Scholar] [CrossRef] [Green Version]
  7. Fant, C.; Schlosser, C.A.; Gao, X.; Strzepek, K.; Reilly, J. Projections of Water Stress Based on an Ensemble of Socioeconomic Growth and Climate Change Scenarios: A Case Study in Asia. PLoS ONE 2016, 11, e0150633. [Google Scholar] [CrossRef] [Green Version]
  8. Gollehon, N.; Quinby, W. Irrigation in the American West: Area, Water and Economic Activity. Int. J. Water Resour. Dev. 2000, 16, 187–195. [Google Scholar] [CrossRef]
  9. Johnston, W. Cross Sections of a Diverse Agriculture: Profiles of California’s Agricultural Production Regions and Principal Commodities; Giannini Foundation, University of California: Davis, CA, USA, 2003. [Google Scholar]
  10. Cooley, H.; Gleick, P.; Wilkinson, R. Agricultural Water Conservation and Efficiency Potential in California; National Resource Defense Council: San Francisco, CA, USA, 2014; p. 8. [Google Scholar]
  11. Owen, D. California groundwater management, science-policy interfaces, and the legacies of artificial legal distinctions. Env. Res. Lett. 2019, 14, 12. [Google Scholar] [CrossRef]
  12. State Water Resources Control Board. A Guide to California Water Rights Appropriations; California Environmental Protection Agency, Division of Water Rights: Sacramento, CA, USA, 2000; p. 34. [Google Scholar]
  13. Wilson, T.S.; Sleeter, B.M.; Cameron, D.R. Mediterranean California’s water use future under multiple scenarios of developed and agricultural land use change. PLoS ONE 2017, 12, e0187181. [Google Scholar] [CrossRef] [Green Version]
  14. Hossack, J. Leading the way in sustainable practices: How the cannabis cultivation policy is rethinking water management in California. Hastings Environ. Law J. 2019, 25, 21. [Google Scholar]
  15. State Water Resources Control Board. Cannabis Cultivation Policy: Principles and Guidelines for Cannabis Cultivation; State Water Resources Control Board, State of California: Sacramento, CA, USA, 2019; p. 117. [Google Scholar]
  16. Bauer, S.; Olson, J.; Cockrill, A.; van Hattem, M.; Miller, L.; Tauzer, M.; Leppig, G. Impacts of surface water diversions for marijuana cultivation on aquatic habitat in four northwestern California watersheds. PLoS ONE 2015, 10, e0120016. [Google Scholar] [CrossRef] [Green Version]
  17. Butsic, V.; Carah, J.K.; Baumann, M.; Stephens, C.; Brenner, J.C. The emergence of cannabis agriculture frontiers as environmental threats. Env. Res. Lett. 2018, 13, 124017. [Google Scholar] [CrossRef]
  18. Short Gianotti, A.G.; Harrower, J.; Baird, G.; Sepaniak, S. The quasi-legal challenge: Assessing and governing the environmental impacts of cannabis cultivation in the North Coastal Basin of California. Land Use Policy 2017, 61, 126–134. [Google Scholar] [CrossRef]
  19. Gabriel, M.W.; Wengert, G.M.; Higley, J.M.; Krogan, S.; Sargent, W.; Clifford, D.L. Rodenticides on Illegal Marijuana Crops Harm Wildlife. Wildl. Prof. 2013, 5, 46–50. [Google Scholar]
  20. Thompson, C.; Sweitzer, R.; Gabriel, M.; Purcell, K.; Barrett, R.; Poppenga, R. Impacts of Rodenticide and Insecticide Toxicants from Marijuana Cultivation Sites on Fisher Survival Rates in the Sierra National Forest, California: Impacts of toxicants on fisher survival. Conserv. Lett. 2014, 7, 91–102. [Google Scholar] [CrossRef] [Green Version]
  21. Franklin, A.B.; Carlson, P.C.; Rex, A.; Rockweit, J.T.; Garza, D.; Culhane, E.; Volker, S.F.; Dusek, R.J.; Shearn-Bochsler, V.I.; Gabriel, M.W.; et al. Grass is not always greener: Rodenticide exposure of a threatened species near marijuana growing operations. BMC Res. Notes 2018, 11, 94. [Google Scholar] [CrossRef] [Green Version]
  22. Stoa, R.B. Comparative Cannabis: Approaches to Marijuana Agriculture Regulation in the United States and Canada. Univ. Pac. Law Rev. 2017, 49, 29. [Google Scholar]
  23. Dettinger, M. Climate change, atmospheric rivers, and floods in California: A multimodel analysis of storm frequency and magnitude changes. J. Am. Water Resour. Assoc. 2011, 47, 514–523. [Google Scholar] [CrossRef]
  24. Dillis, C.; Grantham, T.E.; McIntee, C.; McFadin, B.; Grady, K. Watering the Emerald Triangle: Irrigation sources used by cannabis cultivators in Northern California. Calif. Agr. 2019, 73, 146–153. [Google Scholar] [CrossRef]
  25. Griffin, D.; Anchukaitis, K.J. How unusual is the 2012-2014 California drought? Geophys. Res. Lett. 2014, 41, 9017–9023. [Google Scholar] [CrossRef] [Green Version]
  26. Yoon, J.-H.; Wang, S.-Y.S.; Gillies, R.R.; Kravitz, B.; Hipps, L.; Rasch, P.J. Increasing water cycle extremes in California and in relation to ENSO cycle under global warming. Nat. Commun. 2015, 6, 8657. [Google Scholar] [CrossRef] [PubMed] [Green Version]
  27. O’Brien, J.P.; O’Brien, T.A.; Patricola, C.M.; Wang, S.-Y.S. Metrics for understanding large-scale controls of multivariate temperature and precipitation variability. Clim. Dyn. 2019, 53, 3805–3823. [Google Scholar] [CrossRef] [Green Version]
  28. Guirguis, K.; Gershunov, A.; Shulgina, T.; Clemesha, R.E.S.; Ralph, F.M. Atmospheric rivers impacting Northern California and their modulation by a variable climate. Clim. Dyn. 2019, 52, 6569–6583. [Google Scholar] [CrossRef] [Green Version]
  29. Swain, D.L.; Tsiang, M.; Haugen, M.; Singh, D.; Charland, A.; Rajaratnam, B.; Diffenbaugh, N.S. The extraordinary California drought of 2013/2014: Character, context, and the role of climate change. BAMS 2014, 2014, 17. [Google Scholar]
  30. Gershunov, A.; Shulgina, T.; Ralph, F.M.; Lavers, D.A.; Rutz, J.J. Assessing the climate-scale variability of atmospheric rivers affecting western North America: Atmospheric River Climate-Scale Behavior. Geophys. Res. Lett. 2017, 44, 7900–7908. [Google Scholar] [CrossRef]
  31. Bodwitch, H.; Carah, J.; Daane, K.M.; Getz, C.; Grantham, T.E.; Hickey, G.M.; Wilson, H. Growers say cannabis legalization excludes small growers, supports illicit markets, undermines local economies. Calif. Agr. 2019, 73, 177–184. [Google Scholar] [CrossRef]
  32. Polson, M. Making marijuana an environmental issue: Prohibition, pollution, and policy. Environ. Plan. E Nat. Space 2019, 2, 229–251. [Google Scholar] [CrossRef]
  33. Corva, D. Requiem for a CAMP: The life and death of a domestic U.S. drug war institution. Int. J. Drug Policy 2014, 25, 71–80. [Google Scholar] [CrossRef]
  34. Hall, W.; Lynskey, M. Evaluating the public health impacts of legalizing recreational cannabis use in the United States: Impacts of legalizing recreational cannabis use. Addiction 2016, 111, 1764–1773. [Google Scholar] [CrossRef]
  35. LaChance, J.C. “We can’t just be a county that supports inebriants”: Voices of the noncannabis agricultural community. Calif. Agr. 2019, 73, 169–176. [Google Scholar] [CrossRef]
  36. Valachovic, Y.; Quinn-Davidson, L.; Stackhouse, J.; Butsic, V. Perceptions of cannabis among Humboldt County timberland and ranchland owners. Calif. Agr. 2019, 73, 161–168. [Google Scholar] [CrossRef]
  37. Polson, M.; Petersen-Rockney, M. Cannabis farmers or criminals? Enforcement-first approaches fuel disparity and hinder regulation. Calif. Agr. 2019, 73, 185–193. [Google Scholar] [CrossRef]
  38. Nelson, K.S.; Burchfield, E.K. Effects of the Structure of Water Rights on Agricultural Production During Drought: A Spatiotemporal Analysis of California’s Central Valley. Water Resour. Res. 2017, 53, 8293–8309. [Google Scholar] [CrossRef]
  39. DuMars, T.; Minnis, M. New Mexico Water Law: Determining Public Welfare Values in Water Rights Allocation. Ariz. Law Rev. 1989, 31, 25. [Google Scholar]
  40. Pahl-Wostl, C.; Tàbara, D.; Bouwen, R.; Craps, M.; Dewulf, A.; Mostert, E.; Ridder, D.; Taillieu, T. The importance of social learning and culture for sustainable water management. Ecol. Econ. 2008, 64, 484–495. [Google Scholar] [CrossRef]
  41. Finn, M.; Jackson, S. Protecting Indigenous Values in Water Management: A Challenge to Conventional Environmental Flow Assessments. Ecosystems 2011, 14, 1232–1248. [Google Scholar] [CrossRef]
  42. Grant, D.L. Two models of public interest review of water allocation in the west. Water Law Rev. 2006, 9, 35. [Google Scholar]
  43. Swyngedouw, E. The Political Economy and Political Ecology of the Hydro-Social Cycle. J. Contemp. Water Res. Educ. 2009, 142, 56–60. [Google Scholar] [CrossRef]
  44. McDaniels, T.L.; Axelrod, L.J.; Cavanagh, N.S.; Slovic, P. Perception of Ecological Risk to Water Environments. Risk Anal. 1997, 17, 341–352. [Google Scholar] [CrossRef]
  45. Candidi, L. Informal Communities and Cannabis Regulation in the Emerald Triangle. In Governance Beyond the Law; International Political Economy Series; Palgrave Macmillan: London, UK, 2019; Volume 1, pp. 267–289. [Google Scholar]
  46. Rasmusson, E.M.; Wang, X.; Ropelewski, C.F. The biennial component of ENSO variability. J. Mar. Syst. 1990, 1, 71–96. [Google Scholar] [CrossRef]
  47. Dettinger, M.D.; Cayan, D.R.; Diaz, H.F.; Meko, D.M. North–South Precipitation Patterns in Western North America on Interannual-to-Decadal Timescales. J. Clim. 1998, 11, 17. [Google Scholar] [CrossRef]
  48. Barlow, M.; Nigam, S.; Berbery, E.H. ENSO, Pacific Decadal Variability, and U.S. Summertime Precipitation, Drought, and Stream Flow. J. Clim. 2001, 14, 24. [Google Scholar] [CrossRef] [Green Version]
  49. Gershunov, A.; Shulgina, T.; Clemesha, R.E.S.; Guirguis, K.; Pierce, D.W.; Dettinger, M.D.; Lavers, D.A.; Cayan, D.R.; Polade, S.D.; Kalansky, J.; et al. Precipitation regime change in Western North America: The role of Atmospheric Rivers. Sci. Rep. 2019, 9, 9944. [Google Scholar] [CrossRef]
  50. Payne, A.E.; Magnusdottir, G. Dynamics of Landfalling Atmospheric Rivers over the North Pacific in 30 Years of MERRA Reanalysis. J. Clim. 2014, 27, 7133–7150. [Google Scholar] [CrossRef] [Green Version]
  51. Guan, B.; Waliser, D.E. Detection of atmospheric rivers: Evaluation and application of an algorithm for global studies: Detection of Atmospheric Rivers. J. Geophys. Res. Atmos. 2015, 120, 12514–12535. [Google Scholar] [CrossRef]
  52. Shields, C.A.; Rutz, J.J.; Leung, L.-Y.; Ralph, F.M.; Wehner, M.; Kawzenuk, B.; Lora, J.M.; McClenny, E.; Osborne, T.; Payne, A.E.; et al. Atmospheric River Tracking Method Intercomparison Project (ARTMIP): Project goals and experimental design. Geosci. Model. Dev. 2018, 11, 2455–2474. [Google Scholar] [CrossRef] [Green Version]
  53. Kalnay, E.; Kanamitsu, M.; Kistler, R.; Collins, W.; Deaven, D.; Gandin, L.; Iredell, M.; Saha, S.; White, G.; Woollen, J.; et al. The NCEP/NCAR 40-Year Reanalysis Project. Bull. Am. Meteorol. Soc. 1996, 77, 437–471. [Google Scholar] [CrossRef] [Green Version]
  54. Adler, R.F.; Huffman, G.J.; Chang, A.; Ferraro, R.; Xie, P.-P.; Janowiak, J.; Rudolf, B.; Schneider, U.; Curtis, S.; Bolvin, D.; et al. The Version-2 Global Precipitation Climatology Project (GPCP) Monthly Precipitation Analysis (1979–Present). J. Hydrometeorol. 2003, 4, 21. [Google Scholar] [CrossRef]
  55. Fan, Y.; van den Dool, H. Climate Prediction Center global monthly soil moisture data set at 0.5° resolution for 1948 to present. J. Geophys. Res. 2004, 109, 8. [Google Scholar] [CrossRef] [Green Version]
  56. De Cicco, L.A.; Lorenz, D.; Hirsch, R.M.; Watkins, W. dataRetrieval: R Packages for Discovering and Retrieving Water Data Available from U.S. Federal Hydrologic Web Services; U.S. Geological Survey: Reston, VA, USA, 2018.
  57. Murakami, M. Large-Scale Aspects of Deep Convective Activity over the GATE Area. Mon. Weather Rev. 1979, 107, 994–1012. [Google Scholar] [CrossRef] [Green Version]
  58. Mooney, H.A.; Zavaleta, E. (Eds.) Ecosystems of California; University of California Press: Oakland, CA, USA, 2016; ISBN 978-0-520-27880-6. [Google Scholar]
  59. Tessman, S.A. Environmental Use Sector: Reconnaissance Elements of the Western Dakotas Region. of South. Dakota Study; Water Resources Institute, South Dakota State Univ: Brookings, SD, USA, 1979. [Google Scholar]
  60. Dillis, C.; McIntee, C.; Butsic, V.; Le, L.; Grady, K.; Grantham, T. Water storage and irrigation practices for cannabis drive seasonal patterns of water extraction and use in Northern California. J. Environ. Manag. 2020, 272, 110955. [Google Scholar] [CrossRef] [PubMed]
  61. Division of Water Rights. eWRIMS—Electronic Water Rights Information Management System; State Water Resources Control Board: Sacramento, CA, USA, 2020. [Google Scholar]
  62. Hashimoto, T.; Stedinger, J.R.; Loucks, D.P. Reliability, resiliency, and vulnerability criteria for water resource system performance evaluation. Water Resour. Res. 1982, 18, 14–20. [Google Scholar] [CrossRef] [Green Version]
  63. Sandoval-Solis, S.; McKinney, D.C.; Loucks, D.P. Sustainability Index for Water Resources Planning and Management. J. Water Resour. Plann. Manag. 2011, 137, 381–390. [Google Scholar] [CrossRef] [Green Version]
  64. Wilson, H.; Bodwitch, H.; Carah, J.; Daane, K.; Getz, C.; Grantham, T.E.; Butsic, V. First known survey of cannabis production practices in California. Calif. Agr. 2019, 73, 119–127. [Google Scholar] [CrossRef] [Green Version]
  65. Elo, S.; Kyngäs, H. The qualitative content analysis process. J. Adv. Nurs 2008, 62, 107–115. [Google Scholar] [CrossRef]
  66. Gagnon, M.; Gudiño, D.; Guta, A.; Strike, C. What Can we Learn from the English-Language Media Coverage of Cannabis Legalization in Canada? Subst. Use Misuse 2020, 1–4. [Google Scholar] [CrossRef]
  67. Corbett, J.B. Communicating Nature: How We Create and Understand Environmental Messages; Island Press: London, UK, 2006. [Google Scholar]
  68. Fabra-Crespo, M.; Rojas-Briales, E. Analysis of mass media news on forest issues: A case study of Spain. For. Syst 2015, 24, e029. [Google Scholar] [CrossRef] [Green Version]
  69. McCombs, M.E.; Shaw, D.L.; Weaver, D.H. New Directions in Agenda-Setting Theory and Research. Mass Commun. Soc. 2014, 17, 781–802. [Google Scholar] [CrossRef]
  70. McCombs, M.E.; Shaw, D.L. The Agenda-Setting Function of Mass Media. Public Opin. Q. 1972, 36, 176–187. [Google Scholar] [CrossRef]
  71. Cockerill, K. Testing Language: Media Language Influence on Public Attitudes About River Management. Appl. Environ. Educ. Commun. 2003, 2, 23–37. [Google Scholar]
  72. Flint, C.G.; Wynn, E.; Paveglio, T.; Boyd, A.; Bullock, C. Variations in Newspaper Coverage on Water in the U.S. Intermountain West. J. Am. Water Resour Assoc. 2019, 55, 1306–1322. [Google Scholar] [CrossRef]
  73. Scheufele, D.A.; Tewksbury, D. Framing, Agenda Setting, and Priming: The Evolution of Three Media Effects Models: Models of Media Effects. J. Commun. 2007, 57, 9–20. [Google Scholar] [CrossRef]
  74. Schmid, A.N.; Thompson, J.R.; Bengston, D.N. The Public Discourse About Land Use and Water Quality: Themes in Newspapers in the Upper Mississippi River Basin. Appl. Environ. Educ. Commun. 2007, 6, 187–196. [Google Scholar] [CrossRef]
  75. Kim, H.; Kim, S.-H. Framing marijuana: How U.S. newspapers frame marijuana legalization stories (1995–2014). Prev. Med. Rep. 2018, 11, 196–201. [Google Scholar] [CrossRef] [PubMed]
  76. Bernacchi, L.A.; Fernandez-Bou, A.S.; Viers, J.H.; Valero-Fandino, J.; Medellín-Azuara, J. A glass half empty: Limited voices, limited groundwater security for California. Sci. Total Environ. 2020, 738, 139529. [Google Scholar] [CrossRef] [PubMed]
  77. de Loë, R.C. Dam the news: Newspapers and the Oldman River Dam project in Alberta. J. Environ. Manag. 1999, 55, 219–237. [Google Scholar] [CrossRef]
  78. Spurgeon, S.L. Miracles in the Desert: Literature, Water, and Public Discourse in the American West. Interdiscip. Stud. Lit. Environ. 2009, 16, 743–759. [Google Scholar] [CrossRef]
  79. Quesnel, K.J.; Ajami, N.K. Changes in water consumption linked to heavy news media coverage of extreme climatic events. Sci. Adv. 2017, 3, e1700784. [Google Scholar] [CrossRef] [Green Version]
  80. Saldana, J. An introduction to codes and coding. In The Coding Manual for Qualitative Researchers; SAGE Publications: London, UK, 2016; pp. 1–40. [Google Scholar]
  81. O’Connor, C.; Joffe, H. Intercoder Reliability in Qualitative Research: Debates and Practical Guidelines. Int. J. Qual. Methods 2020, 19, 160940691989922. [Google Scholar] [CrossRef]
  82. Allen, M. The SAGE Encyclopedia of Communication Research Methods; SAGE Publications, Inc.: Thousand Oaks, CA, USA, 2017; ISBN 978-1-4833-8143-5. [Google Scholar]
  83. Krippendorf, K. Content Analysis: An. Introduction to its Methodology, 2nd ed.; SAGE Publications, Inc: Thousan Oaks, CA, USA, 2004. [Google Scholar]
  84. Johnstone, J.A. A quasi-biennial signal in western US hydroclimate and its global teleconnections. Clim. Dyn. 2011, 36, 663–680. [Google Scholar] [CrossRef] [Green Version]
  85. Fulton, J.; Cooley, H.; Gleick, P.H. California’s Water Footprint; Pacific Institute: Oakland, CA, USA, 2012; p. 53. [Google Scholar]
  86. St. George, S.; Ault, T.R. Is energetic decadal variability a stable feature of the central Pacific Coast’s winter climate? J. Geophys. Res. 2011, 116, D12102. [Google Scholar] [CrossRef]
  87. Wang, S.-Y.; Hipps, L.; Gillies, R.R.; Yoon, J.-H. Probable causes of the abnormal ridge accompanying the 2013-2014 California drought: ENSO precursor and anthropogenic warming footprint: Diagnosing California Drought 2013–14. Geophys. Res. Lett. 2014, 41, 3220–3226. [Google Scholar] [CrossRef] [Green Version]
  88. Zipper, S.C.; Carah, J.K.; Dillis, C.; Gleeson, T.; Kerr, B.; Rohde, M.M.; Howard, J.K.; Zimmerman, J.K.H. Cannabis and residential groundwater pumping impacts on streamflow and ecosystems in Northern California. Env. Res. Commun. 2019, 1, 125005. [Google Scholar] [CrossRef]
  89. Veldkamp, T.I.E.; Wada, Y.; de Moel, H.; Kummu, M.; Eisner, S.; Aerts, J.C.J.H.; Ward, P.J. Changing mechanism of global water scarcity events: Impacts of socioeconomic changes and inter-annual hydro-climatic variability. Glob. Environ. Chang. 2015, 32, 18–29. [Google Scholar] [CrossRef]
  90. Rempe, D.M.; Dietrich, W.E. Direct observations of rock moisture, a hidden component of the hydrologic cycle. Proc. Natl. Acad. Sci. USA 2018, 115, 2664–2669. [Google Scholar] [CrossRef] [Green Version]
  91. Hahm, W.J.; Rempe, D.M.; Dralle, D.N.; Dawson, T.E.; Lovill, S.M.; Bryk, A.B.; Bish, D.L.; Schieber, J.; Dietrich, W.E. Lithologically Controlled Subsurface Critical Zone Thickness and Water Storage Capacity Determine Regional Plant Community Composition. Water Resour. Res. 2019, 55, 3028–3055. [Google Scholar] [CrossRef]
  92. Ralph, F.M.; Neiman, P.J.; Wick, G.A.; Gutman, S.I.; Dettinger, M.D.; Cayan, D.R.; White, A.B. Flooding on California’s Russian River: Role of atmospheric rivers. Geophys. Res. Lett. 2006, 33, L13801. [Google Scholar] [CrossRef] [Green Version]
  93. Morgan, B.; Spangler, K.; Stuivenvolt Allen, J.; Morrisett, C.; Brunson, M.; Wang, S.Y.S.; Huntly, N. Water Availability for Cannabis in Northern California: Intersections of Climate, Policy, and Public Discourse. Available online: http://www.hydroshare.org/resource/699227b982f5498281709e3d23a8cfce (accessed on 21 December 2020).
Figure 1. Map of the Emerald Triangle along the North Coast of California.
Water 13 00005 g001
Figure 2. (a) Map of USGS streamflow gauges used for cannabis water compliance and points of diversion for registered cannabis growers (as of 2 Sep 2020). Data courtesy of USGS, eWRIMS, the National Hydrography Dataset (Plus Version 2.1), and Esri, and (b) Count of registered cannabis water right storage volumes (as of 2 September 2020) from eWRIMS with a beneficial use of “irrigation”, diversion rate of 37.85 L/min (10 gal/min), and diversion season of 1 November–31 March.
Water 13 00005 g002
Figure 3. Linearly detrended and band-pass filtered (8–20 years) precipitation, AR frequency, streamflow and soil moisture for the ET-CA (left). Power spectra of respective ET-CA moisture variables, with the grey rectangle indicating the spectral peak of a 11- to 17-year cycle in each moisture variable (right). The dotted orange and red lines represent the 95% and 90% confidence intervals from the power spectrum of a first order Markov process.
Water 13 00005 g003
Figure 4. Time-series of published news articles discussing cannabis and water in the ET-CA grouped by month and year.
Water 13 00005 g004
Figure 5. Water resource performance metrics (reliability, resilience, vulnerability) for surface water availability between 1980–2019, including: (a) the likelihood of securing a full water right permit volume, (b) the likelihood of securing a full water right permit following a year where the full permit volume was not secured, and (c) the average of additional diversion days needed to secure a full water right permit volume in the case of a shortage.
Water 13 00005 g005
Figure 6. Band-pass filtered (8–20 year) AR frequency and diversion days (contours). AR frequency spans 1948–2019, while diversion days calculated from 11 USGS gauges with a long enough period of record are displayed from 1954–2019. The days needed to secure different water rights at a 12 h/day diversion operation are shown as horizontal dotted lines.
Water 13 00005 g006
Figure 7. Frequency of code co-occurrence between a given Interest Group and Discussion theme.
Water 13 00005 g007
Table 1. Search terms used for each search platform (newspaper database and newspaper archives specific to a given local outlet).
Search PlatformSearch Terms
Newspaper database(California or “Emerald Triangle” or “Northern California” or Humboldt or Mendocino or Trinity) AND
(cannabis or marijuana) AND
(water or climate or weather or storm or rain or “atmospheric river” or irrig$ or diver$ or groundwater or river or stream or creek)
Newspaper archivescannabis AND water
Table 2. Codes used within categories and their definitions.
CategoryCodeDefinition
ClimateClimate and weatherBroad mentions of climate and weather, such as drought and rain
Climate changeSpecific mentions of changes to or new patterns in climate/weather
PolicyRegulationReferences to the regulatory framework for cannabis water use
PermittingSpecific mentions of permitting, including cost, applications, etc.
Water useCultivation practicesReferences to practices that affect cannabis water demand and use
GeographyReferences to the geographical location of cannabis water use
Illicit activityReferences to illicit cannabis water use
InfrastructureReferences to physical items for water access, storage, application
ImpactInstream availabilityImpact of cannabis water use on stream ecosystems
Off-stream availabilityImpact of cannabis water use on other off-stream users
Underground availabilityImpact of cannabis water use on groundwater availability
Grower well-beingImpact of cannabis water use on grower well-being, quality of life
Publisher’s Note: MDPI stays neutral with regard to jurisdictional claims in published maps and institutional affiliations.