Abstract
Anthropogenic landscape changes cause significant disturbances to fluvial system dynamics and such is the case of the watersheds studied near the Spanish Mediterranean coast (Cartagena). Economic growth resulted in the addition of external water resources from the Tajo River (1979) as part of the National Water Plan (1933). Irrigation water has caused the water table to rise since 1979. Furthermore, water resources have boosted urban touristic expansion, industrial estates, and road infrastructures. This study presents a diagnosis of the official flood hazard maps by applying remote sensing techniques that enable the identification of (i) areas flooded during recent events; and (ii) the possible effects of anthropogenic actions on fluvial processes affecting flooding (land use and land cover change—LULCC). The flooded areas were identified from a multispectral satellite image taken by a sensor on Sentinel-2. A multi-temporal analysis of aerial photographs (1929, 1956, 1981, 2009, and 2017) showing the fluvial and anthropic environment at a detailed scale (1:25,000) was used to define the fluvial geomorphology and the main anthropic alterations on the Rebollos ephemeral stream. Official inputs from geographical information repositories about land use were also gathered (LULC). The result was compared to the official flood hazard maps (SNCZI) and this revealed floodable areas that had not been previously mapped because official maps rely only on the hydraulic method. Finally, all the recent changes that will have increased the disastrous consequences of flooding have been detected, analyzed, and mapped for the study area.
1. Introduction
Man is changing the way he occupies the territory in search of greater economic returns. The disappearance of traditional landscapes breaks an equilibrium with the natural environment, altering the climate, biogeochemical cycles, and biodiversity [1,2]. Anthropic coverage is currently comparable to the world’s large natural ecosystems [3,4,5], a situation that impacts on river environments [6].
Changes caused in river systems impact processes of sedimentation, transport, and erosion. At a local level in the Segura River Basin in Spain, studies show that human actions (construction of infrastructure and changes in land use) have increased erosion, reduced the run-off threshold, and fragmented fluvial processes [7,8,9,10,11]. Similar scenarios are occurring in other parts of the world [12,13,14,15,16,17].
The watersheds studied are located in the southeast of the peninsula, within the Segura hydrographic basin (CHS) in the Campo de Cartagena, and corresponding to the Rebollos and Miranda ephemeral streams (ramblas in Spanish) (Figure 1). According to Conesa García and García García [18], numerous floods have occurred in the city of Cartagena and these have increased considerably since the beginning of the 16th century as a consequence of the expansion of the city towards the plains and the termination of the ephemeral stream in the sea. Paradoxically, there is a water shortage in the area, and demand is increasing. This shortage has been partly resolved by the external supply of water following the construction of the Tagus-Segura Transfer (TTS) [19] which forms part of the national water infrastructure and transfer plan (1933). These public works have enabled economic development, and at the same time, have transformed the landscape. The consequences have been a chaotic growth of the territory, a change in farming practices from traditional dry farming to irrigation, a negative change in the perception of risk, and the exposure of new areas to flooding [20,21,22,23,24,25,26].
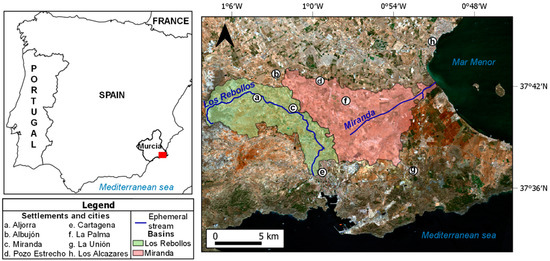
Figure 1.
Location of the studied watersheds with the main cities and settlements (Murcia, Spain).
Royal Decree 903/2010, of 9 July, states that each main river authority must prepare hazard maps, with methodological coordination with the SNCZI. The corresponding studies were carried out in 2012 for the Segura basin.
Various studies have recognized that the hydraulic method is frequently used for flood hazard mapping [18,27,28], a case that is similar to that of the basins under study. The flows were calculated using the rational method given the absence of gauging stations, and so mapping did not cover all the areas exposed to real flooding events.
The importance of this present study is that it provides a mapping proposal that integrates the complementary information necessary for the study of the basins at a detailed scale. For its preparation, the anthropic environment was included in the geomorphological analysis and satellite images were used. Combining these elements helps us understand the presence of areas at risk of flooding that are not linked to the natural morphodynamics of the river systems, as well identify infrastructures and changes in land use that alter the river system and affect flooding. Therefore, the main objective of this study is to complement and develop a diagnosis of the official flood hazard maps by identifying areas that have been flooded in recent events, and using a knowledge of the river dynamics in the watersheds of the Rebollos and Miranda ephemeral streams in the Campo de Cartagena, in the Region of Murcia (Spain).
2. Materials and Methods
The work involved a combination of several inter-related methodologies (5). The manipulation and creation of the information was carried out using the Quantum GIS (QGIS 2.18.16 and 3.10) System for Automated Geoscientific Analyses (SAGA 2.3.2) and the ESRI ArcGIS 10.3 programmes. Information was initially consulted and collected in different formats and sources such as bibliography, cartography, and numerical and remote sensor data. Chronologically, the methodologies are integrated as follows in Figure 2.

Figure 2.
Flow chart with all the items that constitute the methodology.
2.1. Land Use Changes
The methodology is taken from the publication of Pontius et al. [29]. The data used is taken from aerial photographs (1956 and 1981) at a scale of 1:25,000 and the Corine Land Cover (CLC) vector layer of 2018. The classes used correspond to level 1 of this database. To determine the changes, each class was identified with a unique code; however, between the vectorial layers of each year, the codes differ by tens as shown in Figure 3.
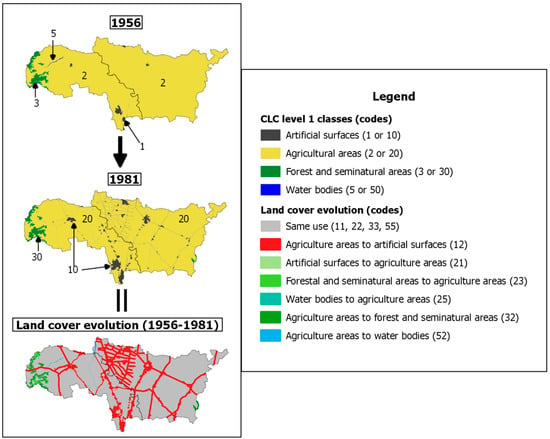
Figure 3.
Land cover changes methodology.
Once the areas of each land use were determined, two cross tabulation matrices were created so that it was possible to calculate the variability over time of persistence, gain, loss, total change, exchange, and net change. These values revealed interrelations between land uses over time.
Table 1 shows the calculations made to obtain the parameters shown in Pontius et al. [29]. The exchange value (S) results from calculating twice the minimum value between gains (G) and losses (Ls). This calculation assumes that each cell that gains is paired with a cell that loses, thus producing an exchange. The net change (NC) results from the absolute value of the difference between G and Ls, the result corresponding to the cells that did not exchange. The total change (TC) was calculated from the sum of NC and S.

Table 1.
Parameters of land use change. Based on the Pontius et al. (1929) methodology.
2.2. Meteorological Background
Scientific publications and news sources were researched for the dates of the main flooding events, and this enabled a selection of photographs (2009 and 2016) and satellite images (2019) to be used in geomorphological mapping. Additionally, the rainfall series from the Aljorra weather station (located within the studied basin) was used to determine the intensity duration frequency (IDF) curve based on the Gumbel probability distribution method (values later used in the calculation of the flow).
2.3. Morphometry and Calculation of the Basin Flow
The physical characteristics of the basin enable establishing the hydrological behavior, specifically of the Rebollos ephemeral stream. For the development, several geoprocesses were applied to the 5 m digital terrain model (DTM) (Figure 4), in addition to using vector layers at a detailed scale (≤1:25,000) such as the Spanish Land Cover/Land Use Information System (SIOSE), and an interpretation of the soil types derived from the geological map of the Spanish Geological and Mining Institute (IGME) [30,31].
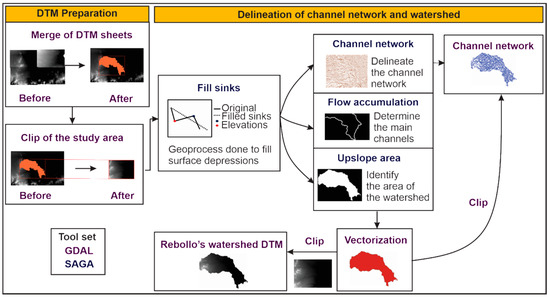
Figure 4.
Geoprocess to delineate and describe the channel networks and watershed.
Calculation and processing have been carried out on the basis of publications by Franco [32], Cardona [33], and Olaya [34]. The fundamental geoprocess applied were the filling of depressions (SAGA), the calculation of the main drainage, the channel network with its hierarchical order, and the delimitation of the basin catchment area to the desired control point. To achieve this, SAGA tools were used: catchment area (flow tracing) using the Rho 8 method; as well as channel network with drainage basins and upslope area, respectively. Once the basic measurements of area (A), perimeter (P), and main channel length (L) were found, the morphometric parameters of the basin were calculated according to the equations shown in Table 2. The parameters enabled establishing the current state of the basin, which is essential information for fluvial geomorphology.

Table 2.
Equations related to the watershed morphometric parameters.
The calculation of the flow rate was made using the rational method (<50 km2) for the section identified with the code ES070/NA/09/031. This calculation enabled a comparison with the official SNCZI study (2012). The flow rate ) was calculated from Equation (1) and is part of "Standard 5.2-IC Road Surface Drainage". The variables that compose the equation are: rainfall intensity (I) corresponding to a return period (T) for a drainage point; average run-off coefficient (C); basin area (A); and the coefficient of uniformity in the time distribution of precipitation (). Each of the variables were found, except . Detailed scale inputs were implemented (DTM, SIOSE, and soil map) for the calculation of
2.4. Map of River Geomorphology
Using aerial photographs, satellite images, and DTM, the geomorphological units of the fluvial and human environment were defined. The description was made on the basis of the publications of Díez-Herrero et al. [35] and the cartographic proposals of the British Geological Survey [36] as modified by Price et al. [37]. The integration of these proposals enabled the changes produced by human action in the river system to be included.
Due to the current global pandemic, which began at the end of 2019, field monitoring was based on freely accessible data from interactive platforms (Google Earth and Street View) and digital material (press, Wikiloc, YouTube, and the Google search engine). This information made it possible to distinguish characteristics of flood events and terrain, and this type of material is part of land observation for understanding hydrological cycles [38].
A proprietary design was used for the map and the symbols of the legend (Figure 5) at a scale of 1:25,000. This product was used to identify the anthropogenic actions that need special attention when making land use plans, since an unsuitable location and design could increase proneness to flooding, a risk that is often overlooked in official studies. Flood-prone areas are shown with the methodology presented here.
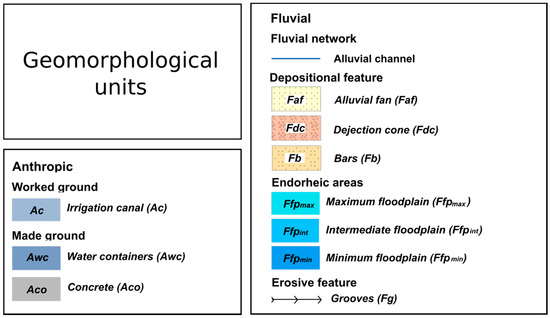
Figure 5.
Geomorphological units used in this research work.
Subsequently, actions that have caused alterations and changes in river dynamics (Table 3) that influence flood proneness were identified in a vectorial layer. The publications implemented are those of Ollero, Ojeda, and García [39] and Pérez Cutillas et al. [10] Taking into account morphologically homogeneous areas (production zone, alluvial fan, and plain) and using evidence from aerial photographs taken in the years 1929, 1956, 1981, 2009, and 2017.

Table 3.
Types of human interventions. Modified from Pérez Cutillas et al. [10].
2.5. Flood Exposed Areas
To identify the flooded areas, two freely available multi-spectral images were used from the European Space Agency’s Copernicus Programme [40], taken by the Sentinel-2A platform’s MultiSpectral Instrument (MSI) sensor. The images feature level-2A processing and geometric, radiometric, and atmospheric correction. The images correspond to the moment (19 August 2019) prior to a flood and to the outcome of the flood (13 September 2019). The areas with water were detected by applying the modified normalized differential water index (MNDWI) developed by Xu [41], defined as the subtraction between the green band (GREEN (B03)) and the shortwave infrared (SWIR (B11)) divided by the sum of the mentioned bands. The MNDWI is defined in the following expression.
The index suppresses the response of built-up areas and vegetation by improving the detection of flooded areas [42]. The threshold (0.0983386) for classifying flooded areas was found from monitoring points, supported by information from the media and the natural colors of the satellite image (Figure 6). All areas corresponding to clouds and buildings were removed for quality control. To eliminate the Mar Menor, the difference between the areas detected on the day of the event and before the event was identified using the QGIS raster calculator, and so only the flooded land areas remained.
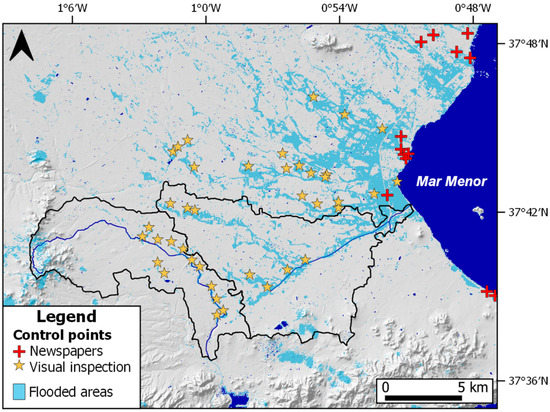
Figure 6.
Control points to determine flood threshold. Data were based on newspaper articles and visual inspection from RGB bands of Sentinel-2 satellite images.
Subsequently, to obtain the areas that were not included in the SNCZI mapping with a return period of 500 years, the symmetric difference geoprocess (SAGA) was implemented between the vectorial layer of flooded areas during a real event and the vectorial layers of the floodable areas in the SNCZI flood hazard mapping. As a final measure, the most detailed polygons at the scale (1:25,000) were excluded (meaning those with an area of less than 100 m2).
3. Results and Discussion
Special emphasis in the results was placed on the watershed of the Rebollos ephemeral stream, while the analysis of the Miranda ephemeral stream was less rigorous. The results of the items listed in the methodology are described below.
3.1. Land Use Changes
Between 1956 and 2018, the main land use was farming, and for this reason few changes occurred in the watersheds of the Miranda and Rebollos ephemeral streams (8% and 12%, respectively). Most of the changes that did occur were the creation of artificial surfaces (6.7% and 10.9%, respectively). Despite the relatively few changes, proneness to flooding increased, and for this reason it is necessary to introduce inputs at a detailed scale to detect minimal changes.
Figure 7 shows that the first multi-temporal analysis reveals a greater detail in the changes in land use for both watersheds, apparently showing that more than half of the changes occurred between 1956 and 1981 following the construction of the TTS infrastructure (1979).
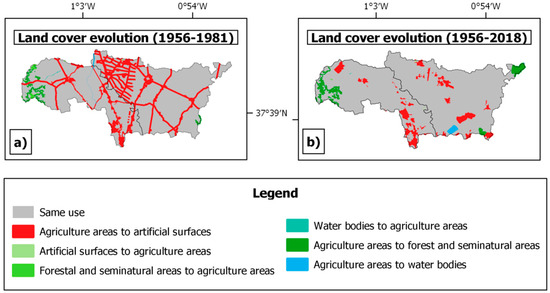
Figure 7.
Land cover changes in the Rebollos and Miranda watersheds. (a) Changes determined between 1956 and 1981; (b) changes detected between 1956 and 2018.
The second multi-temporal analysis was carried out with the vectorial layer interpreted from the aerial photograph of 1956 and the CLC of 2018. The changes are not so evident and are concentrated in the expansion of population centers. Changes in small roads and canals were lost due to the lesser detail of the 2018 layer (1:100,000). The importance of inputs at a detailed scale (≤1:25,000), such as the SIOSE for flood studies, is controversial and has been developed in research such as that of Ramón Morte et al. [43]. The difference in the infiltration capacity of covers may have a significant effect on the runoff coefficient, a situation that can be seen later in the chapter on river geomorphology and exposure.
The dynamics of change in land use in the two watersheds have been mainly net changes with little exchange, indicating little replacement of lost land use (Table 4 and Table 5). The slight increase in forested areas is due to the fact that the Miranda and Rebollos watersheds have been protected as conservation areas.

Table 4.
Land use change parameters, period of time: 1956–2018. Rebollos watershed.

Table 5.
Land use change parameters, period of time: 1956–2018. Miranda watershed.
3.2. Metrological Antecedents
In the last two decades five torrential rainfall events (Figure 8) have been identified in association with cut-off lows (known as gotas frías in Spanish). In September 2009, the largest amount of accumulated precipitation in a single downpour was recorded (335.2 litres per square metre), and aerial photographs meant that this was a key event for the geomorphological characterization. Frequent torrential rainfalls have occurred over the last four years (3). The satellite image used in the detection of flood zones corresponds to one of the middling downpours (203.4 mm). Torrential rainfalls have had an impact on the territory and the perception of risk and have led to a reconsideration of the usefulness of preserving old farming practices such as rain-fed agriculture [44].
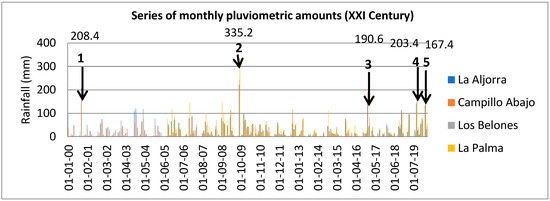
Figure 8.
Series of monthly accumulated rainfall in meteorological stations within the watersheds studied.
3.3. Morphometric Characteristics and Flow Calculation
The Rebollos watershed has a drainage area of 62 km2 with little topographic variation (362 m), and a perimeter of 73 km which is determined by lithology and the current erosion cycle. The water network has a dendritic to sub-dendritic pattern and consists of a main channel called Los Rebollos, which runs for 26.38 km with a very gentle gradient. Three other secondary watersheds (Simonetes, Saladillo, and El Pericón) add to this channel during flooding.
Table 6 contains the key morphometric parameters that define the behavior of the watershed. The basin is asymmetrical and elongated, which means light to moderately sudden flow peaks, and the watershed tends not to accumulate large volumes of water. The slope of the terrain is mostly gentle, which is reflected in slow flow speeds. The basin is old and has little potential for erosion or significant sedimentary accumulation.

Table 6.
Morphometric parameters.
In the study area, the water table is measured using piezometers located within the Miranda watershed. The data shows a marked rise in the water table in 1985, when the level reached 40.75 m. The increase was then progressive until 2011 when it reached 6.23 m. From 2011 onwards, there were few fluctuations, and behavior was stable (Figure 9). This configuration leads to a rapid saturation of the soil during heavy rainfalls, especially when such rainfalls last a long time.
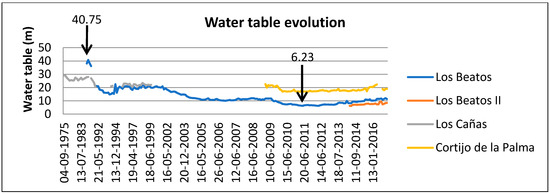
Figure 9.
Water table evolution in Miranda.
The inputs for the calculation of the flow differ from the official inputs. This is the case for the layout of the main channel, the IDF curves, and the runoff threshold. The channel layout used in this research was confirmed using a 2009 aerial photograph taken after a flood; consequently, the dimensions of the parameters found (A, L, m, and tc) differ from the official figures because the official figures were not based on verifications of the channels. In the official studies, the maximum daily rainfall and runoff threshold were obtained from MAX PLU WIN by CEDEX. In contrast, in the present work, the values were estimated (Table 7) using detailed scale inputs (type of soil, land use, and slope).

Table 7.
Flow values: official values vs. research.
The value of the runoff threshold (Po) in the official study is 12.87, while the value found in this present study is 10.03. This difference is substantial and has a significant influence on the flow calculation. When scaled to the southeast of the peninsula for return periods of 100 and 500 years the calculation gives high flow values, 54 and 118 respectively, and these figures that are far from those published in official studies.
3.4. Geomorphology and Alterations in the Fluvial System
The mapping of the fluvial geomorphology (Figure 10) captures the processes (deposition, erosion, and endorheism) involved in the short term, and so provides information that, together with other methods, more precisely determines the danger of flooding [45].
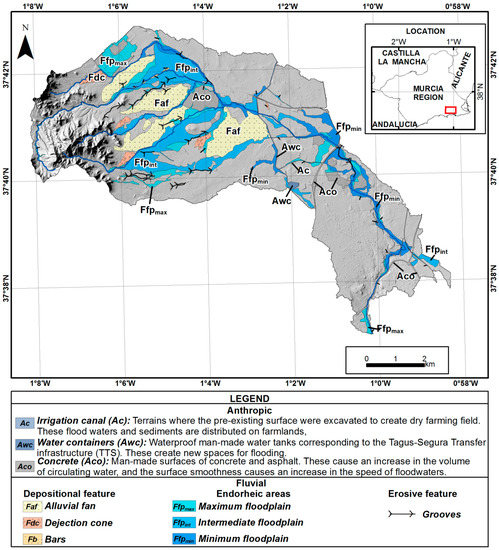
Figure 10.
Fluvial geomorphology in the Rebollos watershed. Anthropic and fluvial agents were included in the analysis.
German flood hazard mapping guidelines mention the importance of including "hot spots" in the mapping, which are equivalent to some of the anthropogenic actions mapped in this research [46]. The presence of these elements helps improve flood preparedness as places of special risk are recognized.
The anthropic component in the environment explains the sudden fragmentation produced by the superimposition of works, the acceleration of processes generated by the expansion of artificial surfaces, and so on (as these phenomena are not natural). Osti [47] includes human-induced factors in the evaluation of threats, and yet despite their importance, they are often not mapped. Work relating to human interventions is mainly linked to river restoration [48], or the evaluation and monitoring of hydrogeomorphology [10]. By integrating the anthropic environment in the analysis, anthropic actions that cause alterations to the river system can be explained.
Figure 11 shows the 30 anthropogenic actions identified in the Rebollos watershed. These affect flooding in various ways and cause alterations for decades, while the fluvial system recovers its stability.
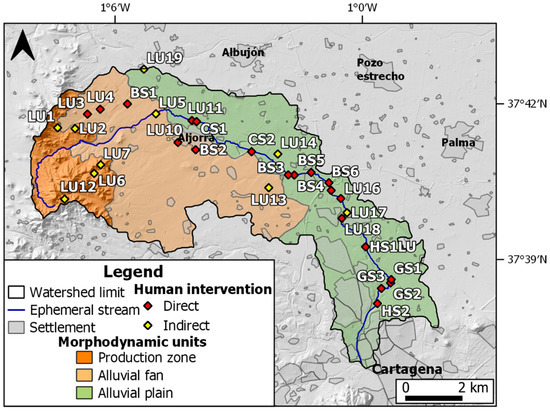
Figure 11.
Human interventions in the Rebollos watershed.
3.4.1. Production Zone
At the head of the ephemeral streams, the increasing growth of low-level vegetation has been observed. At the same time, in some sectors of the watershed, there has been an increase in the extension of terraced farming areas. In addition, prior to the time analyzed in the photographs, other evidence was found that shows that larger species, for example, Valencian oak (Quercus faginea), once predominated in the area. Publications such as those by Lillo Carpio [49], Carrillo López et al. [50], Zamora and Grandal [51] and Hernández et al. [52] agree that anthropogenic pressure, due to agricultural development and climate change, has reduced the forests and degraded the soils.
A total of five indirect actions related to land use have been observed. The configuration of the change in land use has made available clasts and sediments which, together with the torrential rainfall typical of the region, facilitate the dragging of material downstream [7]. This hypothesis is quantitatively supported by the regional study carried out by Pérez Cutillas et al. [53] who, based on land use and field sampling, suggests a high erodibility of the soil as measured by the K factor according to Wang et al. [54]. Other evidence includes a 2009 aerial photograph (Figure 12), and the audio-visual record by García [55] showing the transport of sediments from the headwaters to the alluvial fan and which seem related to low concentration flows (according the Charlton classification) [6].
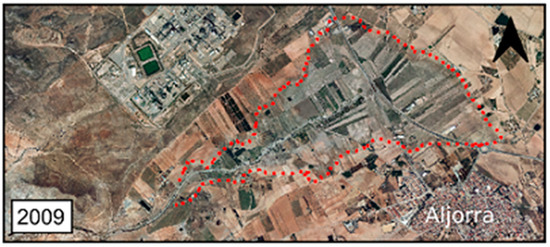
Figure 12.
Sedimentary record. The dashed red line delimits the maximum range of sediments coming from the Pericón mountain range.
The alterations caused in the river dynamics are caused by a loss of sinuosity and a narrowing of the channels as a consequence of the erosion of the upper parts and downstream deposition. These processes accelerate the arrival of the peak flood flows to urban areas due to the loss of width, the shortening of the length of the riverbed, and the reduction in transport space, and this results in a quicker filling time (Figure 13).
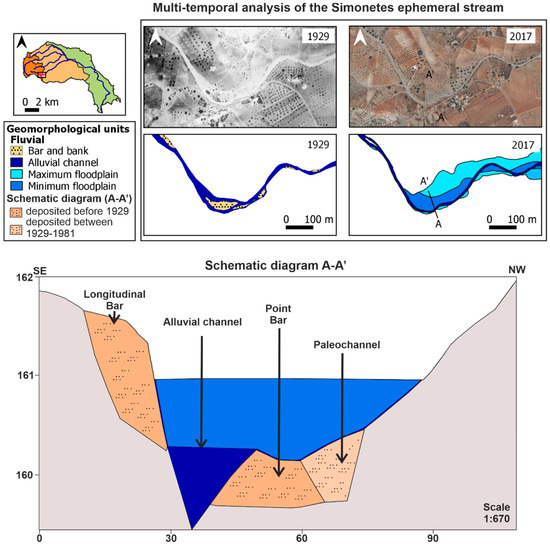
Figure 13.
Changes in the fluvial system. In the multi-temporal series, the upper part shows aerial photography in 1929 and 2017, while the lower part shows how the Simonetes ephemeral stream narrowed its channel. The schematic diagram (A-A’) shows the evolution of deposited sediments over time by means of multi-temporal analysis, and in this way the limit of the deposits was inferred.
3.4.2. Alluvial Plain and Fan
The sediments from the production zone (headwater) are deposited on the alluvial fans, the material and flow that manages to pass this zone reaches and nourishes the alluvial plains. These interrelations form a complex system with processes that are affected every time an artificial change causes obstruction. A total of 10 and 15 actions have been identified, respectively. The most frequent is related to changes in land use, and the cases presented relate to expansion of artificial surfaces; densification of crops; use of plastics in farming; adaptation of land for works; cleaning of water courses; and the construction of bridges, the TTS water transfer channel, roads, buildings, and sewage systems.
The actions that have significantly altered the fluvial geomorphology are:
- Artificial surfaces that waterproof the soil.
- Changes in the terrain that invade the area of river mobility.
- The TTS infrastructure that causes a loss of connectivity between the fan and the floodplain.
- Cross-sectional works in conjunction with artificial surfaces that increase downstream incision processes (Figure 14).
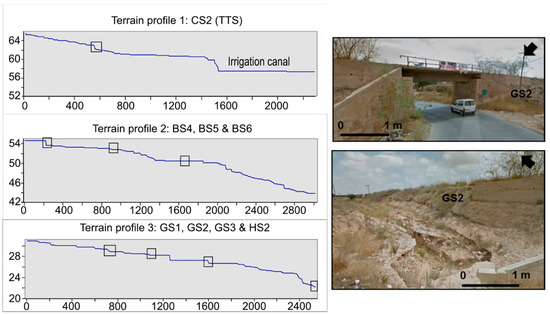 Figure 14. The left section shows the terrain profile for a longitudinal ephemeral stream channel. Human interventions have changed the erosive features (CS2, BS4, BS5, BS6, GS1, GS2, GS3, and HS2). The right section shows some groove evidence taken from Google Street Map (08/2012). The road and gabion wall both influence erosion.
These alterations increase the volumes of circulating flow in the floodable area due to the waterproofing of soils, exposure of new areas to flooding, and the increase in the speed of the peak flow due the ground being smoother. Some of these cases can be seen in Figure 15.
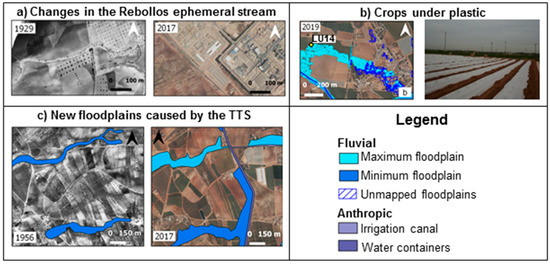
Figure 15.
Human interventions that alter flooding in the Rebollos watershed. (a) the Rebollos ephemeral stream disappears due to the terrain modification to an industrial estate, (b) flow rate and exposure increase as a result of the use of plastic on crops, and (c) loss of floodplain connectivity, and consequently, increased exposure of new areas to flooding.
3.5. Areas Exposed to Flooding Not Covered in the SNCZI
Approximately 3.8 km2 of floodable areas are not part of the official flood hazard map (Figure 16). In the Rebollos watershed, a joint analysis of the river and human geomorphology has revealed that, despite the limited extension of artificial surfaces and plastic coverings, these have influenced the creation of new floodable zones, the clearest examples of which can be seen in the areas surrounding the TTS water channel and areas with crops grown under plastic.
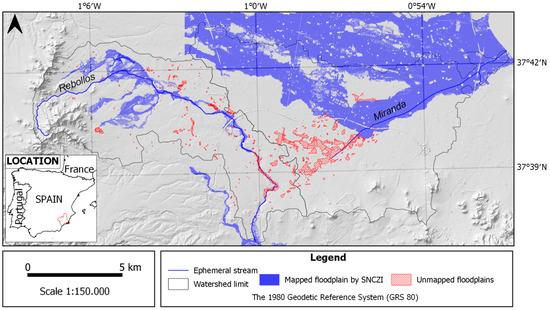
Figure 16.
Floodable areas that have not been mapped by the official SNCZI mapping.
The areas flooded on 13 September 2019 reveal that flood hazard mapping has not been carried out for the whole watershed. This is because the watersheds in the official studies do not have gauging stations, and so the mapped area was restricted to the control point that enabled the calculation of the flow using the rational method (≤50 km2), specifically in the case of the Rebollos watershed. In the case of the Miranda watershed, the flows from the Rebollos valley were not considered, which limited the floodable areas to those derived from the flows from the El Albujón valley (which does have a gauging station). The absence of gauging stations should prompt risk management professionals to look for alternatives to realistically assess flood risk [56,57], a situation that does not occur in the official study of the watersheds analyzed here.
Human intervention has generated several floodable areas in the studied watershed, mainly linked to the TTS water channel (Figure 17). The expansion of artificial surfaces, the modification of the land with constructions crossing the valley to mitigate the lack of connectivity, the use of plastics for irrigated crops, and the invasion of the river mobility spaces are phenomena that simulations sometimes fail to recreate. This is because of the complexity of the physical processes of reality that must be simulated for the hydraulic method [58,59].
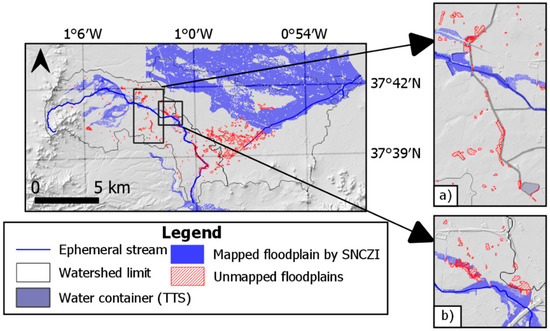
Figure 17.
Flood-prone areas caused by human intervention: (a) shows floodable areas produced by terrain modifications made to mitigate the lack of fluvial connectivity caused by the Tagus-Segura Transfer (TTS) water channel; in the case of (b) irrigated crops under plastic produce a large extension of water during floods.
4. Conclusions
Official river flood hazard studies with a return period of 500 years are incomplete. A total of 3.8 km2 of floodable area in the investigated area is not registered in the official SNCZI mapping. If we consider that the area not included in the official studies corresponds to intermediate (203.4 mm) rather than extreme accumulated rainfall for the period 2000–2019, this indicates that the hydraulic method is unable to accurately measure risk in some areas. For this reason, it is necessary to complement this method with other methods to obtain valuable information for river flood hazard mapping. This study proposes and calibrates the suitability of new mapping methodologies. Similarly, it is recommended that official SNCZI studies make field reviews and inspections with remote sensors to update the maps of analyzed river networks, since during our research inconsistencies were found with the current layout of the ephemeral stream channel.
The geomorphological mapping presented has made it possible to explain the floodable zones that have not been mapped in the SNCZI. This has been made possible by using GIS software, knowledge of river and human processes, and inputs at a detailed scale such as DTM, satellite images, and aerial photographs. This approach enables relating two environments that interact with each other, a situation that will increase given the growth of the world’s population and the need for economic development.
The inclusion of the anthropic dimension has made it possible to explain the floodable zones that are not associated with a main ephemeral stream channel and do not respond to natural processes. This study identified new floodable areas that have been generated around the TTS water transport infrastructure and the economic activities it promotes, as a result of the modification of the terrain to mitigate the lack of connectivity between the valley and floodplains. An additional factor is the use of plastics for covering irrigated crops. The identification of the anthropic elements that affect flooding provides tools for land planning and flood risk management.
Although fieldwork was not possible due to the global pandemic, resources for the research were found on the internet. Virtual information from social networks and interactive portals have been used in other related research and produced excellent results, for this reason, importance should be given to this type of research data when it is reliable.
Author Contributions
Methodology and conceptualization, V.B.-S., A.R.-M., and E.G.-B.; supervision, A.R.-M. and E.G.-B.; processing multispectral sentinel-2 images, V.B.-S. and A.R.-M.; flood map analysis, V.B.-S.; investigation, V.B.-S., E.G.-B., and A.R.-M.; writing, V.B.-S.; review and editing, A.R.-M. and E.G.-B. All authors have read and agreed to the published version of the manuscript.
Funding
This research was funded and conducted by the SIOSE-INNOVA Project (CSO2016-79420-R AEI/FEDERUE. Ministry of Science and Innovation. Spain).
Institutional Review Board Statement
Not applicable.
Informed Consent Statement
Informed consent was obtained from all subjects involved in the study.
Data Availability Statement
All researchers involved approve the availability of the data.
Acknowledgments
The authors are grateful to the SIOSE-INNOVA Project for funding and supporting this research and the Segura Hydrographic Confederation (Spanish Ministry for the Ecological Transition—MITECO) for data given on the Rebollos ephemeral stream.
Conflicts of Interest
The authors declare no conflict of interest.
References
- Matson, P.A.; Parton, W.J.; Power, A.G.; Swift, M.J. Agricultural intensification and ecosystem properties. Science 1997, 277, 504–509. [Google Scholar] [CrossRef] [PubMed]
- Foley, J.; DeFries, R.; Asner, G.; Barford, C.; Bonan, G.; Carpenter, S.; Chapin, F.S.; Coe, M.T.; Daily, G.C.; Gibbs, H.K.; et al. Global consequences of land use. Science 2005, 309, 570–574. [Google Scholar] [CrossRef] [PubMed]
- Ellis, E.; Wang, H.; Peng, K.; Ping Liu, X.; Cheng Li, S.; Ouyang, H.; Cheng, X.; Zhang Yang, L. Measuring long-term ecological changes in densely populated landscapes using current and historical high resolution imagery. Remote Sens. Environ. 2006, 100, 457–473. [Google Scholar] [CrossRef]
- Ellis, E. Long-term ecological changes in the densely populated rural landscapes of China. In Ecosystems and Land Use Change, Geophysical Monographs Series, 1st ed.; DeFries, R., Asner, G., Houghton, R., Eds.; American Geophysical Union: Washington, DC, USA, 2004; Volume 153, pp. 303–320. [Google Scholar]
- Achard, F.; Eva, H.D.; Stibig, H.J.; Mayaux, P.; Gallego, J.; Richards, T.; Malingreau, J.P. Determination of deforestation rates of the world’s humid tropical forests. Science 2002, 297, 999–1002. [Google Scholar] [CrossRef] [PubMed]
- Charlton, R. Fundamentals of Fluvial Geomorphology, 1st ed.; Routledge: London, UK, 2008. [Google Scholar]
- Conesa García, C.; Pérez Cutillas, P. Alteraciones geomorfológicas recientes en los sistemas fluviales mediterráneos de la Península Ibérica: Síntomas y problemas de incisión en los cauces. Rev. Geogr. Norte Gd. 2014, 59, 25–44. [Google Scholar] [CrossRef]
- Conesa García, C.; Pérez Cutillas, P.; García Lorenzo, R.; Martínez Salvador, A. Cambios históricos recientes de cauces y llanuras aluviales inducidos por la acción del hombre. Nimbus 2012, 29–30, 159–176. [Google Scholar]
- Martínez García, V.; Pérez Morales, A. Diferencias en la exposición al riesgo de inundación en la Región de Murcia tras el boom inmobiliario. In Proceedings of the XXVI Congreso de la Asociación Española de Geografía, Valencia, Spain, 22–25 October 2019. [Google Scholar]
- Pérez Cutillas, P.; Conesa García, C.; Torres, A. Dinámica morfológica de un sistema semiárido sometido a actuaciones directas y cambios de usos del suelo. El caso de la rambla de la Carrasquilla (Murcia, España). Rev. Geogr. Valparaíso 2015, 51, 35–56. [Google Scholar]
- Romero Díaz, A.; Belmonte Serrato, F.; Docampo Calvo, A.M.; Ruiz Sinoga, J.D. Consecuencias del sellado de los suelos en el Campo de Cartagena (Murcia). In Proceedings of the Urbanismo expansivo de la utopía a la realidad, XXII Congreso de Geógrafos Españoles, Alicante, Spain, 27–29 October 2011; Gozalvez Pérez, V., Marco, J.A., Eds.; Universidad de Alicante y COMPOBELL S.L.: Alicante, Spain, 2011; pp. 605–616. [Google Scholar]
- Dedkov, A.P.; Mozzherin, V.I. Erosion and sediment yield on the Earth. Proc. Rep. Intern Assoc Hydrol. Sci. 1996, 236, 29–36. [Google Scholar]
- Montgomery, D.R. Soil erosion and agricultural sustainability. Proc. Natl. Acad. Sci. USA 2007, 104, 13268–13272. [Google Scholar] [CrossRef]
- Wilkinson, B.H.; McElroy, B.J. The impact of humans on continental erosion and sedimentation. Geol. Soc. Am. Bull. 2007, 119, 140–156. [Google Scholar] [CrossRef]
- El Alfy, M. Assessing the impact of arid area urbanization on flash floods using GIS, remote sensing, and HEC-HMS rainfall–runoff modeling. Hydrol. Res. 2016, 47, 1142–1160. [Google Scholar] [CrossRef]
- Igulu, B.; Mshiu, E. The impact of an urbanizing tropical watershed to the surface runoff. Glob. J. Environ. Sci. Manag. 2020, 6, 245–260. [Google Scholar]
- Urban, M.A. Conceptualizing Anthropogenic Change in Fluvial Systems: Drainage Development on the Upper Embarras River, Illinois. Prof. Geogr. 2002, 54, 204–217. [Google Scholar] [CrossRef]
- Conesa García, C.; García García, E. Las áreas históricas de inundación en Cartagena: Problemas de drenaje y actuaciones. Boletín Asoc. Geogr. Esp. 2003, 35, 79–100. [Google Scholar]
- Romero Díaz, A.; Belmonte Serrato, F. El Campo de Cartagena una visión global. In Recorridos por el Campo de Cartagena. Control de Degradación y uso Sostenible del suelo; Hernández Bastida, J., Ed.; Fundación Instituto Euromediterráneo del Agua: Murcia, Spain, 2011; pp. 17–48. [Google Scholar]
- Camarasa Belmonte, A.M. Crecidas e inundaciones. In Riesgos Naturales; Ayala-Carcedo, F.J., Olcina, C.J., Eds.; Ariel: Barcelona, Spain, 2002; pp. 859–879. [Google Scholar]
- Machí Felici, X. Influencia de las infraestructuras del transporte en los llanos de inundación. In Avenidas Fluviales e Inundaciones en la Cuenca del Mediterráneo; Gil Olcina, A., Morales Gil, A., Eds.; Servicio de Publicaciones de la Universidad de Alicante: Alicante, Spain, 1989; pp. 523–533. [Google Scholar]
- Mateu Bellés, J. Ríos y ramblas mediterráneos. In Avenidas Fluviales e Inundaciones en la Cuenca del Mediterráneo; Gil Olcina, A., Morales Gil, A., Eds.; Servicio de Publicaciones de la Universidad de Alicante: Alicante, Spain, 1989; pp. 133–150. [Google Scholar]
- Morales Gil, A. Usos tradicionales del suelo y riesgo de avenidas en las tierras del litoral mediterráneo español. In Avenidas Fluviales e Inundaciones en la Cuenca del Mediterráneo; Gil Olcina, A., Morales Gil, A., Eds.; Servicio de Publicaciones de la Universidad de Alicante: Alicante, Spain, 1989; pp. 131–156. [Google Scholar]
- Lemeunier, G.; Pérez Picazo, M.T. La sociedad murciana frente a las inundaciones (1450–1900). In Avenidas Fluviales e Inundaciones en la Cuenca del Mediterráneo; Gil Olcina, A., Morales Gil, A., Eds.; Servicio de Publicaciones de la Universidad de Alicante: Alicante, Spain, 1989; pp. 365–374. [Google Scholar]
- Rosselló Verger, V. Los llanos de inundación. In Avenidas Fluviales e Inundaciones en la Cuenca del Mediterráneo; Gil Olcina, A., Morales Gil, A., Eds.; Servicio de Publicaciones de la Universidad de Alicante: Alicante, Spain, 1989; pp. 243–284. [Google Scholar]
- Caballero, I.; Ruiz, J.; Navarro, G. Sentinel-2 satellites provide near-real time evaluation of catastrophic floods in the west mediterranean. Water 2019, 11, 2499. [Google Scholar] [CrossRef]
- García Botella, E. Desarrollo metodológico de los estudios geomorfológicos en los estudios de inundabilidad en el sureste peninsular. In VI Jornadas de Investigación de la Facultad de Filosofía y Letras de la Universidad de Alicante; Cutillas Orgiles, E., Ed.; Servicio de Publicaciones de la Universidad de Alicante: Alicante, Spain, 2016; pp. 77–86. [Google Scholar]
- Prieto Cerdan, A.; García Botella, E. Incorporación de la peligrosidad de inundación a la infraestructura verde de la comunitat valenciana a escala municipal: El caso del Plan General Estructural de Monòver (Alacant). In XXV Congreso de los Geógrafos Españoles; Asociación Española de Geografía: Madrid, Spain, 2017. [Google Scholar]
- Pontius, R.G.; Shusas, E.; McEachem, M. Detecting important categorical land changes while accounting for persistance. Agric. Ecosyst. Environ. 2004, 101, 251–268. [Google Scholar] [CrossRef]
- Espinosa Godoy, J.S.; Martín Vivaldi, J.M.; Martín Alafont, J.M.; Pereda, M.; Pérez Rojas, A.; López García, J.; González Donoso, J.M. Mapa Geológico y Memoria de la Hoja nº 977 (Cartagena). Mapa Geológico de España E. 1:50.000 ITGE; Instituo Geológico y Minero de España: Madrid, Spain, 1993; p. 22. [Google Scholar]
- Colodrón, I.; Martínez, W.; Núñez, A.; Cabañas, I.; Uralde, M.A.; Navidad, M. Mapa Geológico y Memoria de la Hoja nº 955 (Fuente-Álamo de Murcia). Mapa Geológico de España E. 1:50.000 ITGE; Instituo Geológico y Minero de España: Madrid, Spain, 1993; p. 15. [Google Scholar]
- Franco, R. Concepción e Implementación de un Módulo hidrogeomático para la Evaluación de Disponibilidad de Recursos hídricos. Ph.D. Thesis, Centro Interamericano de Recursos del Agua, Universidad Autónoma del Estado de México, Toluca de Lerdo, México, 2008. [Google Scholar]
- Cardona, B.L. Conceptos Básicos de Morfometría de Cuencas Hidrográficas. Maestría en Energía y Ambiente; Universidad de San Carlos de Guatemala: Antigua, Guatemala, 2012. [Google Scholar]
- Olaya, V. Hidrología Computacional y Modelos Digitales del Terreno: Teoría, Práctica y Filosofía de una Nueva Forma de Análisis Hidrológico. Available online: heart.sourceforge.net (accessed on 20 May 2004).
- Díez-Herrero, A.; Laín-Huerta, L.; Llorente-Isidro, M. Mapas de Peligrosidad por Avenidas e Inundaciones. Guía Metodológica para su Elaboración, 1st ed.; Instituto Geológico y Minero de España: Madrid, Spain, 2008; pp. 55–74. [Google Scholar]
- Rosenbaum, M.S.; McMillan, A.A.; Powell, J.H.; Cooper, A.H.; Culshaw, M.G.; Northmore, K.J. Classification of artificial (man-made) ground. Eng. Geol. 2003, 69, 399–409. [Google Scholar] [CrossRef]
- Price, S.; Ford, J.R.; Cooper, A.H.; Neal, C. Humans as major geological and geomorphological agents in the Anthropocene: The significance of artificial ground in Great Britain. Philos. Trans. Royal Soc. A Math. Phys. Eng. Sci. 2011, 369, 1056–1084. [Google Scholar] [CrossRef]
- McCabe, M.F.; Rodell, M.; Alsdorf, D.E.; Miralles, D.G.; Uijlenhoet, R.; Wagner, W.; Lucieer, A.; Houborg, R.; Verhoest, N.E.C.; Franz, T.E.; et al. The future of Earth observation in hydrology. Hydrol. Earth Syst. Sci. 2017, 21, 3879–3914. [Google Scholar] [CrossRef]
- Ollero, A.; Romeo García, R. Las alteraciones geomorfológicas de los ríos. In Estrategia Nacional de Restauración de Ríos; Subdirección General de Gestión Integrada del Dominio Público Hidráulico Ministerio de Medio Ambiente y Universidad Politécnica de Madrid: Madrid, Spain, 2007. [Google Scholar]
- The Copernicus Open Access Hub. Available online: https://scihub.copernicus.eu/dhus/#/home (accessed on 10 October 2019).
- Xu, H. Modification of normalised difference water index (NDWI) to enhance open water features in remotely sensed imagery. Int. J. Remote Sens. 2006, 27, 3025–3033. [Google Scholar] [CrossRef]
- Rosser, J.F.; Leibovici, D.G.; Jackson, M.J. Rapid flood inundation mapping using social media, remote sensing and topographic data. Nat. Hazards 2016, 87, 103–120. [Google Scholar] [CrossRef]
- Ramon Morte, A.; Navarro, J.T.; García Botella, E. Objective assessment of land use in hydrographical studies. WIT Trans. Ecol. Environ. 2019, 234, 41–51. [Google Scholar]
- Muñoz Garre, P.; Gómez Espín, J.M. Poblamiento y espacio regado en el sureste de la Huerta de Murcia. Efectos de la DANA de los días 12 y 13 de septiembre de 2019. Pap. Geogr. 2020, 66. [Google Scholar] [CrossRef]
- Sánchez, F.J.; Lastra, J. Guía Metodológica para el Desarrollo del Sistema Nacional de Cartografía de Zonas Inundables; Ministerio de Medio Ambiente, y Medio Rural y Marino: Madrid, Spain, 2011; p. 15. [Google Scholar]
- Bund/Länder-Arbeitsgemeinschaft Wasser (LAWA). Flood hazard map guidelines of the German Working Group of the Federal States on Water Issues. LAWA 2006, 12–15. [Google Scholar]
- Osti, R. Framework, approach and process for investment road mapping: A tool to bridge the theory and practices of flood risk management. Water Policy 2016, 18, 419–444. [Google Scholar] [CrossRef]
- Rinaldi, M.; Gurnell, A.M.; Belleti, B.; Berga Cano, M.I.; Bizzi, M.; Bussetini, M.; Gonzalez de Tanago, M.; Grabowski, R.; Habersack, M.; Klösch, M.; et al. Final Report on Methods, Models, Tools to Assess the Hydromorphology of Rivers, Deliverable 6.2, Part 1, of REFORM (REstoring Rivers FOR Effective Catchment Management); European Commission: Brussels, Belgium, 2015. [Google Scholar]
- Lillo Carpio, M. Geomorfología litoral del Mar Menor. Pap. Geogr. 1978, 8, 1978–1979. [Google Scholar]
- Carrillo López, A.F.; Carrión-García, J.S.; Fernández-Jiménez, S.; Ramón-del Cerro, J.L. Toponimia y Biogeografía Histórica de Plantas Leñosas Ibéricas, 1st ed.; Éditum: Murcia, Spain, 2010; pp. 146–147. [Google Scholar]
- Zamora, C.; Grandal, A. Reconstrucción de la vegetación potencial del Campo de Cartagena a la luz de la documentación de su archivo municipal. Ann. Biol. 1999, 22, 69–76. [Google Scholar]
- Hernández, J.; Fernández, M.; Ortuño, A.; Alarcón, M. Influencia del uso del suelo en su calidad ambiental en medio semiárido (Murcia SE España). Rev. Ciências Agrárias 2010, 33, 199–208. [Google Scholar]
- Pérez Cutillas, P.; Barberá, G.; García, C. Evaluación de la erosionabilidad (factor k) y su variabilidad espacial en relación con los usos del suelo. GeoFocus 2019, 23, 71–96. [Google Scholar] [CrossRef]
- Wang, B.; Zheng, F.; Römkens, M. Comparison of soil erodibility factors in USLE, RUSLE2, EPIC and Dg models based on a Chinese soil erodibility database. Acta Agr. Scand. B-S P 2012, 63, 69–79. [Google Scholar] [CrossRef]
- Rambla de Los Simonetes. Available online: https://www.youtube.com/watch?v=c-sJE6z0ESgylc=UgwHNn85VrWwtyxcWdl4AaABAg.98tANdvArTn98tEyqg-kb2 (accessed on 11 November 2013).
- Maswood, M.; Hossain, F. Advancing river modelling in ungauged basins using satellite remote sensing: The case of the Ganges–Brahmaputra–Meghna basin. Int. J. River Basin Manag. 2016, 14, 103–117. [Google Scholar] [CrossRef]
- Rahmati, O.; Pourghasemi, R. Identification of Critical Flood Prone Areas in Data-Scarce and Ungauged Regions: A Comparison of Three Data Mining Models. Water Resour. Manag. 2017, 31, 1473–1487. [Google Scholar] [CrossRef]
- Neal, J.; Villanueva, I.; Wright, N.; Willis, T.; Fewtrell, T.; Bates, P. How much physical complexity is needed to model flood inundation? Hydrol. Process. 2011, 26, 2264–2282. [Google Scholar] [CrossRef]
- Crispino, G.; Gisonni, C.; Iervolino, M. Flood hazard assessment: Comparison of 1D and 2D hydraulic models. Int. J. River Basin. Manag. 2015, 13, 153–166. [Google Scholar] [CrossRef]
Publisher’s Note: MDPI stays neutral with regard to jurisdictional claims in published maps and institutional affiliations. |
© 2021 by the authors. Licensee MDPI, Basel, Switzerland. This article is an open access article distributed under the terms and conditions of the Creative Commons Attribution (CC BY) license (http://creativecommons.org/licenses/by/4.0/).