Rainwater Harvesting Techniques to Face Water Scarcity in African Drylands: Hydrological Efficiency Assessment


1
DIATI, Politecnico di Torino, 10129 Torino, Italy
2
Environmental and Water Engineering Group, Department of Civil Engineering, Universidade da Coruña, 15071 A Coruña, Spain
*
Author to whom correspondence should be addressed.
Water 2020, 12(9), 2646; https://doi.org/10.3390/w12092646
Submission received: 7 August 2020
/
Revised: 9 September 2020
/
Accepted: 16 September 2020
/
Published: 22 September 2020
(This article belongs to the Special Issue Water and Irrigation Management in Arid and Semiarid Zones)
Abstract
:The sub-Saharan climate is experiencing a marked increase in temperature and intensification of precipitation intensity and variability. Besides, longer dry spells are compromising the reliability of local agricultural practices. The present study provides a comprehensive investigation about the benefits induced by using indigenous rainwater harvesting techniques (RWHT) against hydrometeorological threats affecting the Sahelian areas. Different RWHT have been tested in term of runoff retention, infiltration increase into the root zone, and soil water stress mitigation. To achieve these purposes, hydrological processes at the field scale have been investigated using a two-dimensional distributed hydrological model. To make the study representative of the whole Sahelian areas, several simulations were carried out adopting a wide range of input parameters based on conventional values of those areas. The results reveal that RWHT may lead to a runoff retention up to 87% and to double the infiltration. Intercepting and storing runoff, RWHT increase the water content in the root zone and the right design can diminish the crop water stress. Furthermore, the results show that adopting RWHT makes it possible to extend the growing season up to 20 days, enhancing the yield. These benefits contribute to the reduction of the climate-related water stress and the prevention of crop failure.
1. Introduction
Sub-Saharan countries are the poorest regions in the world. Notwithstanding, sub-Saharan Africa has one of the highest fertility rates with 5.4 children per woman, which results in extremely fast population growth [1,2]. The Food and Agriculture Organization of the United Nations (FAO) reports that roughly 30% of the population is undernourished and 40% of infants risk their life due to malnutrition. To face the constant hazard of famine, farmers strive to boost the local agricultural production in their scarcely fertile lands, naturally poor in organic matter. During the last 50 years, the increase in food production was achieved mainly by expanding the extent of cropland but with a scarce cereal yield compared with the rest of the world, since the artificial fertilizers were too expensive for the majority [3,4]. Moreover, the ongoing climate changes are forcing Sahelian farmers to find innovative strategies to deal with droughts, unpredictable rainfall, and depletion of soil nutrients. Climate scientists are studying how global warming is intensifying the hydrological cycle [5]. The warmer atmosphere can store a higher degree of moisture and generate catastrophic rainstorms. The study of Taylor et al. [6] showed how the higher temperature is responsible for tripling the frequency of extreme storms in West African Sahel. The Sahelian storms are among the most powerful on the planet, with intensities exceeding hundreds of mm per hour [7]. The higher frequency of extreme events tied with the incessant land cover changes is leading to severe floods [8,9,10]. Evident examples are the massive downpour that deposited 263 mm of rain over the capital of Burkina Faso, flooded half of the city, and forced 150,000 people to leave their homes, in 2009, and the Niger River flood of 2012, the highest flood ever registered in the Middle Niger Basin. On the other side, studies have confirmed that the amount of precipitation that falls every year is slightly increasing [11,12]. This suggests that more resource is available in a place where the most used farming system is rainfed agriculture. In response, innovative farmers are starting to adopt improved land and water management practices to gain benefits from this climate pattern. Many studies have demonstrated how agroforestry, such as farmed managed natural regeneration (FMNR), and sustainable land and water management (SLWM) practices can help farmers to deal with ecological degradation and significantly boost the food production in drylands [13,14,15,16,17,18]. Recently these techniques have been labeled as climate-smart agriculture for the attitude of mitigating the impacts of climate changes [19,20].
According to the WRI’s investigation (World Resources Institute) [3], improving water and land management on just 25% of sub-Saharan Africa’s cropland would provide an additional 22 million tons of food, moving towards food security. In this paper, we focus on Rainwater Harvesting Techniques as practices used by African farmers to capture rainfall, increase the water use efficiency, reduce crop water stress, and increase the crop survival expectation. The characteristics of simplicity, adaptability, replicability, and the low cost of realization and maintenance make the usage of rainwater harvesting techniques (RWHT) apt in a wide variety of contexts [21]. Furthermore, nearly two-thirds of the sub-Saharan population is employed in the agropastoral sector and could potentially put their effort into expanding the use of these techniques on a wider range of drylands [22].
Among various techniques, some practices have demonstrated to be very effective such as half-moon and planting pits, known locally as demi-lunes and zai/tassa. They are widely used in Burkina Faso, Ethiopia, Mali, and Niger. The study of Zouré et al. [23] clearly showed the multiple benefits of using these farming practices in mitigating the effect of dry spells and improving the crop yield. The functions of catching surface runoff, reducing erosion of fertile topsoil, and increasing infiltration are effective in contrasting the ongoing desertification that affects drought-prone areas [24].
The majority of the investigations related to RWHT are carried out on experimental sites in which experimental plots are instrumented and records are analyzed [23,25,26,27,28,29]. On the contrary, very few research studies have investigated the effect of RWHT through numerical modeling. Welderufael et al. [30] set up a Morin and Cluff (MC) runoff model with the purpose of exploring the rainfall–runoff relationships on treated/nontreated fields in Dera, Ethiopia. The software HYDRUS-2D (distributed by PC Progress, Prague, Czech Republic) was used by Verbist et al. [31] to assess the effectiveness of an infiltration trench installed in a Chilean hillside.
This paper continues previous investigations carried out in the study of RWHT through the numerical modeling approach [32]. The study aims to solve some previous constraints and provides further eco-hydrological analyses. The numerical model chosen for the hydrological analysis is Iber [33]. The capability of simulating the entire hydrological balance permitted to span the temporal scale of analyses from the single event to the entire hydrological season and investigate the subsurface processes. To achieve the objectives and include ecological investigations, a new methodology to account for the crop life cycle into the water balance was implemented in the model and tested.
Two different implementations were carried out in this work aiming to afford an assessment of (1) the hydrological performances of RWHT in terms of infiltration and storage increase, and how the physical characteristics of the site affect them; (2) the ecological benefit induced by the mitigation of crop water stress.
The outcomes show the remarkable benefits induced by the use of such RWHT practices. The enhanced infiltration provides a faster recharge of groundwater, which is available early for crop and later represents a precious storage for plants with a deeper root system. In terms of water management, this means an increase in green water availability for the benefit of a reduction in blue water consumption (groundwater extracted for irrigation) [34,35]. Additionally, the increment of the soil water content prevents crops from reaching the condition of soil water stress, maximizing the yield. Upscaling the diffusion of these simple and affordable techniques would represent the first step towards the enactment of adaptation strategies to cope with climate changes and food scarcity.
The paper is structured into four parts. The first part reports the contextualization of this study. The second describes the core of the numerical model and delineates the methodology. The third part sets out outcomes. Section 4 argues the discussions came out from the results. In the last section, conclusions and future perspectives are drawn.
2. Geographical and Climatological Context
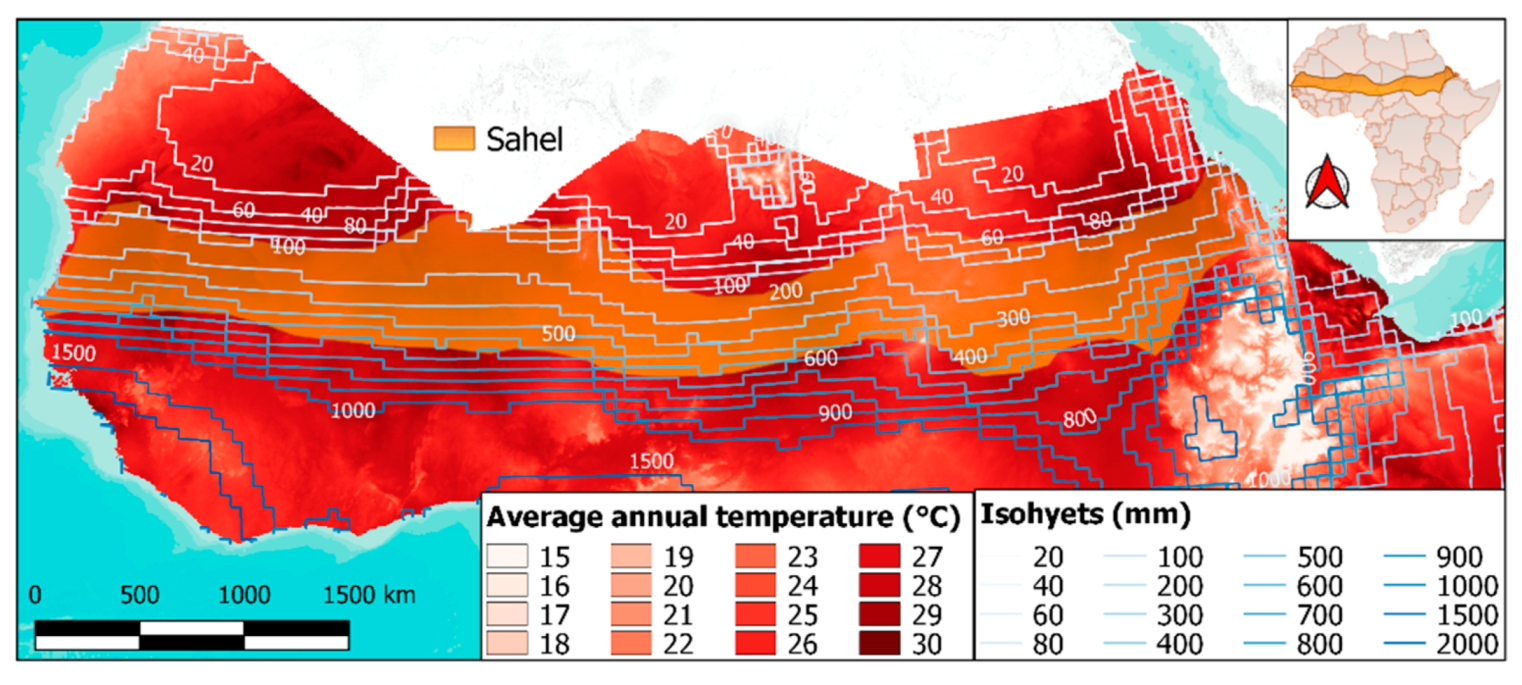
The Sahel, a semiarid area set in a fragile context, has been undergoing dramatic climate and land-use changes since the middle of the 20th century. The Sahelian belt stretches from the parallel 17° N to 10° N, from north to south, and spans from the Atlantic Ocean coasts to the coasts of Red Sea, from west to east (Figure 1). Its climate is predominantly arid at the border with the Sahara Desert, with rainfall almost absent, and semiarid towards the south with an annual pluviometry that ranges from 600 to 800 mm [36,37]. In the next years, this area will be one of the most affected by climate changes [5]. The study conducted by the University of Notre Dame showed that the Sahelian countries are among countries with the highest level of vulnerability to climate changes [38]. Indeed, countries such as Niger, Chad, Sudan, and Mali occupy the last positions in the global rankings.
The study of Todzo et al. [39] reveals that, over the Sahel, a faster increase of temperature and precipitation than the global average is expected. Moreover, accordingly also with the findings of Seidou [12], the rainfall pattern is expected to become more intense and less frequent, leading to lengthening of dry spells and increase the likelihood of droughts. Different studies showed that roughly 50% of annual precipitation falls in the occurrence of a small number of extremely intense and short rainstorms [7,40]. This type of climate and future perspective are not in favor of a farming system based on rainfed agriculture. In the paper “Climate change and variability in the Sahel region: impacts and adaptation strategies in the agricultural sector” it is reported that two Sahelian countries, Chad and Niger, could likely lose nearly all their agriculture that depends on rain by 2100 [41]. For these reasons, farmers living in arid or semiarid areas and Non Governmental Organizations (NGOs) operating in these areas are striving to develop suitable and efficient water management practices.
Along with the harsh climate, the ongoing land degradation due to desertification and anthropic deforestation is reducing the land fertility and increasing the exposure of soil to crustification.
3. Materials and Methods
3.1. The Numerical Model
Iber is a two-dimensional distributed model originally developed for hydraulic computations of overland and river flow [33,43], and later on expanded to the simulation of hydrological processes of rainfall–runoff transformation [44,45] and subsurface flow [46,47]. The surface runoff depth and velocity fields are obtained from the resolution of the 2D shallow water equations (SWEs), computing the bed friction with the Manning formulation, and including rainfall and infiltration as source terms. The equation system can be written as follows:
where is the water depth, are the unit discharge components along x and y, respectively, is the rainfall intensity, is the infiltration rate, is the gravity acceleration, is the free surface elevation, and is the roughness coefficient of Manning. The model equations are solved with an unstructured finite volume solver. The spatial domain is represented by an unstructured mesh with cells sizes proportional to the analyzed geometry. The Courant–Friedrichs–Lewy (CFL) stability criterion controls the computational time step based on the flow velocity, the water depth, and the computational cell size. In order to guarantee a high level of stability, the Courant number was set to 0.5 for all analyses. For further details on the model equations and numerical schemes see the studies of Cea and Bladé [33,43,44].
The infiltration is evaluated through the Green-Ampt method [48]. The formulation allows calculating the infiltration rate from the water depth over the surface, computed through the resolution of SWEs, and the physical properties of the soil. The soil characteristics are described by several parameters: the saturated hydraulic conductivity (), the suction head in the nonsaturated layer (), the soil porosity (), and the initial soil moisture content ().
The Green-Ampt model allows linking the spatio-temporal distribution of surface water with the subsurface flow through the soil water content variation. The mass conservation between the surface and subsurface is based on the 2D Boussinesq equation-based model for homogeneous unconfined aquifer and can be written as
where is the soil porosity, is the saturated soil thickness, is the horizontal transmissivity, H is the hydraulic head, is the deep percolation rate, and is the evapotranspiration rate. The first term represents the variation of the soil moisture over time, considering the following relation guaranteed by the infiltration model:
where is the soil moisture and is the soil depth. Note that the saturated thickness () is always smaller or equal to the soil depth () and thus, the soil moisture is always smaller or equal to the soil porosity. Considering the small scale of the spatial domain in our study case (see Section 3.2.1), the horizontal transmissivity was neglected.
The water that percolates out of the considered soil layer towards deeper layers is estimated by using the relation proposed by Famiglietti and Wood [49]
where is the saturated hydraulic conductivity of the deep soil, and is a model parameter, meaning the pore size distribution index based on the soil layer texture. The soil structure might change along with the vertical profile, varying its permeability. Seeing as how the infiltration and percolation processes occur at a different depth, distinct values of hydraulic conductivities were adopted. The infiltration model’s represents the topsoil-saturated hydraulic conductivity that controls the partition of rain between runoff and infiltration. On the other hand, the percolation model’s is the saturated hydraulic conductivity that characterizes deep percolation.
The evapotranspiration rate was calculated combining the potential evapotranspiration computed through the empirical relation reported in the work of Doorenbos and Pruitt [50] adjusted following the FAO 56 single-crop coefficient method [51], in order to consider the phenological properties of crops.
The present approach follows three steps:
- The potential evapotranspiration equation is based on a single climatic data widely available, the temperature:where is the air temperature in °C, is the percentage of total daytime hours in which the evapotranspiration occurs (approximately 12 h) out of total daytime hours of the year (365 × 12 h), and is a parameter for calibration.
- The is adjusted for a specific crop using a crop coefficient , resulting in:where represents the crop evapotranspiration under standard conditions and is the crop coefficient that accounts for the evapotranspiration capability during each growth stage of an individual crop . Values of are listed in the FAO Irrigation and drainage paper 56 [51].
- When the soil becomes dry, a limited amount of water is available for plant root extraction. If the depletion of the soil water storage overcomes a threshold, the crop is said to be water stressed and its crop transpiration capability is reduced by a water stress coefficient
- The water stress coefficient [0,1] can be determined by the equationwhere and are the water content at wilting point and field capacity, respectively, and is the soil water depletion fraction, which is characteristic for each crop and represents the fraction of the total available water that the plant can uptake without suffering stress.
3.2. Model Set-Up
The present study applies the numerical model described in the previous section in two different analyses. The first analysis aims to assess the entire range of possible hydrological performances of RWHT, evaluating multiple scenarios typical of Sahelian agricultural fields, at the time scale of the single rainfall event. In the second, the hydrological balances over the entire wet season were performed for each RWHT, and the potential crop water stress mitigation was evaluated. The first and second analyses will be called “short-term analysis” and “long-term analysis”, respectively, throughout the manuscript.
3.2.1. Geometry
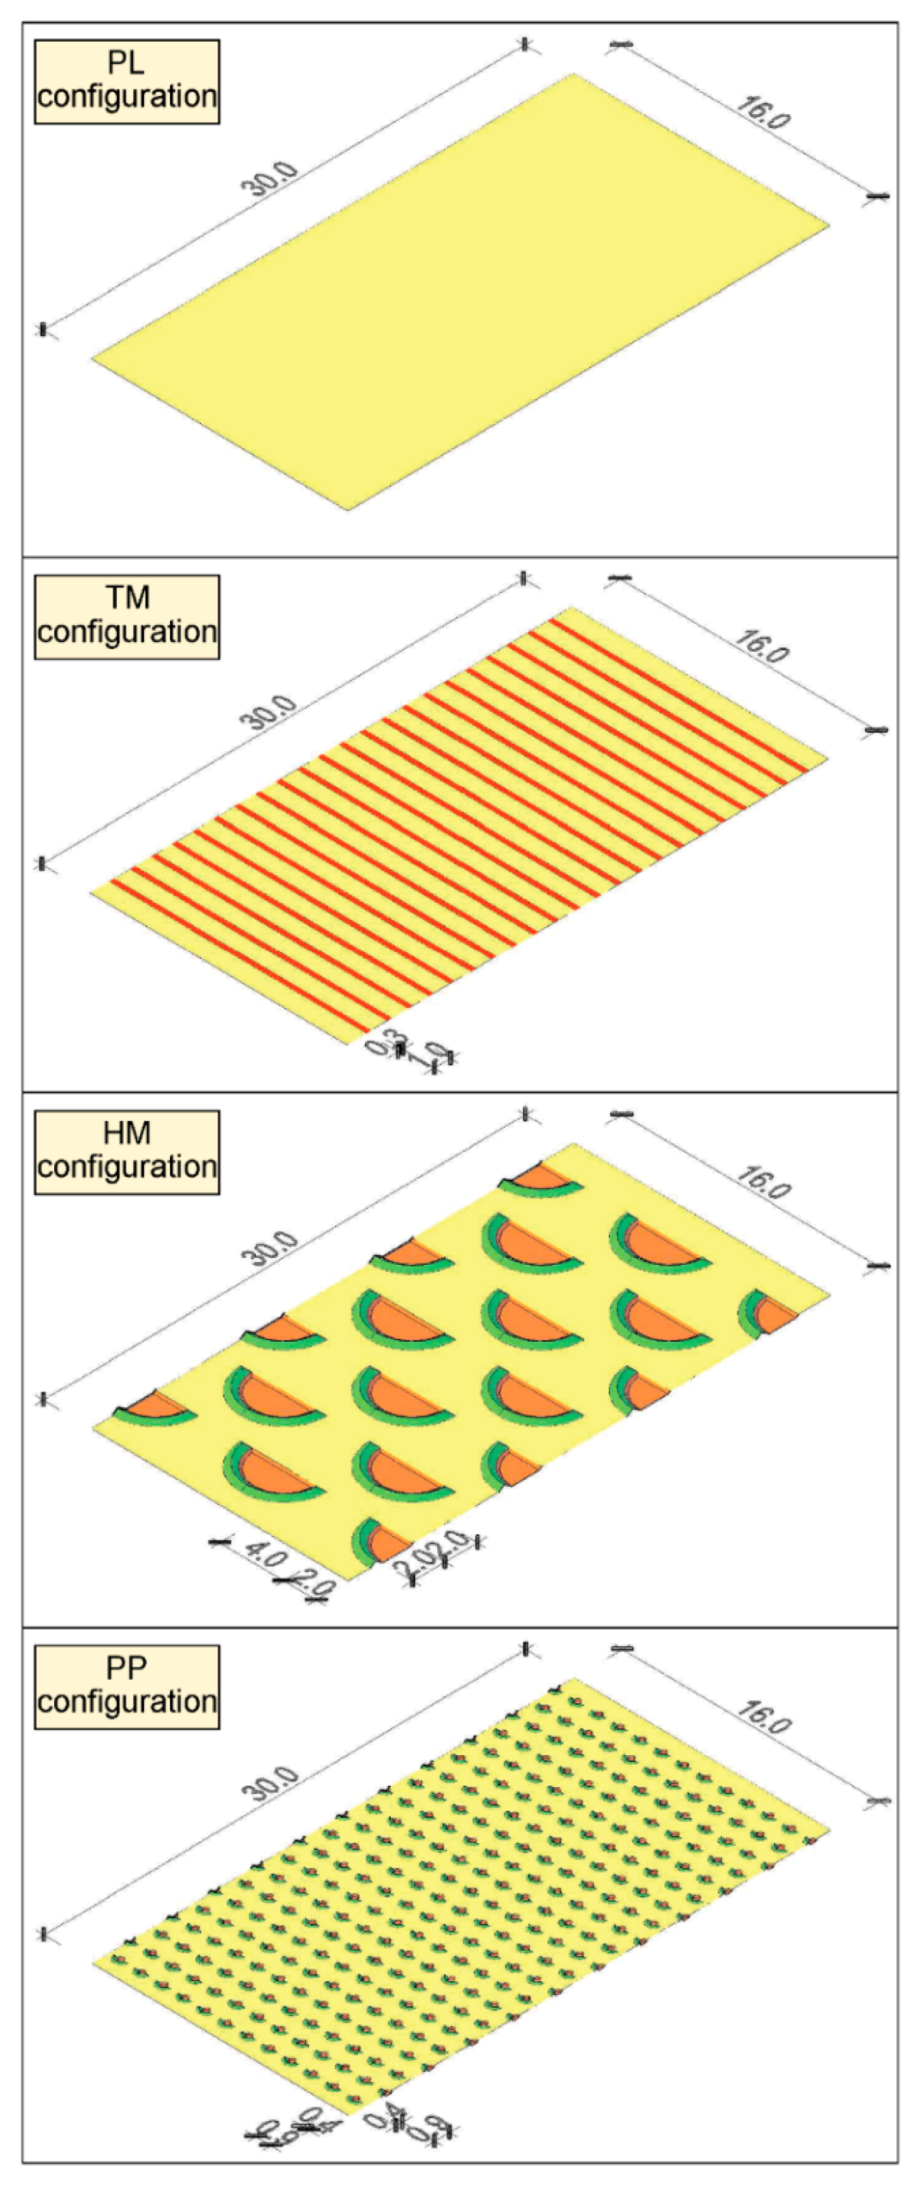
Many RWHT have been developed by Sahelian farmers over the centuries. Common practices are small planting pits (zai, tassa), small basins (negarims, meskats, half-moons), semicircular bunds, hand-dug trenches, mechanized Vallerani trenches, or eyebrow terraces. Precisely, we focused on the two most used microcatchment RWHT (half-moons and planting pits) as described in the guidelines of Mekdaschi Studer and Liniger [52].
The geometrical inputs that were used to represent each RWHT follow the conceptualization of the agricultural field delineated in Tamagnone et al. [32]. RWHT were shaped following the technical specification reported into the Global Database on Sustainable Land Management [53]. Frequently, semicircles with a radius of 4 m, spaced 2 m, are dug for half-moons, while circles with a diameter of 0.4 m, spaced about 1 m, are dug for small planting pits. The geometrical schemes and features of the spatial domains are reported in Figure A1 (see Appendix A). Moreover, supplementary simulations were carried out varying the entity of the excavation in order to observe how the storage volume affects their hydrological performances.
The hydrological efficiency of these RWHT was compared to a plain configuration that represents the case in which no agricultural technique is implemented.
For the long-term analysis, the plain configuration was manipulated to simulate the traditional sowing method used by Sahelian farmers. This method consists of breaking the surface crust along rows with rudimentary hand hoes or pickaxes (locally called “iler” or “daba”). The rows are commonly tilled 1 m apart transversely to the slope.
Identification codes were used to label each configuration, as shown in Table 1.
3.2.2. Meteorological Data
Iber is a fully distributed hydrological model which needs meteorological inputs to compute the intensity of incoming and outgoing hydrological fluxes from the study domain [44]. The spatial and temporal resolution of these inputs depends on the timescale of the simulations. Regarding rainfall, the typical evolution of Sahelian storms can be associated to an Organized Convective System (OCS) [54]. It generates hyetographs characterized by very fast and high-intensity peaks (frequently shorter than 1 h) followed by a low-intensity tail [7]. Thus, a high-resolution of rainfall records is necessary to detect every cloudburst. Consequently, hyetographs with a time resolution of 5 min were generated for both analyses.
In the short-term analysis, the extreme rainfall hyetograph calculated in the previous work of Tamagnone et al. [32] was adopted. This hyetograph is characterized by a rain depth of 40 mm with a peak intensity of 80 mm/h (Figure 2a).
Instead, for the long-term analysis, a hyetograph representative of a rainy season was used. The representative wet season was identified from the analysis of rainfall time series recorded at a gauging station placed in central Sahel (Koyria station, 1997–2016), extracted from the AMMA-CATCH (Analyse Multidisciplinaire de la Mousson Africaine—Couplage de l’Atmosphère Tropicale et du Cycle Hydrologique) database [55]. From this time series, a representative year was selected as the one with the highest correlation with the following three statistical parameters of the complete time series: the average of annual rainfall depth, the average of maximum hourly rainfall intensity, and the average number of rainy days.
The second meteorological input needed to evaluate the water balance is the air temperature. The variability of temperature over one characteristic year was calculated as the mean temperature registered in the decade 2004–2014 at the Wankama gauging station [55], with a time resolution of 30 min. The rainfall and temperature data used in the long-term simulations are displayed in Figure 2b.
3.2.3. Input Parameters
In order to investigate a vast range of cases characterizing the Sahelian farm fields, multiple Monte Carlo simulations were run using different sets of model parameters. The parameter sets were sampled using the Latin Hypercube Sampling (LHS) method [56,57]. Many authors have revealed that LHS can significantly cut down on processing time versus a standard Monte Carlo random sampling [58].
For the short-term analysis, 300 parameter sets were generated within defined ranges. Each set is composed of six parameters that we identified as the most influential on model performance. The first one is the roughness expressed by the Manning’s coefficient and the others are parameters of the infiltration model. The parameter ranges are listed in Table 2.
The set of parameters adopted for the long-term analysis is composed of:
- -
- the previous six parameters, corresponding to the simulation closest to the mean model behavior, and the four soil parameters (Table 3);
- -
- the phenological parameters for each analyzed crop (Table 4). During the growing period, the evapotranspiration potential of the given crop will vary accordingly to the development of its height and leafage. The growing season can be divided into four different growth stages labeled as follows: (initial), (development), (mid-season), (late-season). To each stage is associated a distinct value of crop coefficient .
3.3. Evaluation of the Hydrological Efficiency
The impact of the analyzed configurations in the hydrological processes related to rainfall–runoff transformation was evaluated in terms of three different efficiency measures:
- -
- outflow reduction: calculated as the reduction on the cumulated volume of water that flows out of the domain with and without the implementation of RHWT ( and , respectively)
- -
- infiltration increase: calculated as the increase on the cumulated volume of water infiltrated in the subsurface with and without the implementation of RHWT ( and , respectively)
- -
- stress mitigation: calculated as the increase on soil moisture needed to reach the availability threshold with and without the implementation of RHWT ( and , respectively)
4. Results
4.1. Hydrological Behaviour
The hydrological behavior of each RWHT configuration was analyzed in terms of surface runoff generated, water retention, and infiltration, using for that purpose the output of the Monte Carlo simulations performed with the fully distributed hydrological model. The computed hydrographs at the outlet of the considered Sahelian farming plot, as well as the cumulative infiltration in the field are displayed in Figure 3, showing the different responses of each RWHT configuration to the extreme rainfall event. In addition to all the Monte Carlo results, the average and the 25–75% percentiles were added to each graph.
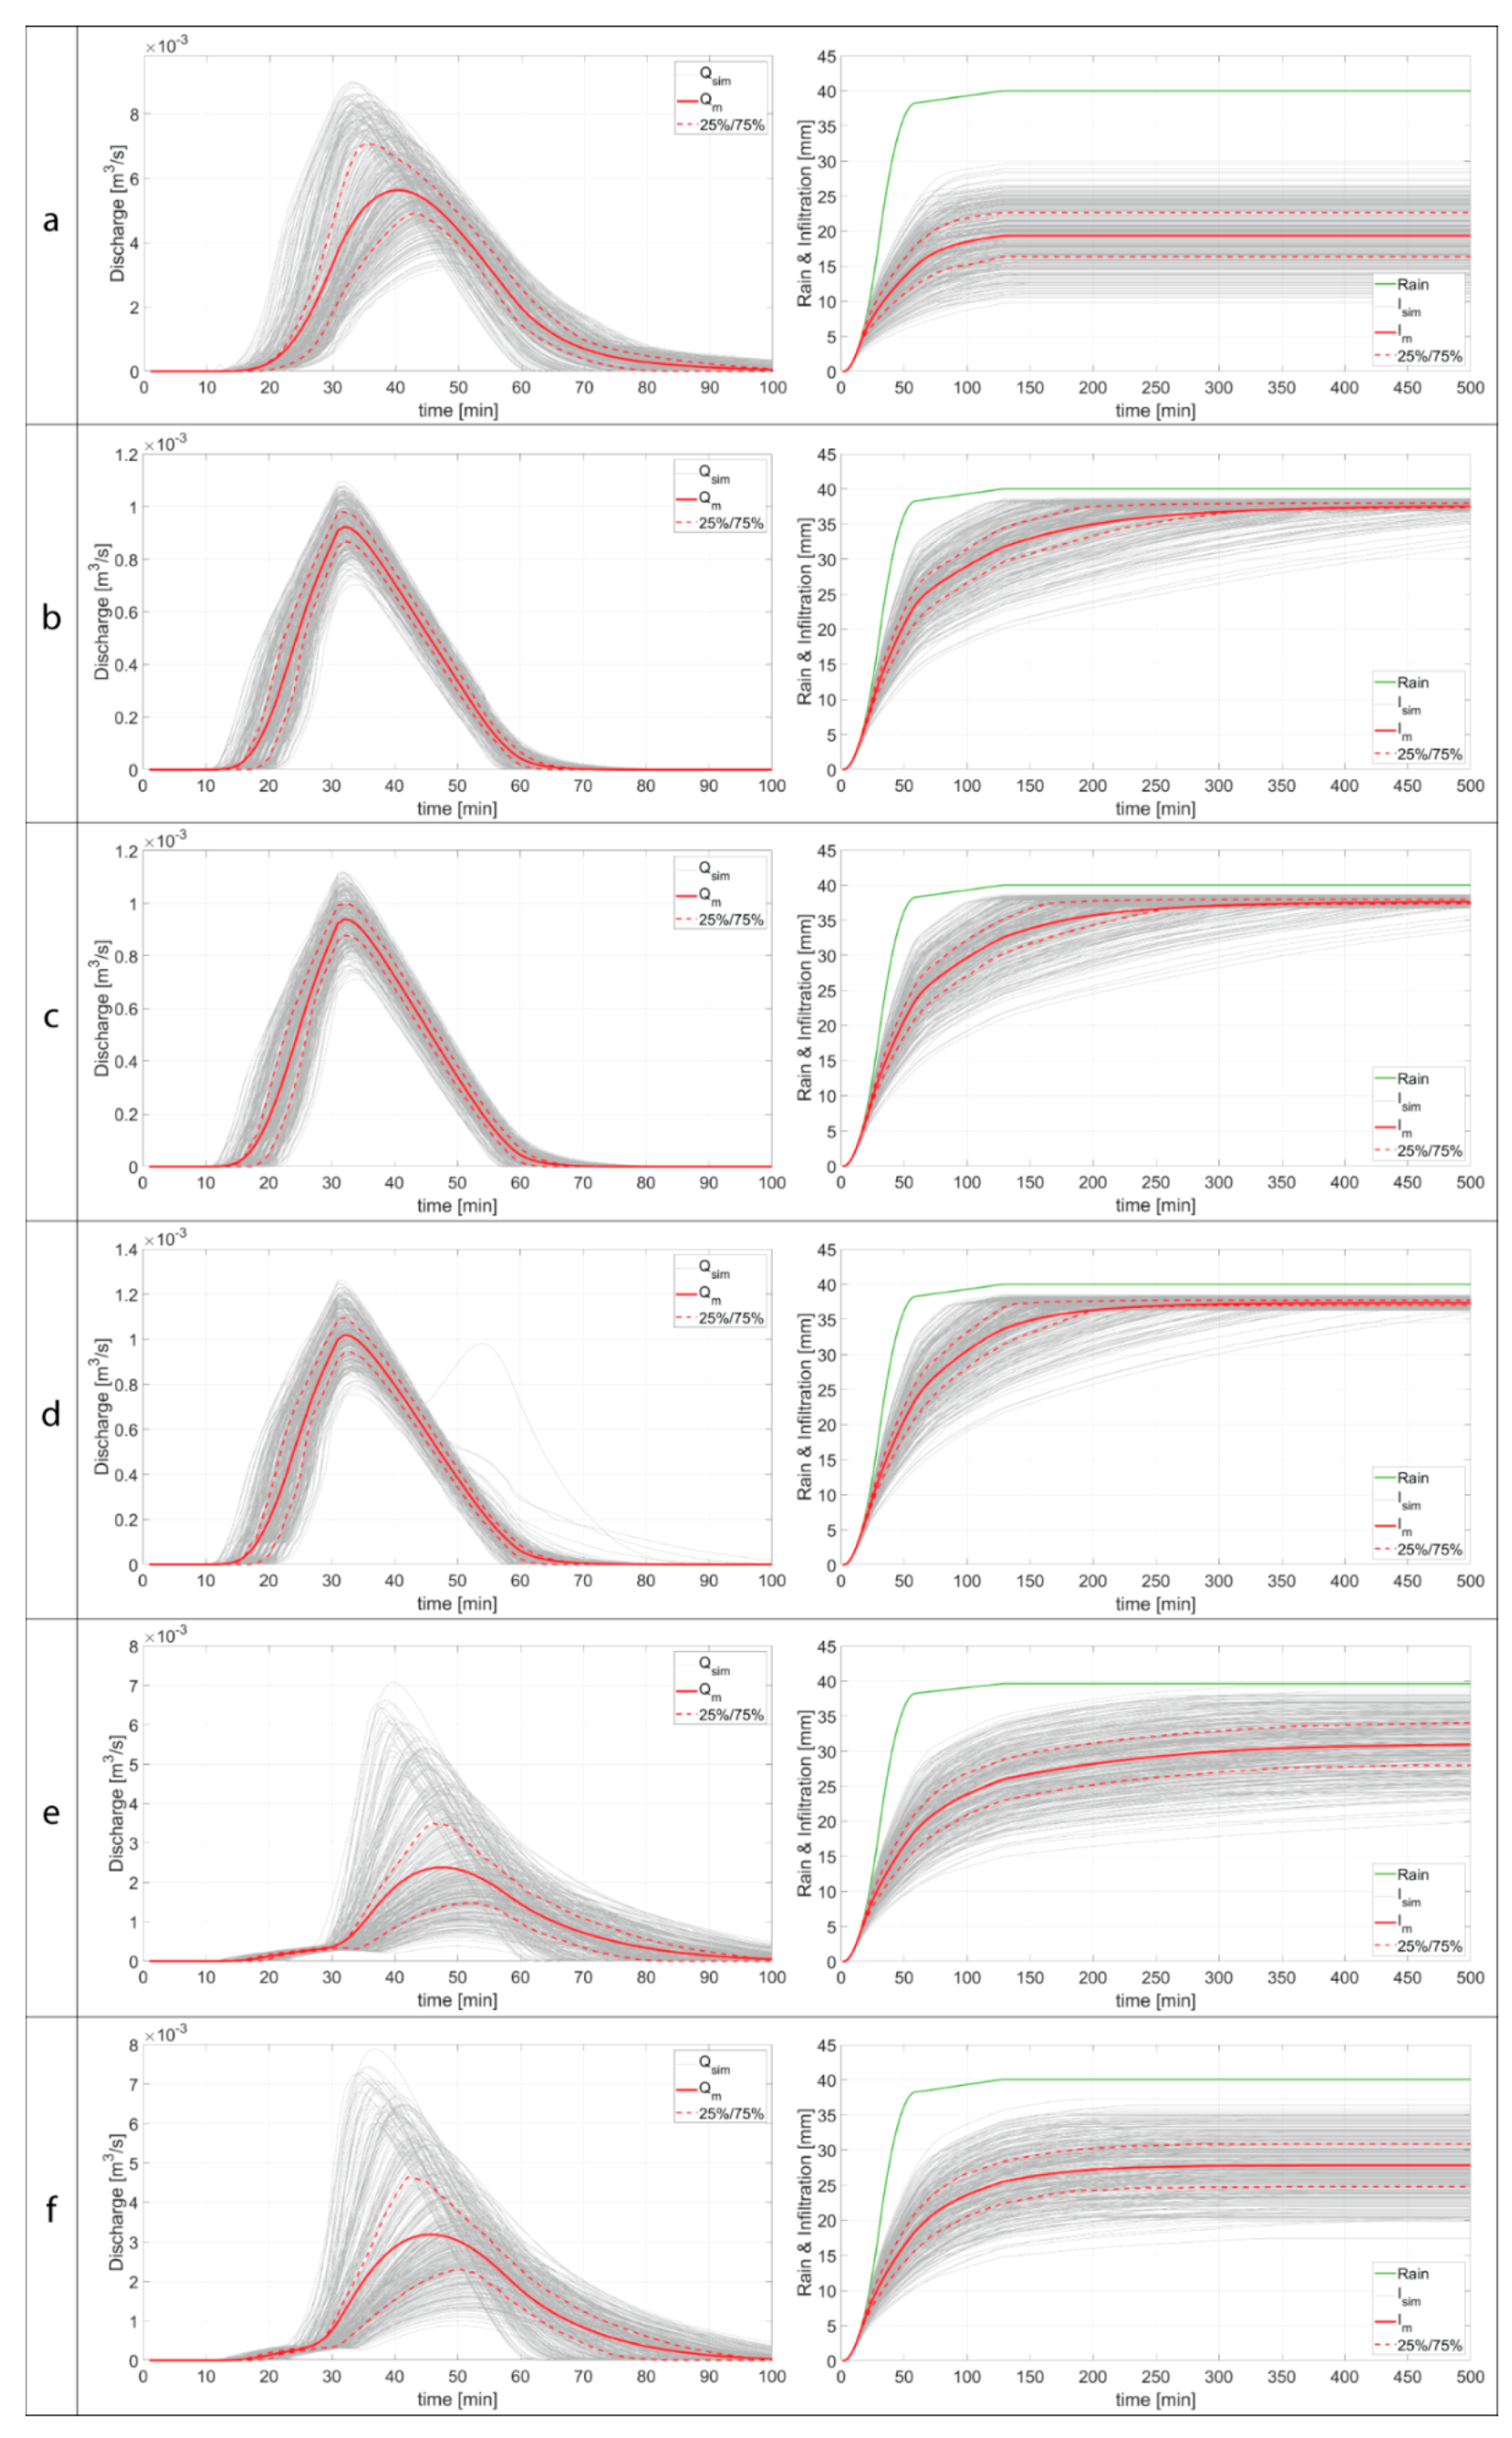
The hydrographs computed for the PL and HM30 configurations show a wide difference in magnitude but a similar shape, since the half-moons do not get filled and just the rainfall that is not intercepted by them contributes to the outlet hydrograph. On the other hand, the hydrographs computed for the PP20 configuration show two distinct branches. At the beginning of the event, the discharge increases very slowly because the planting pits are still being filled with water. Once they get filled, there is a sharp increase in the hydrographs, reaching peak discharges in between the PL and the HM30 configurations. This behavior showing two branches and a delayed peak has already been described in Tamagnone et al. [32], and it also occurs for certain parameter sets in the HM10 configuration (see Figure A2). The outcomes computed for all the RWHT configurations defined in Table 1 are included in Appendix A.
The amplitude of the results range is directly correlated to the sensitivity of model output to the input parameters. For the PP configuration, the Monte Carlo simulations produce hydrographs significantly different from each other, meaning that the hydraulic behavior of this type of configuration is strongly affected by the input parameters (and thus, by the terrain and soil characteristics). Conversely, the HM30 configuration is less affected by the input parameters, being the shape and magnitude of the hydrograph mostly determined by the configuration geometry.
Observing the infiltration trends in Figure 3, each configuration presents a different behavior. For the plain PL configuration, given the absence of retention, the infiltration trend follows the rainfall trend. Thus, the infiltration finishes with the end of the rainfall. For the half-moons, there is, on average, a return to the dry condition at 300 min (when the curve becomes horizontal), whereas the planting pits present a positive infiltration trend up to 400 min. The delay between the end of rainfall and infiltration contributes to the increase of the evaporation of the water retained inside the ponds after the downburst.
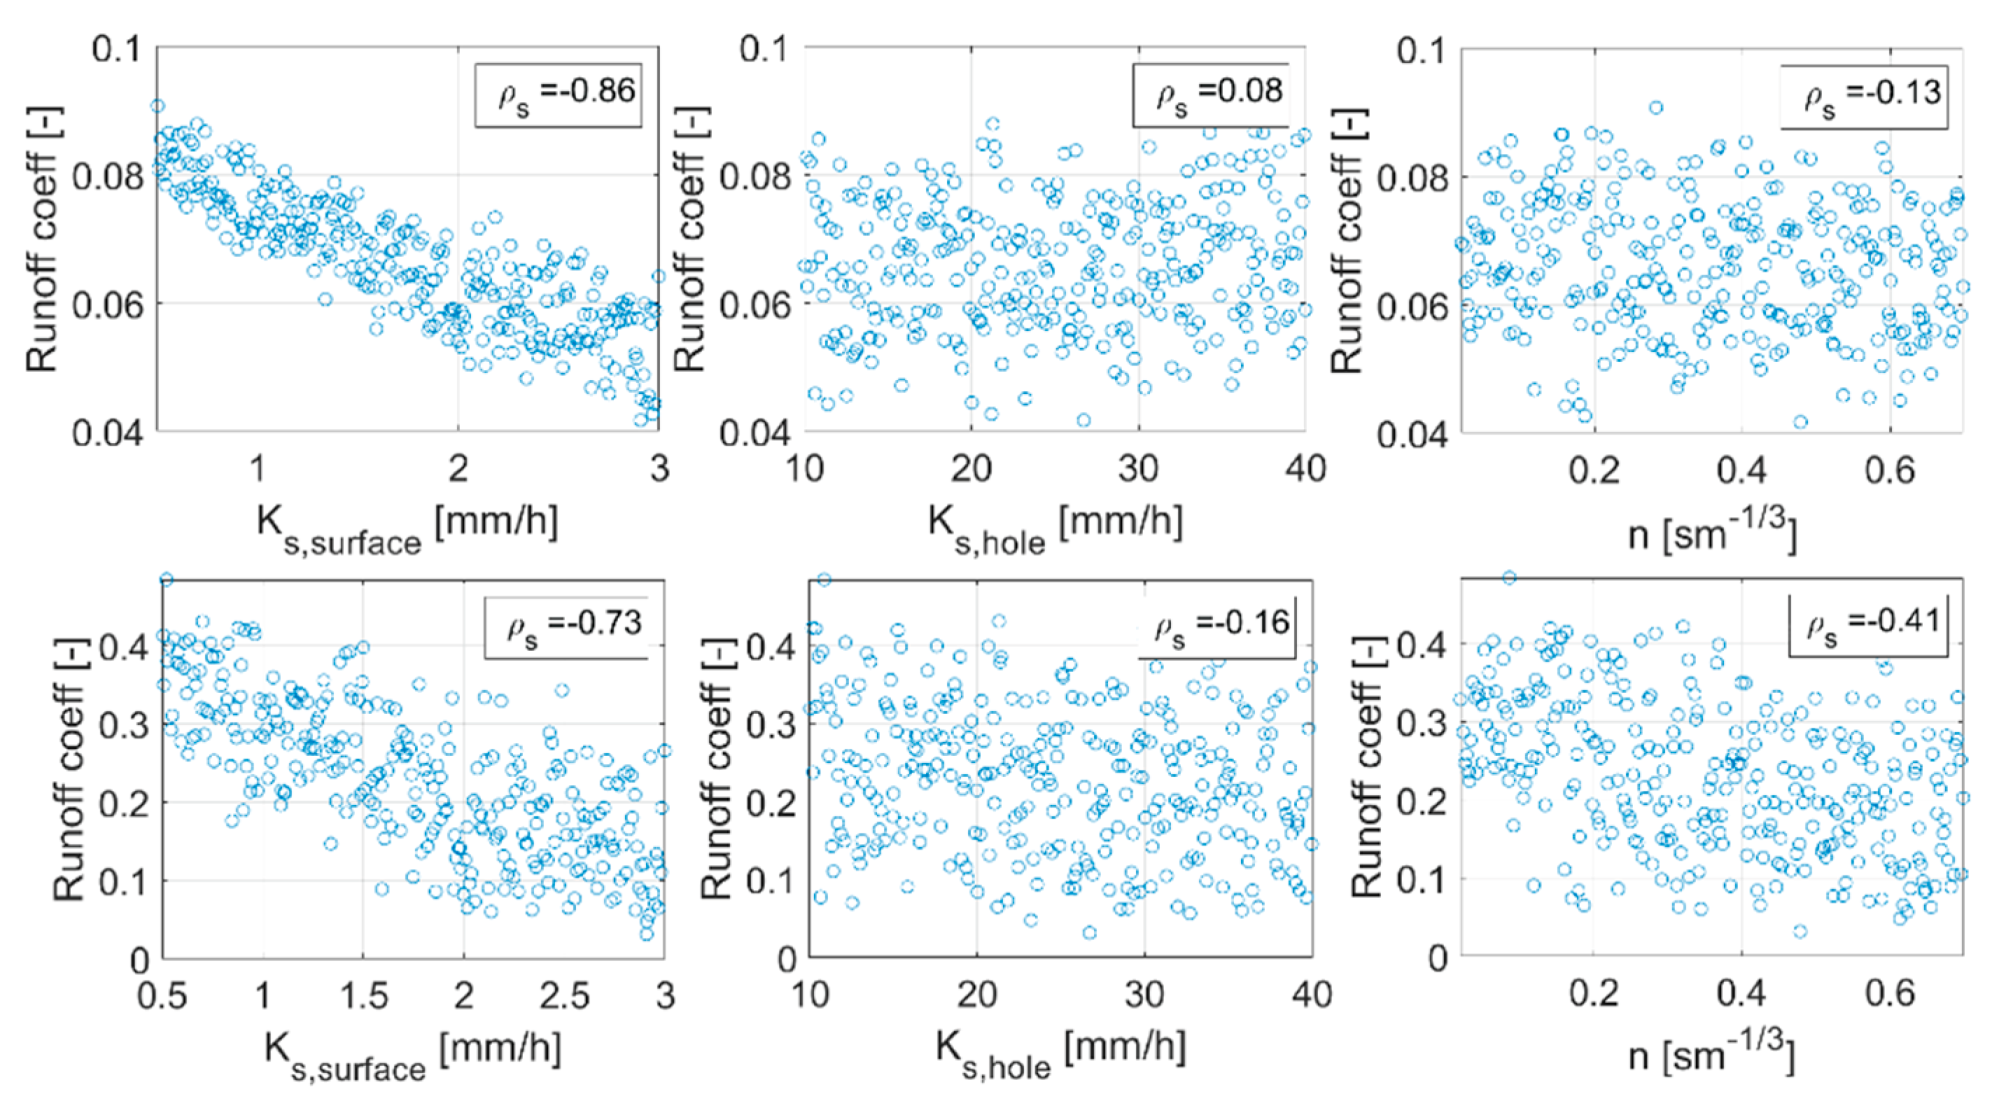
The influence of each input parameter on model output was also investigated. The correlation between the runoff coefficient, evaluated as the ratio between the volume of water flowing out of the domain and the cumulated rainfall, and the input parameters show that the hydraulic conductivity outside of the holes () plays the main role in the formation of the outflow discharge (Table 5).
The differences between the HM and PP configurations show that the influence of is stronger for HM configuration, while the more heavily affects PP (Figure 4). The explanation lies in the behavior of PP which get overfilled during the event. When the PP retention fails, more water flows on the surface between the ponds and this makes the correlation with weaker and the correlation with the roughness coefficient stronger. This is also confirmed by the increase of value related to in the HM10 configuration. The specular behavior might be seen in the correlation with the total volume of water infiltrated during the event. Thus, with all positive correlations. The weak correlation with might be linked with the fact that the entire runoff harvested by the RWHT is however infiltrated independently by the entity of the hydraulic conductivity.
4.2. Hydrological Efficiency Assessment
As reported in Section 3.3, the hydrological efficiency of each RWHT analyzed represents the degree of improvement in water retention, when compared to the plain configuration. The comparison was made simulation by simulation in order to compare couples of configurations with the same input parameters.
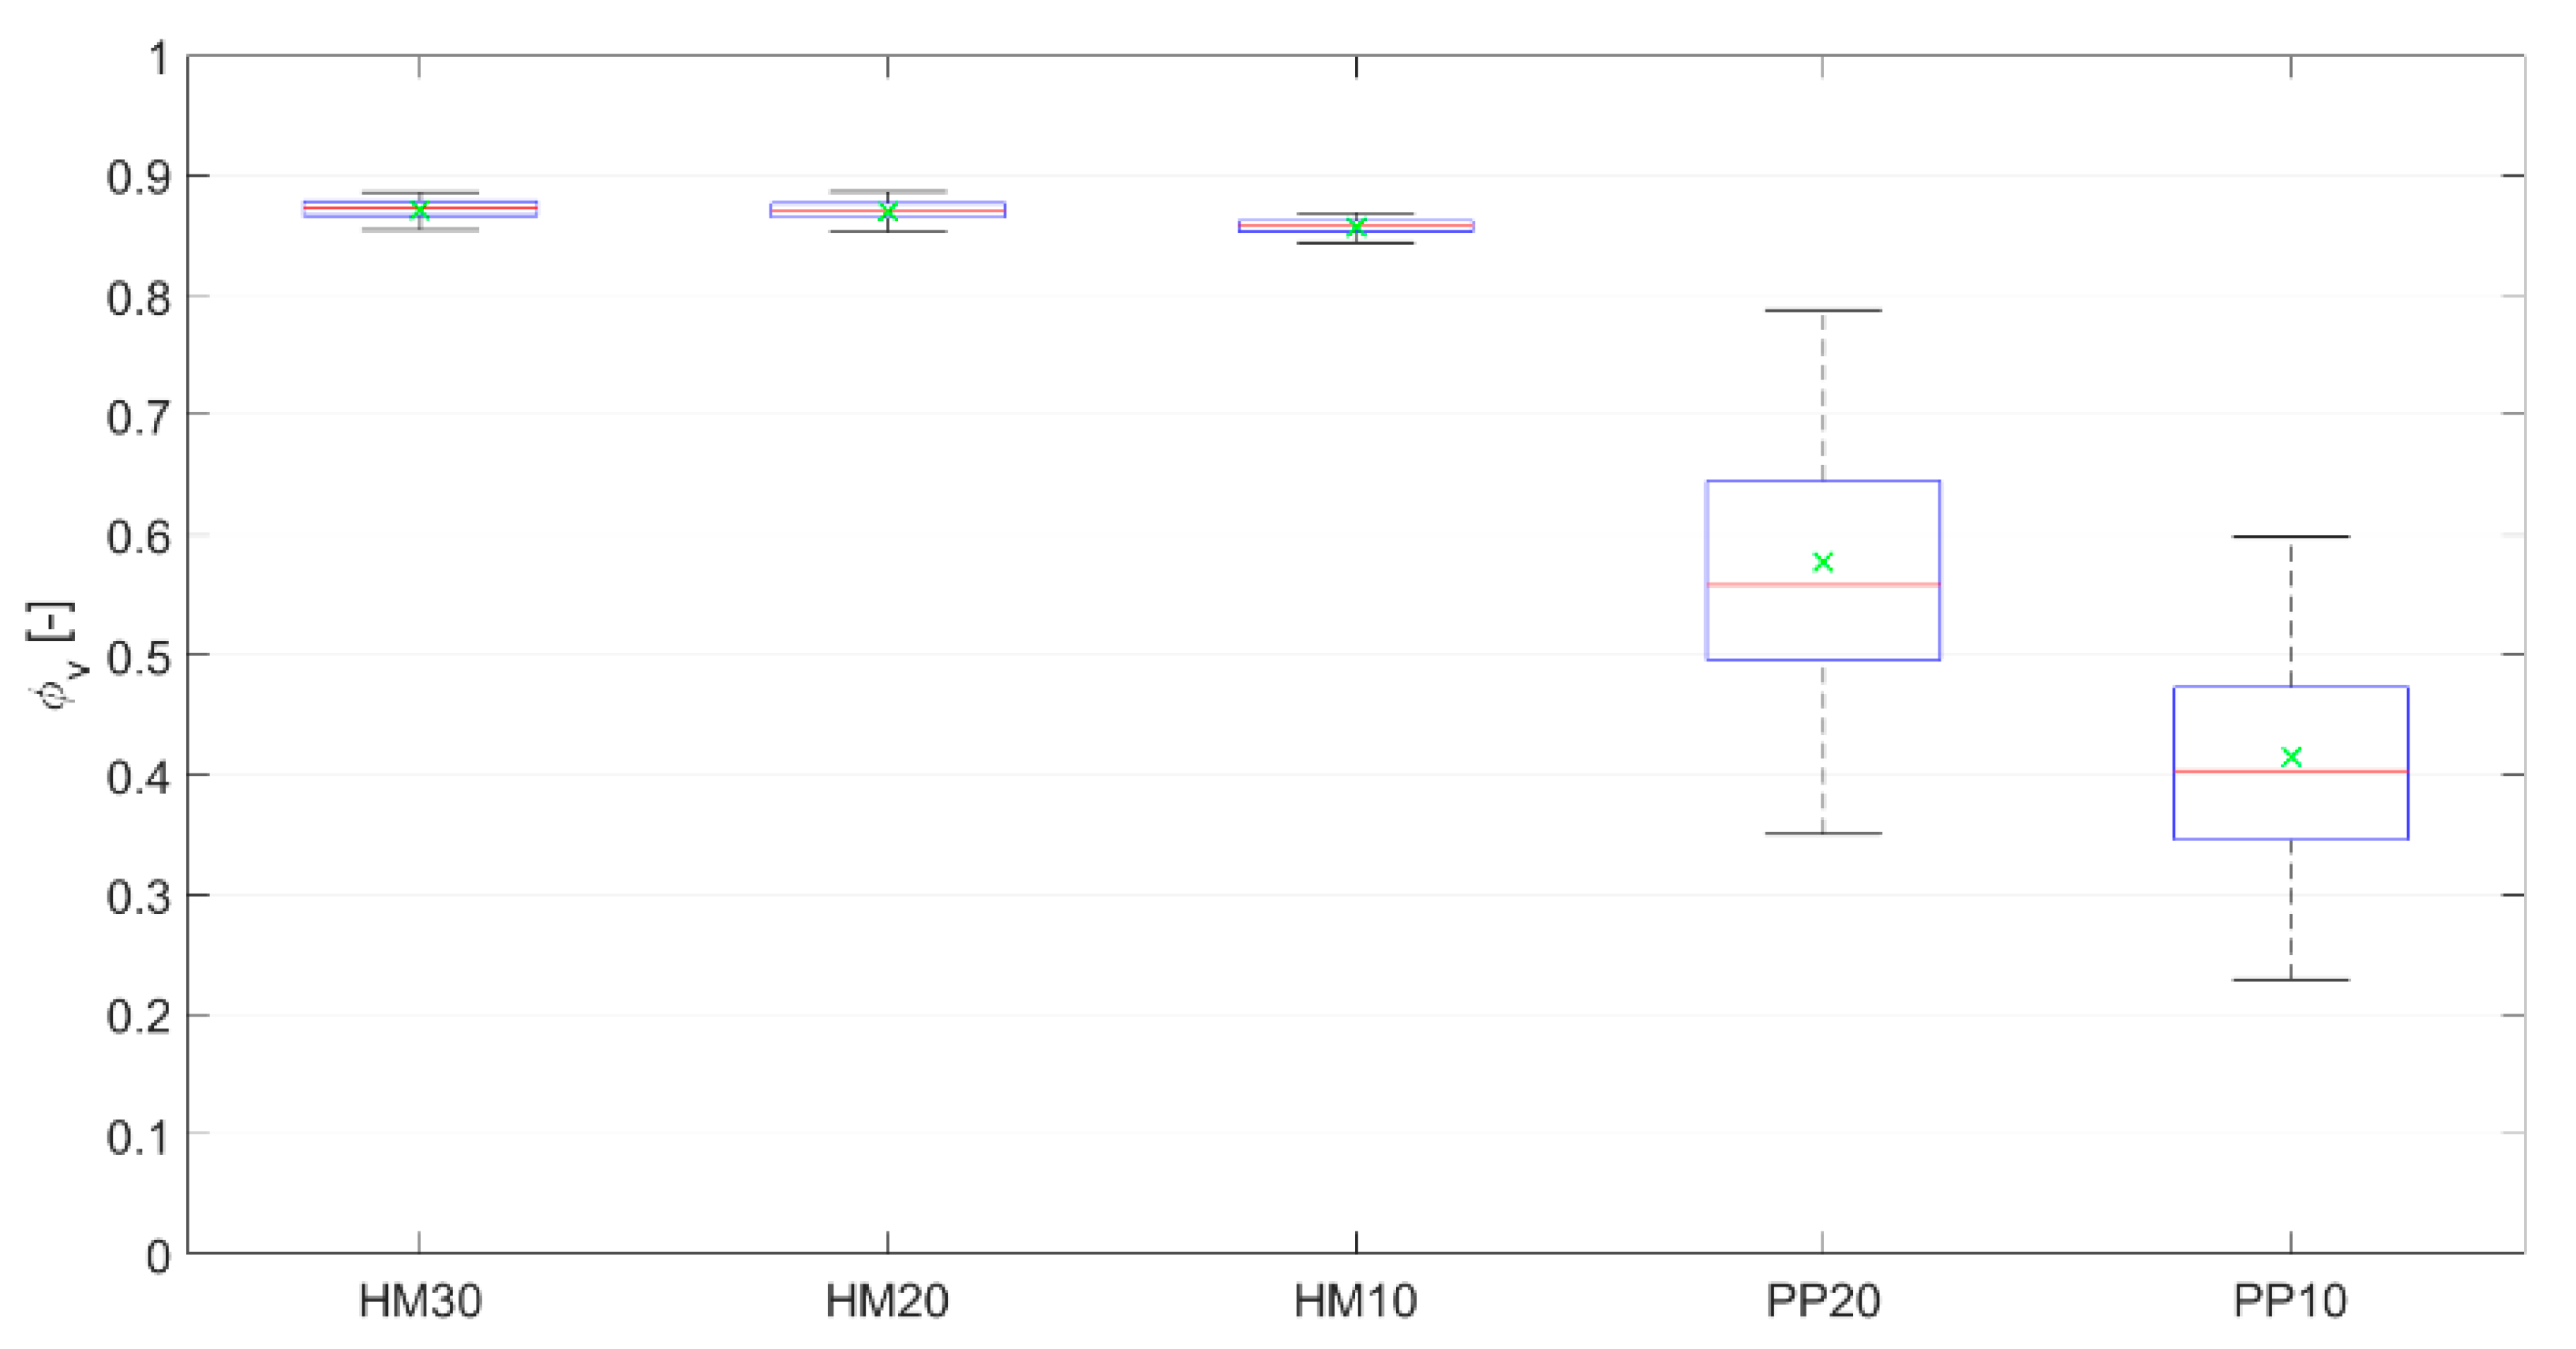
Considering outflow reduction (Figure 5), the HM configurations show an efficiency of more than 30% higher than the PP configurations. For both RWHT, the configurations with the bigger excavation have a higher performance than the smaller ones. For half-moons, the efficiency shows a very slight variation between the three configurations, from 0.87 to 0.85 for the deeper hole and the shallower hole, respectively. Instead, in the PP configurations, the depth of the holes has a higher impact on the water volume retained in the plot. Indeed, halving the depth of the excavation leads to a 15% drop in . Moreover, from the results shown in Figure 5, it is clear how the input parameters strongly influence the PP results, while they slightly impact the efficiency of the HM configurations.
Commonly, the Sahelian storms drop down a consistent amount of rainfall in a few minutes. Thus, the process of water retention starts with catching the runoff and rainfall inside the micro-basins and continues with the infiltration of this amount of water into the subsurface. Thus, the infiltration efficiency is dependent on the geometry and changes over time. For this reason, it was evaluated for different times lags after the extreme event occurs, labeling the results in Figure 6 with the subscript of the related time lag.
HM configurations have a storage volume large enough to harvest all the water that falls during the simulated extreme event in almost all simulations, i.e., independently of the input parameters. This means that each half-moon has the same volume of water that will infiltrate into the soil, although the infiltration rate will vary depending on the soil parameters. Observing the differences between the deepest and shallowest HM configurations (HM30 and HM10, respectively), the variation of over time is noticeable (Figure 6). At the end of the event (), the HM10 shows an efficiency 10% higher than HM30, meaning that more water has been infiltrated during the rainfall. At such early stages, the infiltration in the shallower HM is higher due to the conformation of the excavation, that presents a slightly wider hole bottom than in the HM30. After 6 h () the two efficiencies are equal, while later on the efficiency of HM30 becomes higher than that of HM10. This highlights that, for this RWHT, the infiltration process is more affected by the geometry rather than by differences in water depth inside the hole.
For the PP technique, the difference between the two configurations increases over time. Since both configurations are overfilled during the event, the PP20 has a higher volume of water retained, and it will produce more infiltration. Thus, the efficiency of PP20 is only 4% higher than PP10 at a time lag of 1 h (), while it reaches a difference of 28% at 10 h ().
4.3. Water Stress Assessment
Besides simulating infiltration and runoff for the different configurations, the hydrological model was used to evaluate the impact of RWHT on soil water dynamics and their influence on the crop conditions over the growing season.
The rainfall season in the Sahel is always preceded by a long dry period in which no precipitations occur. Thus, the initial conditions were considered strongly arid, meaning a dry surface and subsurface with a minimum soil water content equal to the permanent wilting point [23]. With the onset of the wet season, the soil storage recharge, uptake, and the resulting variation in soil moisture were calculated over the entire season with the hydrological model.
The analyses aim to investigate the improvement in the reduction of water stress on traditional Sahelian crops that can be achieved with the use of RWHT compared with traditional sowing methods. The analyses are focused at two scales: (1) the field scale, in which all simulation results are aggregated over the whole domain, (2) the small scale, in which hydrological conditions are locally examined where crop seeds are actually sown.
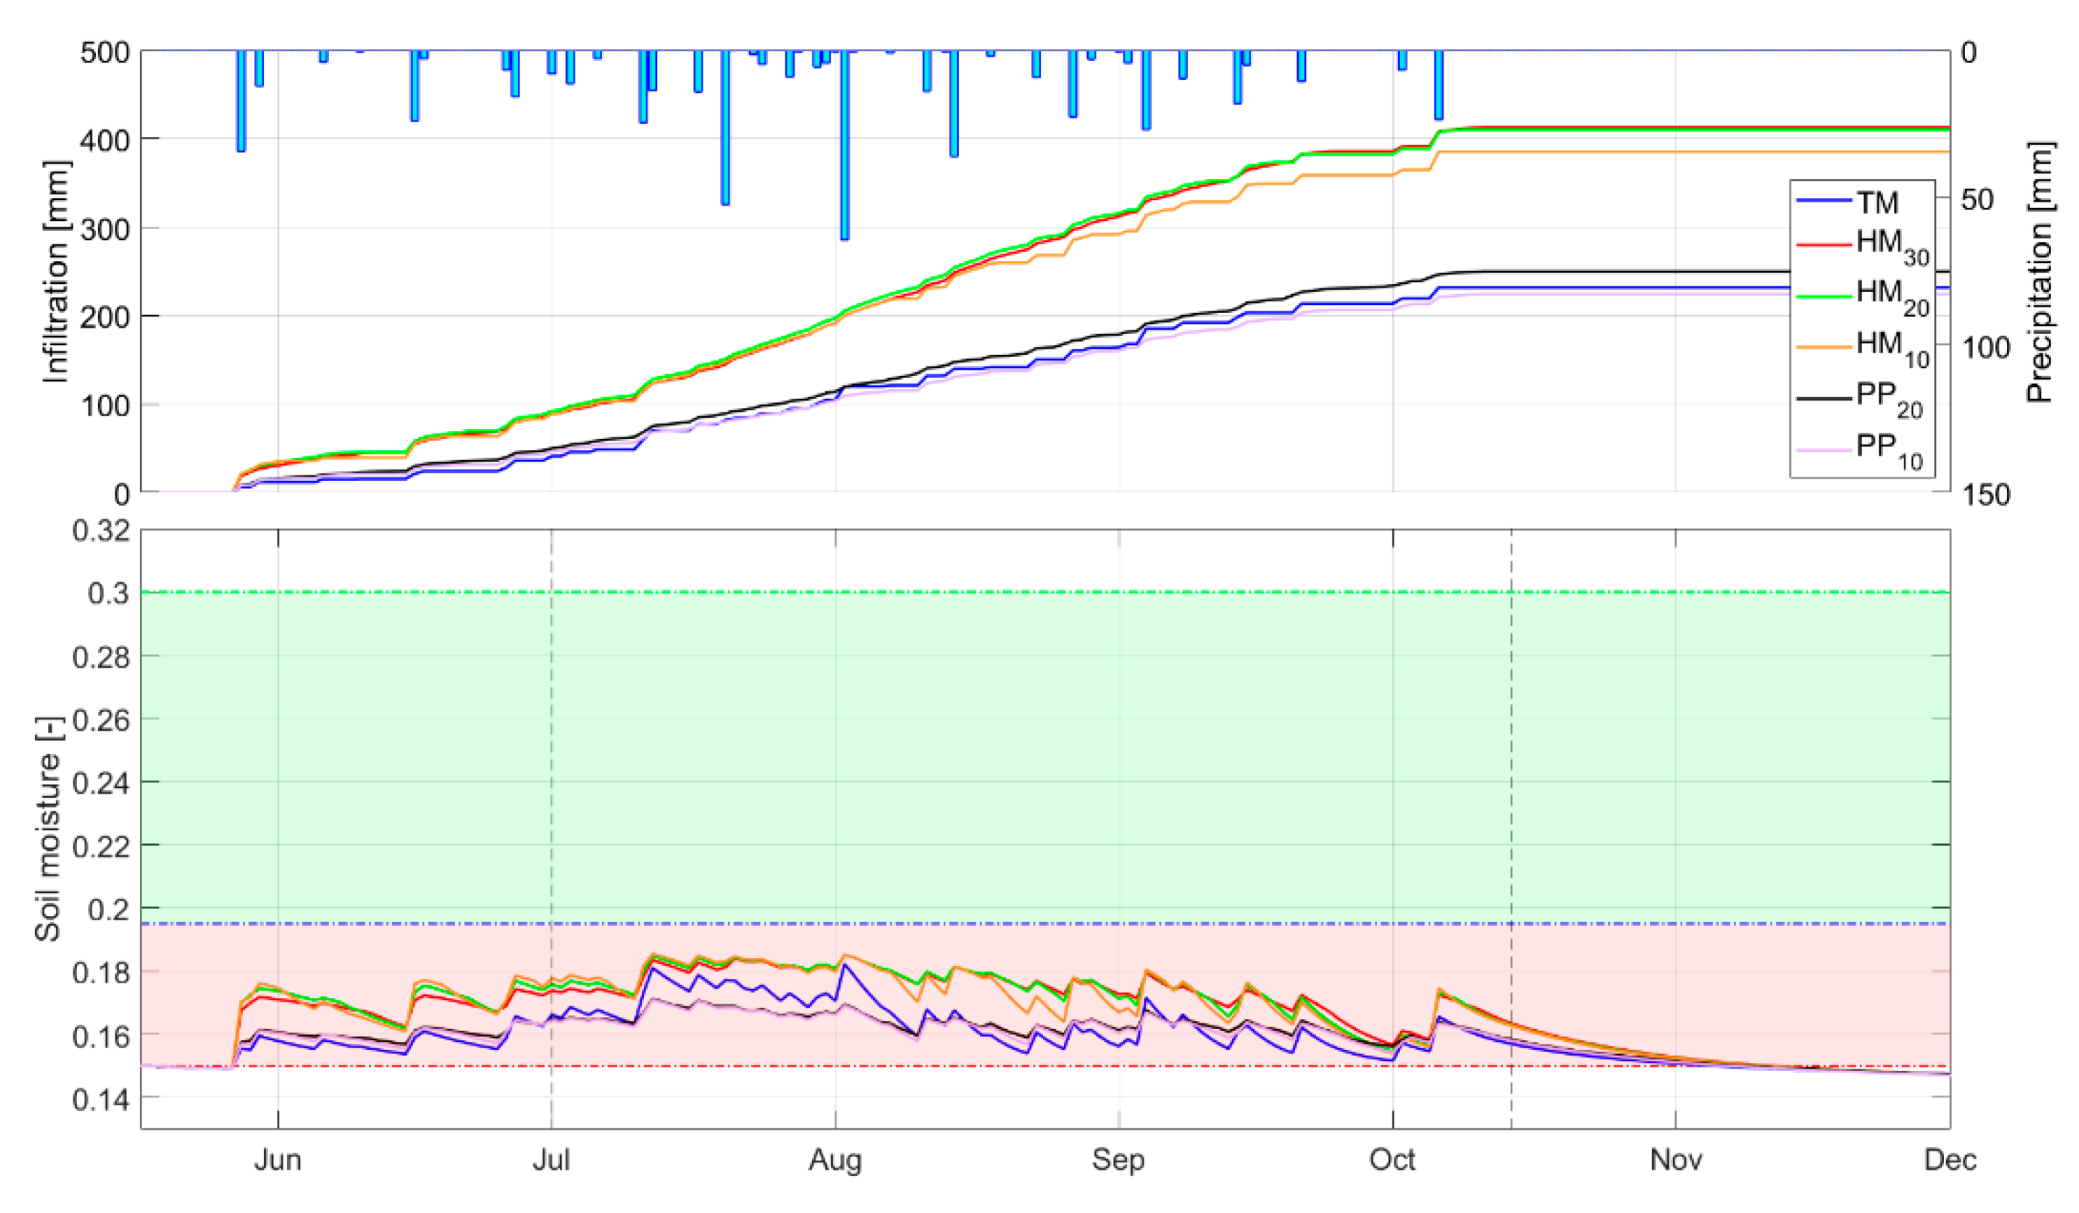
For the field scale analysis, all simulations were carried out based on millet phenological parameters. The presence of RWHT markedly increases the fraction of precipitation that infiltrates and fills the soil water storage. The best improvement is tied to the HM30 with a cumulative infiltration two times greater than TM. However, the difference between the deepest and shallowest HM is lower than 10%.
Figure 7 shows the soil moisture dynamics over the wet season. The aggregation of zones influenced by cultivation and not produces a trend that even if it is always below the threshold, constant permanence of stress condition (red zone), it is closer to the green zone when RWHT are adopted. The improvement is more marked in correspondence with the highest precipitation when the effect of retention plays a crucial role.
Focusing on the growing period of the analyzed crop, the water stress is stated by a level of soil moisture lower than the threshold. The threshold is defined as the soil moisture at the field capacity multiplied by the depletion factor of the crop [51]. The higher level of soil water content induced by the RWHT indicates that there is an improvement of the hydrological efficiency of the whole system, meaning the farm field. In terms of water stress mitigation (), HM configurations show an efficiency comprised between 20.7% and 23% while PP lead to significantly lower values of 3.75% and 2.85% (Table 6).
The presence of zones characterized by different soil physical characteristics indicates a slightly large spatial variability of hydrological conditions. Downscaling the observation from the field scale to the single row/pond it is possible to deeply investigate the impact of farming practices on soil moisture dynamics.
For HM, the soil moisture inside of the pond is higher than the threshold most of the time, avoiding that the crop sowed inside of the pond is affected by water shortage (Figure 8). Comparing the three HM configurations it can be noticed that soil moisture in HM30 is close to the saturation most of the time and never reaches the threshold. Conversely, shallower HM overcome the threshold leading to 2 and 7 days of plant water stress for HM20 and HM10, respectively. In those days, the limitation in soil water availability induces a condition of stress to the crop which limits its evapotranspiration, implying a lower than 1. The number of stressed days rises to 60 days in case of traditional sowing method. Hence, considering a growing season of 105 days for a millet crop, the crop will suffer water stress more than half the time whether cultivated with the traditional method. The percentage considerably decreases to 0%, 2%, and 7% if half-moons are adopted. Instead, both PP configurations show a soil water content higher than the threshold over the entire growing season.
What also stands out in Figure 8 is that the soil water content rapidly decreases with the end of the wet season and the increase of the temperature (see Figure 2). This is due to the high intensity of outcoming fluxes and absence of inflows. In TM configuration, the soil moisture reaches the threshold on 8th of October, just 2 days after the last simulated rainfall, and then starts to decrease from the onset of the dry season. The higher storage induced by the RWHT allows extending the growing season up to 20 days, avoiding the stress condition almost until the end of the month.
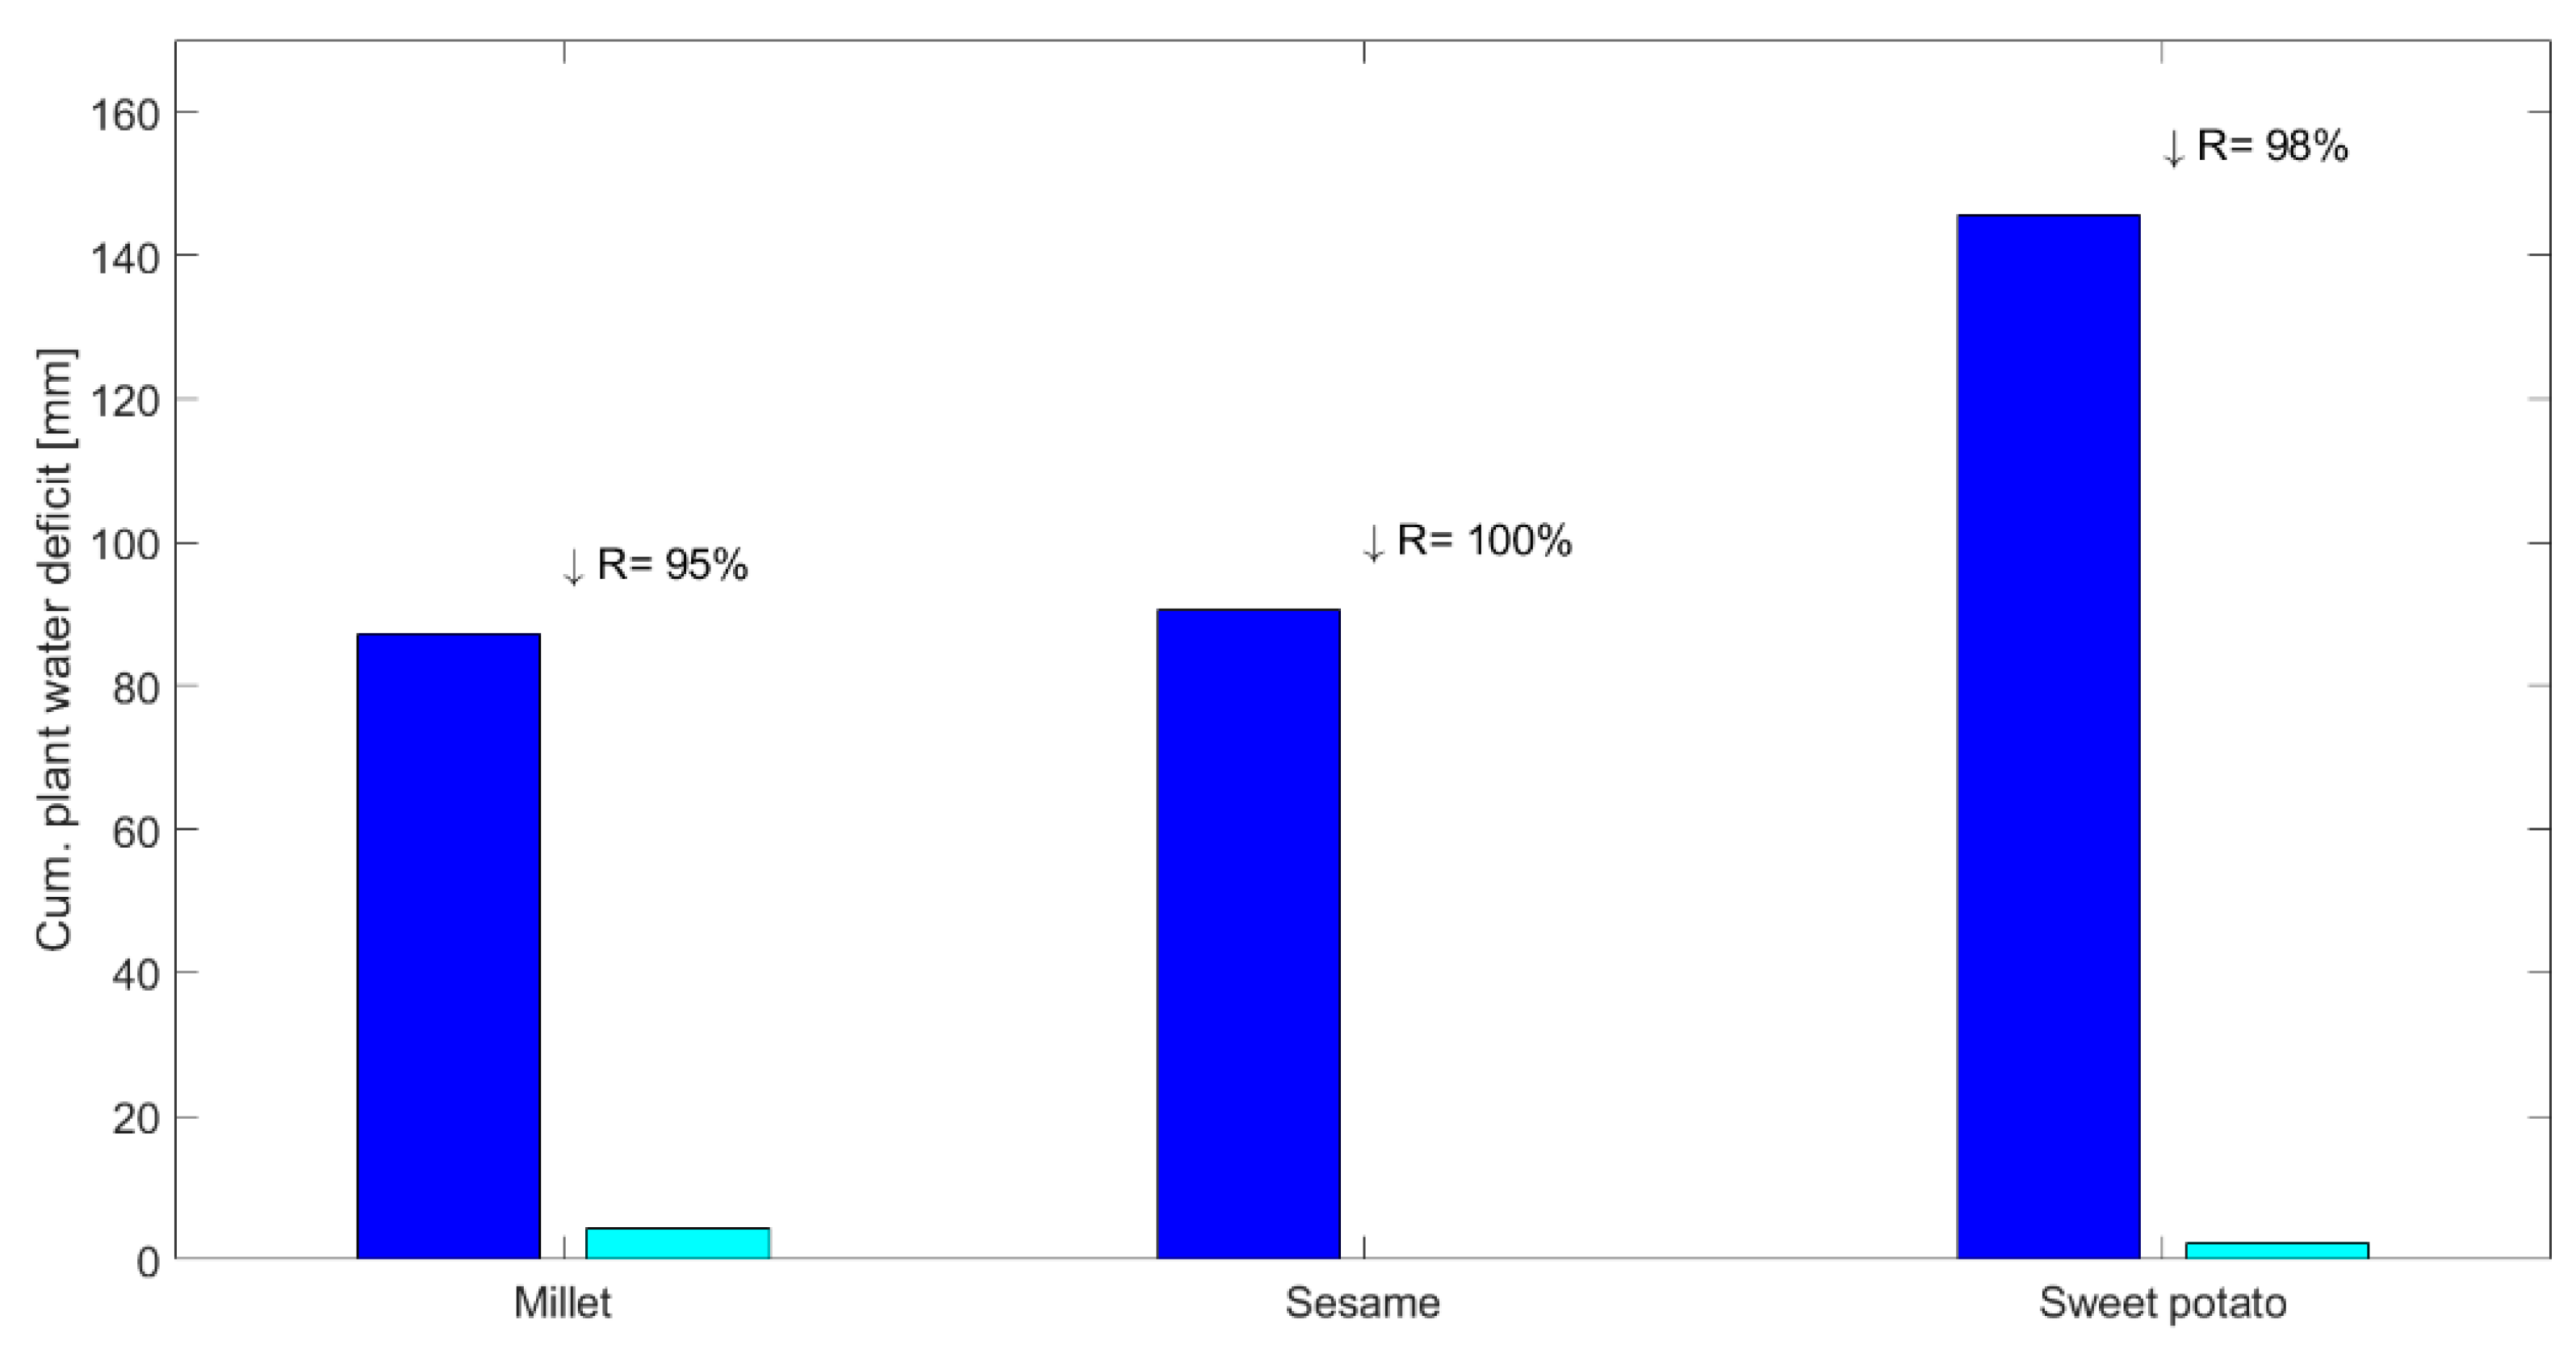
To observe the influence of RWHT on crops, the growing seasons of millet, sesame, and sweet potato with the conventional sowing method was compared against HM10 practice. The different phenological parameters of these crops lead to different evapotranspiration trends. The benefit induced by the presence of RWHT was measured as the reduction of cumulative plant water deficit (PWD), see Figure 9. PWD was calculated as the difference between the crop evapotranspiration (evapotranspiration under unstressed condition, see Equation (6)) and the actual evapotranspiration.
The maximum reduction is obtained for the sesame since no deficit is produced when using HM10. This occurs since the sesame harvesting takes place around mid-September, hence before the end of rainfalls and increase of temperature. Instead, the longer growing season of sweet potato undermines the traditional system leading to a higher PWD. On the contrary, HM10 highlights a great efficiency producing a deficit even lower than for the millet.
5. Discussion
The principal aim of using RWHT is to intercept the rainfall and surface runoff in order to maximize the availability of water for crop and to minimize the water deficit during the entire growing season [22]. In drylands, where food security is the first challenge, reducing water stress means decreasing the probability of crop failure [65]. The results presented here using numerical modeling and Monte Carlo simulations provide a deep analysis on the functioning of indigenous RWHT under a wide range of possible scenarios that might be faced in Sahelian rural areas.
In the case of choosing PP, the wide range of variation of the numerical results highlights the importance of field surveys and sampling to evaluate the correct physical parameters characterizing the site. On the contrary, for HM, the small sensitivity of model output to the soil parameters means that the hydrological efficiency is mostly controlled by the geometry. Thus, during the planning phase, the design is more important than the characterization of the site. In fact, from results, we can assert that (under the same hydrological conditions as the simulated ones) it is preferable to shape RWHT with shallower and wider holes instead of deeper and smaller holes. During the planning phase, once the project rain has been detected, the critical volume that avoids the overfilling of RWHT should be calculated and used to define the shape of the optimal agricultural practice.
Since Sahelian countries are among the poorest in the world, farmers have no access to tillage machines and all phases of the cultivation are handmade. Thus, the entity of the manual labor is strongly correlated to the RWHT design. The results showed in the previous section show that it is worth excavating deeper RWHT only if there is a relevant efficiency improvement. Especially for HM, it would be preferable to choose HM10 instead of deeper ponds, saving in that way many hours of manual labor, since the volume to dig is almost one-third of HM30. On the contrary, making the effort of digging deeper planting pits leads to consistent improvements, harvesting more water into the farming field and promoting soil water storage recharge.
Comparing the common results obtained in this study with the ones of the previous work of Tamagnone et al. [32], it is possible to appreciate the benefits induced by a hydrological modeling instead of pure hydraulic modeling. Considering the evaluation of the outlet discharge reduction, accounting for the infiltration leads to an increase of 17% and 27% for the HM and PP configurations, respectively. This means that even though the main role is played by the geometrical features of the RWHT, neglecting the hydrological components of the water balance leads to a consistent underestimation. Therefore, future studies cannot disregard the use of a hydrological model for the study of all processes involved in the runoff formation and propagation.
Observing the relation between parameters and the runoff coefficient, the strong correlation between the runoff coefficient and means that is also important to treat the surface between ponds in order to reduce the overland flow and to keep the water inside the farm field. As reported in previous works [23,66], the improvement of soil moisture is a phenomenon spatially limited under the pond, since the lateral transport is negligible. For this reason, the soil between the ponds is much drier than below them. Hence, combining RWHT with other surface treatments, such as soil scarifying, will improve the hydrological efficiency of the whole system. It will also help the recovery of grass between the basins, for the sustenance of cattle, or the implementation of intercropping. A recent study showed how the application of intercropping strategies lead to a greater yield as compared with the monoculture [67].
The great usefulness of RWHT can be observed at the beginning of the rainfall season. With the first rainfall, there is a fast increase in soil moisture making the soil more suitable to accommodate new seeds. The higher level of soil moisture enhances the biological activity which contributes to improving the soil structure avoiding the reduction of hydraulic conductivity [68]. The water balance also confirms that with the use of RWHT it is not possible to extend the growing season much after the end of the rains since the high magnitude of outflowing fluxes rapidly empty the soil water storage. Commonly the rainy season ends at the beginning of October, however, the use of HM or PP may guarantee a sufficient availability of water up to the end of the month. Furthermore, in such hydrometeorological conditions, it is preferable to cultivate from the beginning of June to the mid of September and harvest no later than the end of September.
The analysis at the two spatial scales allowed to appreciate the real effectiveness of RWHT for agricultural purposes. For PP, the observation at the field scale produced a scarce attenuation of the soil water stress. On the contrary, at the small scale, the results revealed that both PP configurations lead to a soil moisture trend even higher than HM.
RWHT have their limitations in the fight against food insecurity. Their advantages mainly concern the increase in available water for crop and overland flow management. However, they are not able to improve the nutrient in soils that are naturally poor in organic matter. Thus, in order to increase the crop yield, the realization of RWHT should be always followed by the addition of manure or fertilizer [4,17]. However, altering the surface roughness and slowing overland fluxes (runoff and wind), RWHT help to capture organic debris which provides nutrients for the natural regeneration of shrubs and agropastoral bush-woodland [24].
6. Conclusions
Water and food scarcity are among the main problems that condition the livelihood of Sahelian inhabitants. To cope with these threats, a growing number of farmers living in sub-Saharan drylands are already taking advantages from the use of improved water and soil management practices. This study exploits advanced numerical models to investigate the hydrological functioning of those RWHT locally used in the Sahel, solving some limitations recognized in previous investigations [32]. The benefits induced by the adoption of RWHT, such as the increment of infiltration and the reduction of crop water stress along the growing season, were analyzed.
Our findings suggest that RWHT always enhance the hydrological efficiency of agricultural fields, but the level of efficiency is strongly related to their design. Thus, once the location is identified, the best design should be evaluated based on the meteorological features of that area. Furthermore, considering the ongoing climate trend, the intensification of rainstorm should be evaluated in the planning phase. In terms of water stress mitigation, the right design can bring the soil water deficit to zero, maximizing the crop yield and avoiding the necessity of supplementary irrigation.
The methodology presented here could be very useful to scrupulously plan the irrigation to avoid crop water stress, in areas where water scarcity makes the value of water even higher. The irrigation can be quantified in terms of the amount of water needed to meet the crop demand and scheduled, introducing the right amount of water when soil water content goes below the threshold. Indeed, maximizing the water use efficiency and avoiding the crop water stress, the crop yield increases, approaching the food security in the Sahel. Likewise, the approach used for the evaluation of Sahelian agricultural practices may be applied to other agricultural studies elsewhere in the world. The high costs of in-situ studies and the increasing availability of data makes the use of numerical modeling an effective choice that can be easily replicated for different sites.
To deeply analyze the crop life cycle, the simple formulation chosen to evaluate the potential evapotranspiration could represent a weakness point since it does not take into account all physical and physiological factors governing the evapotranspiration process. Notwithstanding these limitations, it addresses a preliminary calculation coping with the scarcity of data that often characterize developing countries. Further implementations could involve more complex formulations including more parameters such as solar radiation, humidity, and wind speed (e.g., the FAO-56 Penman–Monteith or the Hargreaves–Samani equation).
The present study makes a step forward in the comprehensive investigation of RWHT in the numerical modeling framework. The methodology proposed would enlarge the field of application of hydraulic and hydrological models to ecological/agronomic context. Agro-hydrological physically based models could be effective tools to investigate impacts of climate on the crop life cycle, its health, and yield, without neglecting the hydrodynamics that controls the transformation from rainfall to runoff.
In the Sahel, despite the considerable effort in embracing improved land and water management practices, the adoption of these strategies remains too limited to lead a considerable change in Africa’s food and environmental security. Thus, this research should encourage to scale up these practices to make widespread the fight against food/water scarcity and environmental degradation. The present study demonstrates that, in these contexts, it is not necessary to resort to “high-tech” solutions and unaffordable strategies to deal with such problems. National policies should invest in the education of farmers so that they can gain awareness of the benefits derived from appropriate practices.
Author Contributions
P.T.: methodology, analyses, elaboration of data, and writing—original draft; E.C., L.C. and M.R.: methodology, supervision, validation, writing—review and editing. All authors have read and agreed to the published version of the manuscript.
Funding
This research received no external funding.
Conflicts of Interest
The authors declare no conflict of interest.
Appendix A
Figure A1.
Geometrical characteristics of the spatial domains used for simulations. All measures are in meters. All plots present a constant slope of 1% towards downstream. Coloring: red represents the treated surfaces (tilled areas), green displays ridges (realized from the excavated terrain), yellow shows the untreated surfaces (crusted areas).

Figure A2.
Hydrographs and infiltration trends computed for the Monte Carlo simulations in the PL (row a), HM30 (row b), HM20 (row c), HM10 (row d), PP20 (row e), and PP10 (row f) configurations. Red solid lines are the mean discharge and mean infiltration, respectively. Red dashed lines represent the first and third quartile of the distribution. Light gray solid lines are the outcomes of each simulation.

References
- Searchinger, T.; Hanson, C.; Waite, R.; Lipinski, B. Achieving Replacement Level Fertility. 2013. Available online: https://www.wri.org/publication/achieving-replacement-level-fertility (accessed on 13 May 2020).
- Potts, M.; Henderson, C.; Campbell, M. The Sahel: A Malthusian Challenge? Environ. Resour. Econ. 2013, 55, 501–512. [Google Scholar] [CrossRef]
- Winterbottom, R.; Reij, C.; Garrity, D.; Glover, J.; Hellums, D.; Mcgahuey, M.; Scherr, S. Improving Land and Water Management. 2013. Available online: https://www.climatelearningplatform.org/sites/default/files/resources/improving_land_and_water_management_0.pdf (accessed on 13 May 2020).
- Breman, H.; Groot, J.J.R.; van Keulen, H. Resource limitations in Sahelian agriculture. Glob. Environ. Chang. 2001, 11, 59–68. [Google Scholar] [CrossRef]
- National Centers for Environmental Information. Available online: https://www.ncdc.noaa.gov/cag/global/time-series/africa/land/1/7/1910-2019?trend=true&trend_base=10&firsttrendyear=1880&lasttrendyear=2019 (accessed on 14 February 2020).
- Taylor, C.M.; Belušić, D.; Guichard, F.; Parker, D.J.; Vischel, T.; Bock, O.; Harris, P.P.; Janicot, S.; Klein, C.; Panthou, G. Frequency of extreme Sahelian storms tripled since 1982 in satellite observations. Nature 2017, 544, 475–478. [Google Scholar] [CrossRef] [Green Version]
- Balme, M.; Vischel, T.; Lebel, T.; Peugeot, C.; Galle, S. Assessing the water balance in the Sahel: Impact of small scale rainfall variability on runoff. J. Hydrol. 2006, 331, 336–348. [Google Scholar] [CrossRef]
- Aich, V.; Liersch, S.; Vetter, T.; Andersson, J.C.M.; Müller, E.N.; Hattermann, F.F. Climate or land use? - Attribution of changes in river flooding in the Sahel zone. Water 2015, 7, 2796–2820. [Google Scholar] [CrossRef]
- Amogu, O.; Esteves, M.; Vandervaere, J.-P.; Malam Abdou, M.; Panthou, G.; Rajot, J.-L.; Souley Yéro, K.; Boubkraoui, S.; Lapetite, J.-M.; Dessay, N.; et al. Runoff evolution due to land-use change in a small Sahelian catchment. Hydrol. Sci. J. 2015, 60, 78–95. [Google Scholar] [CrossRef]
- Tamagnone, P.; Massazza, G.; Pezzoli, A.; Rosso, M. Hydrology of the Sirba River: Updating and Analysis of Discharge Time Series. Water 2019, 11, 156. [Google Scholar] [CrossRef] [Green Version]
- Bigi, V.; Pezzoli, A.; Rosso, M. Past and Future Precipitation Trend Analysis for the City of Niamey (Niger): An Overview. Climate 2018, 6, 73. [Google Scholar] [CrossRef] [Green Version]
- Seidou, O. Climate Change May Result in More Water Availability in Parts of the African Sahel. In Innovations and Interdisciplinary Solutions for Underserved Areas, Proceedings of Second International Conference, InterSol 2018, Kigali, Rwanda, March 24–25; Springer: Berlin, Germany, 2018; ISBN 978-3-319-98877-1. [Google Scholar]
- Tabor, J.A. Improving crop yields in the Sahel by means of water-harvesting. J. Arid Environ. 1995, 30, 83–106. [Google Scholar] [CrossRef]
- Malley, Z.J.U.; Kayombo, B.; Willcocks, T.J.; Mtakwa, P.W. Ngoro: An indigenous, sustainable and profitable soil, water and nutrient conservation system in Tanzania for sloping land. Soil Tillage Res. 2004, 77, 47–58. [Google Scholar] [CrossRef]
- Assefa, S.; Biazin, B.; Muluneh, A.; Yimer, F.; Haileslassie, A. Rainwater harvesting for supplemental irrigation of onions in the southern dry lands of Ethiopia. Agric. Water Manag. 2016, 178, 325–334. [Google Scholar] [CrossRef]
- Walker, S.; Tsubo, M.; Hensley, M. Quantifying risk for water harvesting under semi-arid conditions. Agric. Water Manag. 2005, 76, 94–107. [Google Scholar] [CrossRef]
- Zougmoré, R.; Zida, Z.; Kambou, N.F. Role of nutrient amendments in the success of half-moon soil and water conservation practice in semiarid Burkina Faso. Soil Tillage Res. 2003, 71, 143–149. [Google Scholar] [CrossRef]
- Hensley, M.; Bennie, A.; Van Rensburg, L.; Botha, J. Review of ‘plant available water’ aspects of water use efficiency under irrigated and dryland conditions. Water SA 2011, 37, 771–780. [Google Scholar] [CrossRef] [Green Version]
- Zakari, S.; Ouédraogo, M.; Abasse, T.; Zougmoré, R. Farmer’s Prioritization and Adoption of Climate-Smart Agriculture (CSA) Technologies and Practices. J. Agric. Environ. Sci. 2019, 8, 176–185. [Google Scholar] [CrossRef]
- Food and Agriculture Organization of the United Nations. Climate-Smart Agriculture Sourcebook; Food and Agriculture Organization of the United Nations: Rome, Italy, 2014; ISBN 978-92-5-107720-7. [Google Scholar]
- Al-Seekh, S.H.; Mohammad, A.G. The Effect of Water Harvesting Techniques on Runoff, Sedimentation, and Soil Properties. Environ. Manag. 2009, 44, 37–45. [Google Scholar] [CrossRef]
- Rockström, J.; Karlberg, L.; Wani, S.P.; Barron, J.; Hatibu, N.; Oweis, T.; Bruggeman, A.; Farahani, J.; Qiang, Z. Managing water in rainfed agriculture—The need for a paradigm shift. Agric. Water Manag. 2010, 97, 543–550. [Google Scholar] [CrossRef] [Green Version]
- Zouré, C.; Queloz, P.; Koïta, M.; Niang, D.; Fowé, T.; Yonaba, R.; Consuegra, D.; Yacouba, H.; Karambiri, H. Modelling the water balance on farming practices at plot scale: Case study of Tougou watershed in Northern Burkina Faso. Catena 2019, 173, 59–70. [Google Scholar] [CrossRef] [Green Version]
- Reij, C.; Tappan, G.; Smale, M. Agroenvironmental Transformation in the Sahel: Another Kind of “Green Revolution”. Int. Food Policy Res. Inst. 2009, 914, 52. [Google Scholar]
- Mounirou, L.A.; Zouré, C.O.; Yonaba, R.; Paturel, J.-E.; Mahé, G.; Niang, D.; Yacouba, H.; Karambiri, H. Multi-scale analysis of runoff from a statistical perspective in a small Sahelian catchment under semi-arid climate. Arab. J. Geosci. 2020, 13, 154. [Google Scholar] [CrossRef]
- Mounirou, L.A.; Yacouba, H.; Karambiri, H.; Paturel, J.-E.; Mahé, G. Measuring runoff by plots at different scales: Understanding and analysing the sources of variation. Comptes Rendus Geosci. 2012, 344, 441–448. [Google Scholar] [CrossRef]
- Defersha, M.B.; Melesse, A.M. Field-scale investigation of the effect of land use on sediment yield and runoff using runoff plot data and models in the Mara River basin, Kenya. CATENA 2012, 89, 54–64. [Google Scholar] [CrossRef]
- Vaezi, A.R. Modeling Runoff from Semi-Arid Agricultural Lands in Northwest Iran. Pedosphere 2014, 24, 595–604. [Google Scholar] [CrossRef]
- Hernández-Bernal, N. Water Harvesting as a Tool to Allow Environmental Recovery in a Semi-Arid Region in Brazil. Available online: https://search.informit.com.au/documentSummary;dn=889490390692042;res=IELENG (accessed on 14 February 2020).
- Welderufael, W.A.; Le Roux, P.A.L.; Hensley, M. Quantifying rainfall–runoff relationships on the Dera Calcic Fluvic Regosol ecotope in Ethiopia. Agric. Water Manag. 2008, 95, 1223–1232. [Google Scholar] [CrossRef]
- Verbist, K.; Cornelis, W.M.; Gabriels, D.; Alaerts, K.; Soto, G. Using an inverse modelling approach to evaluate the water retention in a simple water harvesting technique. Hydrol. Earth Syst. Sci. 2009, 13, 1979–1992. [Google Scholar] [CrossRef] [Green Version]
- Tamagnone, P.; Comino, E.; Rosso, M. Rainwater harvesting techniques as an adaptation strategy for flood mitigation. J. Hydrol. 2020, 586, 124880. [Google Scholar] [CrossRef]
- Bladé, E.; Cea, L.; Corestein, G.; Escolano, E.; Puertas, J.; Vázquez-Cendón, E.; Dolz, J.; Coll, A. Iber: Herramienta de simulación numérica del flujo en ríos. Rev. Int. Métod. Numér. Para Cálculo Diseño En Ing. 2014, 30, 1–10. [Google Scholar] [CrossRef] [Green Version]
- Xu, H.; Wu, M. A First Estimation of County-Based Green Water Availability and Its Implications for Agriculture and Bioenergy Production in the United States. Water 2018, 10, 148. [Google Scholar] [CrossRef] [Green Version]
- Schyns, J.F.; Hoekstra, A.Y.; Booij, M.J.; Hogeboom, R.J.; Mekonnen, M.M. Limits to the world’s green water resources for food, feed, fiber, timber, and bioenergy. Proc. Natl. Acad. Sci. USA 2019, 116, 4893–4898. [Google Scholar] [CrossRef] [Green Version]
- Ali, A.; Lebel, T. The Sahelian standardized rainfall index revisited. Int. J. Climatol. 2009, 29, 1705–1714. [Google Scholar] [CrossRef]
- HarvestChoice Long-Term Annual Rainfall (mm, 1960–2014). Available online: https://harvestchoice.org/data/pre_mean (accessed on 4 December 2019).
- Dame, M.C.W.; University of Notre Dame. Country Index // Notre Dame Global Adaptation Initiative // University of Notre Dame. Available online: https://gain.nd.edu/our-work/country-index/ (accessed on 2 July 2020).
- Todzo, S.; Bichet, A.; Diedhiou, A. Intensification of the hydrological cycle expected in West Africa over the 21st century. Earth Syst. Dyn. 2020, 11, 319–328. [Google Scholar] [CrossRef] [Green Version]
- Panthou, G.; Vischel, T.; Lebel, T. Recent trends in the regime of extreme rainfall in the Central Sahel: Recent trends of extreme rainfall in the west african sahel. Int. J. Climatol. 2014, 34, 3998–4006. [Google Scholar] [CrossRef]
- Kandji, S.T.; Verchot, L.; Mackensen, J. Climate Change and Variability in the Sahel Region: Impacts and Adaptation Strategies in the Agricultural Sector. 2006. Available online: http://www.worldagroforestry.org/publication/climate-change-and-variability-sahel-region-impacts-and-adaptation-strategies (accessed on 14 May 2020).
- Fick, S.E.; Hijmans, R.J. WorldClim 2: New 1-km spatial resolution climate surfaces for global land areas. Int. J. Climatol. 2017, 37, 4302–4315. [Google Scholar] [CrossRef]
- Cea, L.; Legout, C.; Darboux, F.; Esteves, M.; Nord, G. Experimental validation of a 2D overland flow model using high resolution water depth and velocity data. J. Hydrol. 2014, 513, 142–153. [Google Scholar] [CrossRef]
- Cea, L.; Bladé, E. A simple and efficient unstructured finite volume scheme for solving the shallow water equations in overland flow applications: The shallow water equations for overland flow applications. Water Resour. Res. 2015, 51, 5464–5486. [Google Scholar] [CrossRef] [Green Version]
- Cea, L.; Legout, C.; Grangeon, T.; Nord, G. Impact of model simplifications on soil erosion predictions: Application of the GLUE methodology to a distributed event-based model at the hillslope scale: Impact of model simplifications on soil erosion predictions. Hydrol. Process. 2016, 30, 1096–1113. [Google Scholar] [CrossRef]
- Fraga, I.; Cea, L.; Puertas, J. Effect of rainfall uncertainty on the performance of physically based rainfall–runoff models. Hydrol. Process. 2019, 33, 160–173. [Google Scholar] [CrossRef] [Green Version]
- Cea, L.; Fraga, I.; Puertas, J.; Álvarez, M.; Bermúdez, M.; Coquerez, S.; Salsón, S.; Pettazzi, A. Influencia de la densidad espacial de estaciones pluviométricas y de la disponibilidad de datos radar en los hidrogramas de tormenta calculados con un modelo hidrológico distribuido: Aplicación a una cuenca de 24 Km2 en el Noroeste de España. In Proceedings of the IV Jornadas de Ingeniería del Agua, JIA2015, Córdoba, Spain, 21–22 October 2015; p. 10. [Google Scholar]
- Chow, V.T.; Maidment, D.R.; Mays, L.W. Applied Hydrology; McGraw-Hill series in water resources and environmental engineering; McGraw-Hill: New York, NY, USA, 1988; ISBN 978-0-07-010810-3. [Google Scholar]
- Famiglietti, J.S.; Wood, E.F. Multiscale modeling of spatially variable water and energy balance processes. Water Resour. Res. 1994, 30, 3061–3078. [Google Scholar] [CrossRef] [Green Version]
- Doorenbos, J.; Pruitt, W.O. Guidelines for Predicting Crop Water Requirements; Food and Agriculture Organization: Rome, Italy, 1977; Volume 24. [Google Scholar]
- Allan, R.; Pereira, L.; Smith, M. Crop Evapotranspiration-Guidelines for Computing Crop Water Requirements-FAO Irrigation and Drainage Paper 56; Food and Agriculture Organization: Rome, Italy, 1998; Volume 56. [Google Scholar]
- Mekdaschi Studer, R.; Liniger, H. Water Harvesting: Guidelines to Good Practice; Centre for Development and Environment (CDE): Bern, Switzerland, 2013; ISBN 978-3-905835-35-9. [Google Scholar]
- WOCAT. Available online: https://qcat.wocat.net/en/wocat/ (accessed on 27 February 2019).
- Mathon, V.; Laurent, H.; Lebel, T. Mesoscale Convective System Rainfall in the Sahel. J. Appl. Meteorol. 2002, 41, 1081–1092. [Google Scholar] [CrossRef]
- Galle, S.; Grippa, M.; Peugeot, C.; Moussa, I.B.; Cappelaere, B.; Demarty, J.; Mougin, E.; Panthou, G.; Adjomayi, P.; Agbossou, E.K.; et al. AMMA-CATCH, a Critical Zone Observatory in West Africa Monitoring a Region in Transition. Vadose Zone J. 2018, 17, 180062. [Google Scholar] [CrossRef] [Green Version]
- McKay, M.D.; Beckman, R.J.; Conover, W.J. A Comparison of Three Methods for Selecting Values of Input Variables in the Analysis of Output from a Computer Code. Technometrics 1979, 21, 239–245. [Google Scholar] [CrossRef]
- Helton, J.C.; Davis, F.J. Latin hypercube sampling and the propagation of uncertainty in analyses of complex systems. Reliab. Eng. Syst. Saf. 2003, 81, 23–69. [Google Scholar] [CrossRef] [Green Version]
- Olsson, A.; Sandberg, G.; Dahlblom, O. On Latin hypercube sampling for structural reliability analysis. Struct. Saf. 2003, 25, 47–68. [Google Scholar] [CrossRef]
- Peugeot, C.; Cappelaere, B.; Vieux, B.E.; Séguis, L.; Maia, A. Hydrologic process simulation of a semiarid, endoreic catchment in Sahelian West Niger. 1. Model-aided data analysis and screening. J. Hydrol. 2003, 279, 224–243. [Google Scholar] [CrossRef] [Green Version]
- Delestre, O.; Esteves, M. Rainfall Overland flow Simulations and Real Events in Niger. 2010. Available online: https://hal.archives-ouvertes.fr/hal-00521133/ (accessed on 4 February 2020).
- Van de Giesen, N.; Stomph, T.J.; de Ridder, N. Surface runoff scale effects in West African watersheds: Modeling and management options. Agric. Water Manag. 2005, 72, 109–130. [Google Scholar] [CrossRef]
- Abdou, M.M.; Vandervaere, J.-P.; Descroix, L.; Bouzou, I.; Maiga, O.F.; Abdou, S.; Seyni, B.B.; Daouda, L.O. Évolution de la Conductivité Hydraulique d’un sol Sableux Cultivé du Niger. Available online: https://hal.ird.fr/ird-02153170/document (accessed on 26 November 2019).
- Valentin, C. Surface crusts of semi-arid sandy soils: Types, functions and management. In Proceedings of the Management of Tropical Sandy Soils for Sustainable Agriculture, Khon Kaen, Thailand, 27 November–2 December 2005; p. 12, ISBN 978-974-7946-96-3. [Google Scholar]
- Brocca, L.; Melone, F.; Moramarco, T. Distributed rainfall-runoff modelling for flood frequency estimation and flood forecasting. Hydrol. Process. 2011, 25, 2801–2813. [Google Scholar] [CrossRef]
- Komariah, S.M. The development of water harvesting research for agriculture. Rev. Agric. Sci. 2013, 1, 31–42. [Google Scholar] [CrossRef]
- Barry, B.; Olaleye, A.O.; Zougmoré, R.; Fatondji, D. Rainwater Harvesting Technologies in the Sahelian Zone of West Africa and the Potential for Outscaling; (Working Paper 126); International Water Management Institute: Colombo, Sri Lanka, 2008; p. 40. ISBN 978-92-9090-684-1. [Google Scholar]
- Li, C.; Hoffland, E.; Kuyper, T.W.; Yu, Y.; Zhang, C.; Li, H.; Zhang, F.; van der Werf, W. Syndromes of production in intercropping impact yield gains. Nat. Plants 2020, 6, 653–660. [Google Scholar] [CrossRef]
- Roose, E.; Kabore, V.; Guenat, C. Zai Practice: A West African Traditional Rehabilitation System for Semiarid Degraded Lands, a Case Study in Burkina Faso. Arid Soil Res. Rehabil. 1999, 13, 343–355. [Google Scholar] [CrossRef]
Figure 1.
Geolocation of the Sahelian strip. Long-term climate data: average temperature (1970–2000) and isohyets (1960–2014) of the sub-Saharan area [37,42].

Figure 2.
(a) Hydrological input for the short-term analysis: the extreme rainfall hyetograph; (b) meteorological input for the long-term analysis: the average daily temperature (red line) and the rainfall pattern (blue bars) of the wet season.
Figure 2.
(a) Hydrological input for the short-term analysis: the extreme rainfall hyetograph; (b) meteorological input for the long-term analysis: the average daily temperature (red line) and the rainfall pattern (blue bars) of the wet season.
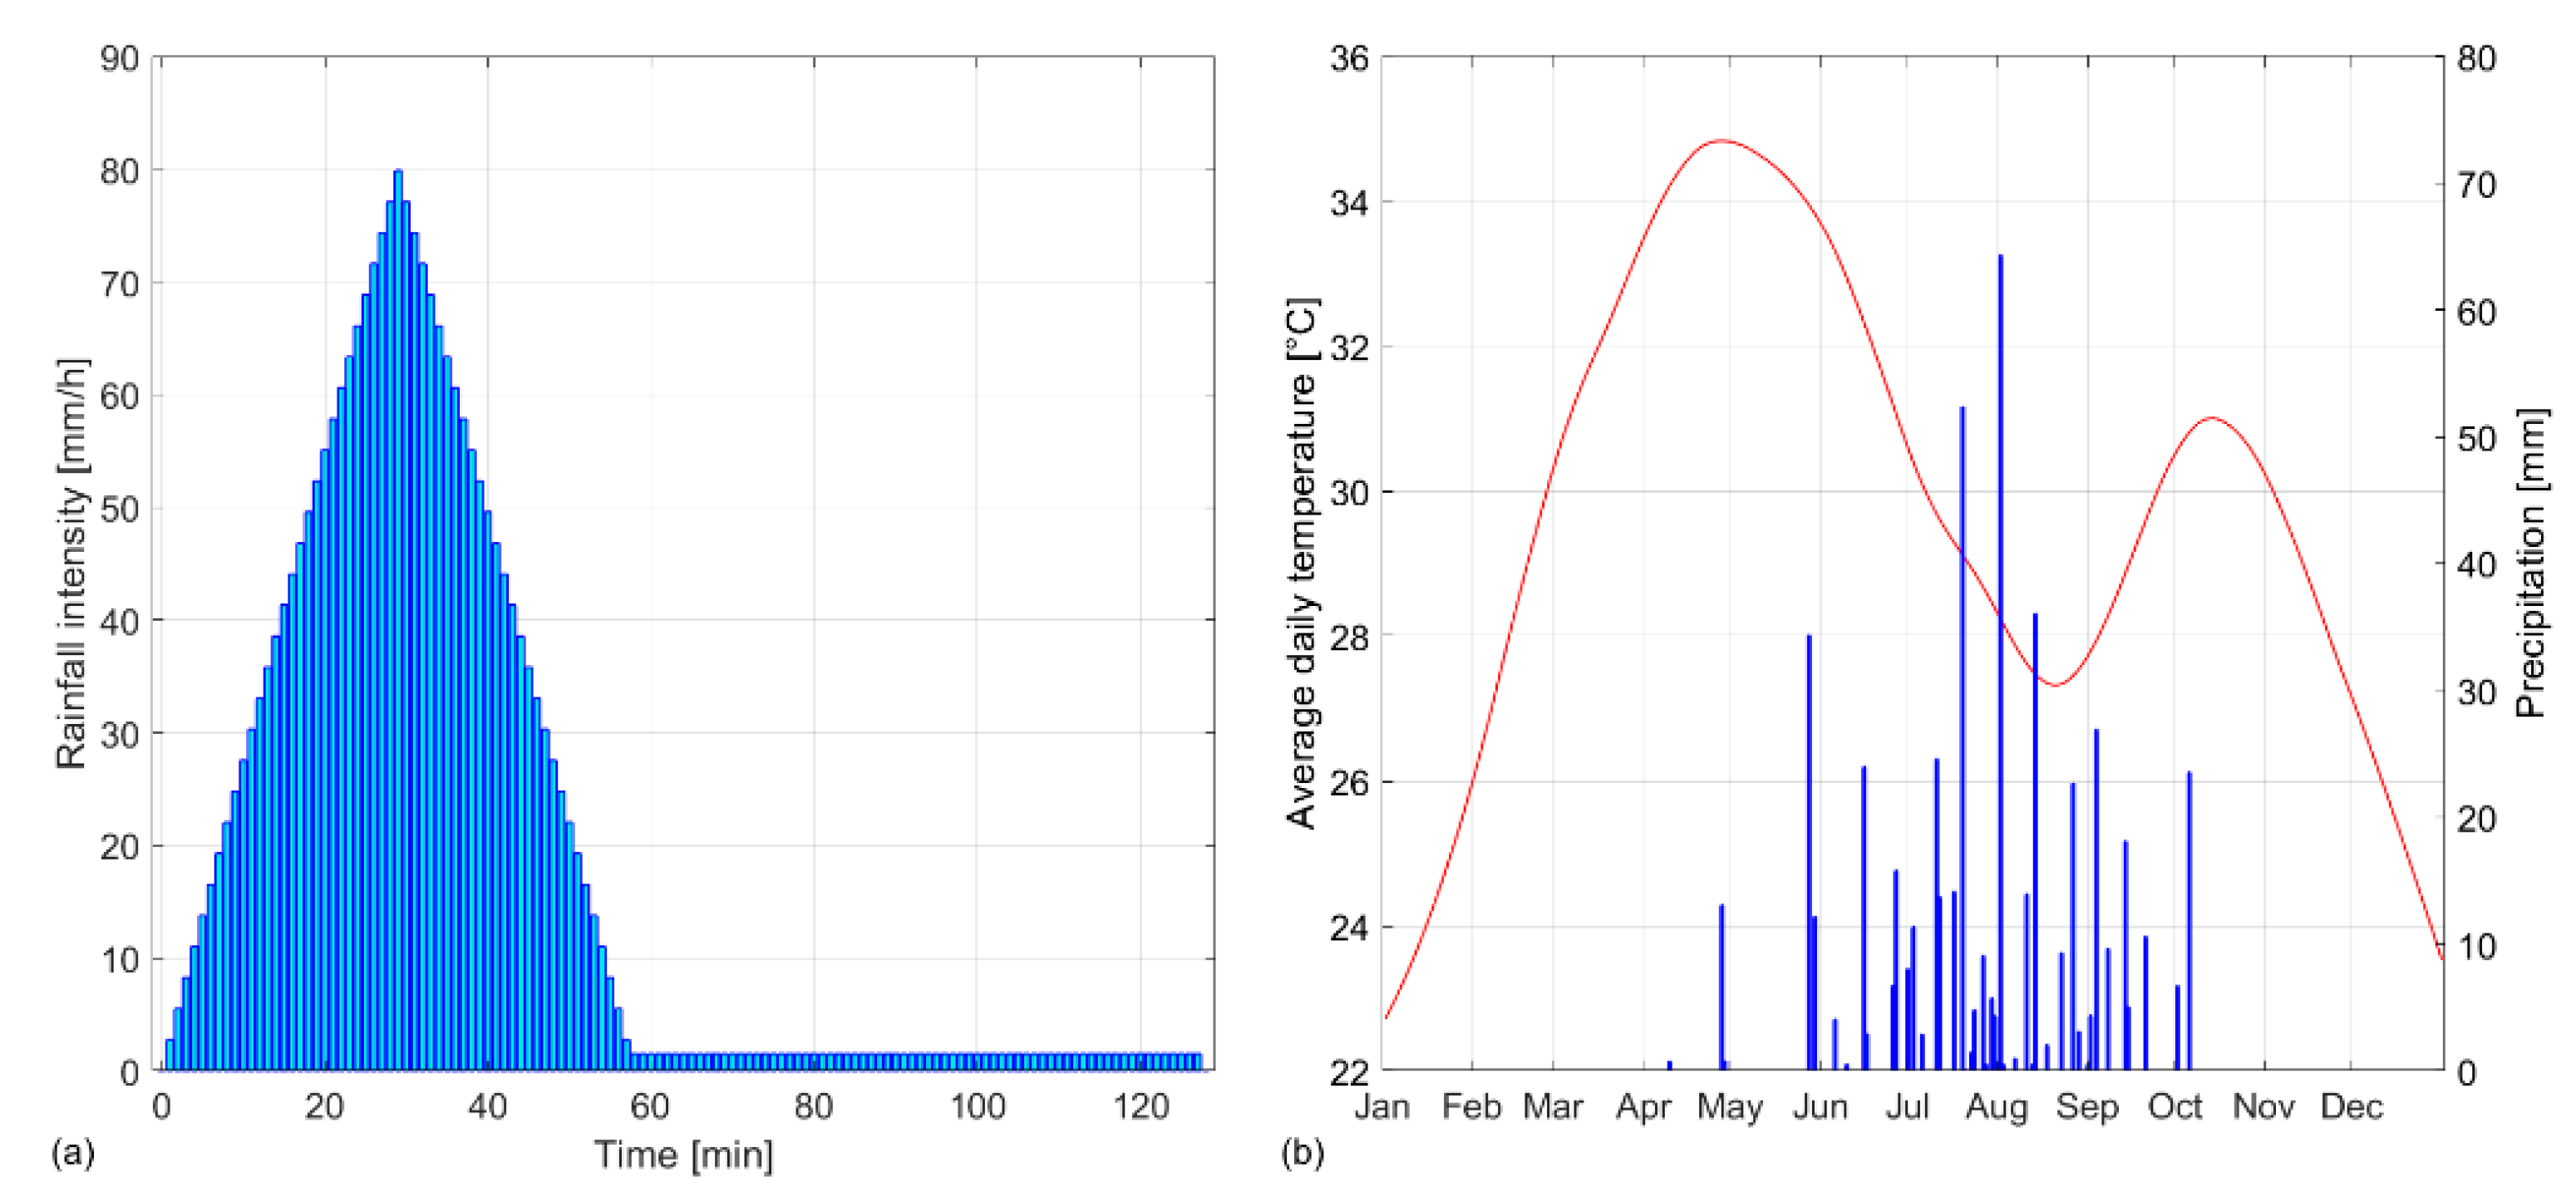
Figure 3.
Hydrographs and infiltration computed for the Monte Carlo simulations in the PL (first row), HM30 (second row), and PP20 (third row) configurations. Red solid lines are the mean discharge and mean infiltration, respectively. Red dashed lines represent the first and third quartile of the distribution. Red area delineates the 95% confidence interval.
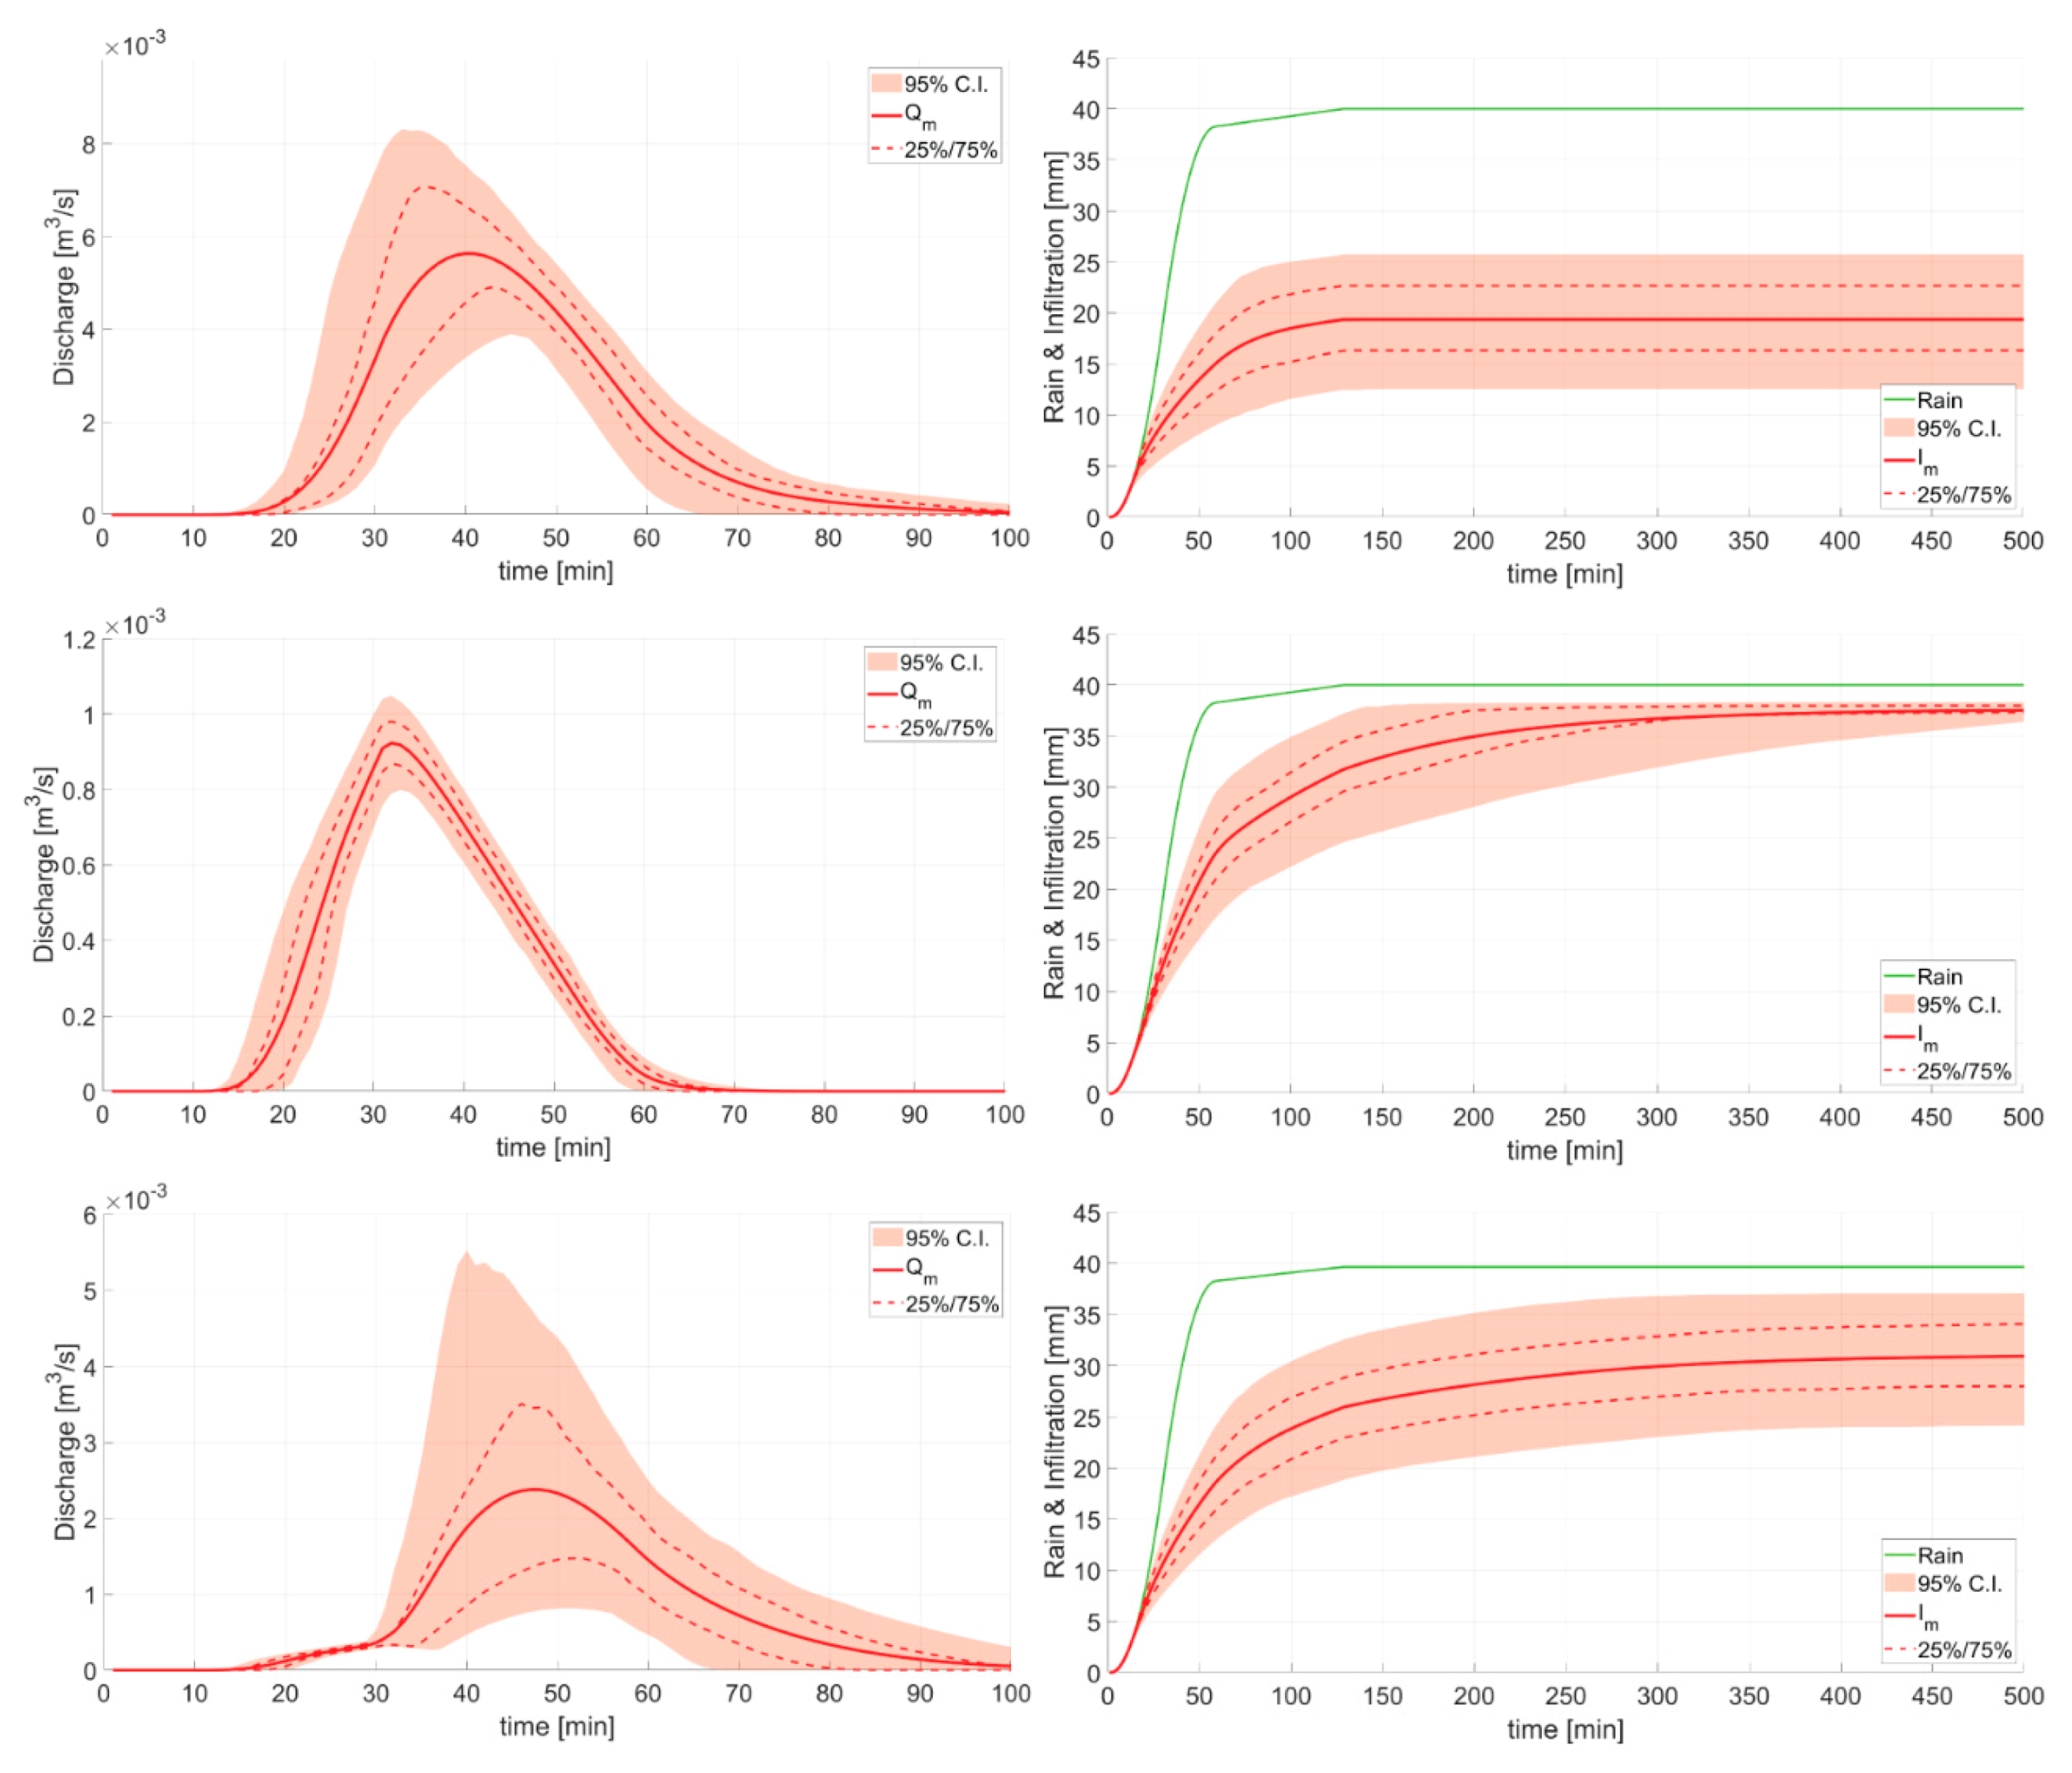
Figure 4.
Correlation between runoff coefficient and input parameters for HM30 (first row) and PP20 (second row). is the Spearman’s correlation coefficient between the couple of datasets.
Figure 4.
Correlation between runoff coefficient and input parameters for HM30 (first row) and PP20 (second row). is the Spearman’s correlation coefficient between the couple of datasets.

Figure 5.
Boxplot of outflow reduction efficiency. In each box, the upper and lower edges indicate the first and third quartile, respectively, the red central line is the median and the green x symbol is the mean. The whiskers length was set equal to the interquartile distance. Outliers have been hidden.

Figure 6.
Boxplot of infiltration increase efficiency. In each box, the upper and lower edges indicate the first and third quartile, respectively, the red central line is the median, and the green x symbol is the mean. The whiskers length was set equal to the interquartile distance. Outliers have been hidden.
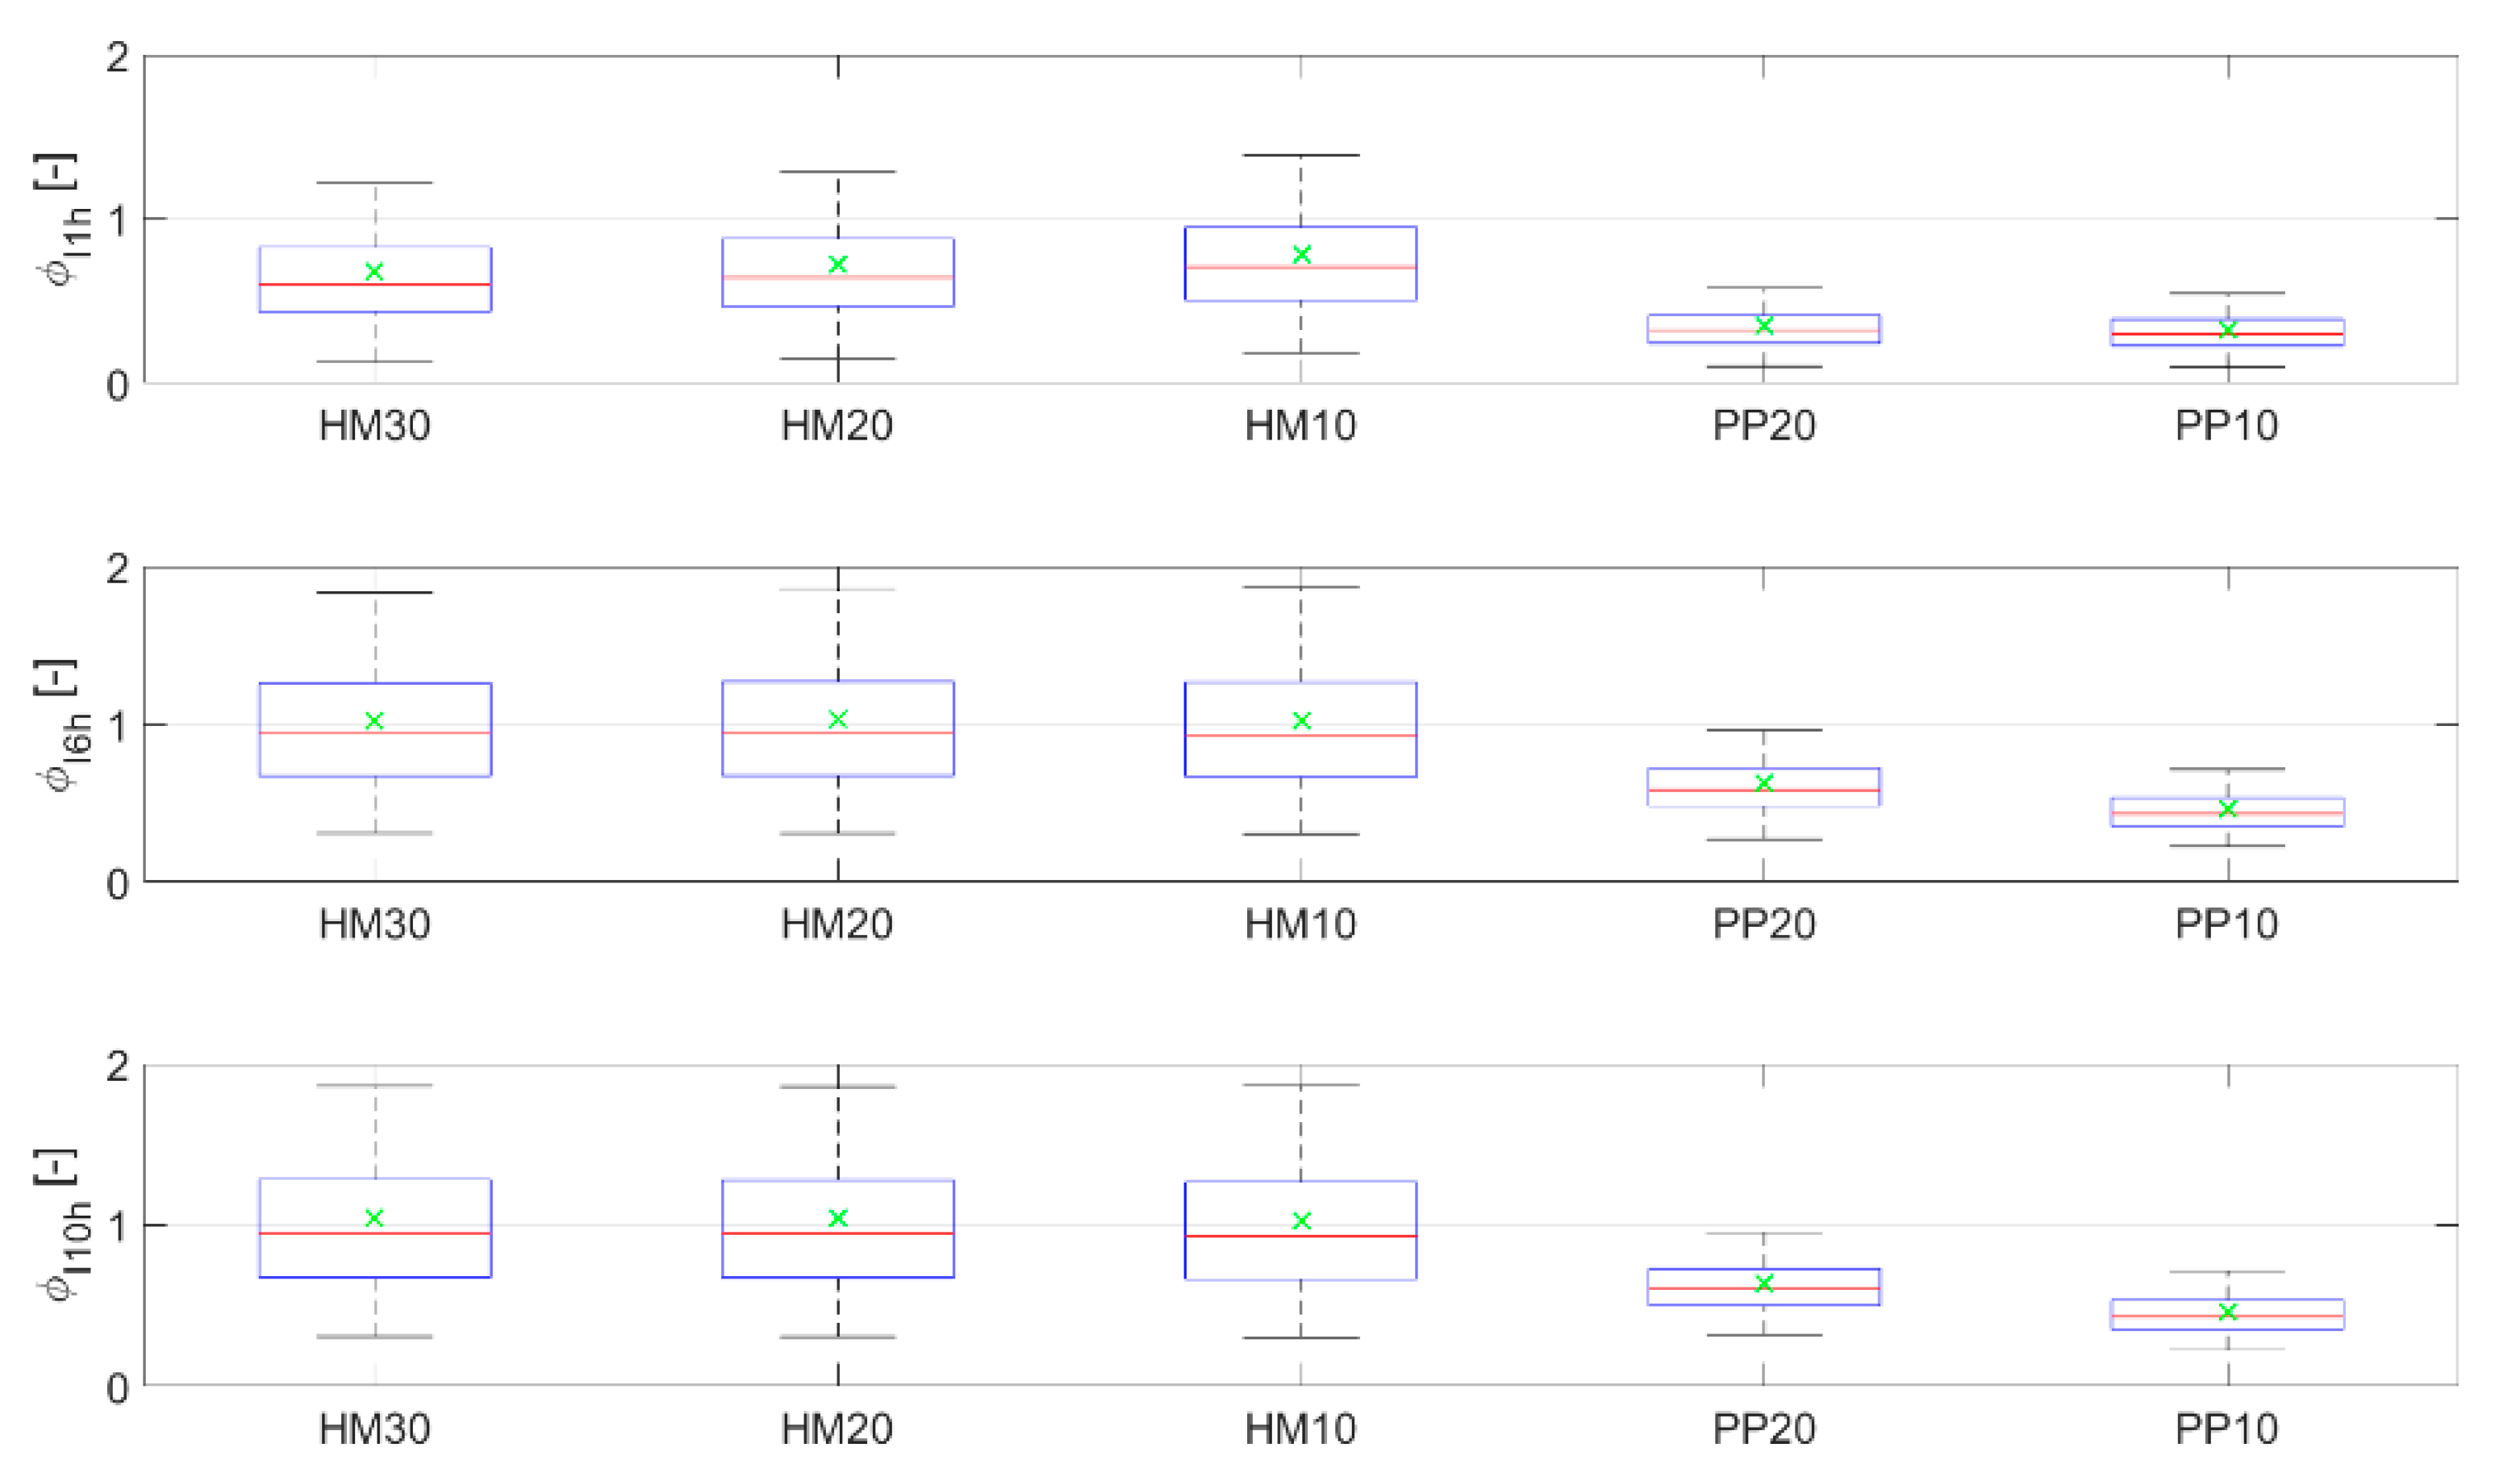
Figure 7.
Precipitation (blue bars), infiltration trend, and soil moisture trend (colored lines) at the field scale over the wet season. The red area represents the level of water content lower than the threshold in which the crop is water stressed. The green area highlights the range in which soil water availability is enough to meet the demand of the crop. The boundary between the two areas corresponds to the threshold of readily available water (blue dash-dotted line). The upper and lower limits are the soil moisture at saturation and permanent wilting point, respectively. The vertical dashed lines represent the growing period, from the sowing (left) to the harvest (right).

Figure 8.
Soil moisture trend at the small scale over the wet season. The red area represents the level of water content lower than the threshold in which the crop is water stressed. The green area highlights the range in which soil water availability is enough to meet the demand of the crop. The boundary between the two areas corresponds to the threshold of readily available water (blue dash-dotted line). The upper and lower limits are the soil moisture at saturation and permanent wilting point, respectively. The vertical dashed lines represent the growing period, from the sowing (left) to the harvest (right).
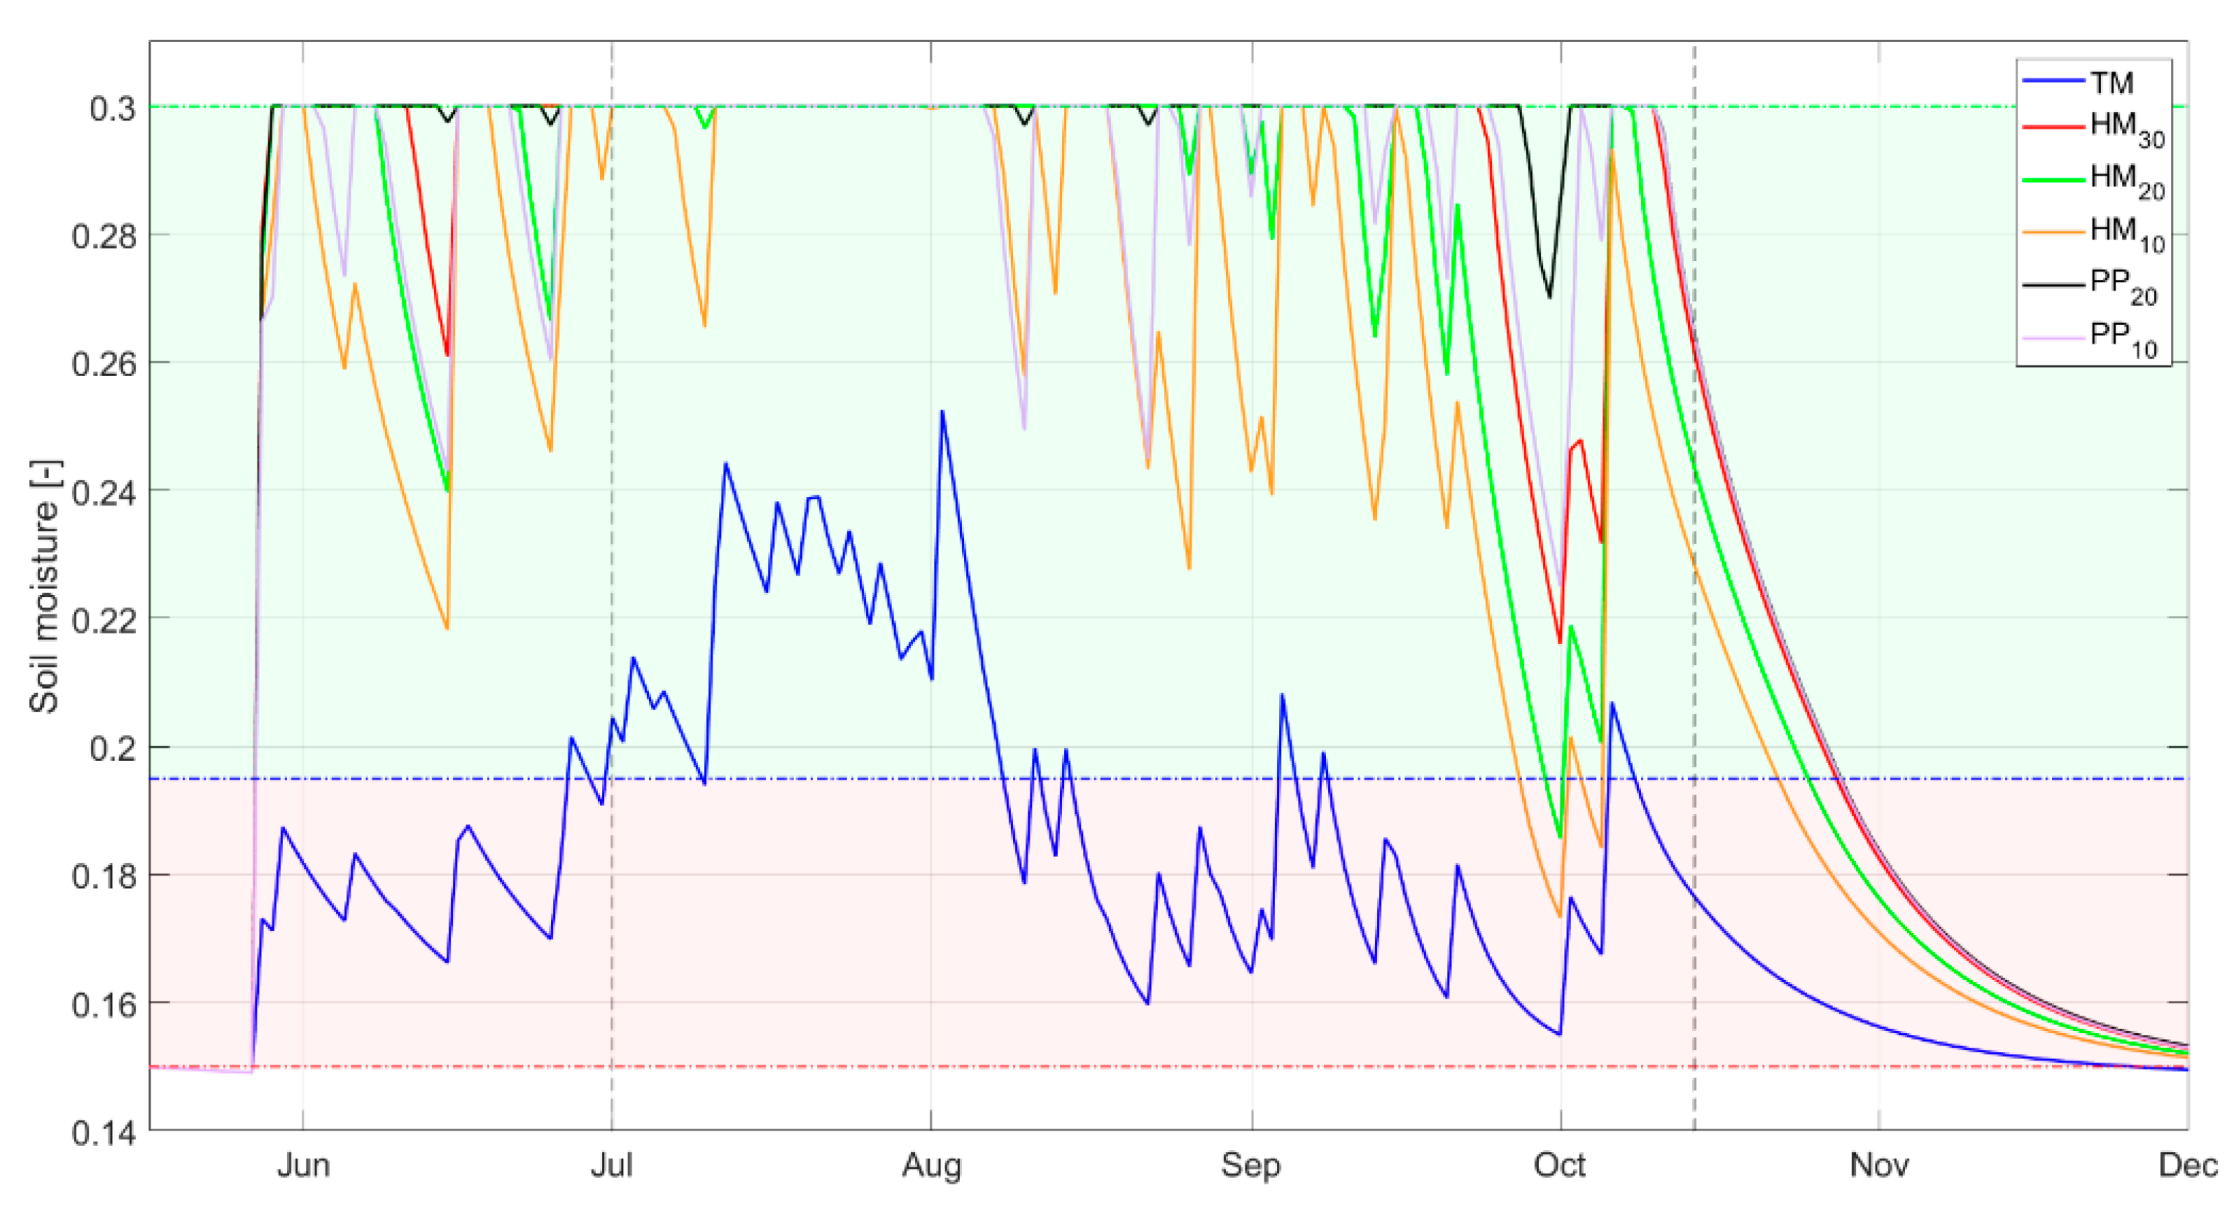
Figure 9.
Cumulative plant water deficit induced by the use of the traditional sowing method (blue bars) or adopting half-moons with a pond depth of 10 cm (cyan bars) for three traditional Sahelian crops. R values indicate the deficit reduction when HM10 are used.
Figure 9.
Cumulative plant water deficit induced by the use of the traditional sowing method (blue bars) or adopting half-moons with a pond depth of 10 cm (cyan bars) for three traditional Sahelian crops. R values indicate the deficit reduction when HM10 are used.


Table 1.
Characteristic and identification codes for the different rainwater harvesting techniques (RWHT) configurations analyzed.
Table 1.
Characteristic and identification codes for the different rainwater harvesting techniques (RWHT) configurations analyzed.
| Configurations | Excavation Depth (cm) | Identification Code |
|---|---|---|
| Plain | 0 | PL |
| Traditional sowing method | 0 | TM |
| Half-moon | 10 | HM10 |
| 20 | HM20 | |
| 30 | HM30 | |
| Planting pits | 10 | PP10 |
| 20 | PP20 |
Table 2.
Parameter ranges used in the Monte Carlo simulations.
| Parameter | Sampling Range | Unit | Source | |
|---|---|---|---|---|
| Manning coefficient () | [0.02–0.7] | s/m1/3 | [59,60,61] | |
| Suction () | [110–290] | mm | [48] | |
| Total porosity () | [0.33–0.48] | - | [26,48] | |
| Initial saturation () | [0.07–0.1] | - | [62] | |
| Hydraulic conductivity | () | [0.5–3] crusted 1 | mm/h | [48,59,60,62,63] |
| () | [10–40] tilled 1 | |||
1 in order to simulate the effect of crusted surface and tilled surface, two different sets of parameters were generated for such zones.
| Parameter | Values | Unit | |
|---|---|---|---|
| Manning coefficient () | 0.34 | s/m1/3 | |
| Suction () | 122.16 | mm | |
| Total porosity () | 0.3 | - | |
| Initial saturation () | 0.5 | - | |
| Hydraulic conductivity | () | 0.89 | mm/h |
| () | 18.11 | ||
| () | 0.5 | ||
| Pore size distribution index | 0.5 | - | |
| Field capacity | 0.25 | - | |
| Wilting point | 0.15 | - | |
Table 4.
Phenological parameters used to describe the growth stages of selected crops.
| Type | Crop | Depletion Factor (-) | Crop Coefficient (days) | Lengths of Growth Stages (days) | Growing Season | ||||||
|---|---|---|---|---|---|---|---|---|---|---|---|
| L1 | L2 | L3 | L4 | Length (Days) | Period | ||||||
| Cereals | Millet | 0.55 | 0.3 | 1 | 0.3 | 15 | 25 | 40 | 25 | 105 | Jul–Oct |
| Oil seed | Sesame | 0.6 | 0.35 | 1.1 | 0.25 | 20 | 30 | 40 | 20 | 110 | Jun–Sep |
| Root crop | Sweet potato | 0.65 | 0.5 | 1.15 | 0.65 | 15 | 30 | 50 | 30 | 125 | Jun–Oct |
1 linear variation between extremes.
Table 5.
Spearman’s correlation coefficients () between the runoff coefficient and input parameters for each configuration.
Table 5.
Spearman’s correlation coefficients () between the runoff coefficient and input parameters for each configuration.
| PL | HM30 | HM20 | HM10 | PP20 | PP10 | ||
|---|---|---|---|---|---|---|---|
| Manning coefficient () | −0.34 | −0.13 | −0.09 | −0.30 | −0.41 | −0.45 | |
| Suction () | −0.32 | −0.33 | −0.33 | −0.33 | −0.37 | −0.37 | |
| Total porosity () | −0.20 | −0.21 | −0.21 | −0.20 | −0.20 | −0.20 | |
| Initial saturation () | 0.01 | −0.02 | −0.02 | 0.02 | 0.02 | 0.02 | |
| Hydraulic conductivity | () | −0.82 | −0.86 | −0.86 | −0.83 | −0.73 | −0.71 |
| () | - | 0.08 | 0.09 | 0.07 | −0.16 | −0.15 | |
Table 6.
Water stress mitigation efficiency.
| RWHT | |
|---|---|
| HM30 | 23.02 |
| HM20 | 22.92 |
| HM10 | 20.72 |
| PP20 | 3.75 |
| PP10 | 2.85 |
© 2020 by the authors. Licensee MDPI, Basel, Switzerland. This article is an open access article distributed under the terms and conditions of the Creative Commons Attribution (CC BY) license (http://creativecommons.org/licenses/by/4.0/).
Share and Cite
MDPI and ACS Style
Tamagnone, P.; Cea, L.; Comino, E.; Rosso, M. Rainwater Harvesting Techniques to Face Water Scarcity in African Drylands: Hydrological Efficiency Assessment. Water 2020, 12, 2646. https://doi.org/10.3390/w12092646
AMA Style
Tamagnone P, Cea L, Comino E, Rosso M. Rainwater Harvesting Techniques to Face Water Scarcity in African Drylands: Hydrological Efficiency Assessment. Water. 2020; 12(9):2646. https://doi.org/10.3390/w12092646
Chicago/Turabian StyleTamagnone, Paolo, Luis Cea, Elena Comino, and Maurizio Rosso. 2020. "Rainwater Harvesting Techniques to Face Water Scarcity in African Drylands: Hydrological Efficiency Assessment" Water 12, no. 9: 2646. https://doi.org/10.3390/w12092646
Note that from the first issue of 2016, this journal uses article numbers instead of page numbers. See further details here.