Article

A Multi-Disciplinary Approach to Understand Hydrologic and Geochemical Processes at Koiliaris Critical Zone Observatory

by
Maria A. Lilli
1,*,
Dionissis Efstathiou
1,
Daniel Moraetis
2,
Jonathan Schuite
3,4,
Sofia D. Nerantzaki
1 and
Nikolaos P. Nikolaidis
1
1
Department of Environmental Engineering, Technical University of Crete, 73100 Chania, Greece
2
Department of Applied Physics and Astronomy, University of Sharjah, P.O. Box 27272, Sharjah, UAE
3
Centre de Géosciences, MINES ParisTech, PSL Université, 77305 Fontainebleau, France
4
Now at TerraScience Consulting, 24120 Terrasson-Lavilledieu, France
*
Author to whom correspondence should be addressed.
Water 2020, 12(9), 2474; https://doi.org/10.3390/w12092474
Submission received: 27 July 2020 / Revised: 28 August 2020 / Accepted: 29 August 2020 / Published: 3 September 2020

Abstract

:
Koiliaris CZO is a European Critical Zone Observatory (CZO) typical of the Mediterranean karstic geomorphology, which represents watersheds affected by humans over the centuries. This study aims to provide information that underpins the hydrologic and geochemical processes functioning at Koiliaris CZO. Linking geomorphologic and tectonic analysis improved the delineation of a karstic area which extends outside of the Koiliaris watershed and identified how structural elements influence the regional hydrology. The fluctuation in the river flow represents processes occurring in the karst and the periodic signal is related to Earth tide stressing of the karstic reservoirs. The conceptualization of a two-reservoir, well-mixed karstic system is confirmed by both the geomorphologic and tidal analysis. The hydrologic response is fast and it is manifested especially during extreme events where 70% of the precipitation becomes surface runoff, creating major flood events. The different sampling sites in the Koiliaris CZO were geochemically clustered and the quantification of the weathering fluxes showed that 25 mm/1000 years and 39 mm/1000 years of carbonate were removed by chemical weathering for the Keramianos ephemeral river and the springs, respectively. These studies illustrate the importance of critical zone science and transdisciplinary studies on water and soil management.

1. Introduction

The main anthropogenic drivers causing ecosystem change and potential tipping points are climate change, land-use change, and above- and below- ground biodiversity loss [1]. In many aspects, the carrying capacity of the planet has been exceeded with potential adverse consequences [2,3]. The degree of utilization of ecosystem resources is such that almost two thirds of ecosystem services have been degraded in just fifty years [4]. In addition, humans have to mitigate and adapt the impacts of climate change that would exert a significant pressure on all ecosystems around the globe and the services they provide [5].
One of the strategies the European Commission is using to address these global environmental challenges is through long-term ecosystem research (LTER) and the development of a pan-European research infrastructure. The European LTER network conducts “integrated long-term research on ecosystems science, critical zone science and socio-ecological science at the European level to improve our understanding of system change and/or adaptation in response to global pressures and the impacts of multiple stressors on natural resources, ecosystems and biodiversity” [6]. The network consists of distributed sites conducting in-situ observations and research that cover the whole European landscape aiming at addressing major research and societal grand challenges. The network observatories were developed by scientists/ecologists and coalesced 20 years ago into the LTER network [7]. LTER observatories measure parameters addressing ecological integrity including aspects of abiotic heterogeneity, biotic diversity, and budgets of water, energy, and matter [8].
The scientific underpinning of the LTER research and environmental analysis is the Whole-system Approach for in-situ research on life supporting systems (WAILS) which is used to assess environmental, ecological, critical zone and socio-ecological systems [6]. The whole-systems approach includes the study of the Earth’s critical Zone as well as the interactions of humans with the environment at various scales. The concept of “macrosystems ecology” (MSE) is used to bridge in-situ observations to regional and continental relevance and translate research results to policy relevance at various scales.
A critical component of LTER observatory network are the critical zone observatories (CZOs). CZOs aim to study the surface layer of the earth, from bedrock to treetop, which provides humans with life sustaining ecosystem services and resources [9,10,11]. Critical zone science gives special emphasis on the vertical integration of the zone and the mechanistic understanding of the processes that shape the functioning across scales [11]. The framework of the critical zone also adopts a chain-of-impact approach to handle the key linkages between land-use practices, environmental processes, and ecosystem services within the critical zone [12]. Sustainable land requires balanced fluxes of carbon and nutrients that provide suitable habitats for agricultural and natural plant communities without adverse effects on the environment or over-exploitation of natural resources [1,11,13,14].
One of the European CZOs that is typical for the Mediterranean karstic environment with soils under imminent threat of desertification (e.g., soil carbon loss) due to climate change and the clearing of forests and natural vegetation for cropping and livestock grazing is the Koiliaris CZO (www.koiliaris-czo.tuc.gr) that represents human impacts over centuries [1,15]. Devegetation and inappropriate cultivation practices induce soil organic matter losses making soils susceptible to erosion and desertification with global consequences for food security, climate change, biodiversity, water quality, and agricultural economy. The key research areas investigated at Koiliaris CZO are presented in Table 1 and include the following: water resources management and sustainable management of soils, hydrologic modelling of complex terrains, high frequency environmental monitoring, soil degradation and soil formation, and stream and groundwater chemistry. Table 1 also presents the key research questions addressed at Koiliaris CZO as well as the research citations related to them. The site is part of the European LTER network and the LTER-Greece network and has been extensively studied over the past 15 years.
Research output from the Koiliaris CZO has been used to put together the scientific puzzle on how the Mediterranean geo-environment functions, as well as develop the tools for sustainable water and land management. A brief overview of the significant scientific contributions achieved in Koiliaris is presented in the Supplementary Materials.
This manuscript aims to provide further evidence to support the scientific hypotheses that underpin the hydrologic and geochemical processes and mechanisms functioning at the Koiliaris CZO. The overall objective of this paper is to examine geomorphological and hydrogeochemical monitoring data to provide evidence and test hypotheses on the hydrologic and geochemical response of Koiliaris CZO. In particular, we want to address the following aspects in our understanding of hydrologic and geochemical pathways of Koiliaris CZO:
  • Link geomorphologic and tectonic analysis for an improved delineation of the extended karst
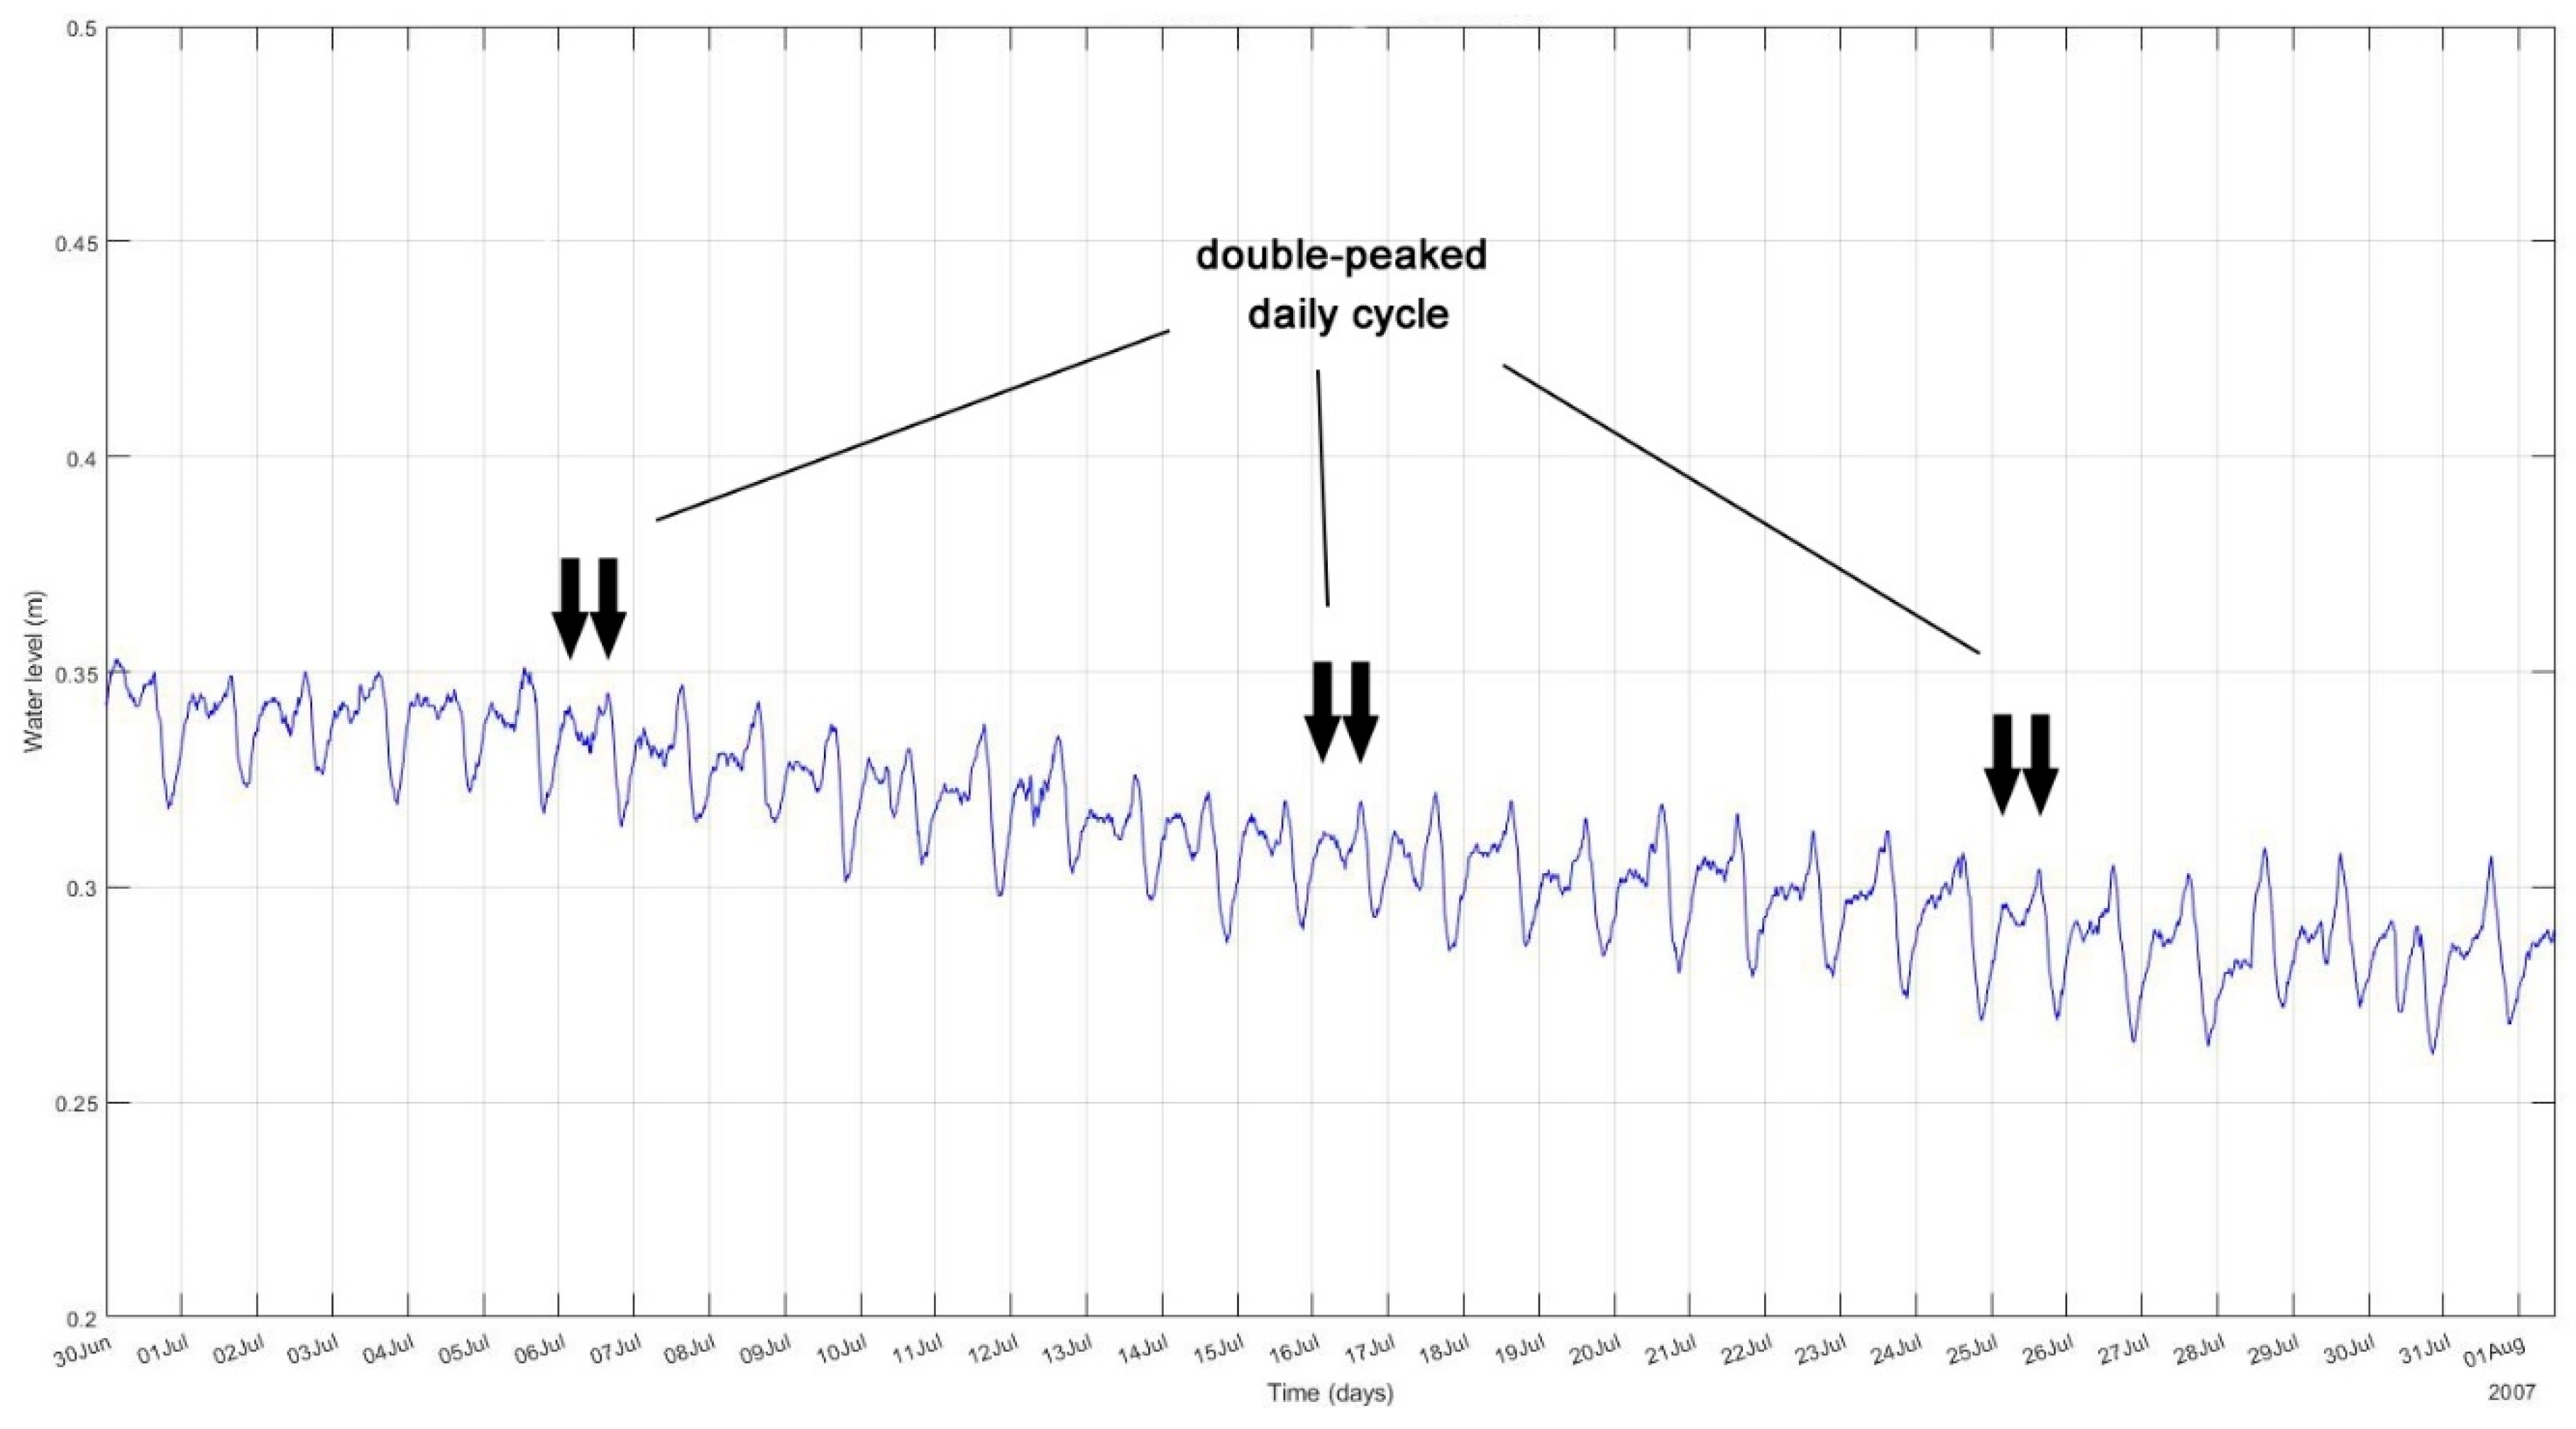
  • Identify factors affecting the diurnal fluctuation of spring flow and provide supporting evidence for the hydrologic and geochemical response of the karst
  • Gain better understanding of the hydrologic pathways and response of the karst during extreme events
  • Quantify geochemical and weathering fluxes and identify factors affecting geochemical weathering

2. Materials and Methods

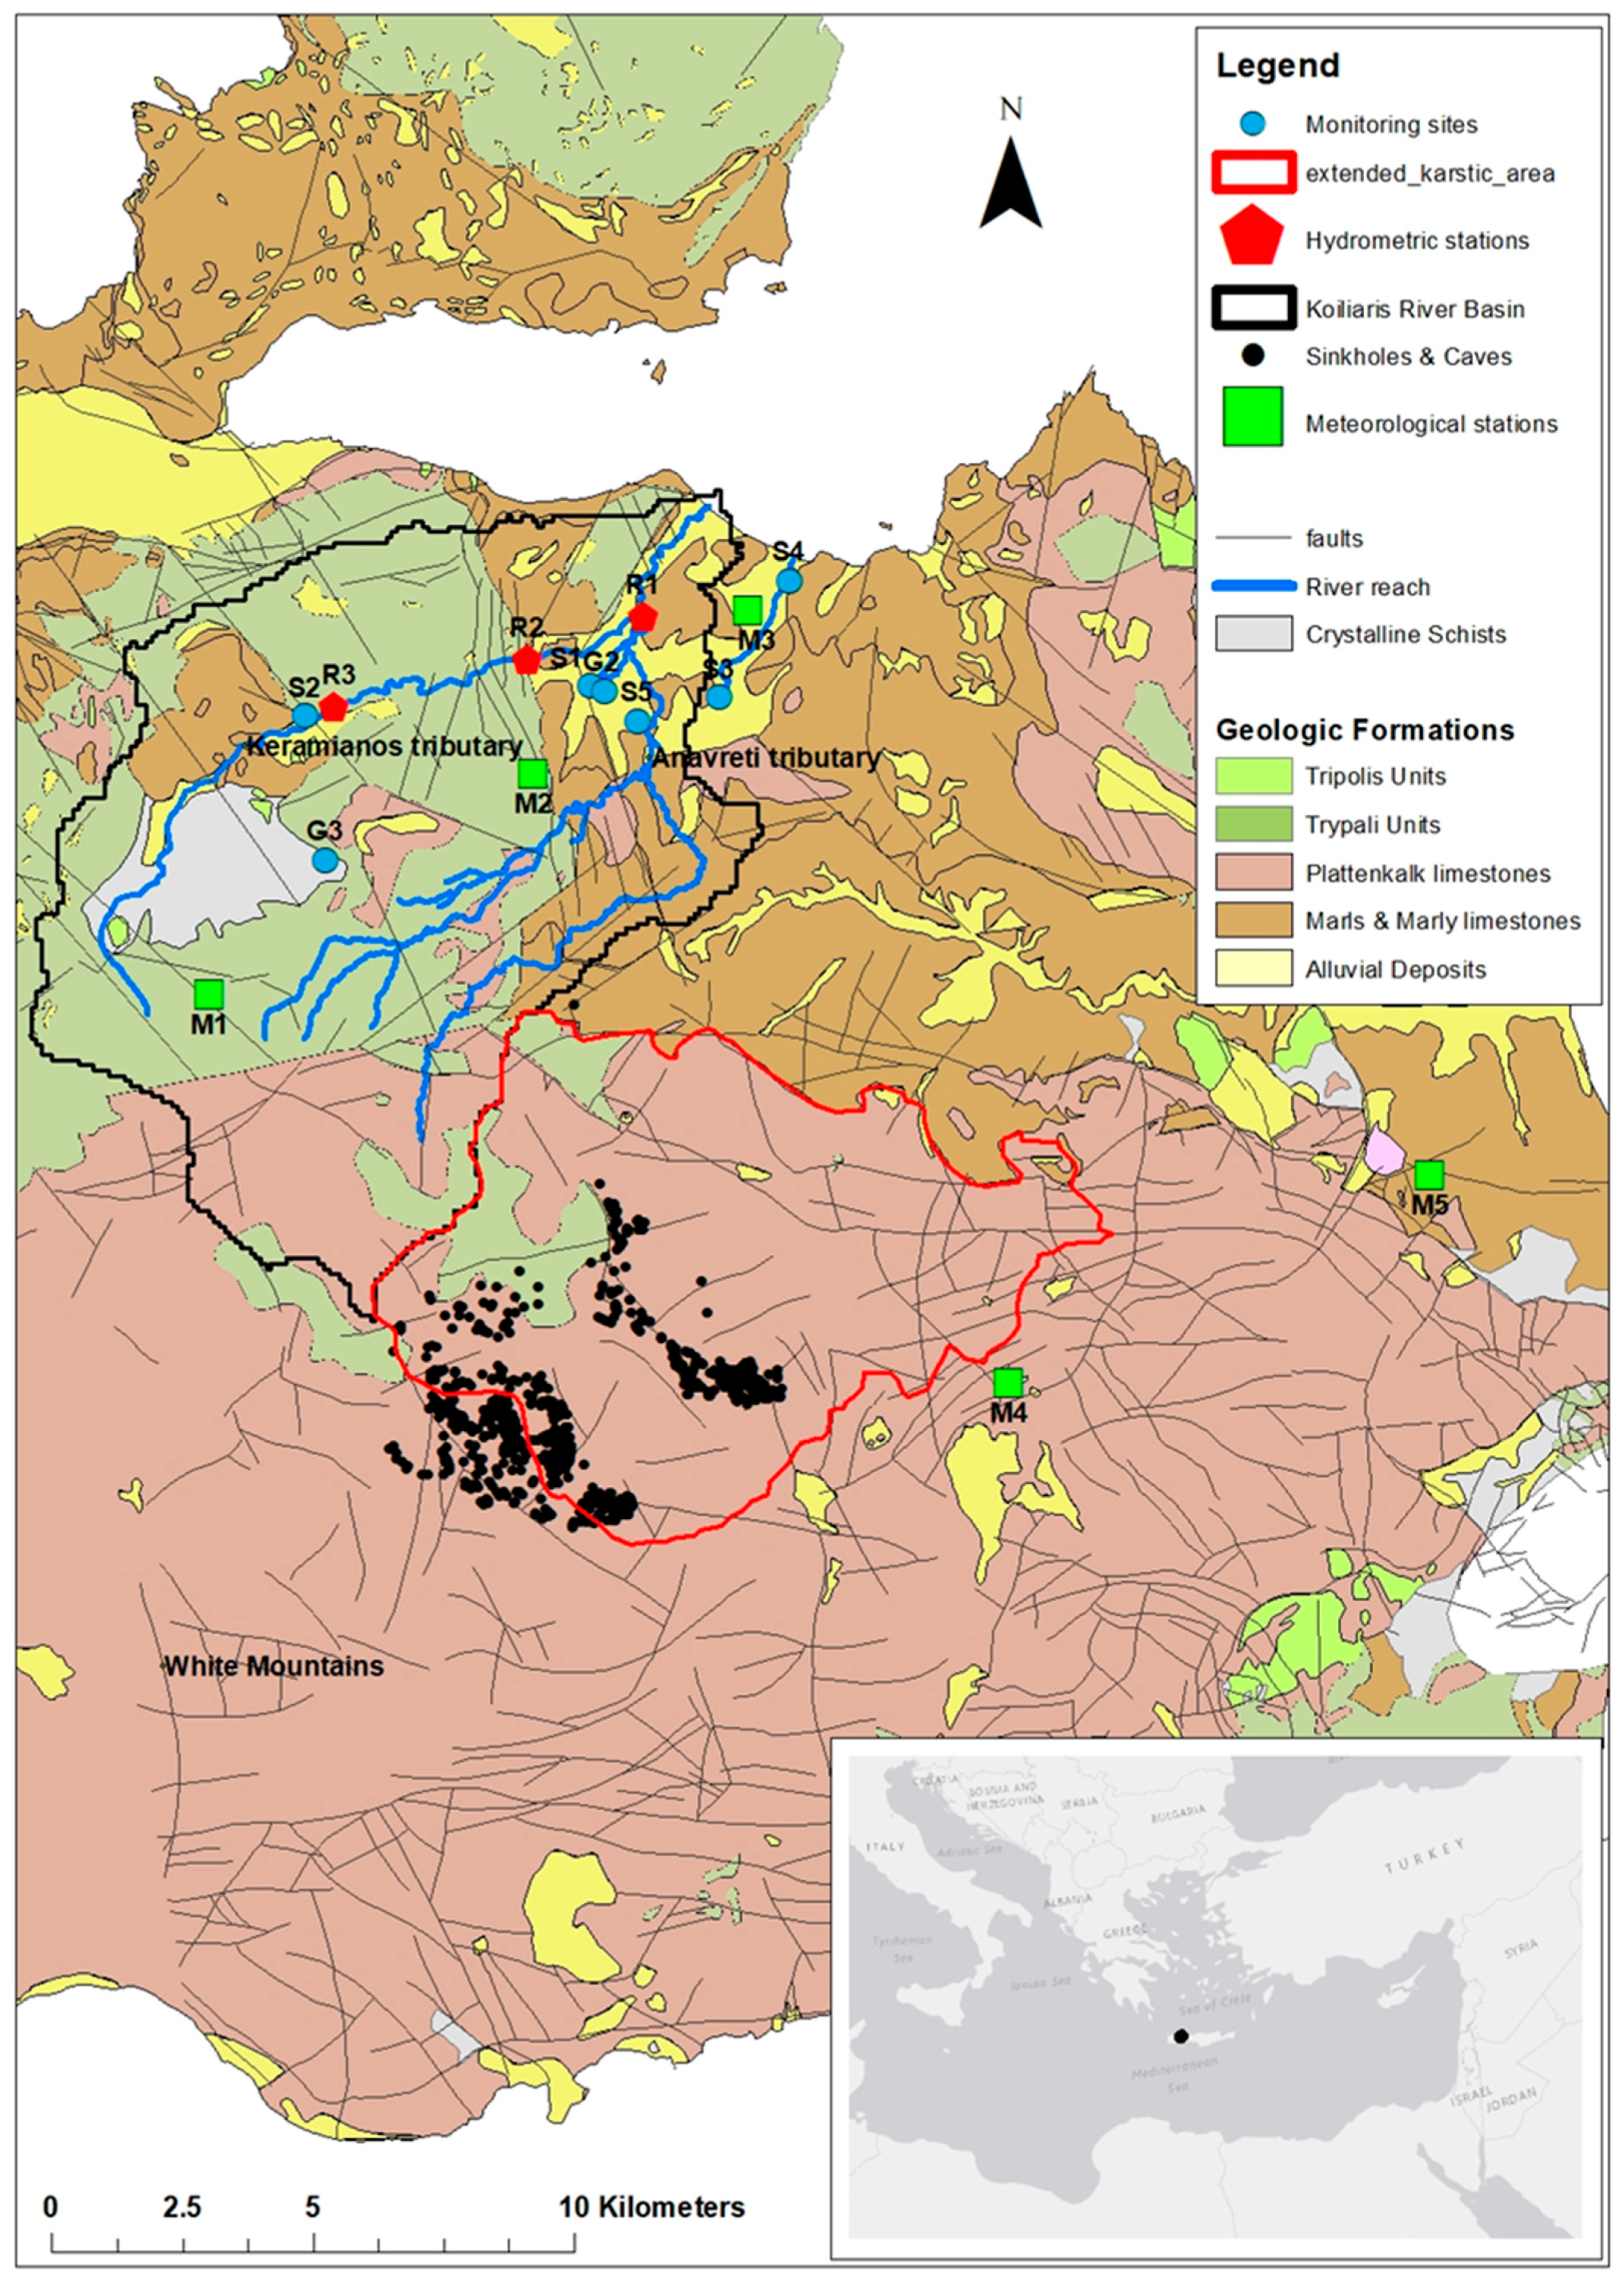
2.1. Site Description

The Koiliaris CZO is situated in the north-western part of Crete, near the city of Chania, Greece and extends within the latitude 35°27′48″ N & 35°20′2″ N and longitude 23°59′56″ E & 24°9′23″ E (Figure 1). The climate of the area is characterized as Mediterranean, semi-arid. The total area of the watershed is 132 km2 and the altitude ranges from 0 to 2120 m above mean sea level (amsl). Slope range from 43% at high altitude to 1–2% at lower altitude. The main land uses are intensively grazed shrubland and pasture (67.3%); olive, citrus groves, vines, and vegetables (32.1%); and mixed forest (0.6%). The length of the drainage network is 44.8 km, consisting of the intermittent tributary of Keramianos (13.8 km), two ephemeral streams providing surface runoff, located in the eastern part of the basin and feeding the Anavreti tributary (total length is 27.2 km), and, finally, the karstic springs of Stylos (permanent flow) (S1) and the karstic spring of Anavreti (intermittent flow) (S5), located just upstream of the Agios Georgios hydrometric station (R1), which merge with the rest of the streams to form the main segment of the Koiliaris River (Figure 1). These springs are fed by an extended area of karst which is located outside the basin boundaries and occupies an estimated area of 80 km2. The extended karstic area has been approximated following the geomorphologic characteristics and the faults formation and direction [15,16]. One of the aims of this work is to improve the delineation of the extended karst. The Keramianos tributary drains a small sub-catchment in the eastern part of the basin, enters a karstic gorge and joins the remaining of the river and springs network. The Keramianos tributary loses most of its water in the two faults that crosscut the gorge and generates flash floods when the precipitation in the sub-basin exceeds 120 mm [17].

2.2. Geological Setting

The geology of the Koiliaris CZO is composed of alpine nappes and post-alpine rocks. Specifically, the predominant geologic rock types are: limestones, dolomites, marbles, and recrystallized limestones with cherts of the Plattenkalk; Tripolis; and Trypali series; marls of Neogene deposits [49]; and schists (Arna unit). Quaternary alluvial deposits crop out in the northern part of the Koiliaris basin (Figure 1) [16].
The karstic system of the White Mountains (Figure 1) is composed of an autochthonous geotectonic unit, the Plattenkalk nappe and two allochthonous units, the Western Crete unit (Trypali limestones and phyllites) and the Arna unit (metamorphic schists-denoted as crystalline schists in Figure 1). the alpine nappes, the Plattenkalk nappe stratigraphy from the lower to the upper strata consists of (1) karstified un-bedded dolomites, (2) dolomitic marbles, (3) thin-bedded calcitic marbles with chert layers and nodules, and (4) metamarls and limeschists. The Trypali nappe consists of recrystallized brecciated un-bedded limestones thrusted over Plattenkalke nappe and it is highly karstified. In the western part of the basin, Western Crete Phyllites-Quartzites [49] cover the Trypali limestones. Alluvial sediments found near the river corridor and neogene deposits at the lower elevations of the basin comprise the post alpine rocks.
The major tectonic features in Crete comprised of primary structures (Late Oligocene-Early Miocene) of mega-folds with hinge of E-W trending and thrusting of nappes southward [49]. The primary structures are mainly the result of thrusting of “inner” nappes (Trypali, Western Crete Phyllites-Quartzites, etc. units) onto the autochthonous of Plattenkalk unit. Later tectonic contacts (Miocene) compose of extensional detachments (dipping at north and south with 10°–30°) and normal faults (Middle-Upper Miocene-present) of higher angle which possibly dissect the detachment thrust faults [49,50,51] (Supplementary Figure S1).

2.3. Data Collection

The White Mountains, located in the south of the watershed, provide the main supply of water for the basin. Meteorological data are acquired by two meteorological stations within the basin, installed and managed by the Laboratory of Hydrogeochemical Engineering and Remediation of Soil (H.E.R.S. Lab) of the Technical University of Crete, at Samonas (380 m amsl) (M2) and Psichro Pigadi (948 m amsl) (M1) (Figure 1) (Rain gauge, Tipping Bucket Rain Gauge, DeltaOHM (GHM Group), Selvazzano Dentro, Italy). These stations have been recording precipitation and temperature data every 10 min since 2004. Also, daily precipitation data are available from three rain gauge stations managed by the Region of Crete since 1973 (Askifou at 740 m amsl (M4), Kalives at 24 m amsl (M3), and Mouri at 86 m amsl (M5)) (Figure 1) (VANTAGE PRO2, Davis Instruments, Hayward, CA, USA). The hydrologic monitoring of Koiliaris CZO has also been carried out since 2004, with the installation of the hydrometric station at Agios Georgios (R1), strategically located downstream of the confluence of Keramianos tributary with the main, permanent river that drains the Stylos (S1) and Anavreti (S5) springs, recording water level data every 10 min (Water level & Temperature logger, Level TROLL 500 Data Logger, In-Situ Inc., Fort Collins, CO, USA). H.E.R.S. Lab has also installed two hydrometric stations (Figure 1) along the Keramianos tributary, one at the gorge entrance and one at the gorge exit, monitoring water level data every 10 min since 2013 (Water level & Temperature logger, HOBO Water Level, Onset Computer Corporation, Bourne, MA, USA). Three rating curves of water level vs. flow have been developed for the three hydrometric stations by acquiring simultaneous measurements of flow and stage, thus allowing for the estimation of flow every 10 min for all three monitoring locations. Finally, monthly records of the Stylos springs discharge have been recorded for the 1973–2004 period by the Region of Crete.
There are 9 sampling locations within the basin where monthly water sampling of surface and groundwater is taking place. The sites are: Agios Georgios stream (R1) located at the junction of Stylos karst springs and Keramianos, Katochori spring (S2) located near the entrance of Keramianos gorge and Katochori temporary river (R2), Stylos spring (S1) located at the center of Stylos village, Dug well (G2) located at Stylos village, Anavreti spring (S5) located near Nio Chorio village, Zourpos spring (S4) located at Kalives village, Armenoi spring (S3) located at Armenoi village and finally, Kampoi well (G3) located near Kampoi village (Figure 1). Field and laboratory measurements are conducted once a month. The field studies include the measurement of pH, electrical conductivity, water temperature and dissolved oxygen.
The laboratory measurements include the measurement of metals (Na, Mg, Al, Si, K, Ca, Fe, V, Cr, Hg, Mn, Pb, Ni, Cu, Zn, As, Se, Cd) and nutrients (N-NO3, N-NH3, P-PO4, total carbon (TC), inorganic carbon (IC), total organic carbon (TOC), total nitrogen (TN), dissolved organic nitrogen (DON), SO4, Cl, CO3, HCO3). All metals are analyzed by inductively coupled plasma mass spectrometry (ICP-MS, Agilent 7500-CX, Agilent Technologies, Santa Clara, CA 95051, USA). All forms of carbon and total nitrogen are analyzed with a multi N/C 2100S Reactor (N/C elemental analyzer, Analytik Jena, Jena, Germany). Nutrients are quantified by the use of UV-VIS spectroscopy including a HACH 2800DR spectrophotometer (Methods: LCK311, LCK153, LCK339, 8051, 8038 developed by HACH LANGE, Düsseldorf, Germany).

2.4. Methods Used

2.4.1. Geologic and Geomorphologic Analysis

A geomorphological and geological analysis was conducted to better define the area of the extended karst and understand how structural elements influence the regional hydrology. The southern boundary of the extended karst was located using the south-north divide of the White Mountains [16]. However, recently obtained cave and sinkhole locations [52] by various speleological expeditions necessitated the reexamination of the delineation the extended karst. The Digital Elevation Model (Shuttle Radar Topography Mission, SRTM, data with a pixel size 90 × 90) was used to generate hillshade (Supplementary Figure S1) and aspect maps [53]. The geological maps of the area were used for the digitization of the sedimentary rock dipping direction and the construction of the geological cross sections [54,55,56]. Geologic cross sections were created in order to identify major morphological and tectonic elements such as anticlines and mega folds and combine them with normal faulting in order to reassess the extended karst of Koiliaris CZO.

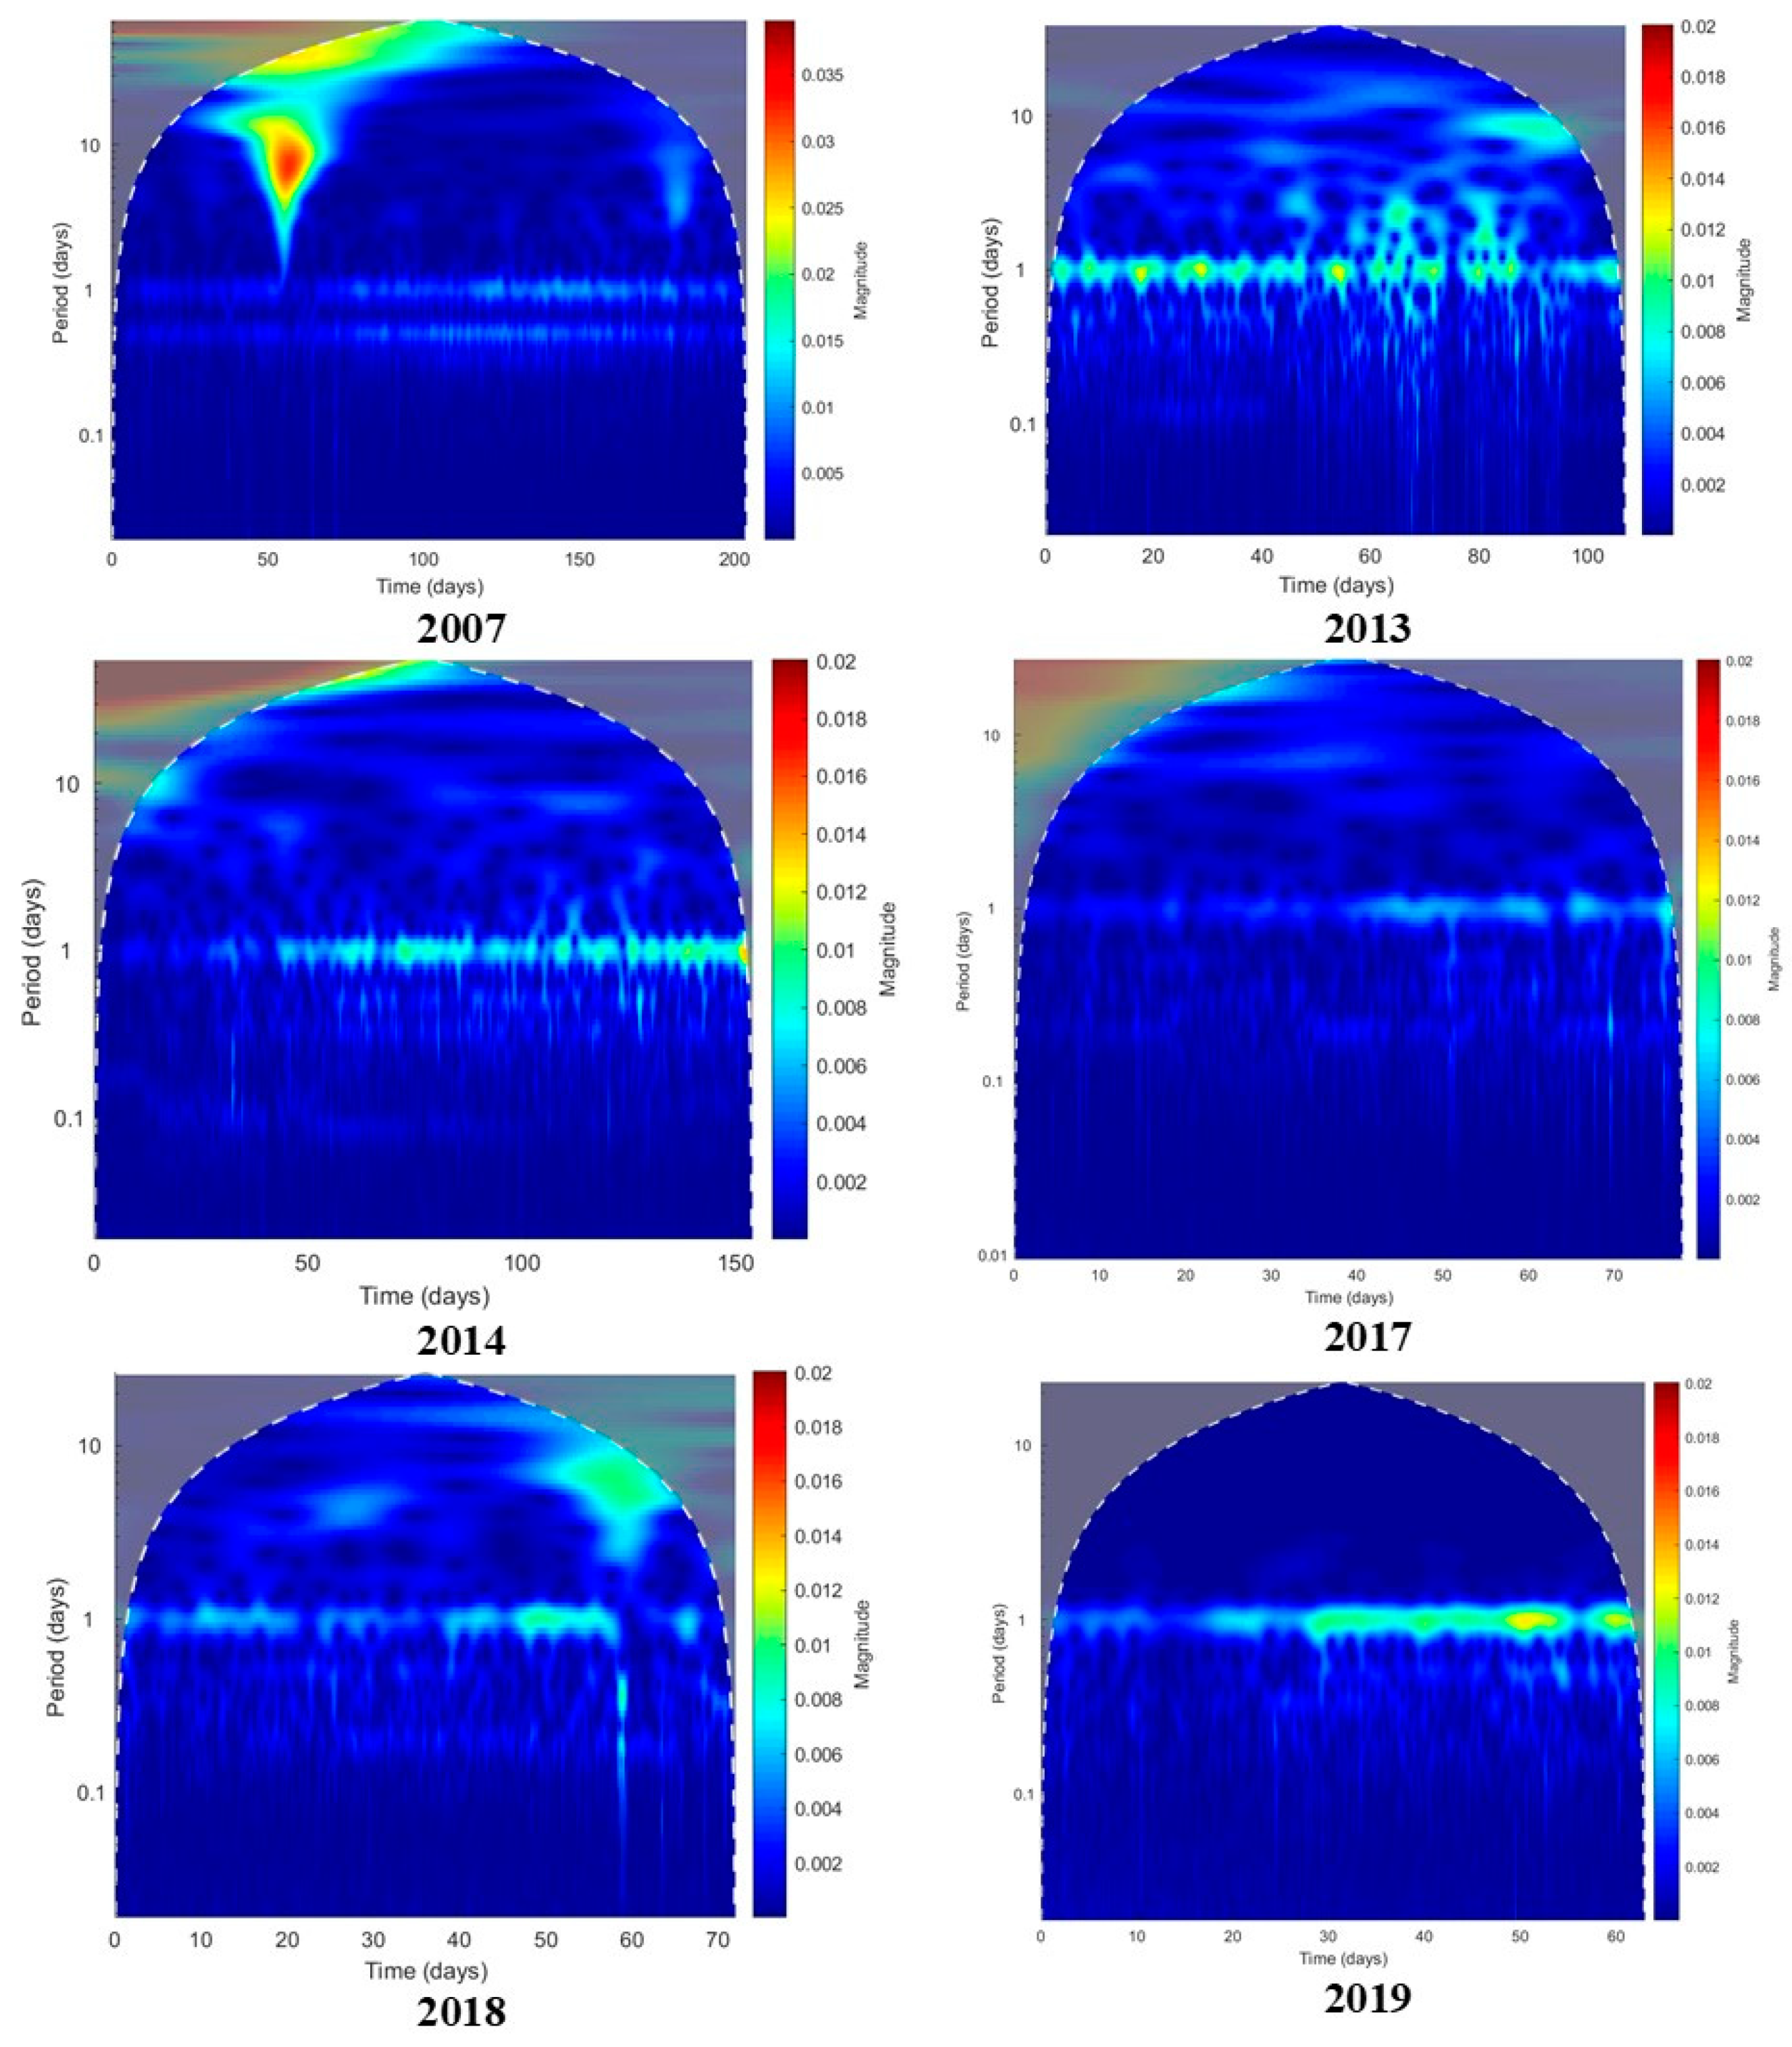
2.4.2. Water Level Frequency Analysis

Since the beginning of the study at Koiliaris CZO, the diurnal fluctuation of flow was observed using the high frequency flow measurements at the Agios Georgios gauging station (R1). Figure 2 illustrates this sub-daily variation of water level that consists of a persistent double-peaked daily cycle, especially distinguishable during low flow periods when only the Stylos springs feed the river. The amplitude of this periodic signal (2–4 cm) is orders of magnitude lower than typical flood events (50–250 cm, Supplementary Figure S3) triggered by rain events and it an order of magnitude lower than the overall long-term variability (average stage 2007–2017 is 60 cm) observed in streamflow. Moraetis and co-workers [15] has shown that this fluctuation in the river flow represents processes occurring in the karst. In addition, they used stage and pressure measurement within the karst to postulate that the “transfer” of the atmospheric barometric pressure through the sinkholes within the karst is a potential reason for the diurnal fluctuation and causes the karst to act as a “bladder pump”. This could be one reason to support the hypothesis that the water in the karstic aquifer is well-mixed.
Diurnal fluctuations of river flow have been observed in many locations worldwide and several mechanisms may explain them [57]; (a) the diel fluctuation in mobilized water caused by freezing and thawing in cold regions; (b) “early afternoon rainfall” events that are frequently observed under tropical climates; (c) temperature-controlled variations in streambed hydraulic conductivity; (d) the diel evapotranspiration and snow melt signals which causes oscillations in groundwater table; (e) anthropogenic water abstraction for drinking and irrigation demand; (f) fluctuations due to tidal processes.
In the case of the Koiliaris CZO, it is clear that the two first phenomena cannot explain the diurnal signal due to the Mediterranean climate of Crete. In addition, water temperature within the karstic aquifer is fairly constant around 13 °C and there are no transmission losses in the riverbed from the springs to the sea. Therefore, we do not expect any losses or large flow fluctuations due to evaporation which in any case would not produce a double-peaked signal in the flow. The effect of water abstractions can also be excluded since the pattern persists throughout the year.
The only plausible explanation left is that of tidal effects which in fact, form a whole family of processes caused by the gravitational pull of the Moon and the Sun [58]. The cyclic interaction between these celestial bodies and the rotating Earth result in the periodic motion of oceans, as well as the atmosphere and the crust. These motions, in turn, produce mechanical perturbations at the Earth’s surface that may affect continental water bodies in various ways and at different timescales, from a few hours up to several months [58,59,60]. For instance, tidal loading effects on groundwater reservoirs have been recognized and studied in the early developments of modern hydrogeology [61,62,63], and even have been used to characterize reservoir physical properties like permeability and storage [64,65,66]. Indeed, in confined aquifers, the dynamic stressing caused mainly by body tides (also named Earth tides) induce rock deformation, and due to the poroelastic coupling between the porous material and water, tidal signals are frequently observed in groundwater levels. Among the very many tidal constituents that may be measured in geophysical signals [67], the most significant in hydrology are the sinusoidal forcing with periods around 24 and 12 h, corresponding to the diurnal and semi-diurnal main astronomical phenomena.
Tidal effects in streamflow are most often encountered in coastal areas where ocean tides bring about a significant oscillation of the base level at a basin’s outlet. These so-called “tidal rivers” undergo double-peaked daily tidal fluctuations with amplitudes ranging from a few centimeters to more than 10 m [68]. As the Agios Georgios gauging station is located at an elevation of 15 amsl and given that the maximum tidal range in Crete is less than 0.1 m, the sea tides cannot directly influence streamflow in Koiliaris. Consequently, the remaining possible mechanism is the stressing of the karst’s porous matrix by Earth tides and/or ocean tidal loading that creates an oscillating hydraulic gradient and thus an oscillating spring flow. Such a mechanism to explain double-peaked daily fluctuations in stream hydrographs has very rarely been documented, as argued by Briciu [69]. In fact, Briciu [69] reported many occurrences of diurnal and especially semi-diurnal components in river flow data across the globe, and noticed that watersheds formed by limestones and dolomites were particularly prone to this effect. As the dominant Plattenkalk formation in Koiliaris is mainly composed by these rocks, it strengthens the hypothesis of a body tide dominated process.
To test and verify this hypothesis, a frequency and tidal analysis was performed using the stage measurements at Koiliaris CZO. The data were collected by using vented pressure transducers which give a direct value of the water level with the atmospheric pressure removed. Selected periods of the streamflow hydrograph at the Agios Georgios station are first analyzed using Continuous Wavelet transform (CWT). Prior to the CWT analysis, the data trend was estimated and removed by applying a 144-term (no of measurements per day) centered moving average. For CWT, the classic Morlet mother wavelet is used with 16 voices per octave. The tidal analysis is performed with the T_TIDE Matlab code of Pawlowicz et al. [70], keeping constituents that have a sufficiently large signal to noise ratio (SNR > 2). T_TIDE performs harmonic analysis and identifies tidal signals having at least 95% CL by using nonlinear bootstrapped error estimates (fitting a sum of sines and cosines with known frequencies to the data, using a multi-linear least-square regression). The coefficients that minimize the misfit are the amplitudes and phases for all selected tidal constituents [70]. The analysis was done for each period and also for both ER & LR sub periods with the original water level data.

2.4.3. Hydrologic Analysis

The objective of the hydrologic analysis was to confirm the hydrologic budget and hydrologic pathways using the new delineation of the extended karst and gain better understanding of the hydrologic pathways and response of the karst during extreme events. The Karst-SWAT version of the soil and water assessment tool (SWAT) was used to simulate the hydrologic and geochemical response of the basin. It was chosen because of its ability to capture the water cycle of multiple catchments of different climates, according to numerous studies and, particularly, its good performance in the Mediterranean region [16,32,39,71,72]. The SWAT model is a deterministic and continuous time basin scale model which simulates the hydrology, sediment yield and water quality of ungauged watersheds [73] and estimates the impact of agricultural management practices on agricultural yields. The main model inputs consist of a digital elevation model (DEM), a land use map, a soil map and daily meteorological data of precipitation and temperature. The watershed is first subdivided into sub-catchments and each sub-catchment into hydrologic response units (HRUs), which are a unique combination of soil type, land use and land slope. The model output provides, among others, the surface runoff for each HRU, but also the deep aquifer recharge, which is useful for the modeling of the karstic springs, and is another reason for the SWAT model selection.
Moraetis et al. [15] concluded that the karstic system of the area consists of two underground reservoirs: the upper reservoir with a faster response and the lower reservoir with a slower response. Based on this information, Nikolaidis et al. [16] augmented the SWAT model by adding a karstic component to account for the karstic springs flow. The SWAT model was calibrated in a way that allows fast infiltration of water that falls on the “karstic” HRUs into the deep groundwater. The model uses the deep groundwater flow from SWAT as input into a two-reservoir model and analytically solves hydrologic mass balance equations on a daily step. The model output is the daily total flow of the karstic springs (Stylos and Anavreti).
This coupled model allows for the determination of every hydrologic parameter for each HRU, and also enables the estimation of the hydrologic pathways during average and extreme conditions. An additional analysis was conducted to assess the flow of Anavreti and Stylos separately. Based on observations, the intermittent Anvreti spring discharges only if the groundwater stage exceeds a certain level, therefore this spring usually only runs during the months of December, January, February, and March and rarely during April. To define the point for the Anavreti spring to flow, the observed monthly flows of the Stylos springs for the 1973–2004 period were correlated to the total modeled springs flow (simulation of Stylos and Anavreti) for the above-mentioned months. The correlation was satisfactory (r2 = 0.56, QStylos = 0.48 × Qspr) and provided an estimation of the Stylos springs discharge, based on the modeled karstic flow, as well as an estimation of the Anavreti spring discharge [ Q Anavreti = ( 1 0.48 ) × Q springs ].

2.4.4. Geochemical Analysis

The objective of the geochemical analysis was to assess the geochemical time series of 9 surface and groundwater stations and determine the geochemical fluxes and weathering rates as well as the processes affecting the geochemistry. To achieve this objective, a principal components analysis (PCA) was conducted using the time series of the physico-chemical parameters in order to categorize and cluster the sampling sites as well as determine the parameters that differentiate their clustering. The carbonate weathering rates were calculated in Keramianos ephemeral river and in the springs of Stylos and Armenoi of Koiliaris CZO. Carbonate weathering rates (Fcarb) were calculated by multiplying the concentration of carbonate-derived chemicals (Ca, Mg, and half of HCO3) with the water runoff value as follows [74]:
F Carb = ( [ Ca 2 + ] × M CaCO 3 + [ Mg 2 + ] × [ M MgCO 3 ] ) × Runoff
where Fcarb is expressed in tn/km2/year or tn/km2/month, and MCaCO3 and MMgCO3 refer to the molar mass of CaCO3 andMgCO3 and are expressed in g/mol.
The carbonate weathering rates were related with runoff, since runoff exerts a strong control on carbonate weathering rates [75] and were compared with the rates obtained from various catchments in Jura Mountains in the Alps.

3. Results & Discussion

3.1. Geomorphology and Delineation of the Extended Karst

The composite geomorphologic map in (Supplementary Figure S1) presents critical geomorphologic and structural elements of the extended karst of Koiliaris River. It presents the aspect map (overlain by hillshade with 60% transparency) along with structural (north and south dipping direction arrows) and lithology data (extent of Mesozoic Limestones blue dashed line). In addition, the location of caves and sinkholes (black dots in Figure 1 and yellow dots in Figure S1) are depicted.
The stratigraphic column of White Mountains is composed of gray-black dolomites, recrystallized limestones, limestones with silex and limeschists (Plattenkalk Unit). The area includes significant meso- to mega-scale folds [76,77].
Several publications [49,50,78,79] demonstrate the morphologic and tectonic conditions of Crete which are summarized in four phases:
  • Eocene to Early Oligocene east to west compression created the anticlines striking NNE-SSW
  • Late Oligocene north-south compression created the anticline striking E-W
  • Early to Middle Miocene crustal extension created extensive detachment faults and Middle to Upper Miocene grabens filled with shallow marine sediments
  • Upper Miocene-Quaternary created normal faulting with three sets of striking directions faults E-W (or ENE-WSW), NE-SW and NW-SE.
Manutsoglu and co-workers [80] identified a mega-anticline underlining the Samaria Gorge (shown in Supplementary Figure S1 with number 1) which was created during the Eocene to early Oligocene east-west compression. In this study, we identified two other mega-anticlines that regulate the hydrogeology in the northern part of White Mountains. Anticline number 2 is situated in the boundary between north and south aspect of White Mountain flanks with a strike direction NE-SW. The hinge of this anticline can be considered as the divide of White Mountains between north and south aspects flanks. Point 2B (Supplementary Figures S1 and S2b) shows the estimated position of the flank aspect change. We postulate that this anticline was created during the Late Oligocene north-south compression. Along this anticline, 739 caves and sinkholes are situated in the gray-black dolomite (Supplementary Figures S1 and S2b and black dots in Figure 1). The caves are mainly spread in elevation between 1700 and 2200 m where the outcrop of gray-black dolomites is located (Supplementary Figure S1). The presence of the extensive system of karstic caves is related possibly to the high deformation around the hinge of the mega-fold (point 2B). The second mega-fold anticline 3 is placed in point 1A and it is shown in profile A (Supplementary Figures S1 and S2b). The hinge is parallel to Samaria gorge anticline, NNE-SSW. The area “Kaka kastelia” is situated near point 1A and has a high number of karstic caves within the gray-black dolomites similarly to point 2B (Supplementary Figures S1 and S2a). Thus, both points 2B and 1A are areas where the three lithological and geomorphological conditions are met: the older Plattenkalk autochthonous gray-black dolomites are exposed (anticlines), most of the karstic caves are situated and a change in the aspect is observed.
Anticlines 2 and 3 identify the southern and eastern boundaries of the extended karst. In this respect, the delineation of the extended karst southern boundary is redrawn to include the karstic cave system along the anticlines 2 and 3. Supplementary Figure S1 confirms that the mega-structures are consistent with the overall dipping of the autochthonous sedimentary beds (Plattenkalk). It is clear, especially for anticline 2 that the south dipping beds (red arrows in Supplementary Figure S1) are situated southern than anticline 2 with the overall aspect to be directed south (greenish area in Supplementary Figure S1).
The northern boundary of the delineated extended karst is the Middle to Upper Miocene deposits. The Neogene grabens in Crete have been created during successive extensional tectonics during Middle Miocene with subsequent deposition of Middle to Upper Miocene marly limestones and marls [49,50]. The Middle and Upper Miocene sedimentary layers acted as seals in the flanks of the Mesozoic limestones. The Middle to Upper Miocene sedimentary layers are situated on the hanging wall of the detachment faults and they are juxtaposed against Mesozoic limestones mostly by younger normal faults or reactivated detachment zones (Supplementary Figure S2b,c).
Therefore, the extended karst area of Koiliaris River is redrawn based on this analysis and it is presented in Figure 1 and Supplementary Figure S1. The karst area was extended in the southern border by including the caves and sinkholes along the anticline 2 and reduced in the northern border by eliminating the Neogene grabens. The total area of the extended karst remains the same (80 km2) as was estimated from hydrologic modeling [16,17].

3.2. Flow Frequency Analysis

Table 2 presents the selected periods for the tidal analysis using the stage data of Koiliaris River from Station R1. Supplementary Figure S3 presents Agios Georgios station tidal analysis for the studied periods 2018–2019. The time periods were chosen where the main source of river flow was Stylos springs and not rainfall events, associated flash floods and the Anavreti spring. In this way, the presence of multiple spikes in the sample data, which may partly hide the tidal signals was avoided. Consequently, six time periods in 2007, 2013, 2014, 2017, 2018, and 2019 were selected. Each dataset was subsequently separated into two key time frames that where identified in the hydrologic analysis: the first corresponds to the early recession controlled by both lower and upper karstic reservoirs (period ER for “early recession”) and the second corresponds to the late recession where the flow contribution originates exclusively from the lower reservoir (period LR for “late recession”).
The presence of persistent diurnal (~24 h) and semi-diurnal (~12 h) oscillations in the water level was confirmed by using the continuous wavelet transform CWT (Figure 3). The CWT analysis clearly shows the existence of the two key time frames identified from the hydrologic analysis. This is seen from the variation in the amplitude of the oscillating signals (especially the diurnals). This amplitude change coincides with the shift from the ER to the LR time frame and is present in all datasets, with the exception of 2013 which doesn’t include the ER period. The duration of each period within the dataset is reported in Table 2. The duration of the ER period ranges between 0 and 79 days and the LR period between 25 and 125 days.
An example of the tidal constituents for the ER and LR period of the 2019 and 2018 data is presented in Figure 4 and Supplementary Figure S4, respectively.
The harmonic analysis on all datasets confirms the presence of persistent diurnal (~24 h—P1 and K1) and semi-diurnal (~12 h—S2, EPS2 and L2) components in the streamflow (Table 3). Table 3 presents the tidal analysis for period 2019 as an illustration. The analysis also revealed several harmonics of the main tidal components, at periods of about eight (MO3 and SK3), six (SN4, MS4, and S4), and four (2SK5, 3MK7 and M8) hours. These are typical secondary constituents in signals affected by tidal perturbations. The amplitude of the diurnal components ranged from 2.9 mm to 8.7 mm and the semi-diurnal from 0.6 to 1.7 mm. The secondary harmonics amplitude ranged from 0.2 to 0.7 mm. The tidal analysis was also performed separately for the ER and LR periods and the results are presented in Supplementary Tables S1 and S2 for 2019 and 2018 periods. The analysis verified the increase in amplitude for most of the tidal signals during LR period which was visible in the CWT analysis. The amplitude of the diurnal tidal components (K1, P1) are highest, closely followed by the semi-diurnal component S2, consistent for both ER and LR. The amplitude of other harmonics also decreases with period. Another interesting finding is that the amplitude ratio of the two major diurnal constituents K1 and P1 (K1amp/P1amp) is ~0.33 in all datasets and in both ER and LR time frames. Lastly, most of the tidal signals in LR have a leading phase compared to those in ER.
From these remarks along with the accumulated knowledge on the hydrologic functioning of the Koiliaris CZO, we postulate three important implications: (a) The periodic signal is definitely related to Earth tide stressing of the karstic reservoirs, as it affects similarly the lower and upper karst. (b) The upper and lower karst have different storage properties, which reflects into the differences in tidal signal amplitudes from ER to LR. The hydromechanical effect of tidal stressing produces a significantly higher discharge oscillation during ER, which indicates that the upper reservoir is more compliant (in a mechanical sense) and therefore more capacitive [81]. This observation is based on the diurnal fluctuation of discharge. A small change in the stage during the ER period creates a large change in the discharge of the river because of the non-linear effect of the rating curve. In theory, this prevails for the porous or fissured karstic matrix that is connected to main conduits and ultimately to the springs. (c) The presence of multiple harmonics of the diurnal and semi-diurnal body tides is intriguing, especially for the fact that the 8-h signal is more prominent than it would be expected from Earth tide loading only. It is possible that even a small ocean loading (ocean mass bending the crust by its weight, not to be mixed with tidal effects in estuaries) may stress the karst on top of the preponderant body loading. Indeed, ocean tides typically present overtones, also called “overtides” [82]. Another possible mechanism is the presence of nonlinearities in the hydromechanical coupling. Agnew [82] showed that if a nonlinear relationship including energy dissipation would characterize the stress-strain relationship in a rock, then an anomalous tidal line should appear at 3 times the main frequency. In our case, this coincides with the prominent eight-hour harmonic, which is even more pronounced during LR. This tells us that body tides might cause very large strains on the rock mass (probably more than 10 nstrain, [82]) at Koiliaris, creating hysterical loops in stress-strain relationships and making the overall mechanical behavior depart from the classical linear poroelasticity framework [81].
Summarizing, the tidal analysis confirmed the partitioning of the karst into two reservoirs that have different hydromechanical properties and behavior, which is in agreement with previous studies [15]. The analysis also underlined the fact that both reservoirs have a well-developed secondary porosity able to feed major fault or karstic conduits and act as a quickly accessible storage volume. Finally, the tidal loading by creating an oscillating hydraulic gradient and an oscillating spring flow on a sub daily basis contributes significantly to the energy and mixing of the water in the karst supporting the modeling hypothesis of well mixed groundwater reservoirs.

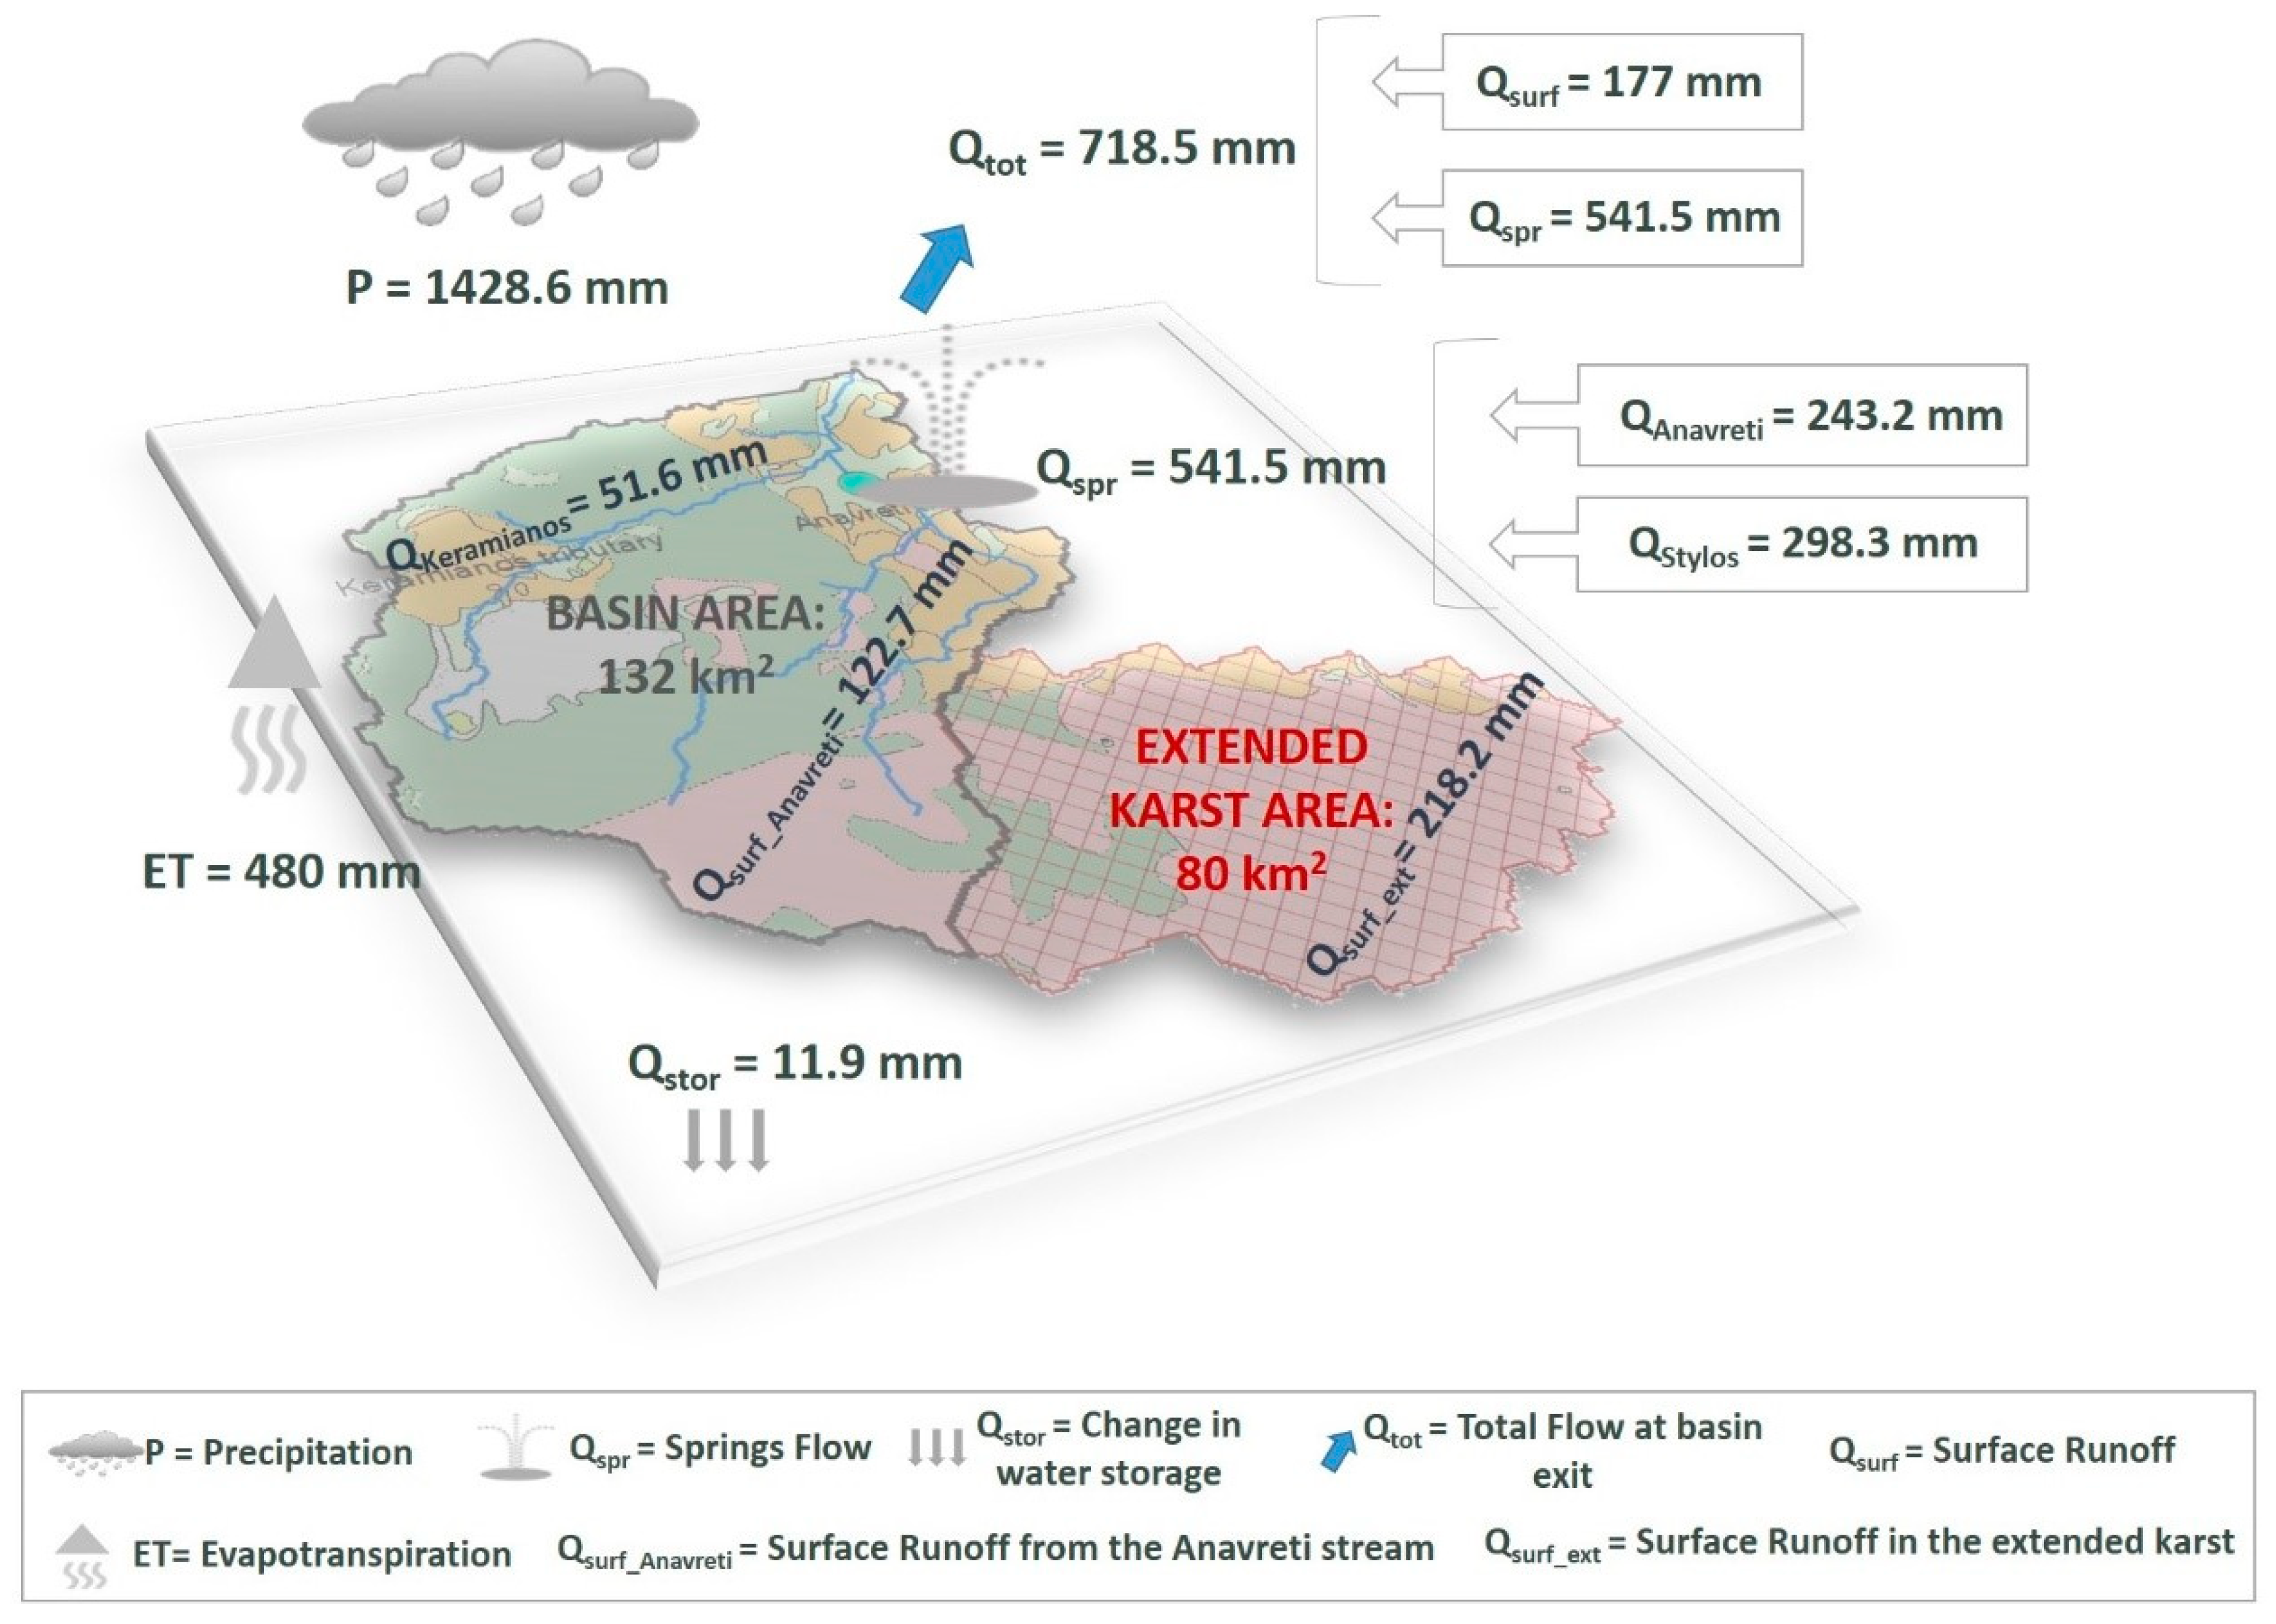
3.3. Hydrologic Processes

Fifteen years of hydro-meteorological data (2004–2019) were used to simulate the hydrology of Koiliaris CZO using the Karst-SWAT model. The goodness of fit of the Karst-SWAT model calibration is presented in Supplementary Figure S5. The statistical indices Nash–Sutcliffe efficiency (NSE), percent bias (PBIAS) and RMSE-observations standard deviation ratio (RSR), proposed by Moriasi et al. [83] were satisfactory on a daily time step (NSE equal to 0.67, PBIAS equal to 0.2% and RSR equal to 0.57) and the coefficient of determination between daily observed and modeled flows was 0.86 and the slope 1.07. Figure 5 depicts the mean annual hydrologic budget of the basin, including the extended karstic region. Based on the hydrologic simulation, the precipitation in the area (1428.6 mm) is partially evapotranspirated (480 mm, 33.6% of rainfall) and partially becomes surface runoff (177 mm, 12.4% of rainfall). The surface runoff is further subdivided into runoff from the Keramianos tributary (51.6 mm) and runoff from the surface streams of Anavreti (122.7 mm). Small amounts of water are added along the stream’s way until the exit (2.7 mm). The flow of all springs is estimated at 541.5 mm (37.9% of rainfall). A substantial percentage of rainfall (15.3%) becomes surface runoff in the extended karst area (218.2 mm).
In terms of mean annual flow, the contribution of the Anavreti flow is 44.9% to the total spring flow (55.1% for the Stylos springs) and 33.9% to the total flow of the basin (41.5% for the Stylos springs). The mean annual contribution of Keramianos to the total flow of the basin is 7.2% and for the case of the surface streams at Anavreti, their contribution is 16.9%. The contribution of the hydrologic pathways during a dry and a wet year changes are presented in Supplementary Table S3. More specifically, the stream of Keramianos is more sensitive to the meteorological conditions of the year of interest and its contribution to total flow varies from 5.2% (dry year) to 10.6% (wet year). The intermittent stream of Keramianos drains a sub-basin of 33.1 km2 (25.1% of the main Koiliaris CZO) before entering a karstic gorge. The Keramianos stream exits the gorge only when daily precipitation at the meteorological station M1 (Figure 1) exceeds 120 mm [17]. Therefore, on an annual basis, about 57% of the Keramianos water amount is lost in the karstic gorge. Therefore, during wet years, the contribution of Keramianos to the total flow of the basin almost doubles.
These hydrologic pathways are of great interest during extreme events, as was the case of the recent flood of February 25th 2019 (Supplementary Figure S6). Supplementary Table S4 presents the modeled flows for every stream and spring in the basin during the peak daily flow of the extreme event. As it is obvious from the Supplementary Table S4, the floods are mainly caused by the surface runoff, and the surface streams of Anavreti and Keramianos have the highest contribution to total flow (37.2% and 26.5% respectively), followed by the spring of Anavreti, which has a slightly bigger contribution than the Stylos springs (19.0% and 17.3%).
The hydrologic budget during the extreme hydrologic event is calculated during a time span of 5 days precipitation commenced on 24 February, it produced the highest daily rainfall amount on the 25th and the following three days were also included so that surface and spring flow could manifest to a satisfactory degree. The total precipitation was 400 mm during these five days. The surface runoff was estimated at 97.9 mm and the surface runoff of the extended karst area at 179.6 mm. More than 5 million m3 of water were exported from the Koiliaris watershed in one day generating a significant flood in the area [42]. This means that 70% of the rainfall becomes surface runoff. 10% of rainfall becomes spring flow during these five days (38.4 mm), increasing the flood magnitude. Finally, only 2.8 mm are evapotranspirated during the five days of the extreme event (0.7%), in comparison to 33.6% (evapotranspiration to rainfall) on a mean annual level.
The hydrologic analysis provided insights on the hydrologic behavior of the karst during flood events and confirmed that, when the infiltration rate into the groundwater is exceeded by precipitation, the potential for significant and catastrophic floods is certain.

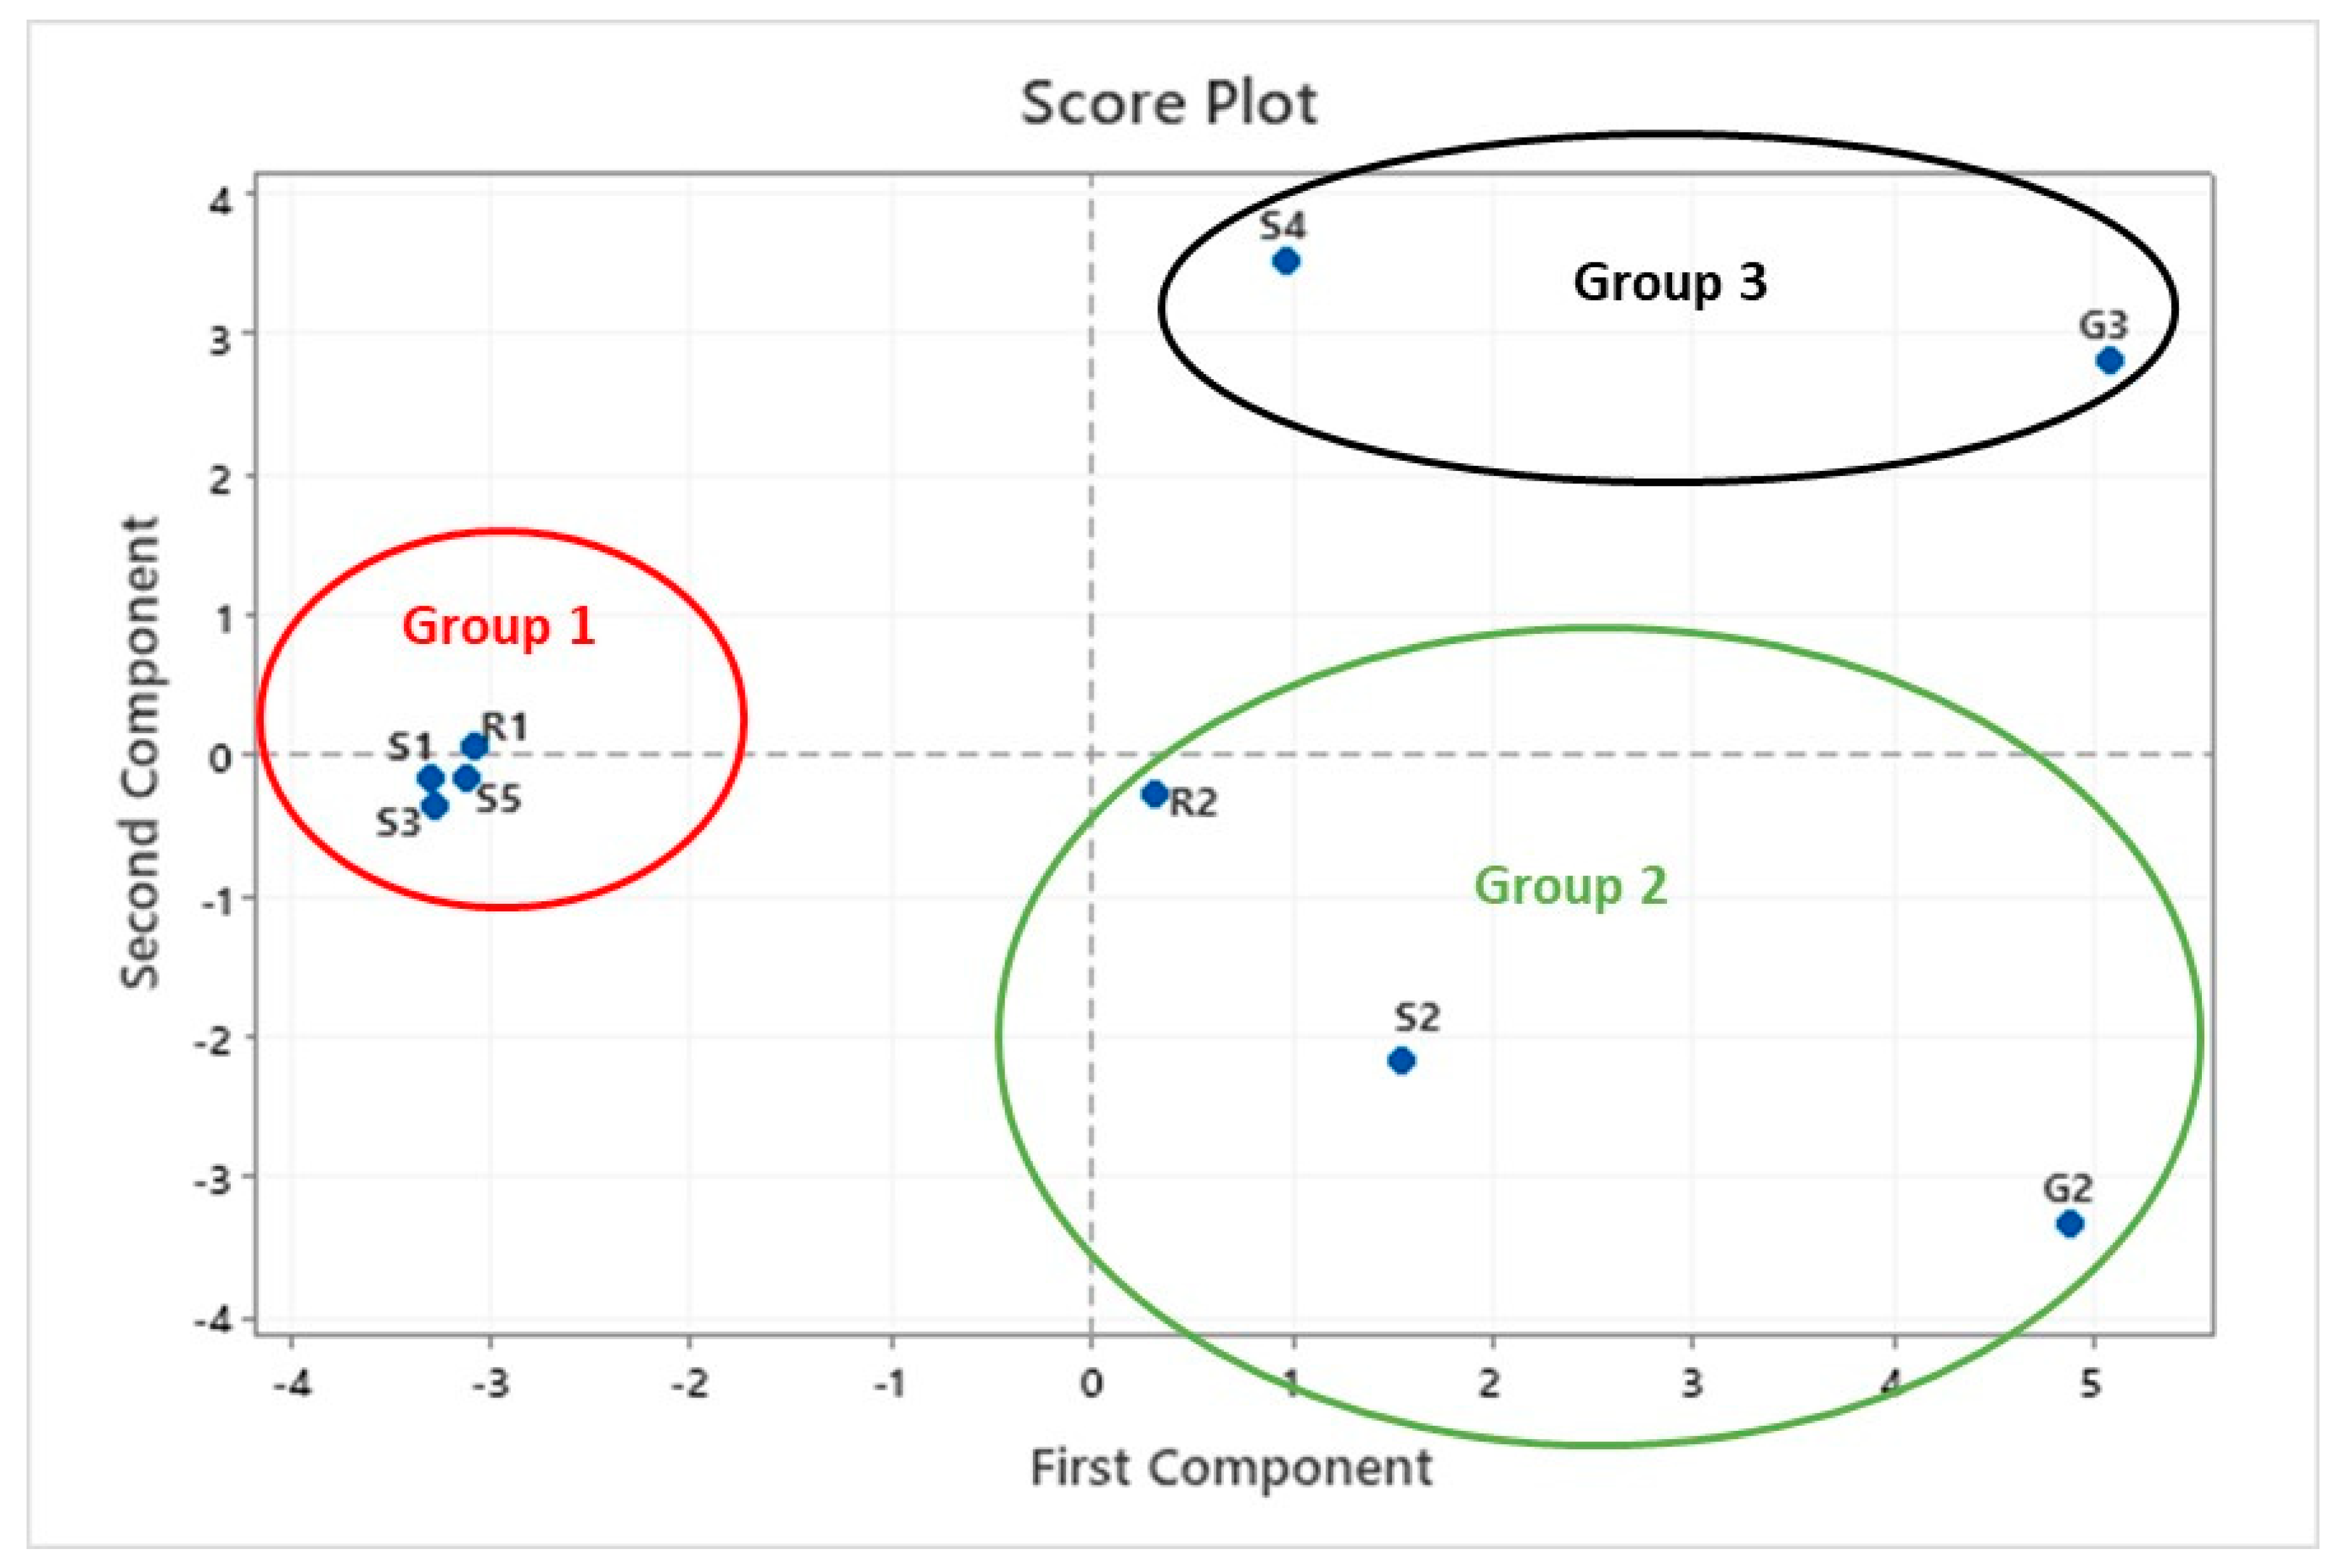
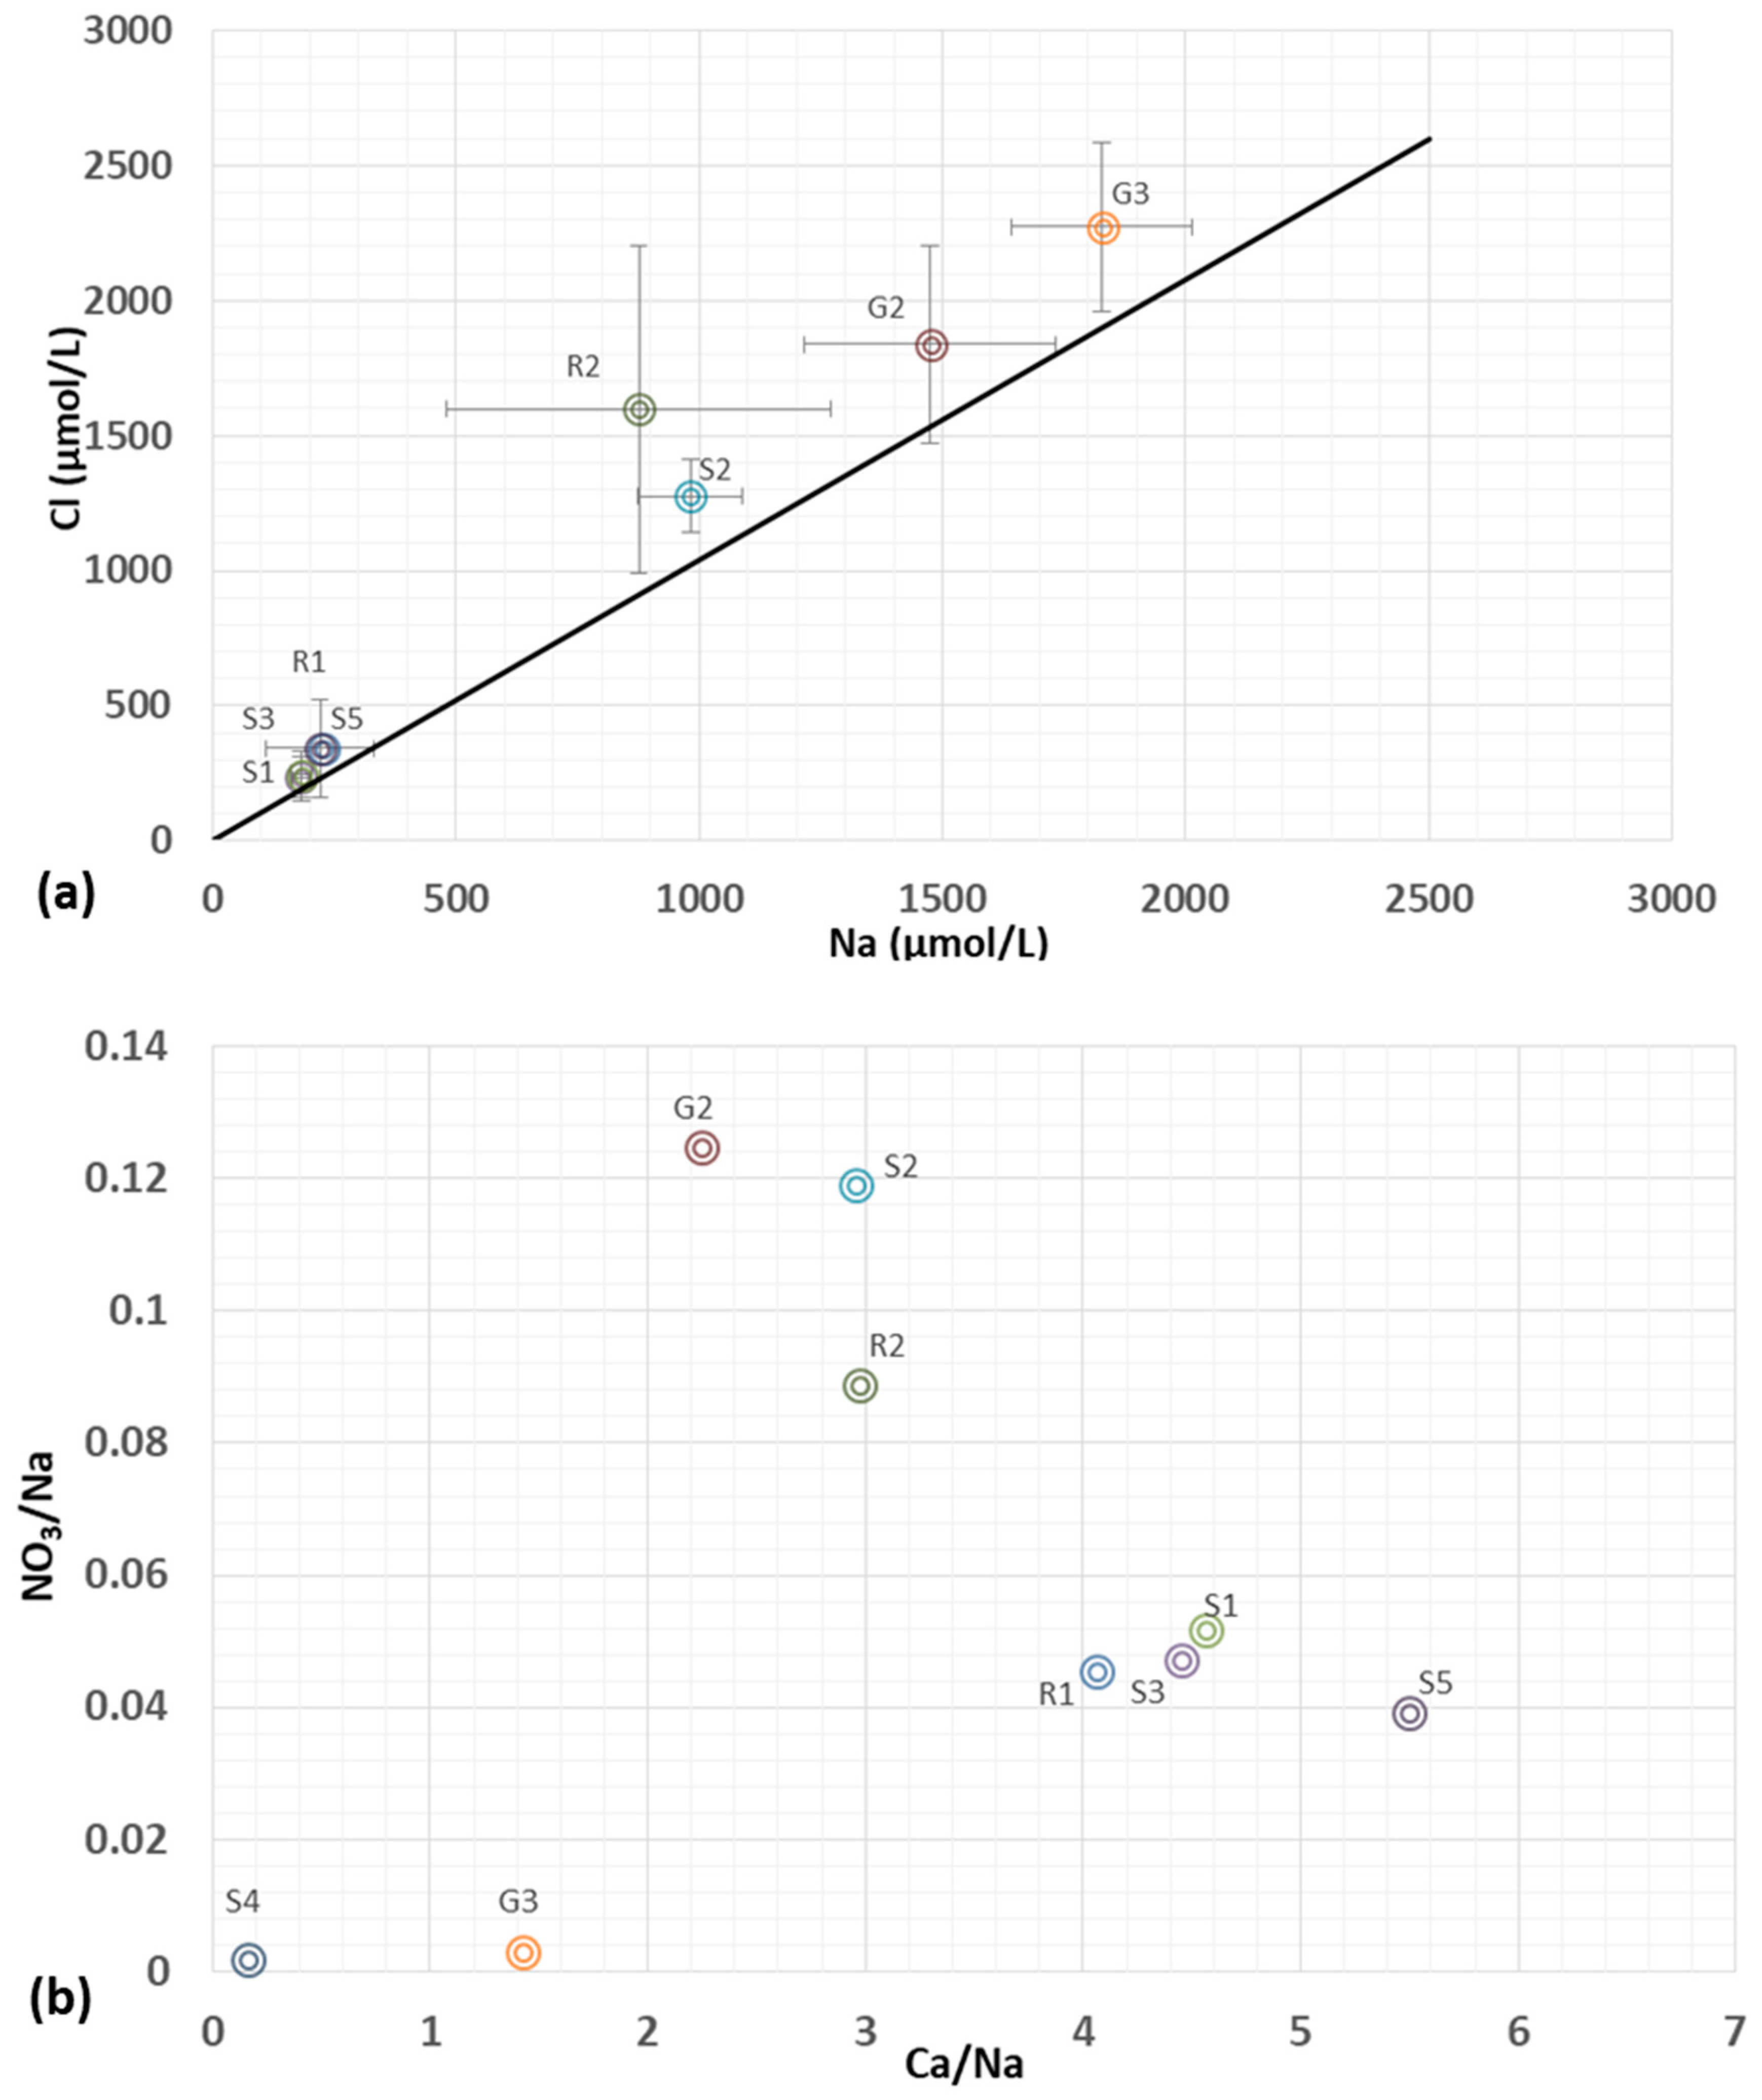
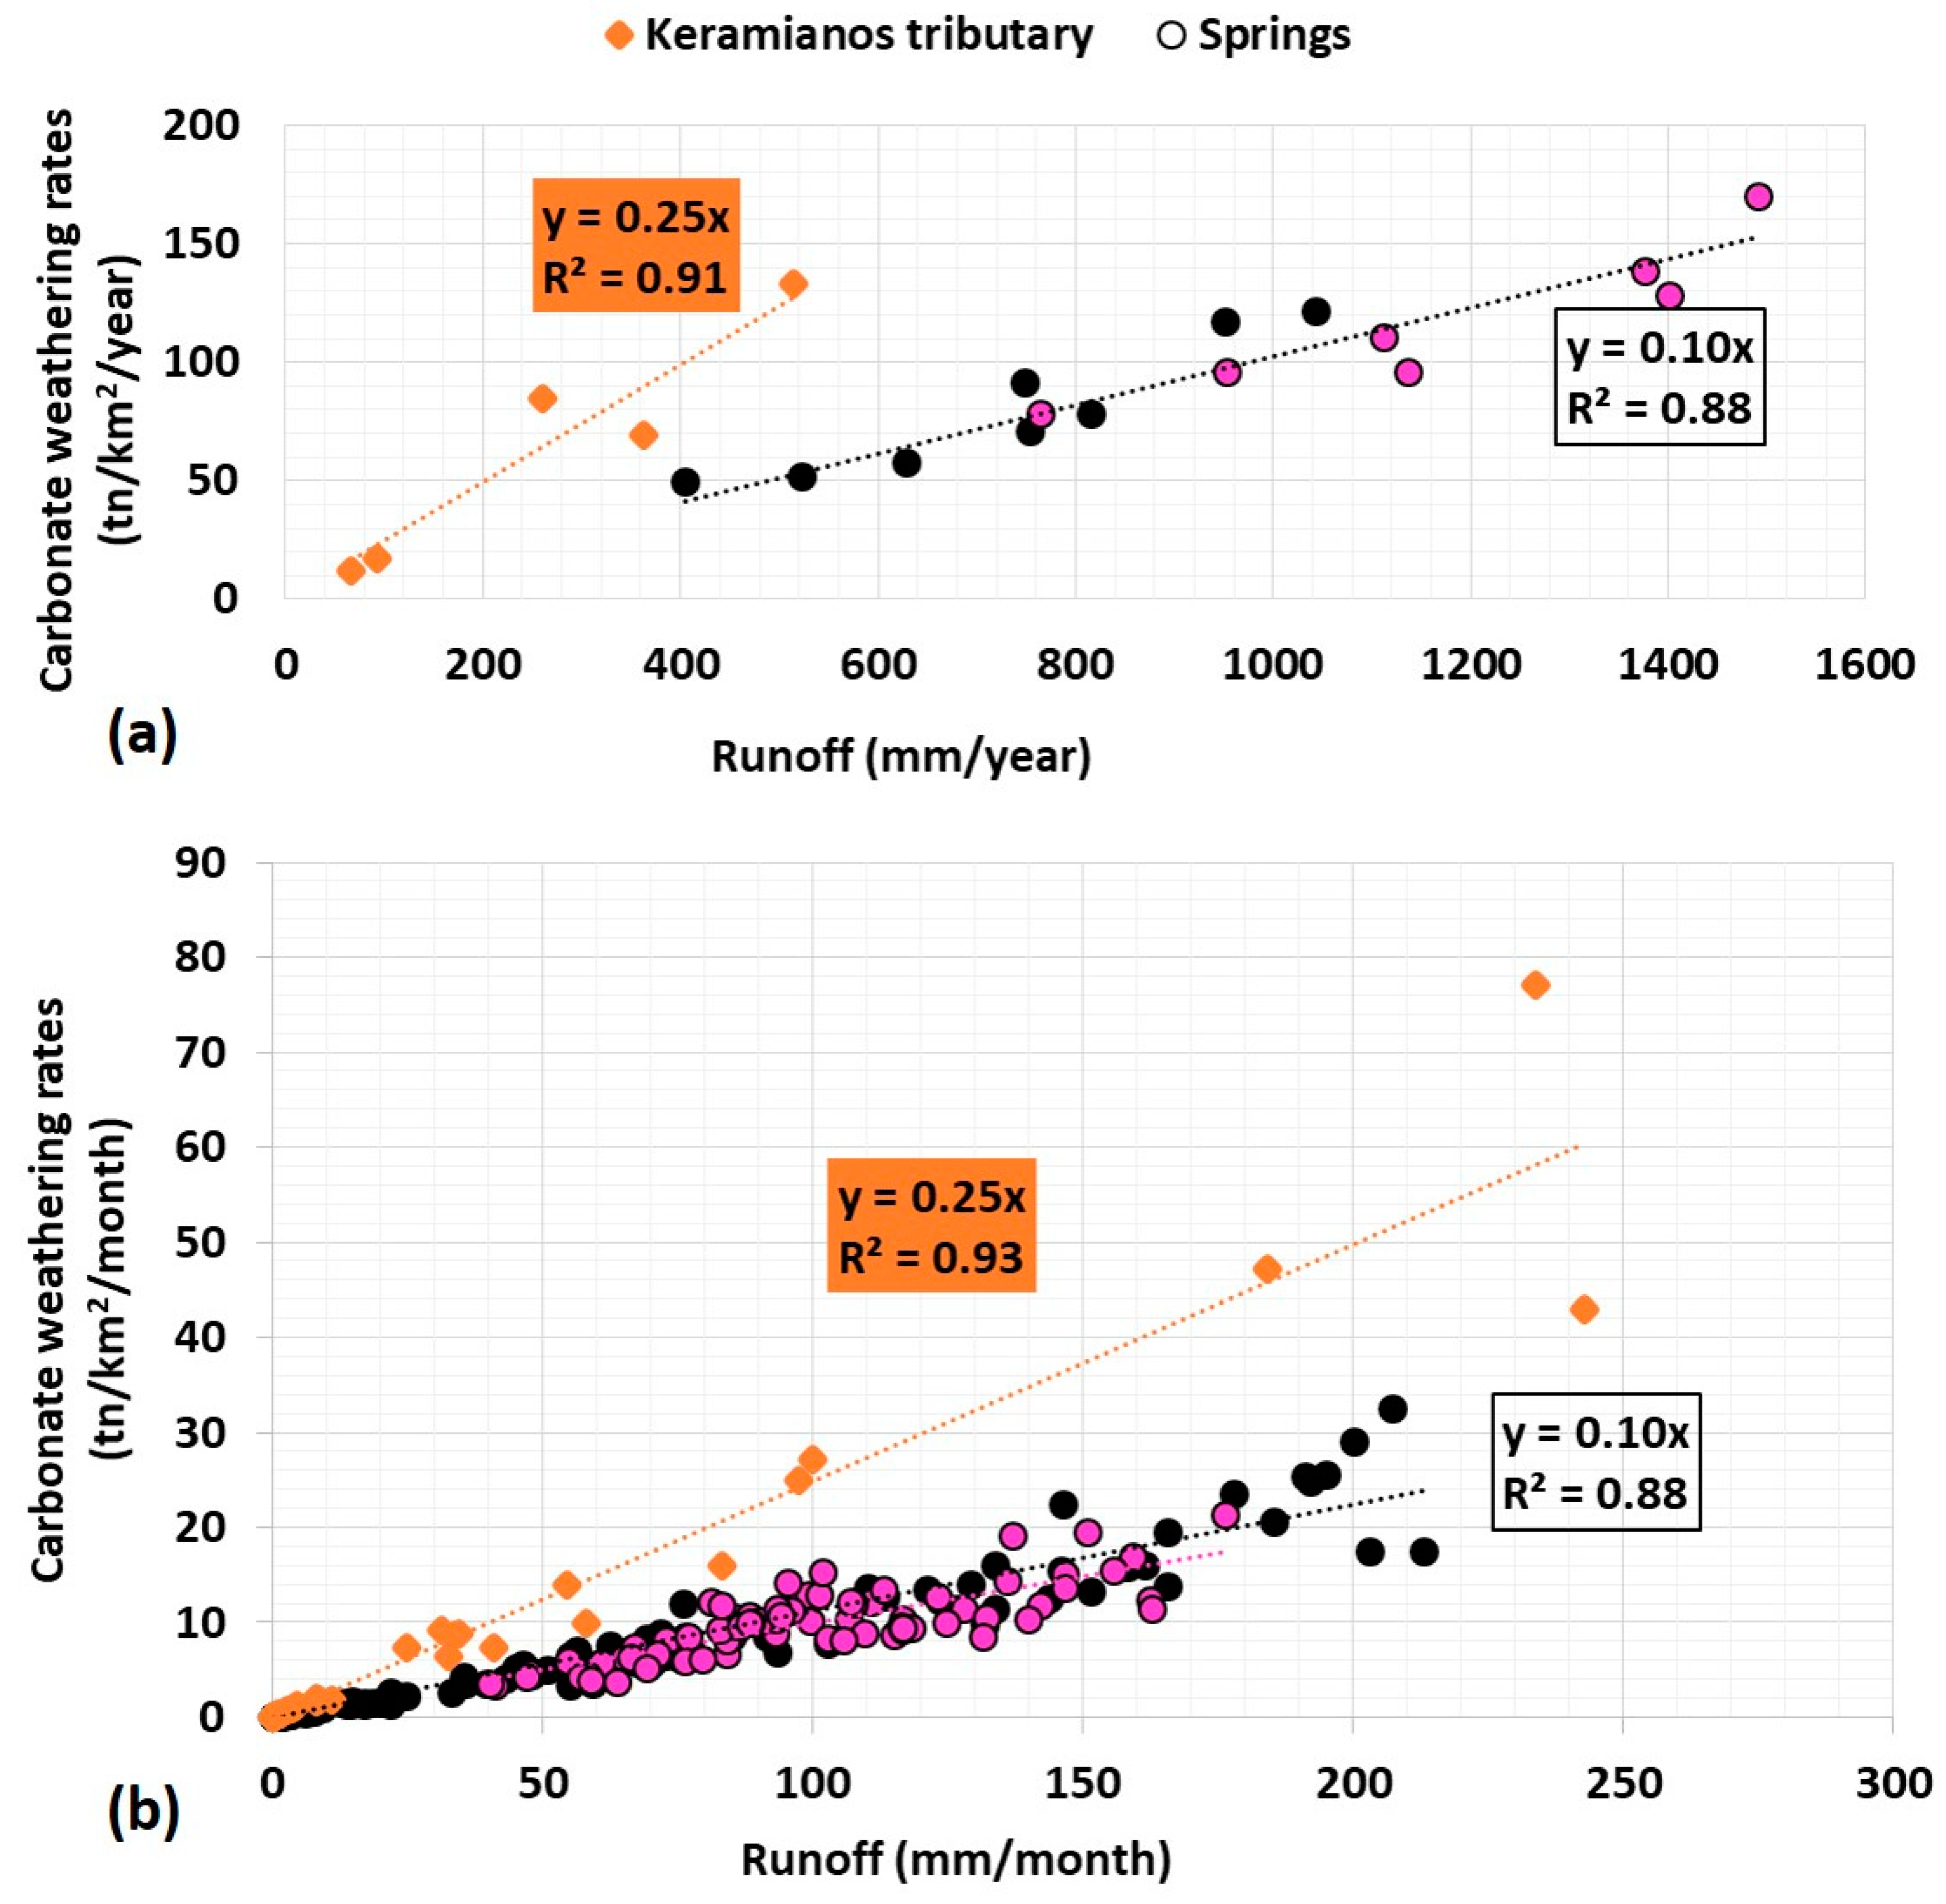
3.4. Geochemical Characterization and Weathering Fluxes

Table 4 presents the average chemical parameter values for the nine representative sampling locations (Agios Georgios (R1), Stylos spring (S1), Armenoi spring (S3), Anavreti spring (S5), Zourpos spring (S4), Katochori spring (S2), Kampoi well (G3), Dug well (G2), Katochori temporary river (R2)) using data from September 2010 to August 2019.
For the categorization of the geochemistry of Koiliaris CZO, a PCA was conducted using the average values of different chemical species (Ca, Mg, K, Si, Ti, B, Ba, Sr, Na, Li, pH, EC, DO, N-NO3, N-NH4, P-PO4, Cl, DN, SO4) for the years between September 2010 and August 2019. The results of the PCA are presented in Figure 6. Τhe score plot of the first two components of the PCA and the samples can be categorized into three distinct groups. The first three components describe 95% of the chemical variability. Stations R1, S1, S3, and S5 belong to Group 1 which has high pH and dissolved oxygen (DO), low nutrient, chloride and anion and cation concentrations. PCA component 1 distinguishes the karstic water from other origin or impacted water. Stations S2 and R2 in alluvial deposits, and G2 belong to Group 2 which is characterized by high values for nutrients like (N-NO3, DN), lower pH, high conductivity and high anion and cation concentration. The average concentration of N-NO3 is 7.3 ppm, 5 ppm and 10.4 ppm, and the average concentration of DN is 8.7 ppm, 5 ppm and 12.3 ppm, for S2, R2 and G2, respectively (Table 4). The water samples from the shallow aquifers have higher load of chemical species and this is related to higher load of nutrients from agricultural activities and the higher reactivity of brittle thin limestone found in alluvial formations. They also present higher values of Cl on average that range between 45 and 65 ppm.
Finally, G3 is situated in alluvial deposits originated from the weathered products of metamorphic schists. S4 has been affected from sea water and belongs to Group 3 which has high concentrations of Mg2+, Na+, Cl and other constituents. G3 and S4 show high concentrations of Mg (42 ppm and 23 ppm, respectively), Na (41 ppm and 177 ppm respectively), Cl (78 and 275 ppm respectively) and SO4 (124 and 47 ppm respectively) (Table 4).
The biplot analysis that identifies the chemical constituent that separates the three groups is presented in Supplementary Figure S7. In addition, a PCA was conducted using all data (and not only the average values) for the year 2012–2013 (Supplementary Figure S7) and the results in terms of characterization were the same as in Figure 6 discussed above.
In order to assess the geochemical and anthropogenic impact on water quality, the time series of the data were normalized to conservative values and compared with scientific literature. For instance, the molar (Ca + Mg)/Na ratio in Koiliaris River (R1) is 5 ± 1 and Ca/Na molar ratio is 4 ± 1, suggesting calcite dominated waters. When the molar ratio of (Ca + Mg)/Na in the rivers is greater than 10, the water is influenced by dolostone dissolution [84]. In addition, the molar (Ca + Mg)/SO4 ratio was calculated 44 ± 44 suggesting that there is no influence of sulphide oxidation or gypsum dissolution.
A positive correlation between Na+ and Cl concentrations in the water bodies of Koiliaris CZO was observed, with Cl/Na ratios to be higher than the ratio of 1.04 resulting from the atmospheric data of Finokalia station (FKL) (https://deims.org/d16cc035-054d-4b0e-9e19-6e9ec10aecd0) situated on the north coast of Crete (Figure 7a). This suggests that there is an additional source of Cl, through enrichment that is probably derived from fertilizers or manure input. S4 is not depicted in the Figure 7a as it is out of range of the curve between Na+ and Cl, presenting high values of these species due to sea water intrusion. In Figure 7b, where molar Ca/Na ratio is plotted as a function of the molar NO3/Na ratio, Groups 1, 2, and 3 of the different water bodies also appeared. Al, V, Cr, Ni, As, Se, Cd, Hg, and Pb values for all sites were extremely low or below detection limit of the analytical methods and they are not reported in Table 4.
Carbonate weathering rates were calculated using observed and modeled monthly flows. Specifically, observed monthly flows were used for Keramianos ephemeral river and modeled monthly flows were used for S1 and S3 springs. The fluxes were normalized to the contributing surface area of the karst for each spring and the surface area of the sub-catchment of Keramianos. The extended karst area was included in the calculations of the S1 spring weathering rates. Annual carbonate weathering rates range from 10 to 130 t/km2/year and 50 to 170 t/km2/year for Keramianos ephemeral river and the springs of Koiliaris CZO respectively (Figure 8), which corresponds to about 25 mm/1000 years and 39 mm/1000 years of carbonate being removed by chemical weathering for Keramianos ephemeral river and the springs, respectively (assuming a calcite rock density of 2.5 t/m3). These values are lower to similar estimates reported in the literature. For instance, Jura Mountains carbonate chemical weathering was estimated to be 100 mm/1000 years [74]. We postulate that the lower weathering rates are due to reduced impact from vegetation, the periodicity of precipitation, shallow soil development and high karstification rates. However, Jura Mountains are heavily forested (over 54% of the watershed area) all along its altitudinal range while Koiliaris is sparsely vegetated at the mid elevation and has alpine conditions at the high elevations. The periodicity of precipitation is also different between Jura Mountains (rains thought out the year) and Koiliaris (has a 5–6 months dry period). Figure 8 also presents the monthly based weathering rates for Keramianos and the springs. The slope of the curves is maintained between annual and monthly values and the degree of linearity (R2) is very strong for both and of similar values. Finally, we can observe that there is no interannual variation. Both annual and monthly weathering rates were also calculated for two other springs (Agia and Meskla springs) of the wider area of Koiliaris CZO and the results were consistent with the rates calculated in Keramianos and the springs S1 and S3.
Supplementary Figure S8 presents the carbonate weathering intensity as a function of runoff in Keramianos ephemeral river and in S1 and S3 springs. With increasing discharge, concentrations do not follow a pure dilution trend and remain constant over the whole range of discharge (Supplementary Figure S8). The ratio between Ca/Mg was calculated to be 4 ± 2 suggesting calcite dissolution (Ca/Mg ratio < 1.5 suggests influence of dolomite). Moreover, the air temperature does not affect the dissolution intensity and does not follow the general boomerang curve observed in the GLORICH dataset [84].

4. Conclusions

The Koiliaris CZO is a karstic Mediterranean watershed on the island of Crete and is part of the European LTER Network and the LTER-Greece Network. Significant research has been conducted over the past 15 years in the areas of stream and groundwater chemistry, soil degradation and formation, hydrologic and geochemical modeling, sustainable management of water and soil resources coupled with high frequency data acquisition. In this study, we combine the knowledge generated in previous studies and examine geomorphological and hydrogeochemical monitoring data to provide evidence and test hypotheses to further elucidate the hydrologic and geochemical response of Koiliaris CZO.
The extended karst area of Koiliaris River was redrawn based on geomorphologic and tectonic analyses. It was extended in the southern border by including the caves and sinkholes along an anticline, and was reduced in the northern border by eliminating the Neogene grabens. The total area of the extended karst remained the same as it was previously estimated.
The harmonic analysis of the fluctuation of the spring flow in Koiliaris shows that it is related to Earth tide stressing of the karstic reservoirs, as it affects both the lower and upper reservoirs. The analysis confirmed the partitioning of the karst into two reservoirs that have different hydro-mechanical properties and behavior. The oscillating hydraulic gradient generated by the tidal loading contributes significantly to the energy and mixing of the water in the karst supporting the modeling hypothesis of well-mixed groundwater reservoirs.
The geochemistry of Koiliaris was categorized into three distinct groups: (a) group 1 identifies the karstic water from other origin or impacted water, (b) group 2 is characterized by high values for nutrients, and (c) group 3 has high concentrations of Mg2+, Na+, Cl and other constituents. In general, the water of Koiliaris CZO is influenced by calcite dissolution. Carbonate weathering rates were found to be lower than similar studies, possibly due to a reduced impact from vegetation, the periodicity of precipitation, shallow soil development, and high karstification of the carbonate bedrock.
The conceptualization of a two reservoir, well-mixed karstic system was confirmed by both the geomorphologic and the tidal analysis. The hydrologic analysis provided insights on the hydrologic behavior of the karst during flood events and confirmed that when the infiltration capacity of the karst is exceeded by precipitation, the potential for significant and catastrophic floods is certain. During extreme events, 70% of the precipitation becomes surface runoff, creating tremendous flood events that need to be managed. Modeling such events is of the upmost importance, considering the impacts of climate change [40] and the need for adaptation measures to climate change and risk management [42]. Finally, the geochemical response of the watershed is closely linked to the geomorphology and hydrologic response, justifying in this way the weathering rates determined for the catchment. The studies at Koiliaris CZO illustrate the importance of critical zone science and they show how such transdisciplinary studies can be used to develop tools that can be scaled up for water and soil management at regional scales as well as for the development of strategies for the mitigation of climate change impacts.

Supplementary Materials

The following are available online at https://www.mdpi.com/2073-4441/12/9/2474/s1, Figure S1: Hillshade and aspect map of the White Mountains greater area, Figure S2: Geological cross sections (a) Profile A, (b) Profile B, (c) Profile C. The yellow triangles depict the hinges of the different anticlines, Figue S3: Agios Giorgios station tidal analysis studied periods 2018 & 2019, Figure S4: Tidal analysis of water stage for the period of 1 July 2018 till 11 September 2018, showing the predicted tidal component and the residual between the predicted tide and the field data, Figure S5: (a) Observed and modeled daily flow vs. time at Ag. Georgios station (basin exit), and (b) XY scatter plot with logarithmic axes, and trend line of observed vs. modeled flows at Ag. Georgios station (basin exit), Figure S6: Components of the mean annual flow of the stream network of the Koiliaris CZO, Figure S7: Groups resulting from PCA in water bodies of Koiliaris CZO using the average values of chemical species, Figure S8: Relationship between weathering intensity and instantaneous water discharge, Table S1: Tidal signals comparison for period 2019 ER, LR. Tidal constituents’ amplitude and phase with 95% CI estimates; phases are at central time, Table S2: Tidal signals comparison for period 2018 ER, LR. Tidal constituents’ amplitude and phase with 95% CI estimates; phases are at central time, Table S3: Mean contribution (%) of each stream and spring to the total flow (at the basin exit) and contribution during a wet and dry year, Table S4: Flow (m3/s) and contribution of each stream and spring to the total flow during an extreme flood event (25 February 2019).

Author Contributions

Conceptualization, M.A.L. and N.P.N.; methodology, M.A.L. and N.P.N.; software, M.A.L., D.E., J.S. and S.D.N.; formal analysis, M.A.L., D.E., D.M., J.S. and S.D.N.; resources, M.A.L., D.E., D.M., J.S., S.D.N. and N.P.N.; data curation, M.A.L., D.E., D.M. and S.D.N.; writing—original draft preparation, M.A.L., D.E., D.M., J.S., S.D.N. and N.P.N.; writing—review and editing, N.P.N.; visualization, M.A.L., D.E., D.M. and S.D.N.; supervision, N.P.N.; project administration, N.P.N.; funding acquisition, N.P.N. All authors have read and agreed to the published version of the manuscript.

Funding

This research was funded by the H2020 INFRAIA eLTER PLUS project, grant number 871128.

Conflicts of Interest

The authors declare no conflict of interest.

References

  1. Nikolaidis, N.P. Human Impacts on Soil: Tipping Points and Knowledge gaps. Appl. Geochem. 2011, 26, S230–S233. [Google Scholar] [CrossRef]
  2. Rockström, J.; Steffen, W.; Noone, K.; Persson, Å.; Chapin, F.S., III; Lambin, E.; Lenton, T.M.; Scheffer, M.; Folke, C.; Schellnhuber, H.; et al. Planetary boundaries: Exploring the safe operating space for humanity. Ecol. Soc. 2009, 14, 32. [Google Scholar] [CrossRef]
  3. Barnosky, A.D.; Hadly, E.A.; Bascompte, J.; Berlow, E.L.; Brown, J.H.; Fortelius, M.; Getz, W.; Harte, Z.; Hastings, A.; Marquet, P.A.; et al. Approaching a state shift in Earth’s biosphere. Nature 2012, 486, 52–58. [Google Scholar] [CrossRef]
  4. Millennium Ecosystem Assessment. Ecosystems and Human Well-Being: Synthesis; Island Press: Washington, DC, USA, 2005. [Google Scholar]
  5. Mooney, H.; Larigauderie, A.; Cesario, Μ.; Elmquist, Τ.; Hoegh-Guldberg, O.; Lavorel, S.; Mace, G.M.; Palmer, M.; Scholes, R.; Yahara, T. Biodiversity, climate change, and ecosystem services. Curr. Opin. Environ. Sustain. 2009, 1, 46–54. [Google Scholar] [CrossRef]
  6. Mirtl, M.; Borer, E.T.; Djukic, I.; Forsius, M.; Haubold, H.; Hugo, W.; Jourdan, J.; Lindenmayer, D.; McDowell, W.H.; Muraoka, H.; et al. Genesis, goals and achievements of Long-Term Ecological Research at the global scale: A critical review of ILTER and future directions. Sci. Total Environ. 2018, 626, 1439–1462. [Google Scholar] [CrossRef]
  7. Haase, P.; Tonkin, J.D.; Stoll, S.; Burkhard, B.; Frenzel, M.; Geijzendorffer, I.R.; Häuser, C.; Klotz, S.; Kühn, I.; McDowell, W.H.; et al. The next generation of site-based long-term ecological monitoring: Linking essential biodiversity variables and ecosystem integrity. Sci. Total Environ. 2018, 613–614, 1376–1384. [Google Scholar] [CrossRef] [Green Version]
  8. Mollenhauer, H.; Kasner, M.; Haase, P.; Peterseil, J.; Wohner, C.; Frenzel, M.; Mirtl, M.; Schima, R.; Bumberger, J.; Zacharias, S. Long-term environmental monitoring infrastructures in Europe: Observations, measurements, scales, and socio-ecological representativeness. Sci. Total Environ. 2018, 624, 968–978. [Google Scholar] [CrossRef]
  9. Anderson, S.P.; Bales, R.C.; Duffy, C.J. Critical Zone Observatories: Building a network to advance interdisciplinary study of Earth surface processes. Mineral. Mag. 2008, 72, 7–10. [Google Scholar] [CrossRef]
  10. Brantley, S.L.; Goldhaber, M.B.; Ragnarsdottir, K.V. Crossing Disciplines and Scales to Understand the Critical Zone. Elements 2007, 3, 307–314. [Google Scholar] [CrossRef]
  11. Banwart, S.A.; Nikolaidis, N.P.; Zhu, Y.G.; Peacock, C.L.; Sparks, D.L. Soil Functions: Connecting Earth’s Critical Zone. Annu. Rev. Earth Planet. Sci. 2009, 47, 333–359. [Google Scholar] [CrossRef]
  12. Banwart, S.; Bernasconi, S.; Bloem, J.; Blum, W.; Brandao, M.; Brantley, S.; Chabaux, F.; Duffy, C.; Lundin, L.; Kram, P.; et al. Assessing Soil Processes and Function across an International Network of Critical Zone Observatories: Research hypotheses and experimental design. Vadose Zone J. 2011, 10, 978–987. [Google Scholar] [CrossRef]
  13. Bellamy, P.; Loveland, P.; Bradley, R.; Lark, R.M.; Kirk, G.J.D. Carbon losses from all soils across England and Wales 1978–2003. Nature 2005, 437, 245–248. [Google Scholar] [CrossRef] [Green Version]
  14. Schmidt, M.; Torn, M.; Abiven, S.; Dittmar, T.; Guggenberger, G.; Janssens, I.A.; Kleber, M.; Kögel-Knabner, I.; Lehmann, J.; Manning, D.A.C.; et al. Persistence of soil organic matter as an ecosystem property. Nature 2011, 478, 49–56. [Google Scholar] [CrossRef] [Green Version]
  15. Moraetis, D.; Efstathiou, D.; Stamati, F.; Tzoraki, O.; Nikolaidis, N.P.; Schnoor, J.L.; Vozinakis, K. High-frequency monitoring for the identification of hydrological and bio-geochemical processes in a Mediterranean river basin. J. Hydrol. 2010, 389, 127–136. [Google Scholar] [CrossRef]
  16. Nikolaidis, N.P.; Bouraoui, F.; Bidoglio, G. Hydrologic and geochemical modeling of a karstic Mediterranean watershed. J. Hydrol. 2013, 477, 129–138. [Google Scholar] [CrossRef]
  17. Nerantzaki, S.D.; Giannakis, G.V.; Efstathiou, D.; Nikolaidis, N.P.; Sibetheros, I.A.; Karatzas, G.P.; Zacharias, I. Modeling Suspended Sediment Transport and Assessing the Impacts of Climate Change in a Karstic Mediterranean Watershed. Sci. Total Environ. 2015, 538, 288–297. [Google Scholar] [CrossRef]
  18. Stamati, F.; Nikolaidis, N.P.; Venieri, D.; Psillakis, E.; Kalogerakis, N. Dissolved organic nitrogen as an indicator of livestock impacts on soil biochemical quality. Appl. Geochem. 2011, 26, S340–S343. [Google Scholar] [CrossRef]
  19. Moraetis, D.; Stamati, F.; Kotronakis, M.; Fragia, T.; Paranychnianakis, N.; Nikolaidis, N.P. Identification of hydrologic and geochemical pathways using high frequency sampling, REE aqueous sampling and soil characterization at Koiliaris Critical Zone Observatory. Appl. Geochem. 2011, 26, S101–S104. [Google Scholar] [CrossRef]
  20. Stamati, F.; Nikolaidis, N.P.; Banwart, S.A.; Blum, W.E. A Coupled Carbon, Aggregation, and Structure Turnover (CAST) Model for topsoils. GeoDerma 2013, 211–212, 51–64. [Google Scholar] [CrossRef]
  21. Banwart, S.A.; Bernasconi, S.; Blum, W.; de Souza, D.M.; Chabaux, F.; Duffy, C.; Kercheva, M.; Kram, P.; Lair, G.; Lundin, L.; et al. Soil Functions in Earth’s Critical Zone—Key results and conclusions. Adv. Agron. 2017, 142, 1–27. [Google Scholar] [CrossRef]
  22. Nikolaidis, N.P.; Bidoglio, G. Soil Organic Matter Dynamics and Structure. Sustain. Agric. Rev. 2013, 12, 175–200. [Google Scholar]
  23. Rousseva, S.; Kercheva, M.; Shishkov, T.; Lair, G.J.; Nikolaidis, N.P.; Moraetis, D.; Krám, P.; Bernasconi, S.; Blum, W.; Menon, M.; et al. Soil Water Characteristics of European SoilTrEC Critical Zone Observatories. Adv. Agron. 2017, 142, 29–72. [Google Scholar] [CrossRef]
  24. Van Leeuwen, J.P.; Moraetis, D.; Lair, G.; Bloem, J.; Nikolaidis, N.P.; Hemerik, L.; de Ruiter, P.C. Ecological soil quality affected by land use and management on semi-arid Crete. Soil Discuss. 2015, 2, 187–215. [Google Scholar] [CrossRef]
  25. Regelink, I.C.; Stoof, C.R.; Rousseva, S.; Weng, L.; Lair, G.J.; Kram, P.; Nikolaidis, N.P.; Kercheva, M.; Banwart, S.; Comans, R.N.J. Mechanistic linkages between soil aggregates, soil porosity and soil chemical properties. GeoDerma 2015, 247–248, 24–37. [Google Scholar] [CrossRef]
  26. Moraetis, D.; Paranychianakis, N.; Nikolaidis, N.P.; Banwart, S.; Rousseva, S.; Kercheva, M.; Nenov, M.; Shishkov, T.; de Ruiter, P.; Bloem, J.; et al. Sediment provenance, soil genesis, and carbon storage in fluvial and manmade terraces at Koiliaris River Critical Zone Observatory. J. Soils Sediments 2015, 15, 347–364. [Google Scholar] [CrossRef]
  27. Tsiknia, M.; Paranychianakis, N.V.; Varouchakis, E.A.; Nikolaidis, N.P. Environmental Factors Shaping the Distribution of Nitrogen Cycling Functional Genes at a Watershed Scale. FEMS Microbiol. Ecol. 2015, 90, 139–152. [Google Scholar] [CrossRef]
  28. Tsiknia, M.; Paranychianakis, N.; Varouchakis, E.; Moraetis, D.; Nikolaidis, N.P. Environmental drivers of soil microbial community distribution at the Koiliaris Critical Zone Observatory. FEMS Microbiol. Ecol. 2014, 90, 139–152. [Google Scholar] [CrossRef]
  29. Paranychianakis, N.V.; Tsiknia, M.; Giannakis, G.V.; Nikolaidis, N.P.; Kalogerakis, N. Nitrogen cycling and relationships between ammonia oxidizers and denitrifiers in a clayey soil. Appl. Microbiol. Biotechnol. 2013, 97, 5507–5515. [Google Scholar] [CrossRef]
  30. Tzanakakis, V.A.; Apostolakis, A.; Nikolaidis, N.P.; Paranychianakis, N.V. Ammonia oxidizing archaea do not respond to ammonium or urea supply in an alkaline soil. Appl. Soil Ecol. 2018, 132, 194–198. [Google Scholar] [CrossRef]
  31. Apostolakis, A.; Panakoulia, S.; Nikolaidis, N.P.; Paranychianakis, N.V. Shifts in soil structure and soil organic matter in a chronosequence of set-aside fields. Soil Tillage Res. 2017, 174, 113–119. [Google Scholar] [CrossRef]
  32. Malagò, A.; Efstathiou, D.; Bouraoui, F.; Nikolaidis, N.P.; Franchini, M.; Bidoglio, G.; Kritsotakis, M. Regional scale hydrologic modeling of a karst-dominant geomorphology: The case study of the island of Crete. J. Hydrol. 2016, 540, 64–81. [Google Scholar] [CrossRef]
  33. Giannakis, G.V.; Nikolaidis, N.P.; Valstar, J.; Rowe, E.C.; Moirogiorgou, K.; Kotronakis, E.; Paranychianakis, N.V.; Rousseva, S.; Stamati, F.E.; Banwart, S.A. Integrated Critical Zone Model (1D-ICZ): A Tool for Dynamic Simulation of Soil Functions and Soil Structure. Adv. Agron. 2017, 142, 277–314. [Google Scholar] [CrossRef]
  34. Kotronakis, E.; Giannakis, G.V.; Nikolaidis, N.P.; Rowe, E.C.; Valstar, J.; Paranychianakis, N.V.; Banwart, S.A. Modeling the Impact of Carbon Amendments on Soil Ecosystem Functions Using the 1D-ICZ Model. Adv. Agron. 2017, 142, 315–352. [Google Scholar] [CrossRef]
  35. Giannakis, G.V.; Panakoulia, S.K.; Nikolaidis, N.P.; Paranychianakis, N.V. Simulating Soil Fertility Restoration using the CAST model. Procedia Earth Planet. Sci. 2014, 10, 325–329. [Google Scholar] [CrossRef] [Green Version]
  36. Panakoulia, S.K.; Nikolaidis, N.P.; Paranychianakis, N.V.; Menon, M.; Schiefer, J.; Lair, G.J.; Kram, P.; Banwart, S.A. Factors Controlling Soil Structure Dynamics and Carbon Sequestration Across Different Climatic and Lithological Conditions. Adv. Agron. 2017, 142, 241–276. [Google Scholar] [CrossRef]
  37. Yu, X.; Moraetis, D.; Duffy, C.; Nikolaidis, N.P.; Li, B. A coupled surface-subsurface hydrological model to assess flood risk at a karstic watershed. Environ. Model. Softw. 2019, 114, 129–139. [Google Scholar] [CrossRef]
  38. Varouchakis, E.A.; Giannakis, G.V.; Lilli, M.A.; Ioannidou, E.; Nikolaidis, N.P.; Karatzas, G.P. Development of a statistical tool for the estimation of riverbank erosion probability. Soil Discuss. 2016, 2, 1–11. [Google Scholar] [CrossRef] [Green Version]
  39. Nerantzaki, S.D.; Efstathiou, D.; Giannakis, G.; Kritsotakis, M.; Grillakis, M.; Koutroulis, A.; Tsanis, I.; Nikolaidis, N.P. Climate Change Impact on the Hydrologic Budget of a large Mediterranean island. Hydrol. Sci. J. 2019, 64, 1190–1203. [Google Scholar] [CrossRef]
  40. Nerantzaki, S.D.; Hristopulos, D.T.; Nikolaidis, N.P. Estimation of the uncertainty of hydrologic predictions in a karstic Mediterranean watershed. Sci. Total Environ. 2020, 717, 137131. [Google Scholar] [CrossRef]
  41. Demetropoulou, L.; Lilli, M.A.; Petousi, I.; Nikolaou, T.; Fountoulakis, M.; Kritsotakis, M.; Panakoulia, S.; Giannakis, G.V.; Manios, T.; Nikolaidis, N.P. Innovative methodology for the prioritization of the Program of Measures for integrated water resources management of the Region of Crete, Greece. Sci. Total Environ. 2019, 672, 61–70. [Google Scholar] [CrossRef]
  42. Lilli, M.A.; Nerantzaki, S.D.; Riziotis, C.; Kotronakis, M.; Efstathiou, D.; Kontakos, D.; Lymberakis, P.; Avramakis, M.; Tsakirakis, A.; Protopapadakis, K.; et al. Vision-Based Decision-Making Methodology for Riparian Forest Restoration and Flood Protection Using Nature-Based Solutions. Sustainability 2020, 12, 3305. [Google Scholar] [CrossRef] [Green Version]
  43. Banwart, S.A.; Bernasconi, S.; Bloem, J.; Blum, W.; de Souza, D.M.; Chabaux, F.; Duffy, C.; Lundin, L.; Kram, P.; Nikolaidis, N.P.; et al. Soil Processes and functions across an International Network of Critical Zone Observatories: Introduction to experimental methods and initial results. C. R. Geosci. 2012, 344, 758–772. [Google Scholar] [CrossRef]
  44. Banwart, S.A.; Black, H.; Cai, Z.; Gicheru, P.; Joosten, H.; Victoria, R.; Milne, E.; Noellemeyer, E.; Pascual, U.; Nziguheba, G.; et al. Benefits of soil carbon: Report on the outcomes of an international Scientific Committee on Problems of the Environment Rapid Assessment Workshop. Carbon Manag. 2014, 5, 185–192. [Google Scholar] [CrossRef]
  45. Jonsson, J.; Davidsdottir, B.; Nikolaidis, N.P. Valuation of Soil Ecosystem Services. Adv. Agron. 2017, 142, 353–384. [Google Scholar] [CrossRef]
  46. Jonsson, J.; Davidsdottir, B.; Nikolaidis, N.P.; Giannakis, G.V. Tools for Sustainable Soil Management: Soil Ecosystem Services, EROI and Economic Analysis. Ecol. Econ. 2019, 157, 109–119. [Google Scholar] [CrossRef]
  47. Menon, M.; Rousseva, S.; Nikolaidis, N.P.; van Gaans, P.; Panagos, P.; de Souza, D.M.; Ragnarsdottir, K.V.; Lair, G.J.; Weng, L.; Bloem, J.; et al. SoilTrEC: A global initiative on critical zone research and integration. Environ. Sci. Pollut. Res. 2014, 21, 3191–3195. [Google Scholar] [CrossRef]
  48. Kourgialas, N.N.; Karatzas, G.P.; Nikolaidis, N.P. Development of a thresholds approach for real-time flash flood prediction in complex geomorphological river basins. Hydrol. Process. 2012, 26, 1478–1494. [Google Scholar] [CrossRef]
  49. Papanikolaou, D.; Vassilakis, E. Thrust faults and extensional detachment faults in Cretan tectono-stratigraphy: Implications for Middle Miocene extension. Tectonophysics 2010, 488, 233–247. [Google Scholar] [CrossRef]
  50. Fassoulas, C. The tectonic development of a Neogene basin at the leading edge of the active European margin: The Heraklion basin, Crete, Greece. J. Geodyn. 2001, 31, 49–70. [Google Scholar] [CrossRef]
  51. Kilias, A.; Fassoulas, C.; Mountrakis, D. Tertiary extension of continental crust and uplift of Psiloritis metamorphic core complex in the central part of the Hellenic Arc (Crete, Greece). Int. J. Earth Sci. 1994, 83, 417–430. [Google Scholar]
  52. Adamopoulos, K. 1000 and 1 caves in “Lefka Ori” massif, on Crete, Greece. In Proceedings of the 16th International Congress of Speleology, Brno, Czech Republic, 21–28 January 2013. [Google Scholar]
  53. Reuter, H.I.; Nelson, A.; Jarvis, A. An evaluation of void-filling interpolation methods for SRTM data. Int. J. Geogr. Inf. Sci. 2007, 21, 983–1008. [Google Scholar] [CrossRef]
  54. Tataris, A.A.; Christodoulou, G.E. Geological Map of Greece, Sheet Alikianou, Scale 1:50,000; Institute for Geology and Subsurface Research: Athens, Greece, 1969. [Google Scholar]
  55. Karageorgiou, E.D.; Tsaila-Monopoli, S. Geological Map of Greece, Sheet Khania, Scale 1:50,000; Institute for Geology and Subsurface Research: Athens, Greece, 1971. [Google Scholar]
  56. Vidaki, M.; Triantafyllis, M.; Mylonaki, I. Geological Map of Greece, Sheet Vrisses, Scale 1:50,000; Institute for Geology and Subsurface Research: Athens, Greece, 1993. [Google Scholar]
  57. Gribovszki, Z.; Szilágyi, J.; Kalicz, P. Diurnal fluctuations in shallow groundwater levels and streamflow rates and their interpretation—A review. J. Hydrol. 2010, 385, 371–383. [Google Scholar] [CrossRef] [Green Version]
  58. Jentzsch, G. Earth tides and ocean tidal loading. In Tidal Phenomena; Springer: Berlin/Heidelberg, Germany, 1979; pp. 145–171. [Google Scholar] [CrossRef]
  59. Gieske, A.; De Vries, J.J. An analysis of earth-tide-induced groundwater flow in eastern Botswana. J. Hydrol. 1985, 82, 211–232. [Google Scholar] [CrossRef]
  60. Cerveny, R.S.; Svoma, B.M.; Vose, R.S. Lunar tidal influence on inland river streamflow across the conterminous United States. Geophys. Res. Lett. 2010, 37, 1–5. [Google Scholar] [CrossRef]
  61. Bredehoeft, J.D. Response of well-aquifer systems to Earth tides. J. Geophys. Res. 1967, 72, 3075–3087. [Google Scholar] [CrossRef]
  62. Van Der Kamp, G.; Gale, J.E. Theory of earth tide and barometric effects in porous formations with compressible grains. Water Resour. Res. 1983, 19, 538–544. [Google Scholar] [CrossRef]
  63. Hsieh, P.A.; Bredehoeft, J.D.; Rojstaczer, S.A. Response of well aquifer systems to Earth tides: Problem revisited. Water Resour. Res. 1988, 24, 468–472. [Google Scholar] [CrossRef] [Green Version]
  64. Burbey, T.J. Fracture characterization using Earth tide analysis. J. Hydrol. 2010, 380, 237–246. [Google Scholar] [CrossRef]
  65. Burbey, T.J.; Hisz, D.; Murdoch, L.C.; Zhang, M. Quantifying fractured crystalline-rock properties using well tests, earth tides and barometric effects. J. Hydrol. 2012, 414–415, 317–328. [Google Scholar] [CrossRef]
  66. Allègre, V.; Brodsky, E.E.; Xue, L.; Nale, S.M.; Parker, B.L.; Cherry, J.A. Using earth-tide induced water pressure changes to measure in situ permeability: A comparison with long-term pumping tests. Water Resour. Res. 2016, 52, 3113–3126. [Google Scholar] [CrossRef]
  67. Hartmann, T.; Wenzel, H.-G. The HW95 tidal potential catalogue. Geophys. Res. Lett. 1995, 22, 3553–3556. [Google Scholar] [CrossRef]
  68. Wells, J.T. Chapter 6: Tide-Dominated Estuaries and Tidal Rivers. Dev. Sedimentol. 1995, 53, 179–205. [Google Scholar] [CrossRef]
  69. Briciu, A.E. Wavelet analysis of lunar semidiurnal tidal influence on selected inland rivers across the globe. Sci. Rep. 2015, 4, 4193. [Google Scholar] [CrossRef] [PubMed]
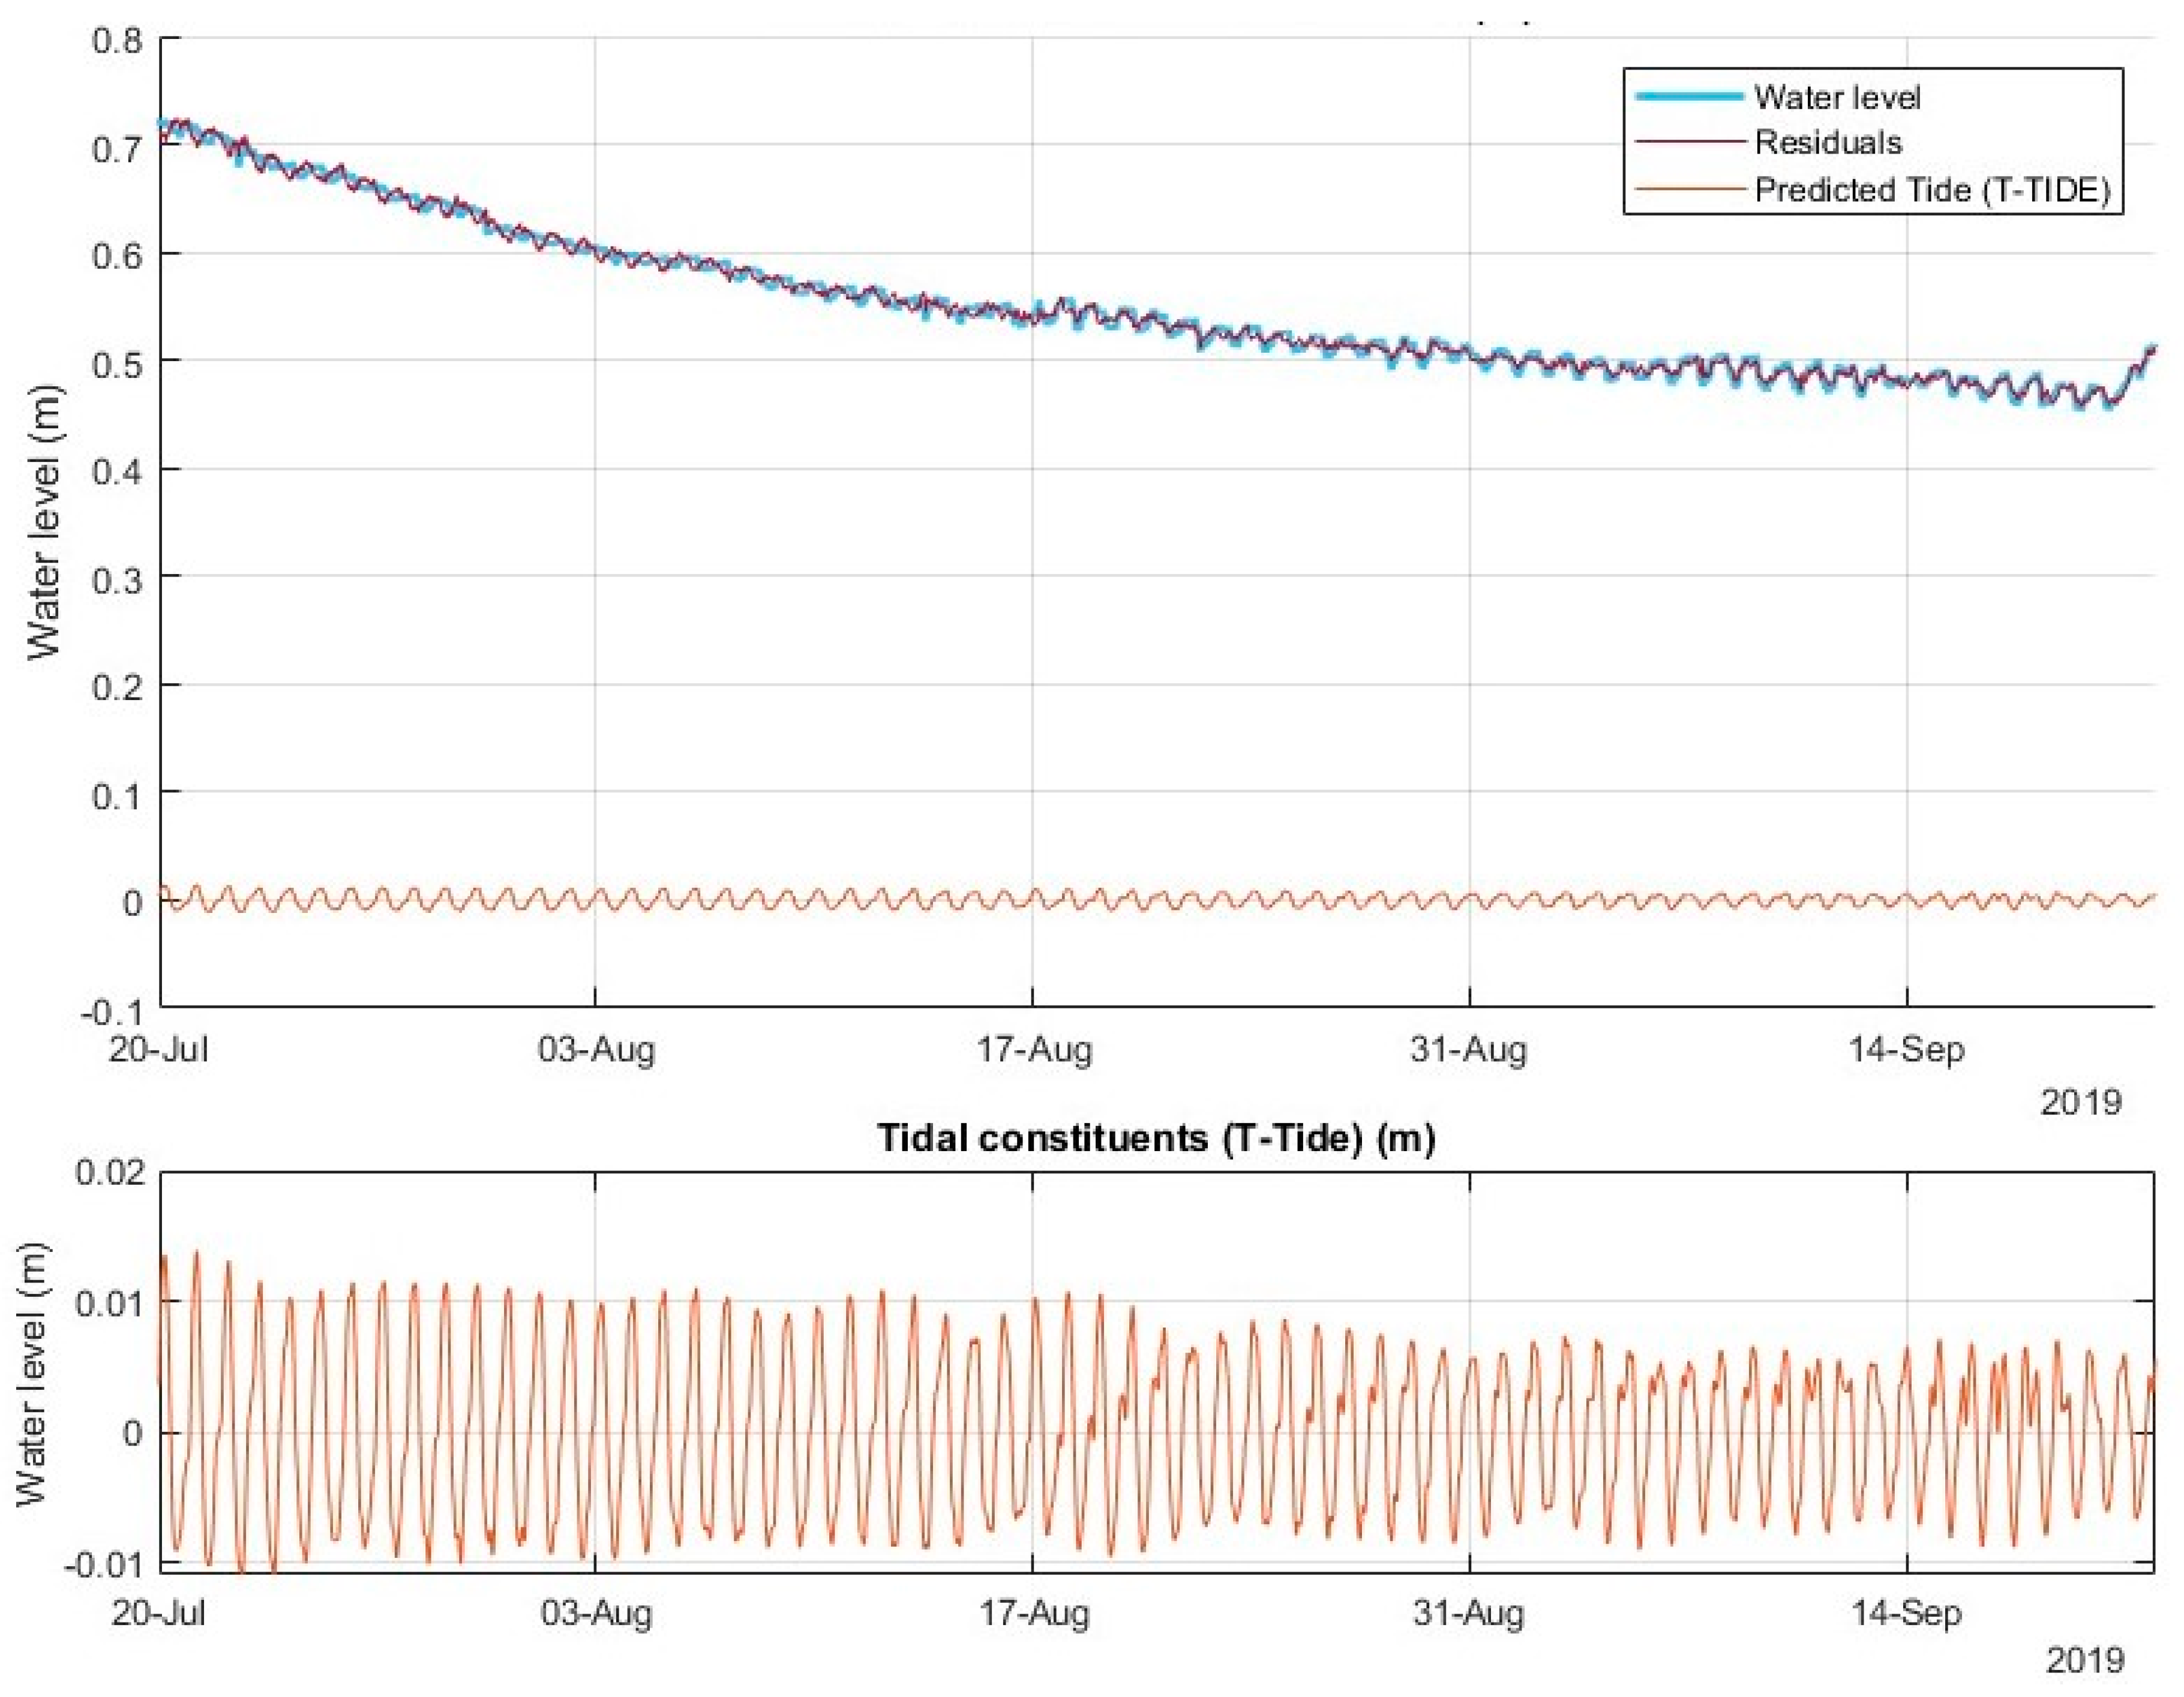
  70. Pawlowicz, R.; Beardsley, B.; Lentz, S. Classical tidal harmonic analysis including error estimates in MATLAB using T_TIDE. Comput. Geosci. 2002, 28, 929–937. [Google Scholar] [CrossRef]
  71. Aouissi, J.; Benabdallah, S.; Lili Chabaâne, Z.; Cudennec, C. Valuing scarce observation of rainfall variability with flexible semi-distributed hydrological modelling—Mountainous Mediterranean context. Sci. Total Environ. 2018, 643, 346–356. [Google Scholar] [CrossRef]
  72. Sellami, H.; Benabdallah, S.; La Jeunesse, I.; Vanclooster, M. Quantifying hydrological responses of small Mediterranean catchments under climate change projections. Sci. Total Environ. 2016, 543, 924–936. [Google Scholar] [CrossRef]
  73. Arnold, J.G.; Srinivasan, R.; Muttiah, R.S.; Williams, J.R. Large area hydrologic modeling and assessment part I: Model development. J. Am. Water Resour. Assoc. 1998, 34, 73–89. [Google Scholar] [CrossRef]
  74. Calmels, D.; Gaillardet, J.; François, L. Sensitivity of carbonate weathering to soil CO2 production by biological activity along a temperate climate transect. Chem. Geol. 2014, 390, 74–86. [Google Scholar] [CrossRef]
  75. Yan, J.; Wang, Y.P.; Zhou, G.; Li, S.; Yu, G.; Li, K. Carbon uptake by karsts in the Houzhai Basin, southwest China. J. Geophys. Res. 2011, 116, G04012. [Google Scholar] [CrossRef]
  76. Fassoulas, C.; Rahl, J.M.; Ague, J.; Henderson, K. Patterns and conditions of deformation in the Plattenkalk nappe, Crete, Greece: A preliminary study. Bull. Geol. Soc. Greece 2004, 36, 1626. [Google Scholar] [CrossRef] [Green Version]
  77. Manutsoglu, E.; Soujon, A.; Jacobshagen, V. Tectonic structure and fabric development of the Plattenkalk unit around the Samaria gorge, Western Crete, Greece. Z. Dtsch. Ges. Geowiss. 2003, 154, 85–100. [Google Scholar] [CrossRef]
  78. Caputo, R.; Catalano, S.; Monaco, C.; Romagnoli, G.; Tortorici, G.; Tortorici, L. Active faulting on the island of Crete (Greece). Geophys. J. Int. 2010, 183, 111–126. [Google Scholar] [CrossRef]
  79. Fassoulas, C. The structural evolution of central Crete: Insight into the tectonic evolution of the south Aegean. J. Geodyn. 1999, 27, 23–43. [Google Scholar] [CrossRef]
  80. Manutsoglu, E.; Spiridonos, E.; Soujon, A.; Jacobshagen, V. Revision of the geological map and 3D modelling of the geological structure of the Samaria Gorge Region, W. Crete. Bull. Geol. Soc. Greece 2001, 34, 29–36. [Google Scholar] [CrossRef]
  81. Wang, H.F. Theory of Linear Poroelasticity with Applications to Geomechanical and Hydrogeology; Princeton University Press: Princeton, NJ, USA, 2000. [Google Scholar]
  82. Agnew, D.C. Nonlinearity in rock: Evidence from Earth tides. J. Geophys. Res. 1981, 86, 3969. [Google Scholar] [CrossRef]
  83. Moriasi, D.N.; Arnold, J.G.; Van Liew, M.W.; Bingner, R.L.; Harmel, R.; Veith, T.L. Model evaluation guidelines for systematic quantification of accuracy in watershed simulations. Trans. ASABE 2007, 50, 885–900. [Google Scholar] [CrossRef]
  84. Gaillardet, J.; Calmels, D.; Romero-Mujalli, G.; Zakharova, E.; Hartmann, J. Global climate control on carbonate weathering intensity. Chem. Geol. 2019, 527, 118762. [Google Scholar] [CrossRef]
Figure 1. Schematic of the regional geology, the drainage network and the monitoring network of Koiliaris CZO.
Water 12 02474 g001
Figure 2. Diurnal variation of Koiliaris River stage highlighting the double peaks in the daily cycle.
Water 12 02474 g002
Figure 3. CWT Magnitude Scalograms from the stage data during the flow recession periods indicating the existence of diurnal and semi-diurnal oscillation signals in Koiliaris River.
Water 12 02474 g003
Figure 4. Tidal analysis of water stage for the period of 20 July 2019 till 21 September 2019, showing the predicted tidal component and the residual between the predicted tide and the field data.
Water 12 02474 g004
Figure 5. Mean annual hydrologic budget of the Koiliaris CZO.
Water 12 02474 g005
Figure 6. Score Plot of PCA analysis applied to 9 sampling stations of Koiliaris CZO. The analysis highlighted 3 groups describing the geochemistry of the area.
Water 12 02474 g006
Figure 7. (a) Average Na vs. Cl concentration in the different water samples in Koiliaris CZO. The black line represents the Na/Cl ratio (1:1.04) from Finokalia Station. Error bars correspond to the standard deviation of the data. (b) Comparison between Ca/Na and NO3/Na ratios.
Water 12 02474 g007
Figure 8. Relationship between (a) annual and (b) monthly carbonate weathering rates and runoff in Keramianos river and springs of Koiliaris CZO. Τhe black and dark pink circles depict Stylos (S1) and Armenoi (S3) springs, respectively.
Water 12 02474 g008
Table 1. Research Areas and Key Scientific Questions Addressed at the Koiliaris CZO and research citations related to them.
1. Stream and Ground Water Chemistry [16,17,18,19]
  • How anthropogenic practices affect hydrogeochemical pathways between the terrestrial and aquatic environments in a Mediterranean watershed
  • What are the impacts of agricultural land use practices on water quality?
  • What are the impacts of livestock grazing on water quality?
  • Identify hydrogeochemical pathways and quantify chemical fluxes between the terrestrial and aquatic environments
2. Soil Degradation and Formation [11,20,21,22,23,24,25,26,27,28,29,30,31]
  • How grazing affects nutrient (C, N, P) cycling in degraded soils of Koiliaris CZO highlands. What are the impacts of livestock grazing on soil and water quality?
  • What are the processes controlling aggregation and nutrient sequestration in soils?
  • How agricultural practices affect aggregation and nutrient sequestration in soils?
  • What are the factors and processes affecting soil (aggregate) formation and degradation? Rates of formation and degradation?
  • What is the areal extend of soil at threat to degradation?
3. Hydrologic and Geochemical Modeling of Complex Terrain [16,17,20,32,33,34,35,36,37,38]
  • Model parameterization to improve hydrologic and geochemical predictability
  • Scaling up methodology - what are the uncertainties of parameter estimation at different scales.
4. Sustainable Management of Water and Soil Resources [1,12,39,40,41,42,43,44,45,46,47]
  • How is climate change going to affect water availability and management?
  • Soil sustainability requires long-term social change. What is the best governance paradigm for such a change?
  • Considering the fact that sustainability demands a mixture of governmental policies, market initiatives and civil-society interventions what are the more appropriate tools and mechanisms for more efficient public participation?
5. High Frequency Environmental Monitoring [15,48]
  • Development of intelligent monitoring system with high sampling frequency and how this is improving the data availability for environmental decision making?
  • How is high frequency sampling going to improve the data availability flash flood forecasting?
Table 2. Agios Georgios station tidal analysis flow recession selected periods.
PeriodStart DateEnd DateDuration (Days)ER Number of DaysLR Number of Days
200725 Mar 200714 October 2007204~79~125
201322 July 20136 November 2013108-108
201425 April 201426 September 2014155~49~106
201713 June 201730 August 201779~40~39
20181 July 201811 September 201873~48~25
201920 July 201921 September 201964~29~33
Table 3. T_Tide analysis for period 2019. Tidal constituents’ amplitude and phase with 95% CI estimates; phases are at central time.
Tidal ComponentAmplitudeAmplitude ErrorPhase (°)Phase Error (°)Signal to Noise RatioPeriod (Days)
P10.00290.001249.425.145.21.003
K10.00870.001242.338.48470.997
EPS20.00080171.4727.6740.547
L20.0006027.9642.382.20.508
S20.00170149.3313.57180.500
MO30.00050118.1139.162.20.349
SK30.0007080.2931.323.50.333
SN40.00030244.4937.722.30.257
MS40.00030325.736.472.40.254
S40.0005073.6922.466.50.250
2SK50.00030307.928.334.20.200
3MK70.0002098.2237.232.30.147
M80.00020128.9418.039.30.129
Table 4. Average chemical characteristics for the 9 sampling locations. Parentheses show standard deviation.
R1S1S3S5S2G2R2S4G3
Number of Samples646161176057206164
Parameter
pH8.18.08.08.07.07.37.87.87.6
DO (mg/L)10.2 (0.9)11.0 (0.9)10.6 (1.4)10.7 (0.9)7.0 (1.5)2.3 (1.5)10.6 (1.6)10.1 (1.1)1.5 (1.3)
EC (μS/cm)240 (45)222 (36)222 (36)249 (85)718 (129)969 (122)658 (126)1133 (268)1029 (186)
N-NO3 (ppm)0.7 (0.6)0.6 (0.3)0.5 (0.2)0.5 (0.3)7.3 (2.4)10.4 (4.8)5.0 (3.3)0.8 (0.5)0.3 (0.4)
N-NH3 (ppm)0.05 (0.13)0.04 (0.07)0.02 (0.03)0.04 (0.03)0.04 (0.06)0.04 (0.05)0.07 (0.06)0.09 (0.10)0.10 (0.06)
P-PO4 (ppm)0.03 (0.05)0.03 (0.04)0.02(0.03)0.01 (0.01)0.05 (0.06)0.14 (0.11)0.05 (0.05)0.07 (0.22)0.06 (0.05)
Cl (ppm)12 (7)8 (5)8 (4)9 (6)45 (11)65 (19)56 (20)275 (87)78 (19)
SO4 (ppm)4 (3)3 (2)3 (2)5 (7)33 (14)62 (18)46 (16)47 (17)124 (23)
HCO3 (ppm)148 (49)144 (44)141 (46)146 (77)330 (140)386 (160)275 (125)193 (84)415 (145)
TOC (ppm)1.6 (1.3)1.3 (1.4)1.5 (1.7)1.4 (0.9)2.2 (1.9)2.9 (1.9)2.9 (2.2)1.5 (1.2)4.7 (2.4)
DN (ppm)0.6 (0.4)0.7 (0.4)0.7 (0.3)0.6 (0.4)8.7 (2.2)12.3 (4.1)5.0 (3.1)1.1 (0.9)0.5 (0.4)
Na (ppm)5 (2)4 (1)4 (1)5 (2)22 (3)34 (8)18 (9)177 (52)41 (7)
Mg (ppm)6 (2)5 (2)6 (2)4 (2)5 (1)9 (3)8 (2)23 (8)42 (9)
Si (ppm)0.9 (0.5)0.9 (0.5)0.9 (0.5)0.6 (0.6)3.6 (0.8)4.5 (1.4)2.6 (0.9)1.1 (0.5)5.1 (1.1)
K (ppm)0.4 (0.2)0.3 (0.2)0.3 (0.3)0.5 (0.5)1.3 (0.7)2.2 (1.9)2.1 (0.8)4.6 (2.1)5.1 (1.9)
Ca (ppm)36 (10)34 (8)33 (8)43 (13)119 (26)132 (35)86 (26)48 (12)104 (21)
Mn (ppb)1.3 (1.4)0.4 (1.4)0.1 (0.3)7.4 (7.6)0.3 (0.7)0.5 (0.8)1.8 (2.3)0.1 (0.3)76 (140)
Fe (ppb)6 (9)5 (7)3 (6)7 (10)8 (12)9 (14)14 (17)4 (14)9 (14)

