Seasonal Variation of Dissolved Oxygen in the Southeast of the Pearl River Estuary


Abstract
1. Introduction
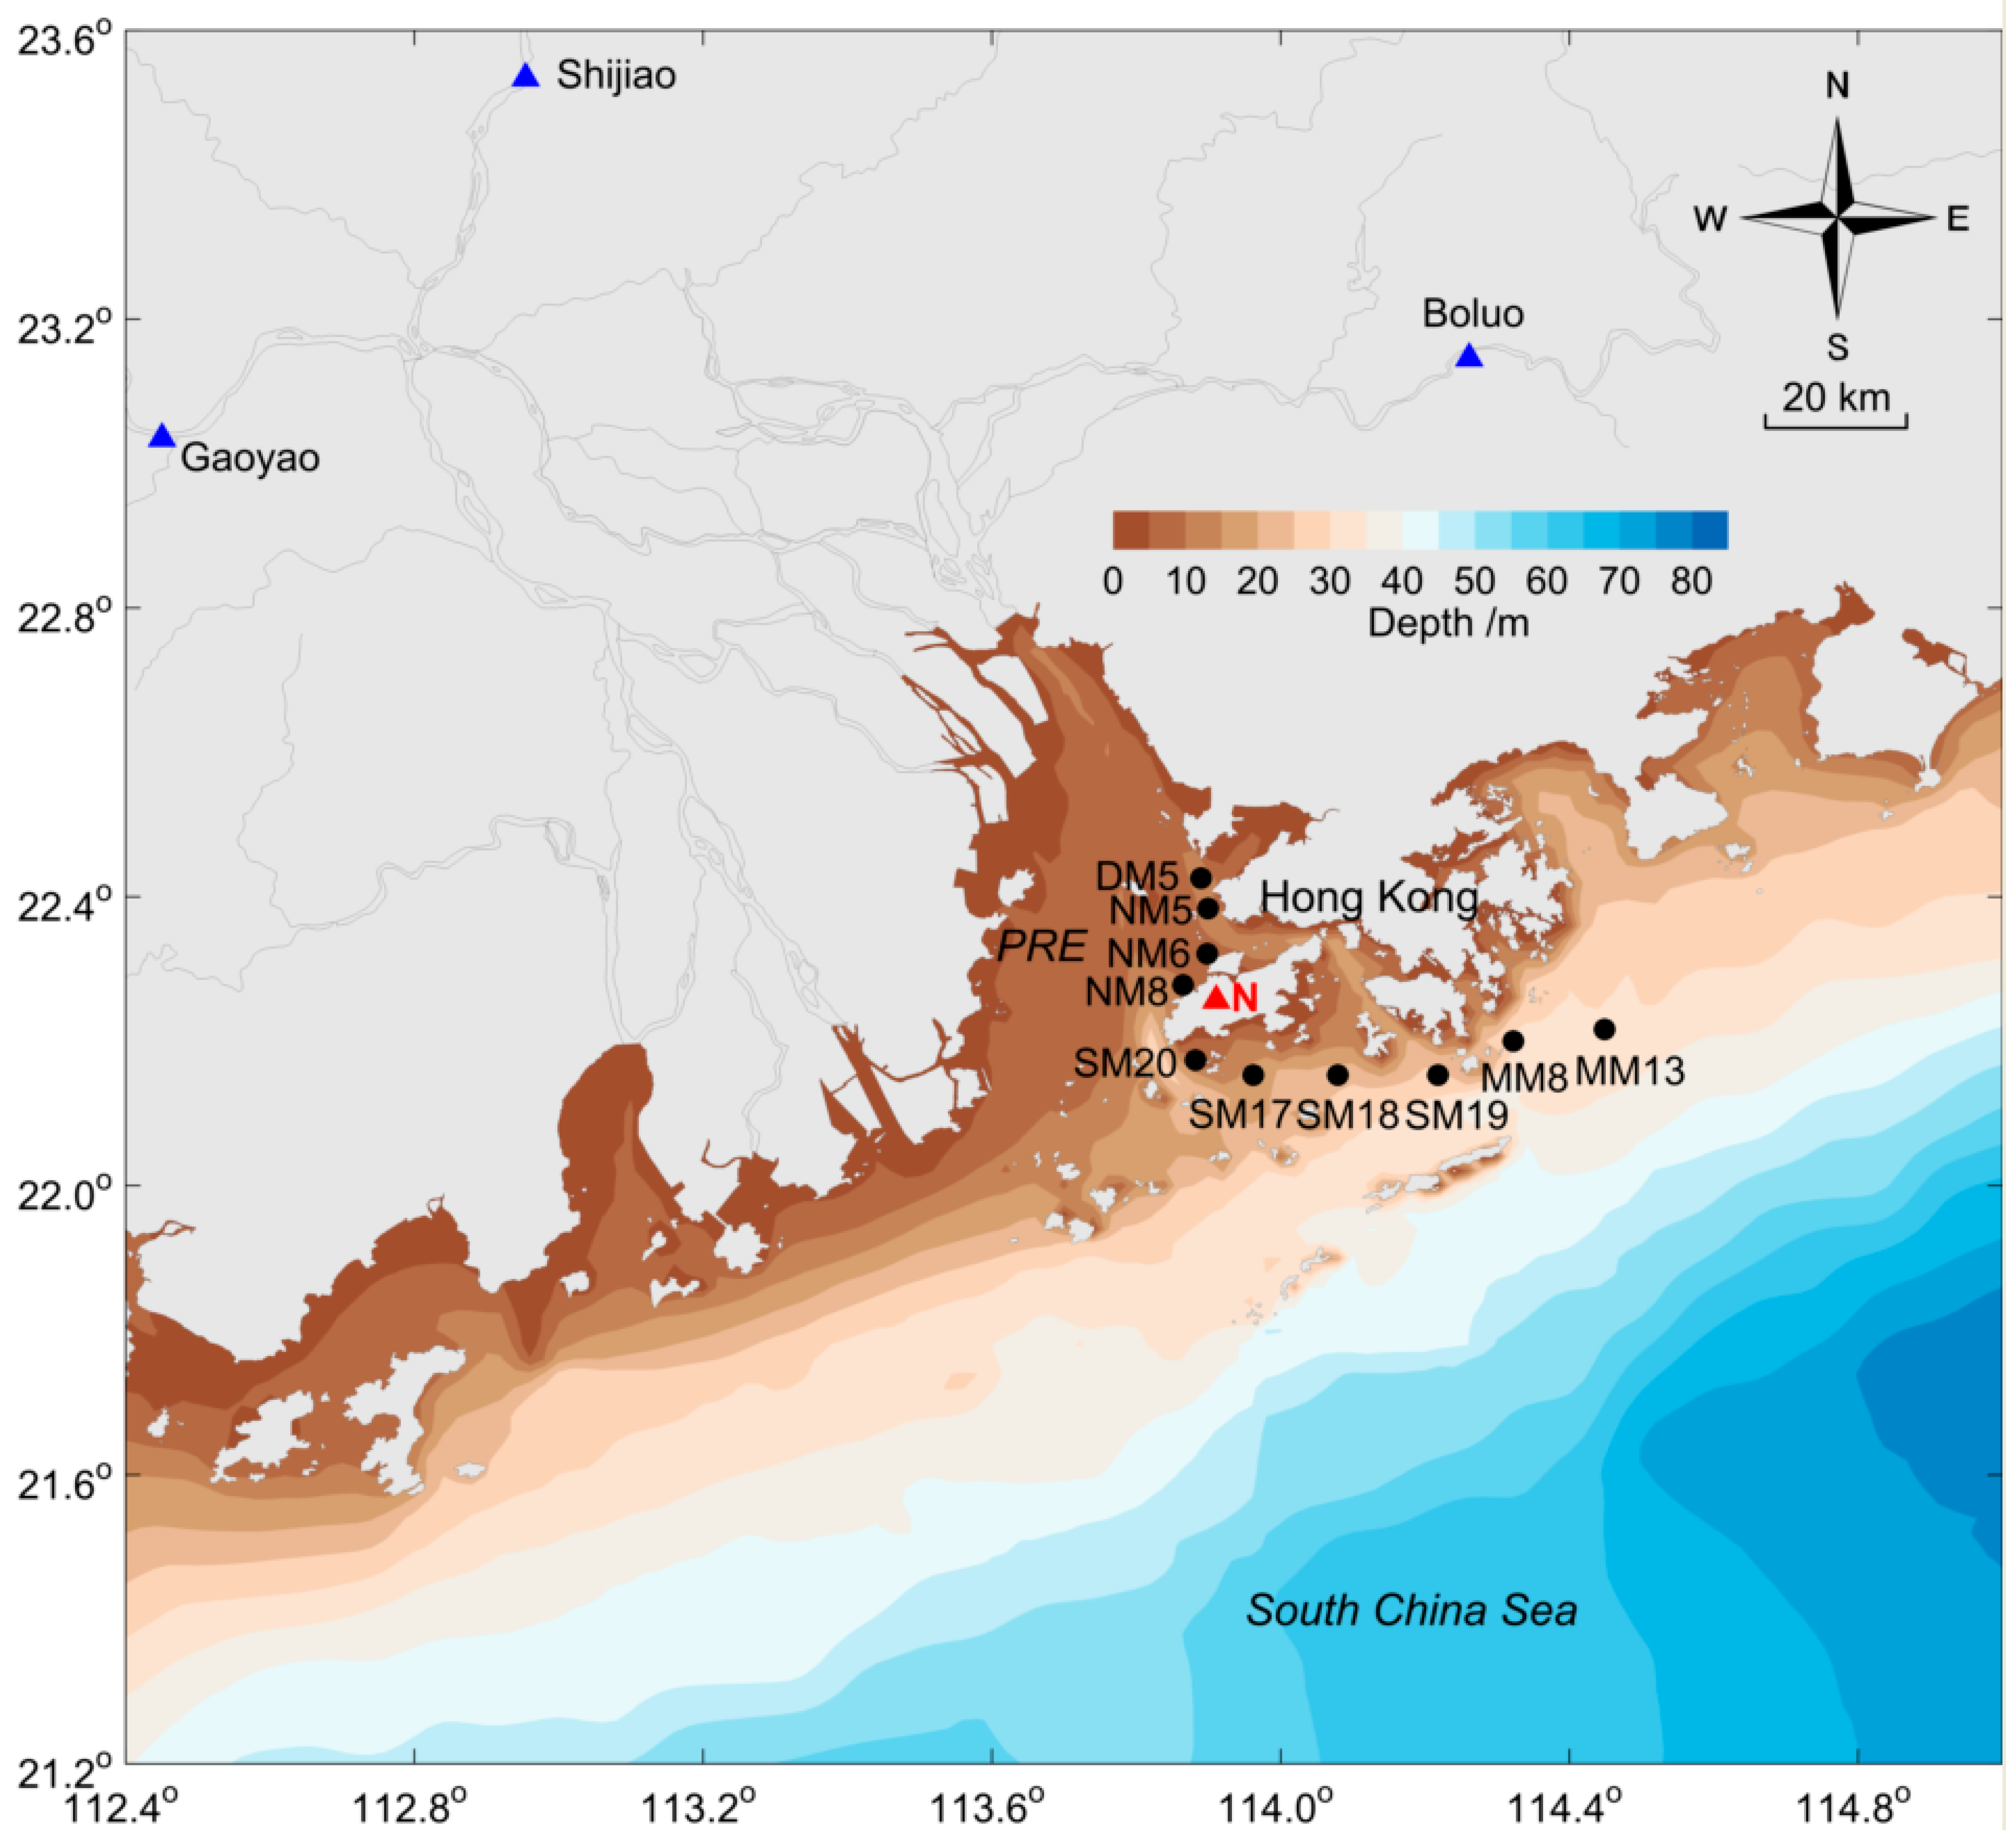
2. Data and Methods
2.1. Data
2.2. Methods
3. Results
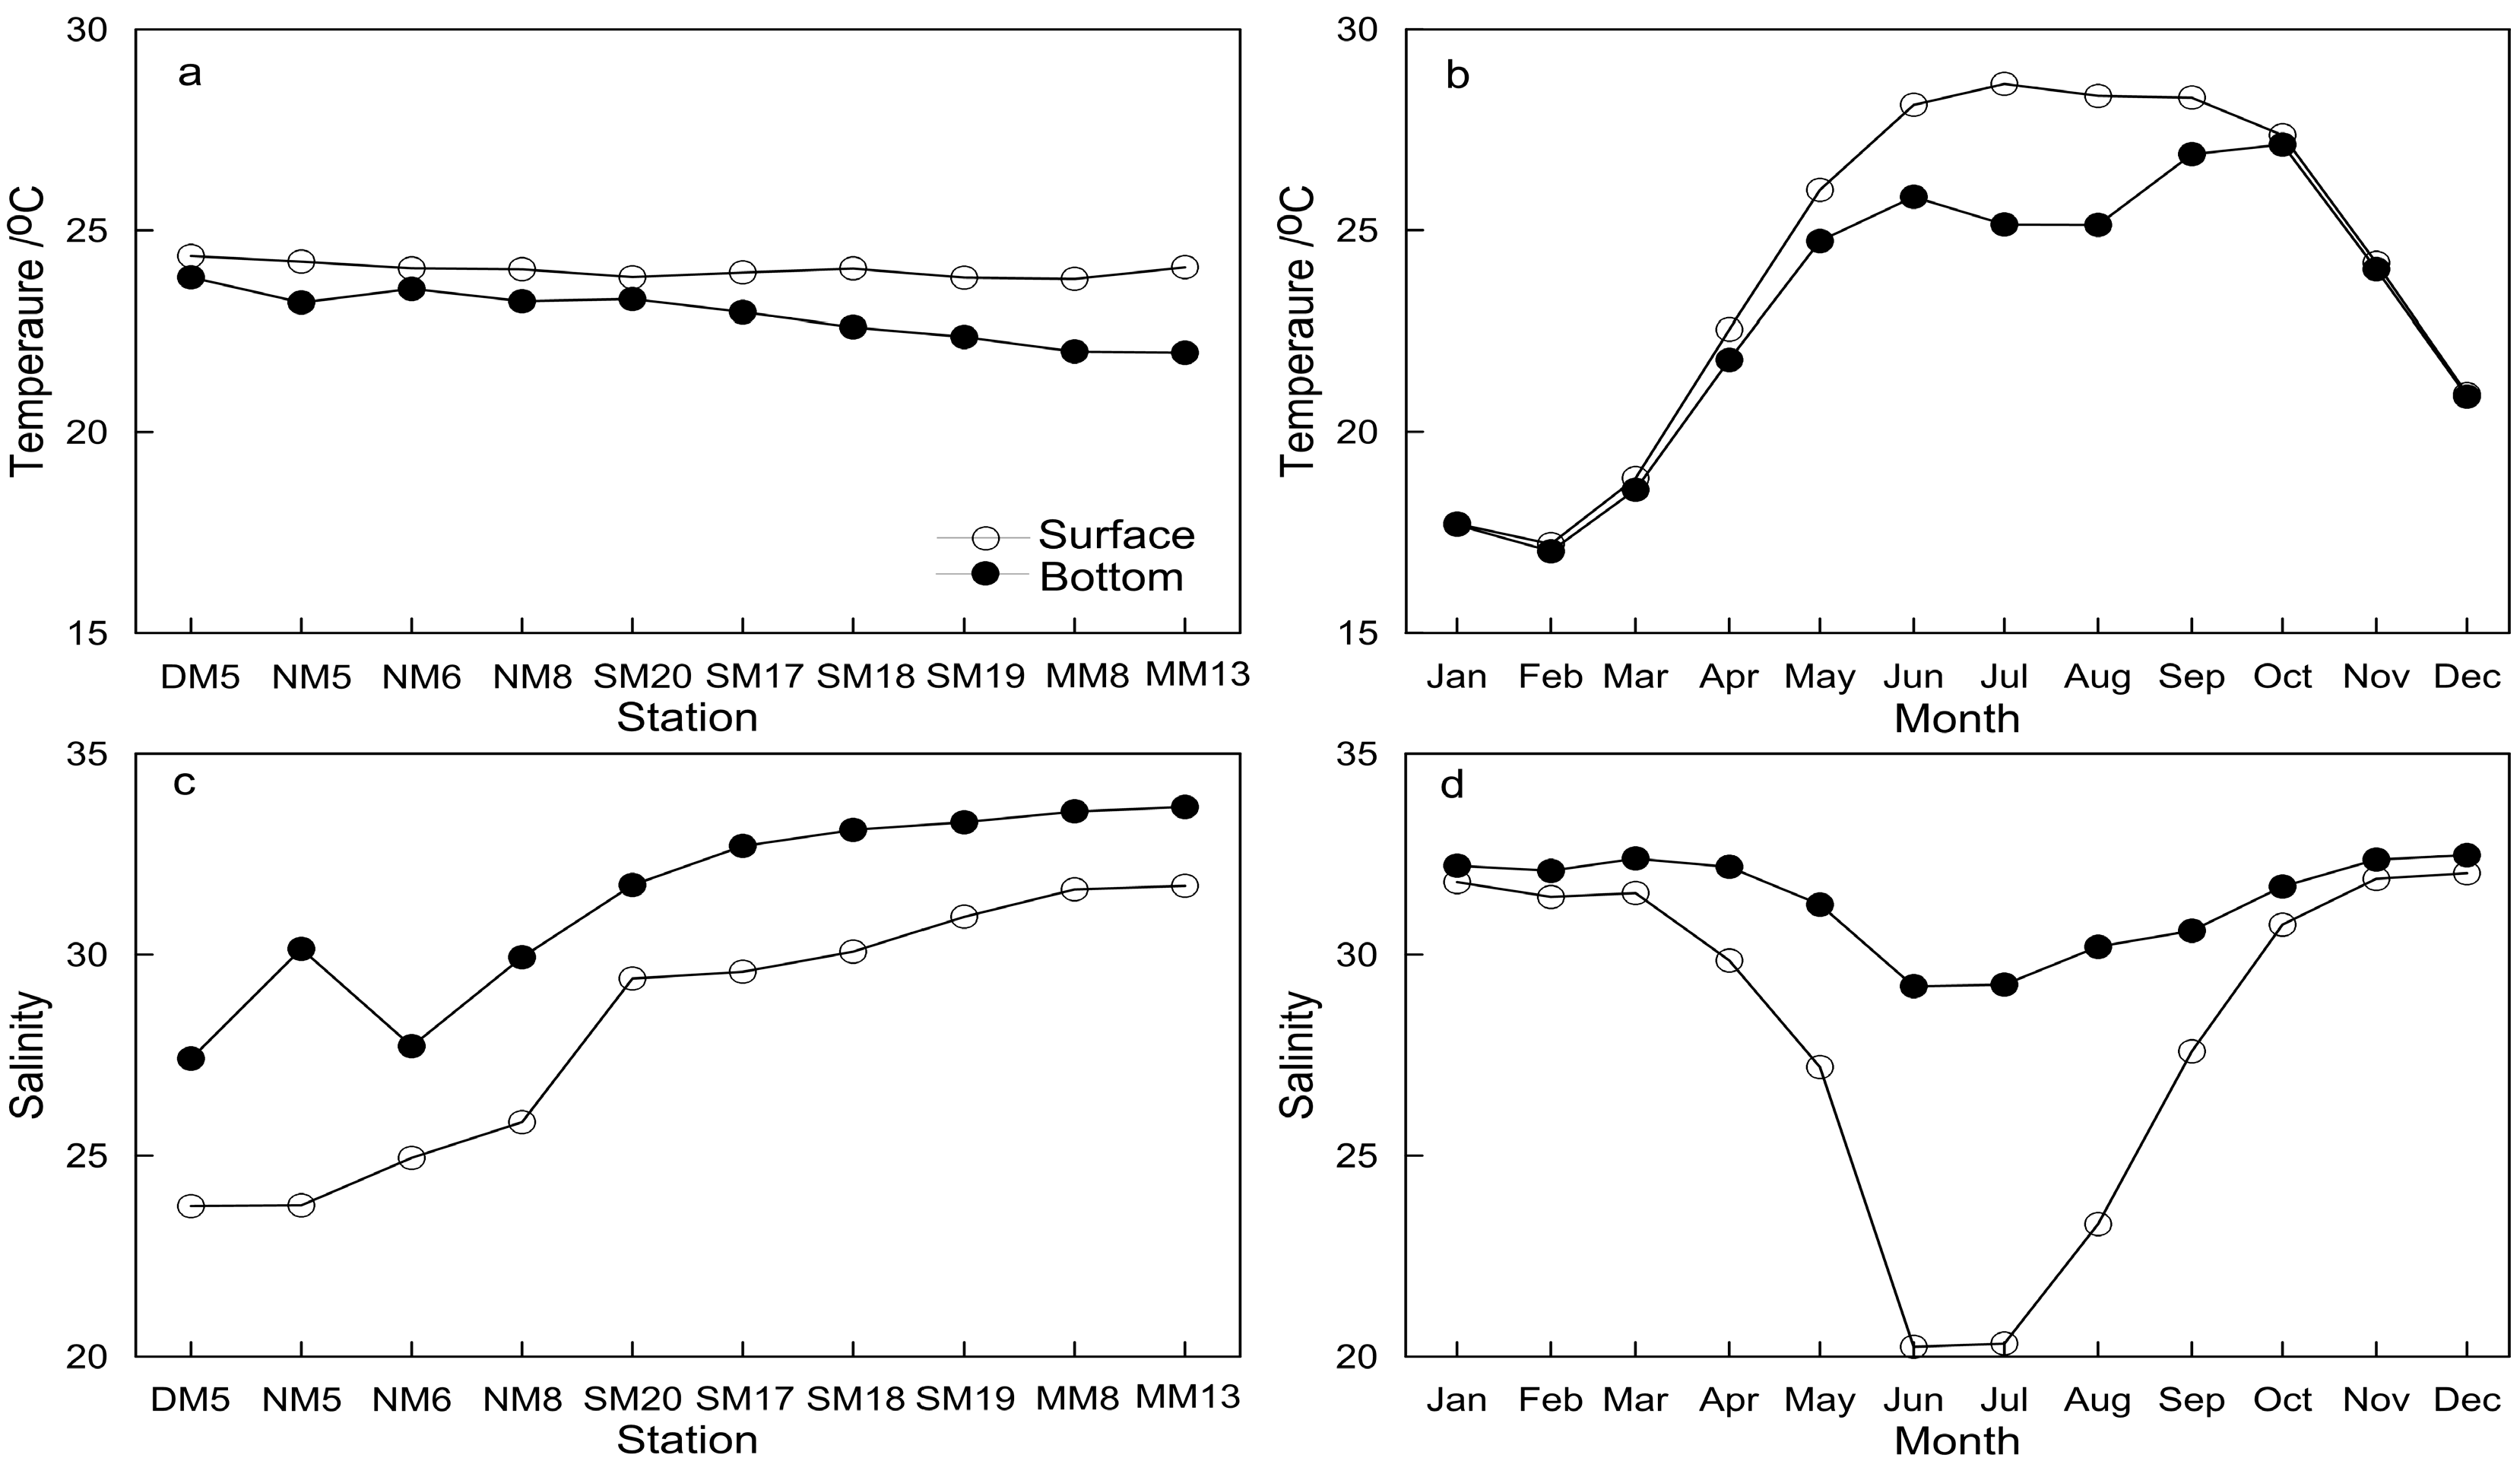
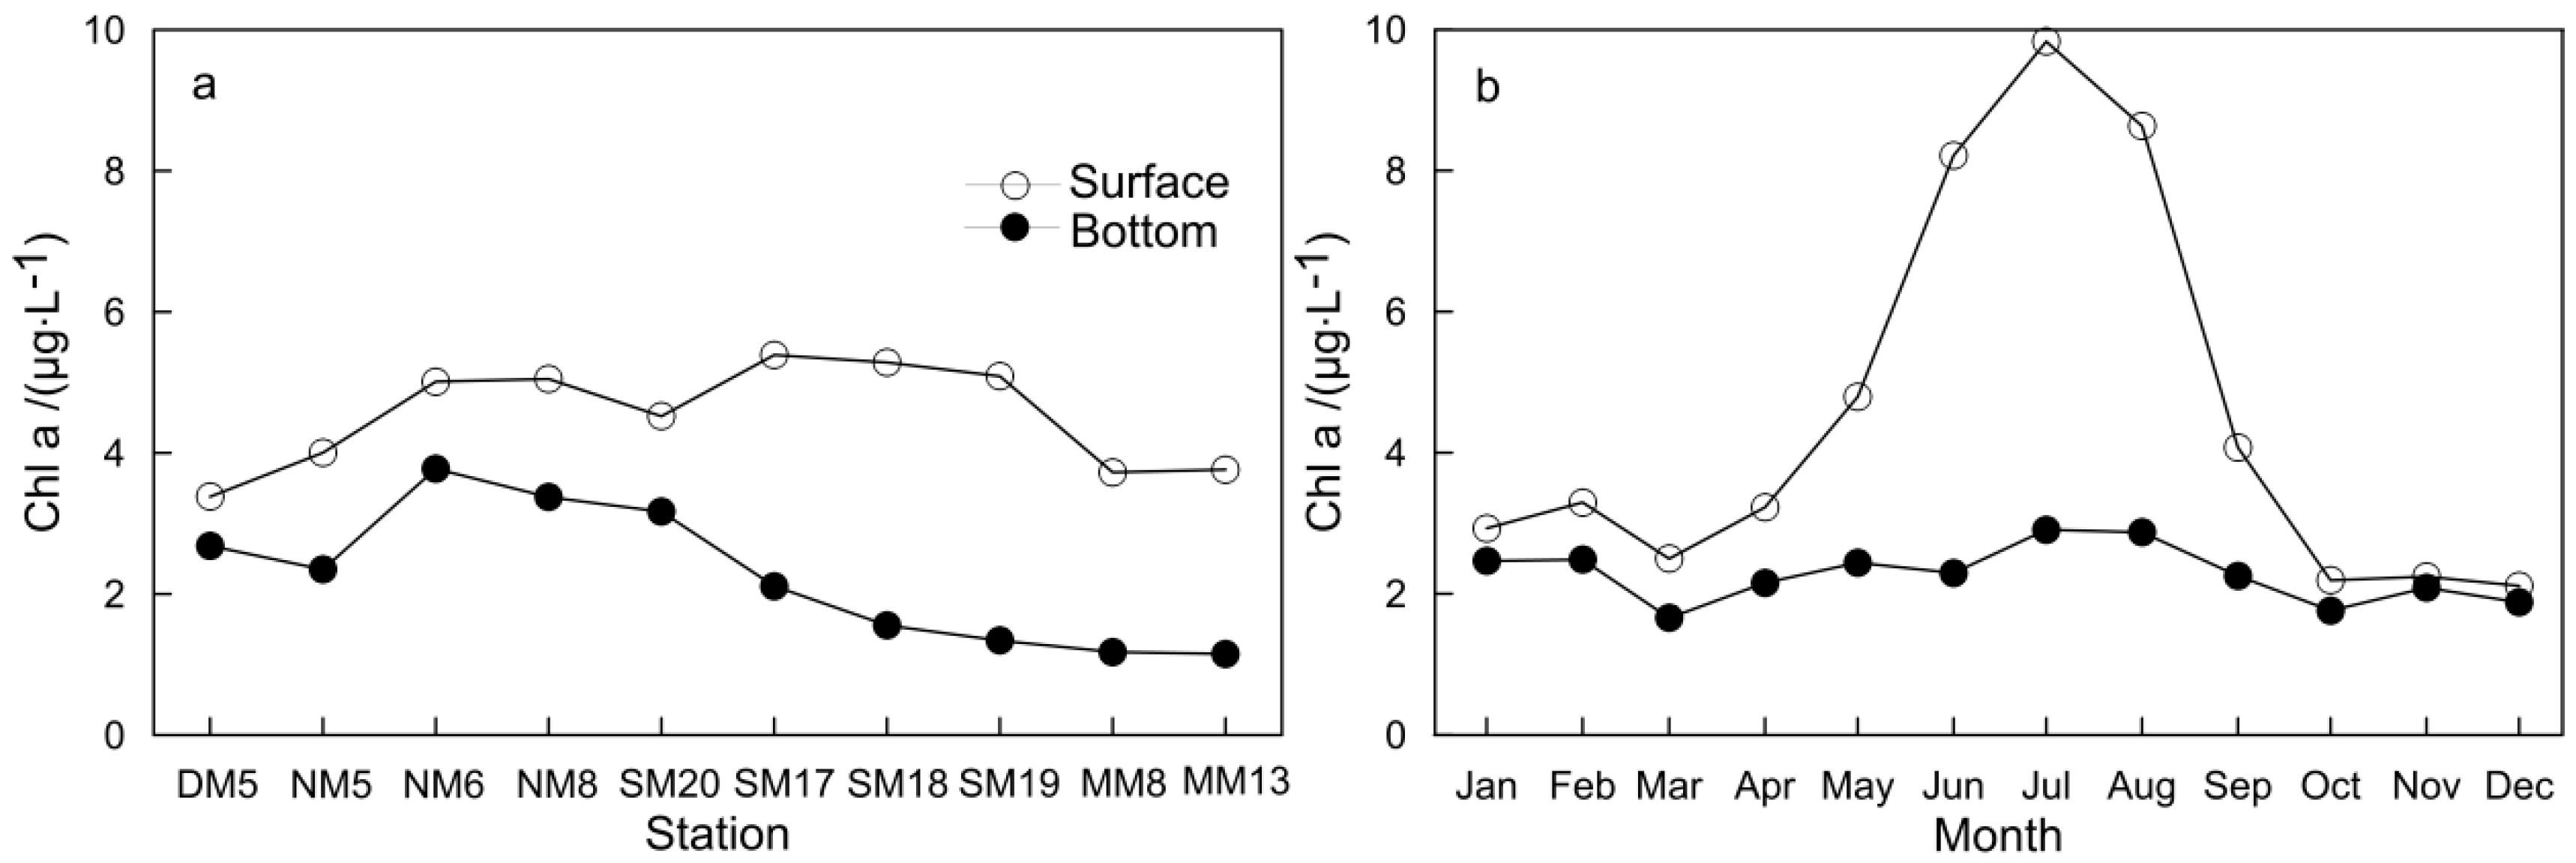
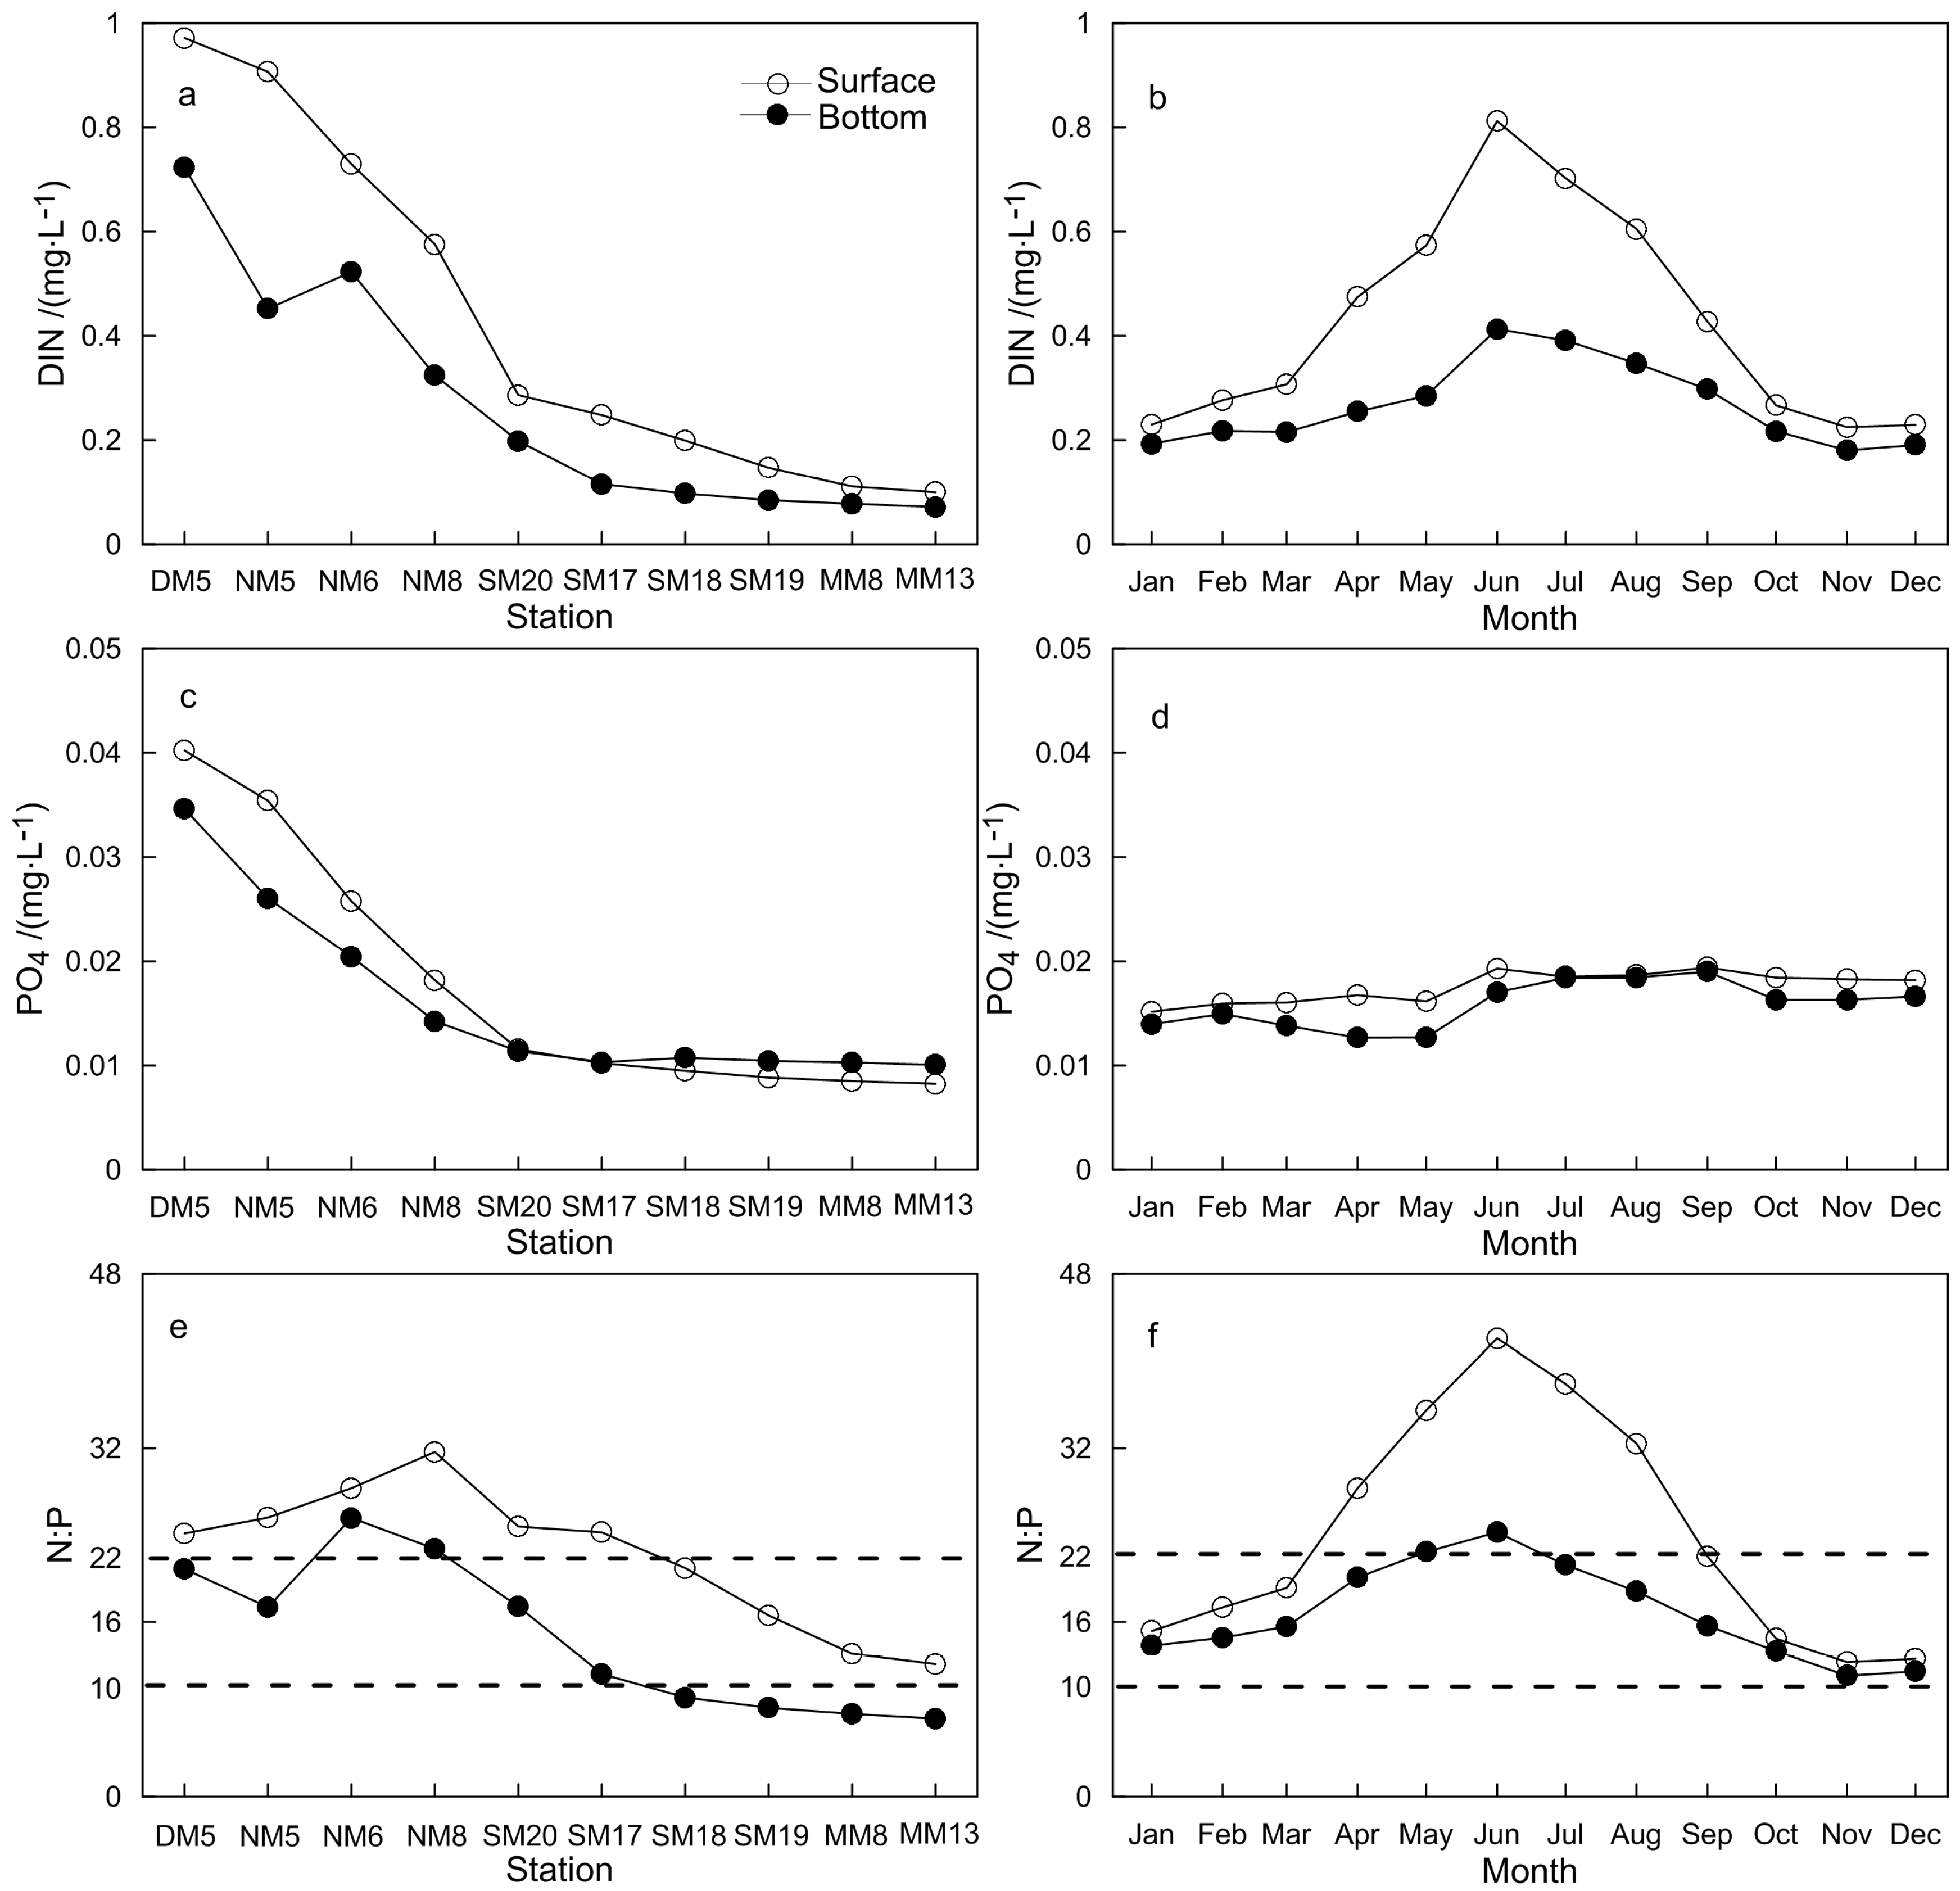
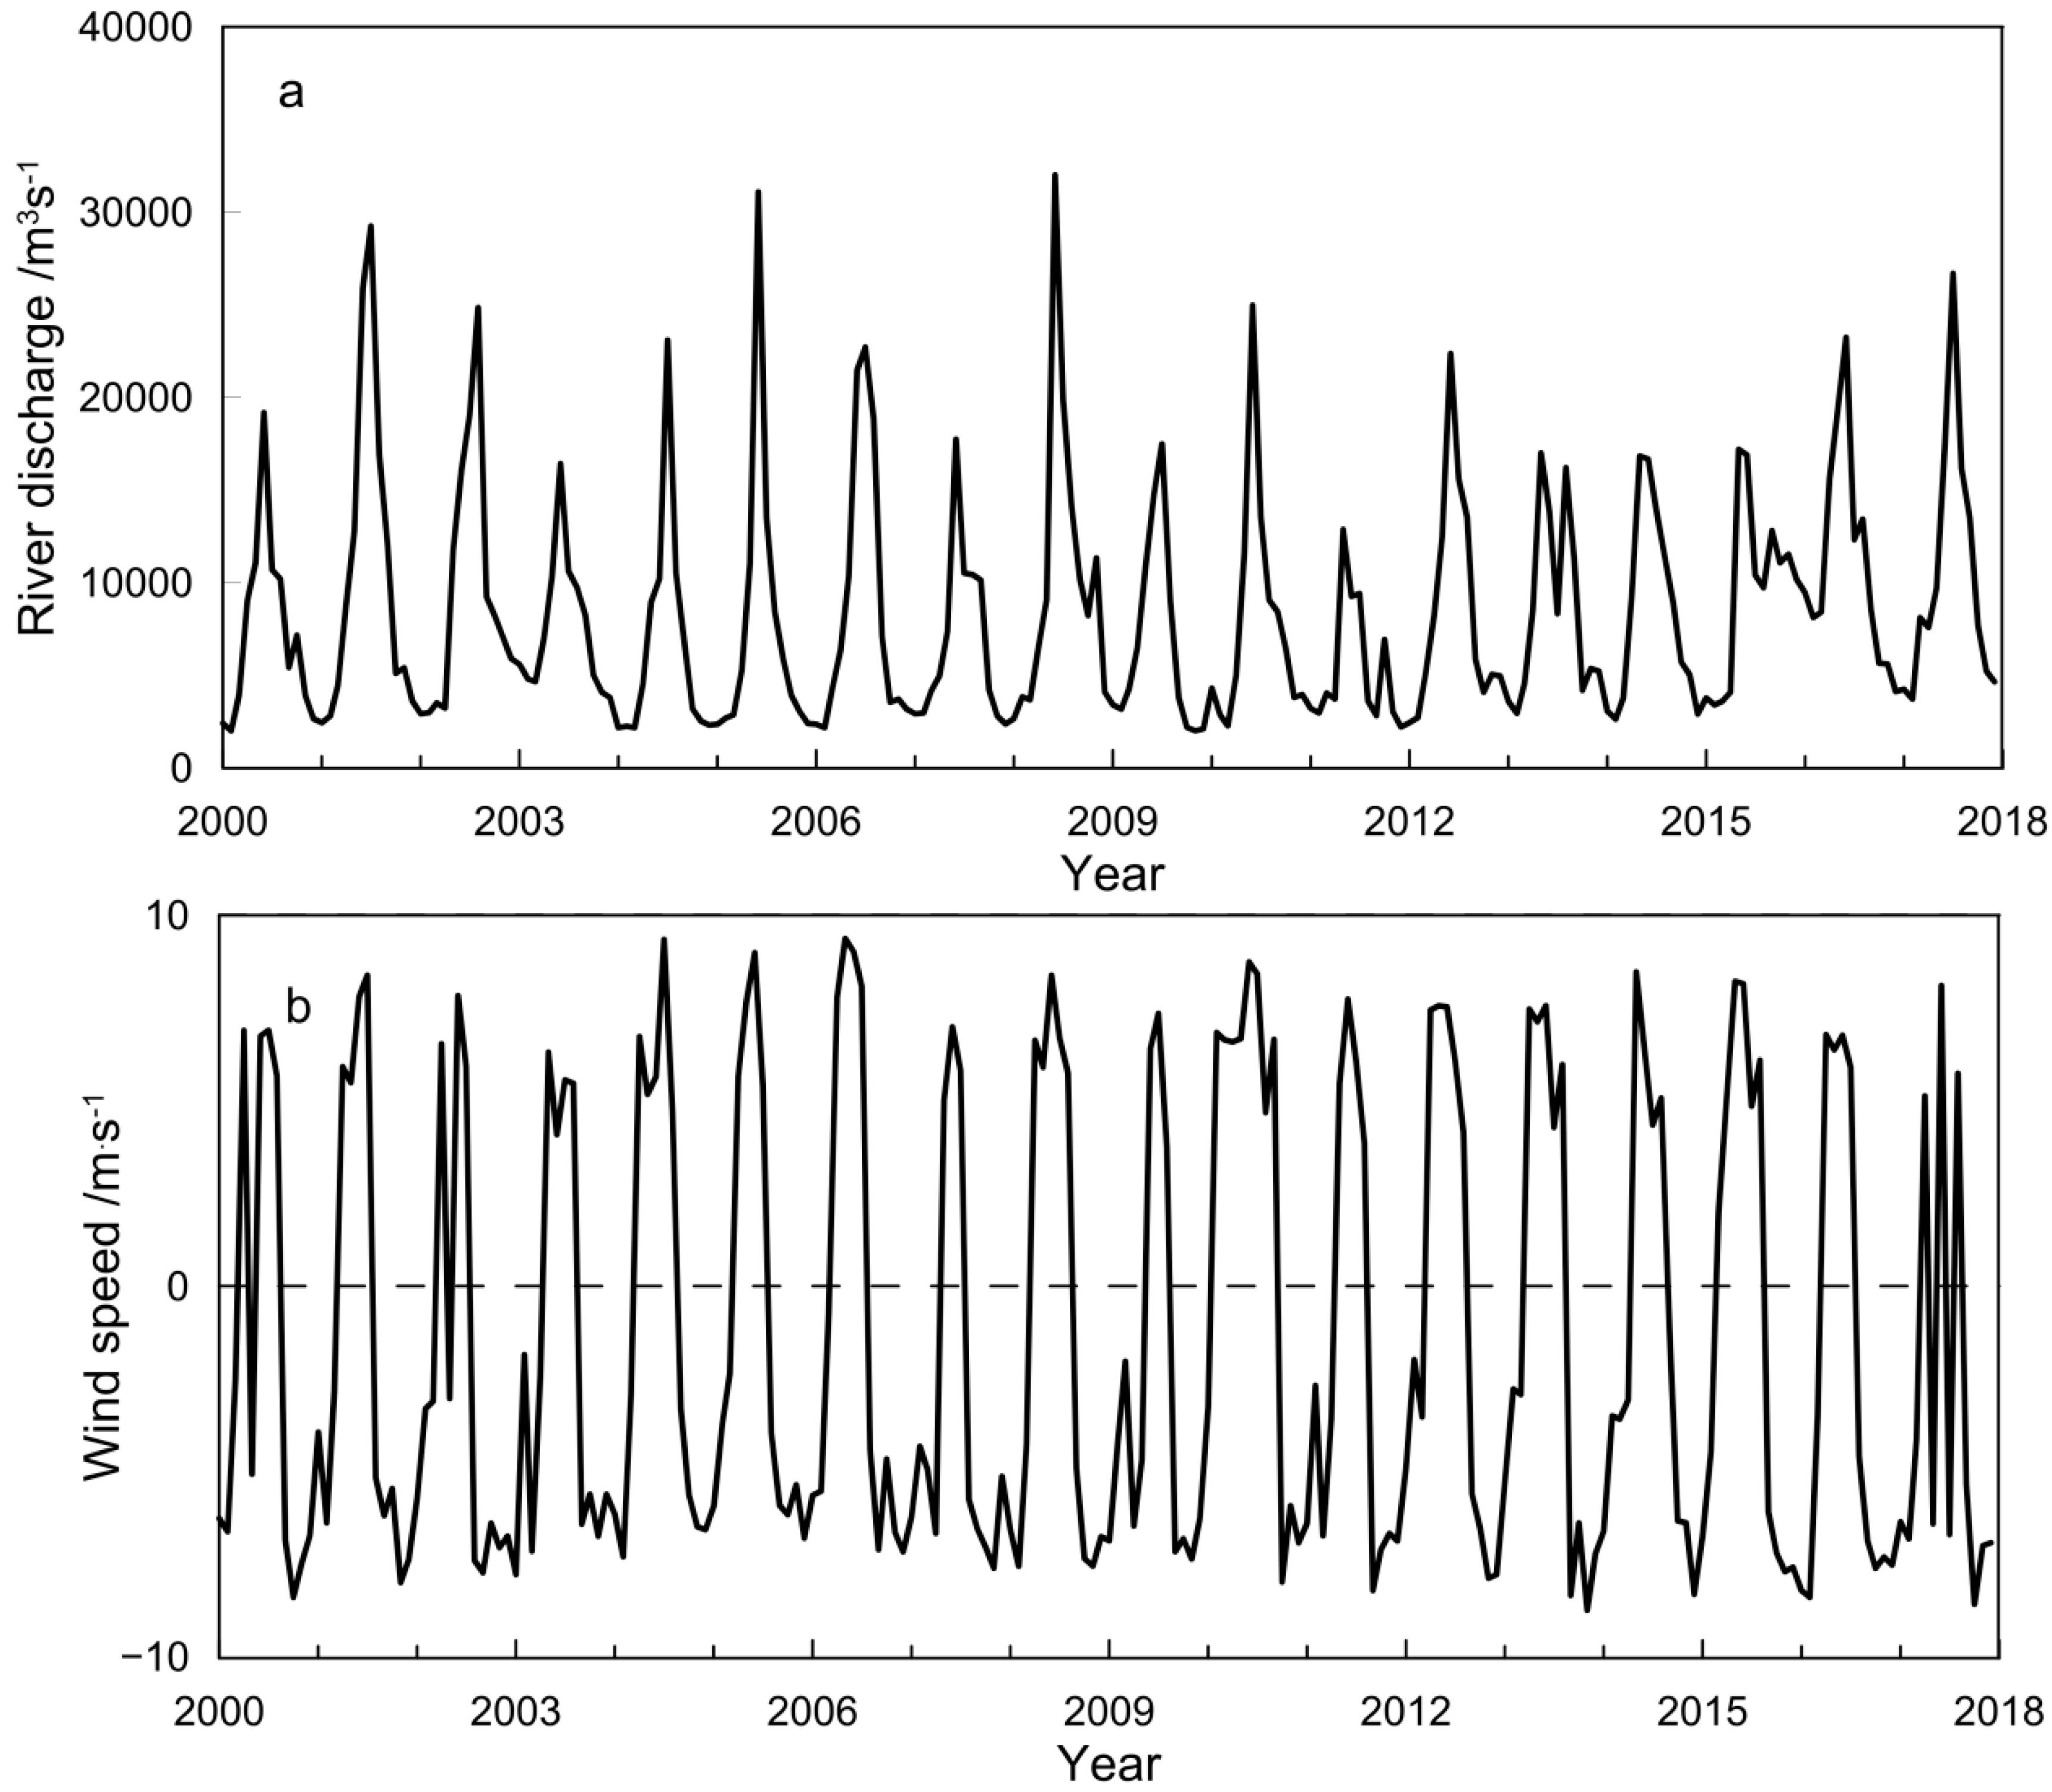
3.1. Characteristics of Main Environmental Factors
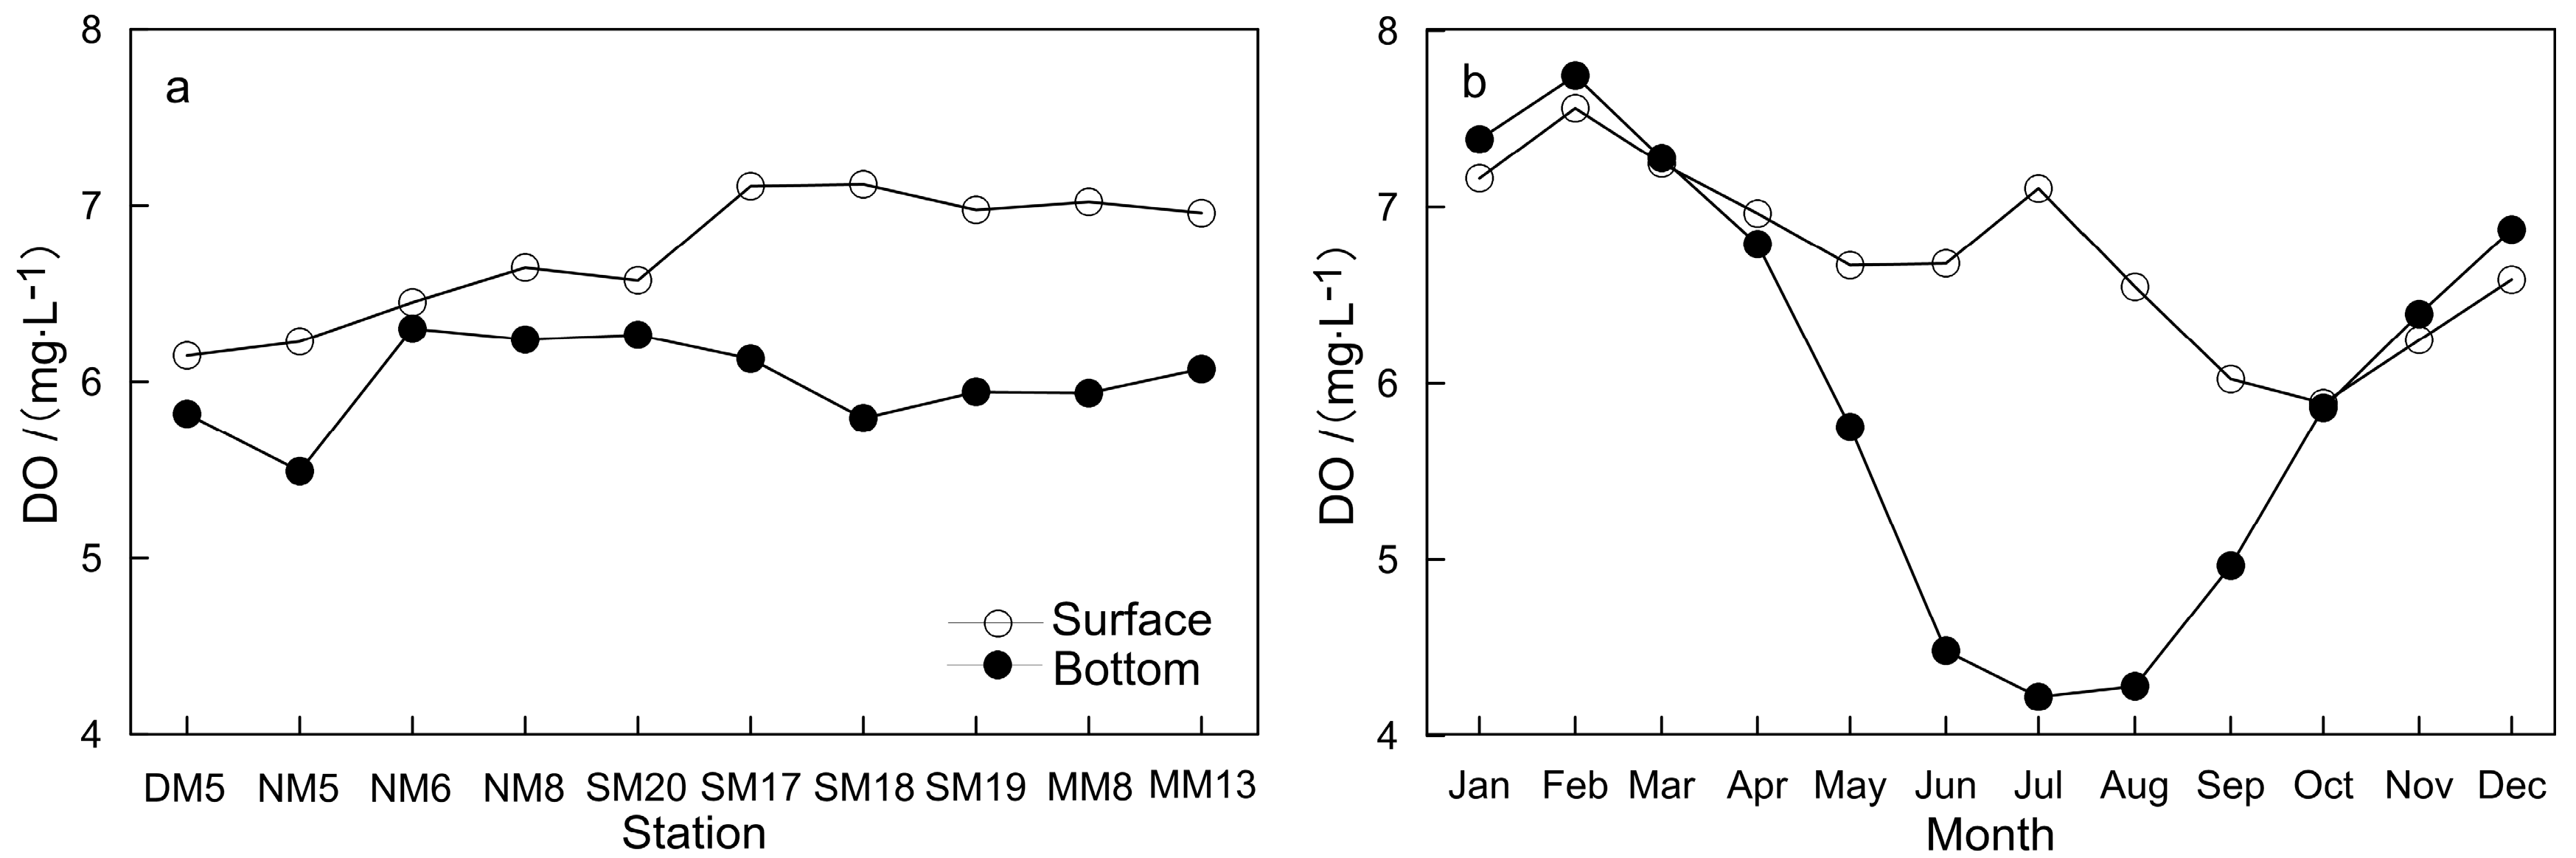
3.2. Characteristic of Dissolved Oxygen
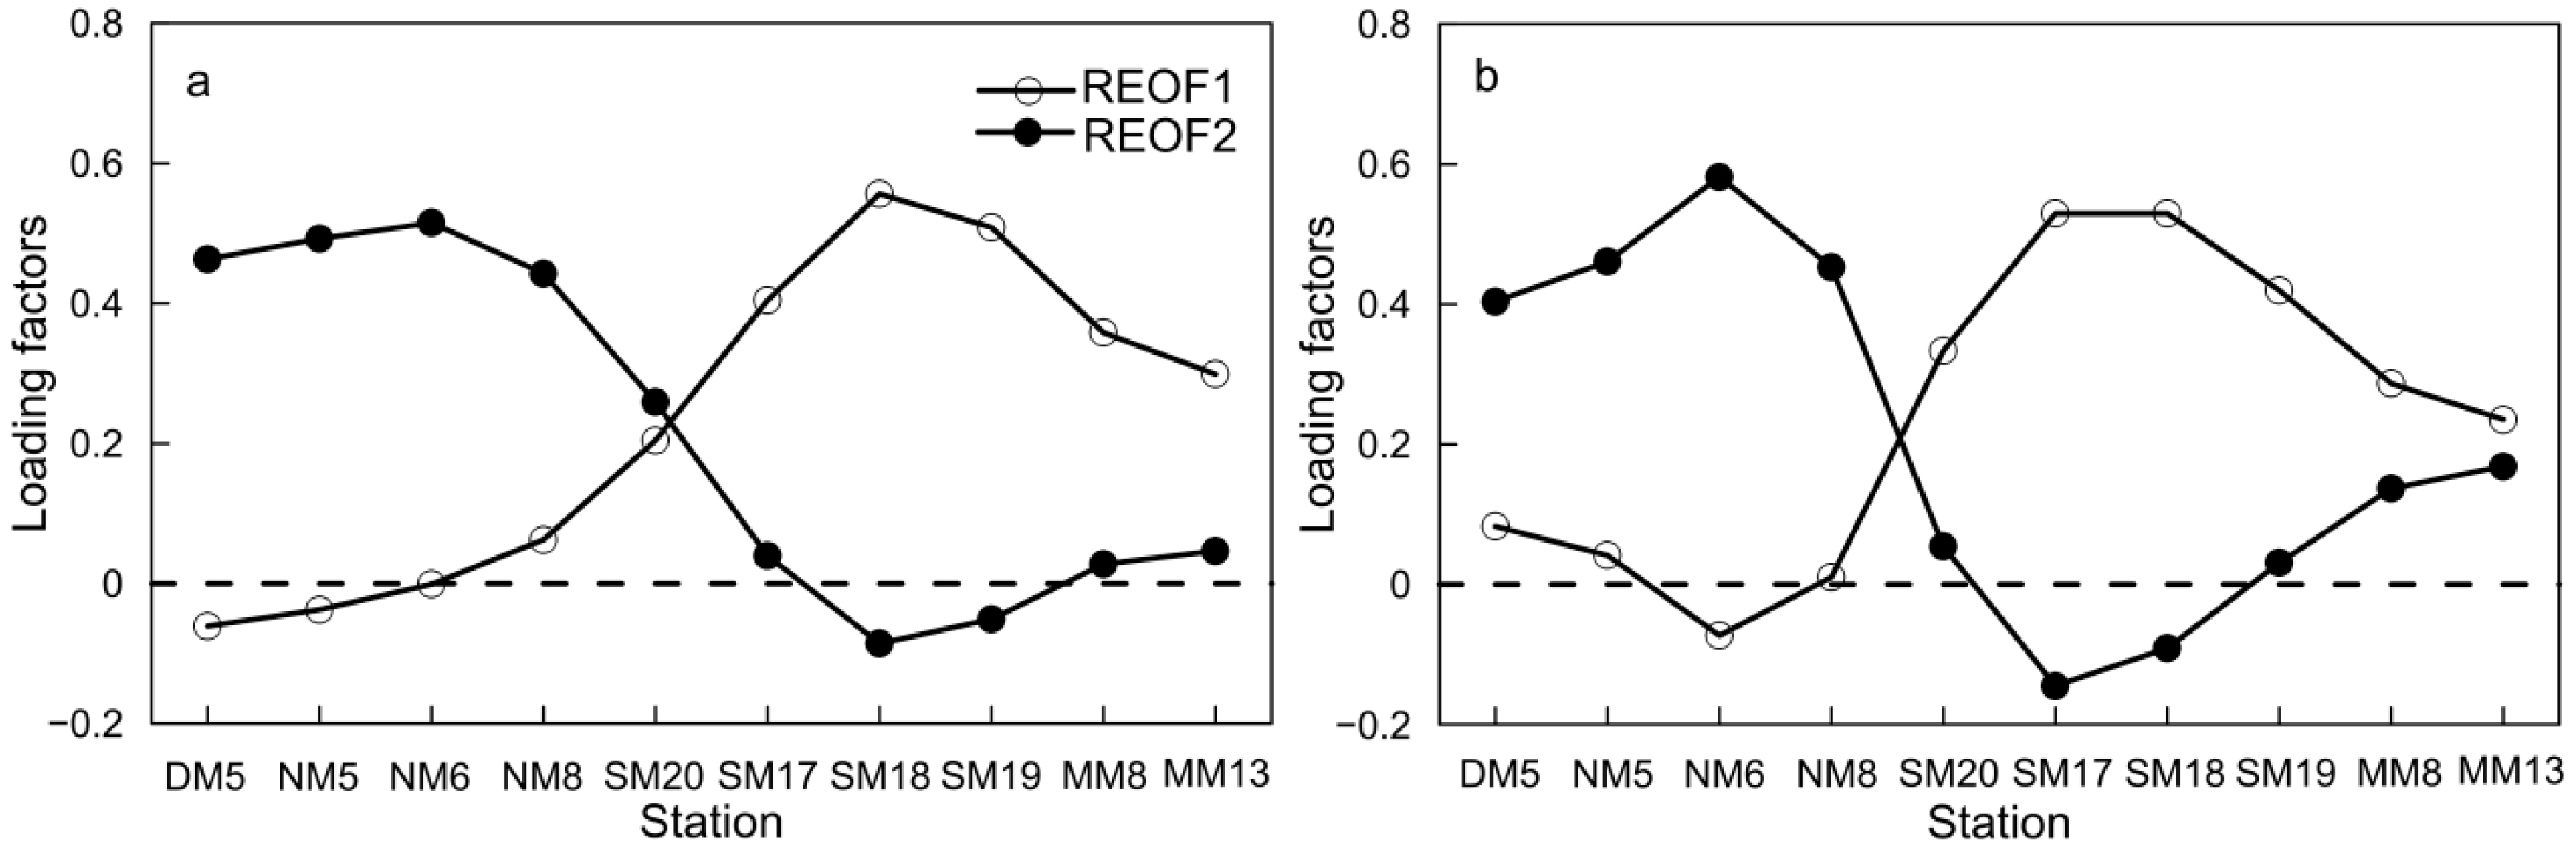
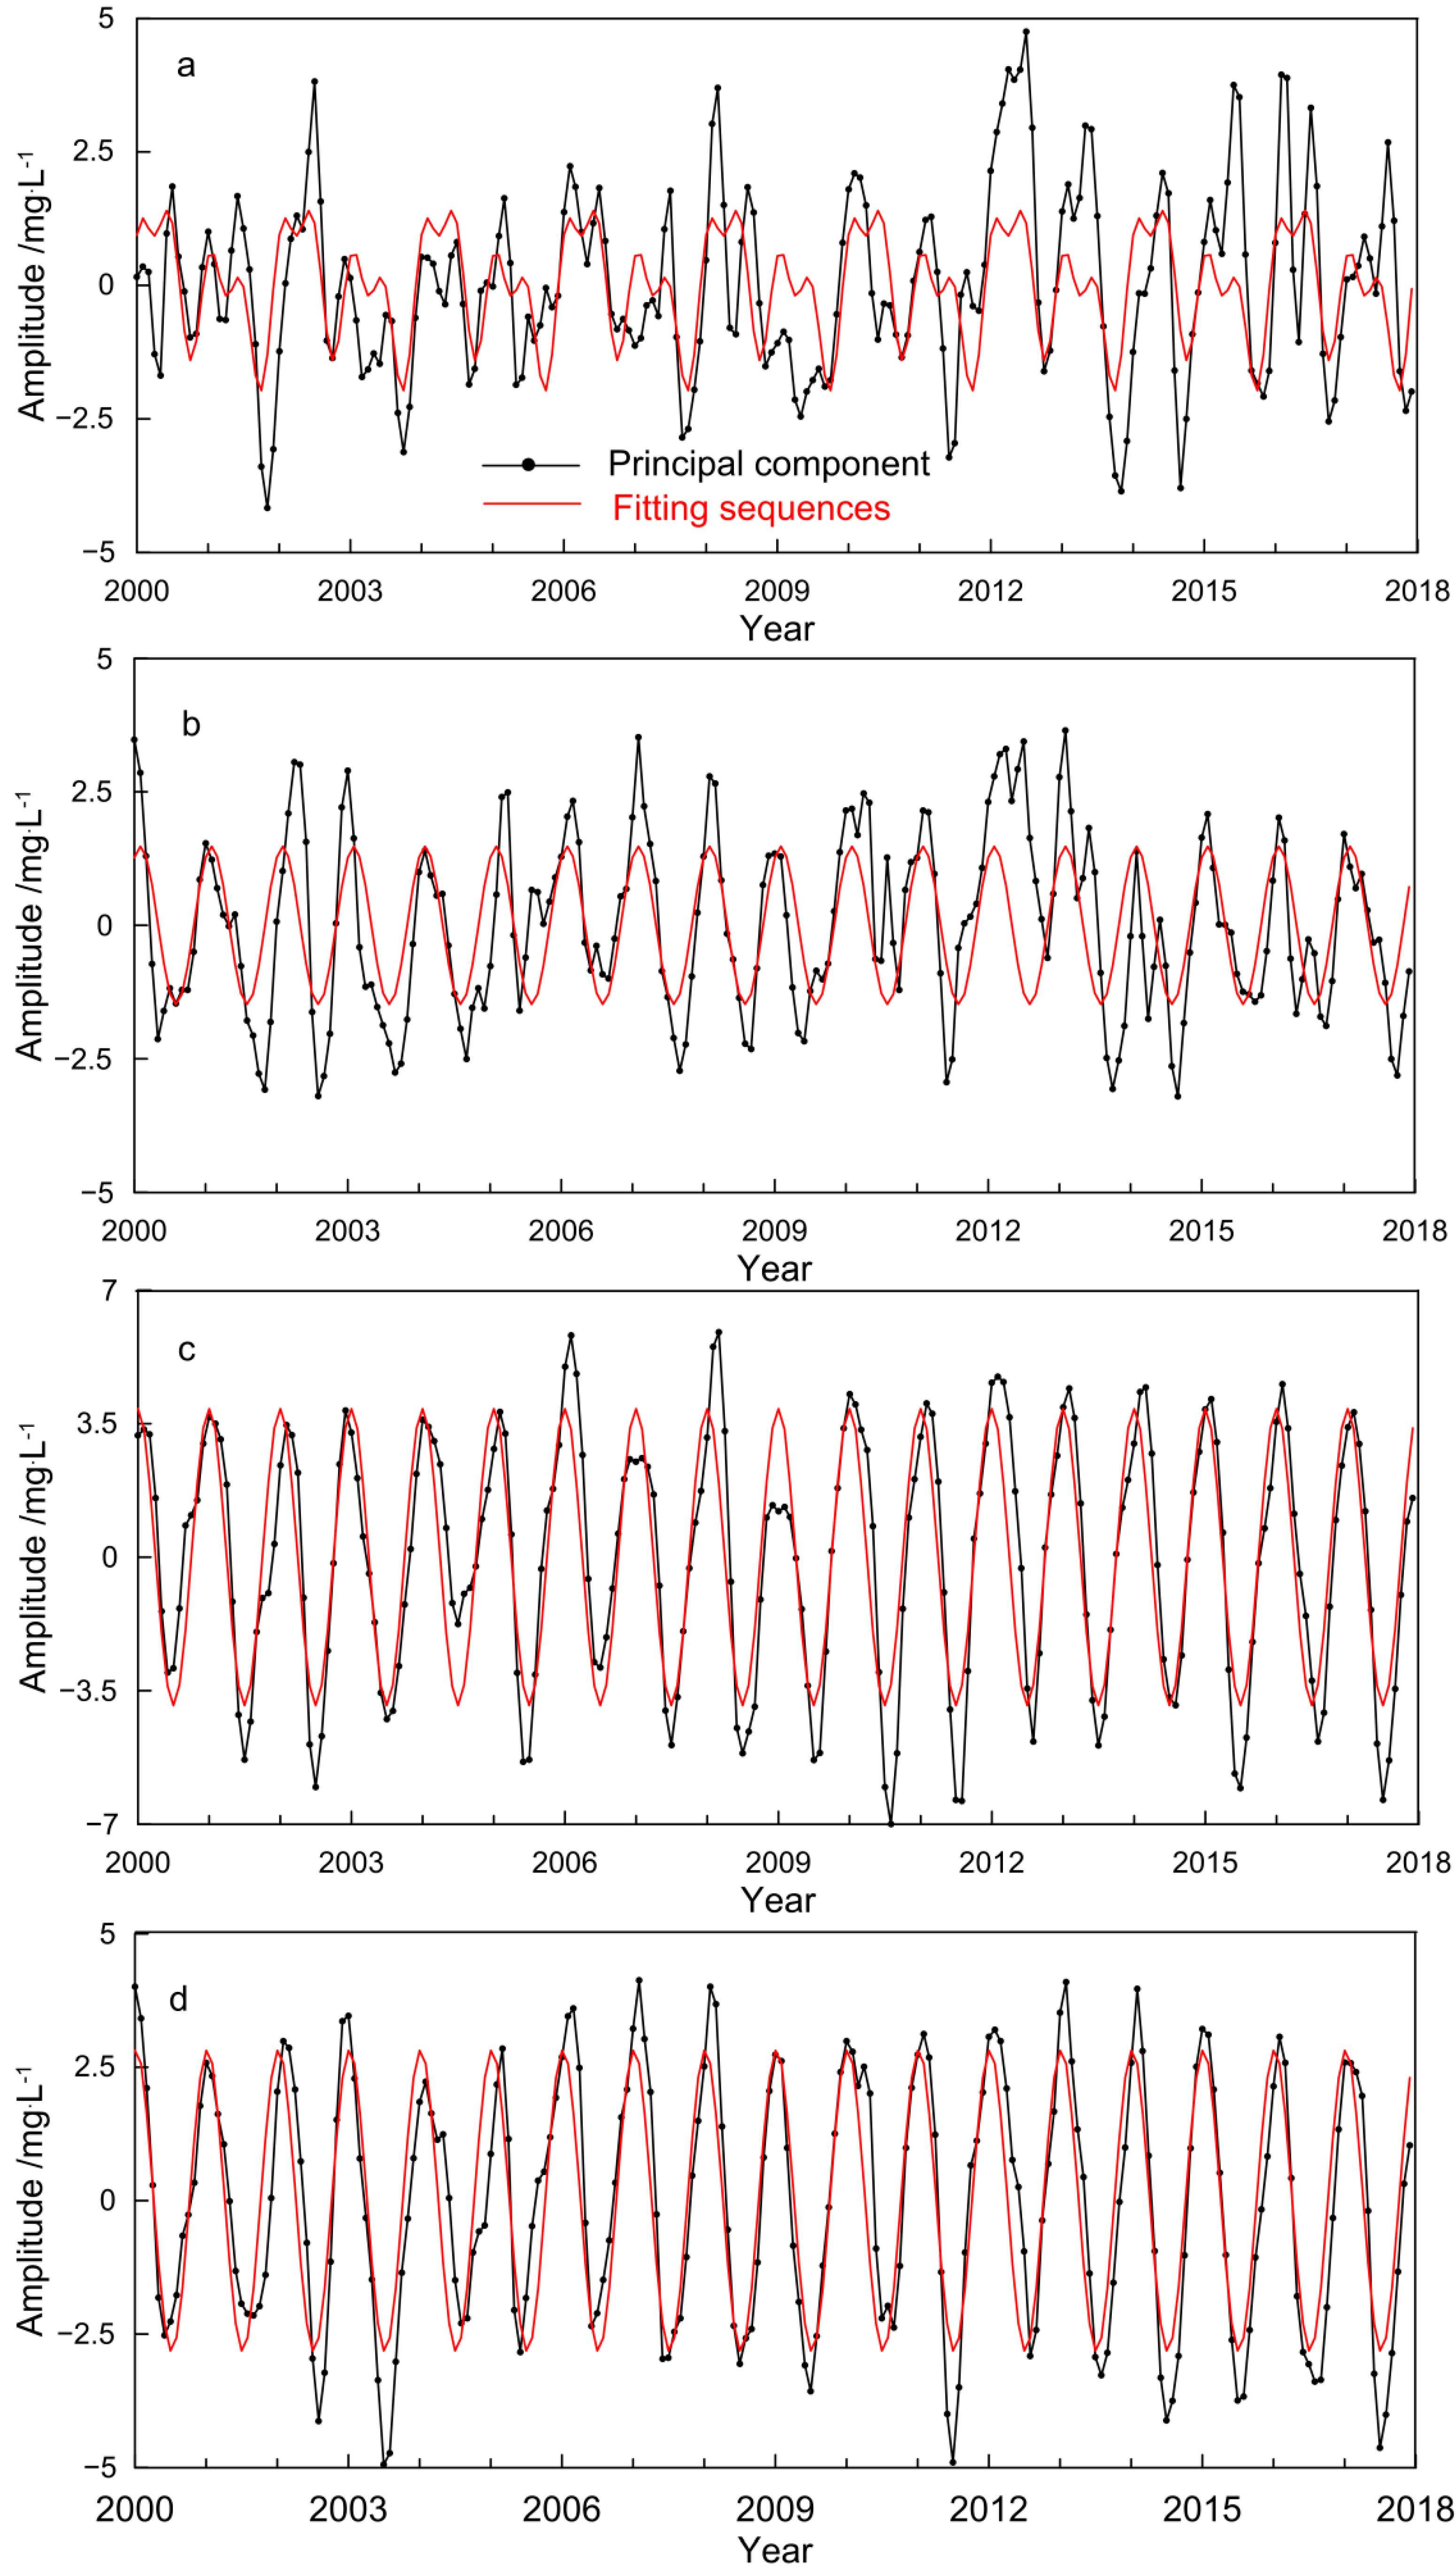
3.3. Spatial–Temporal Mode of Dissolved Oxygen
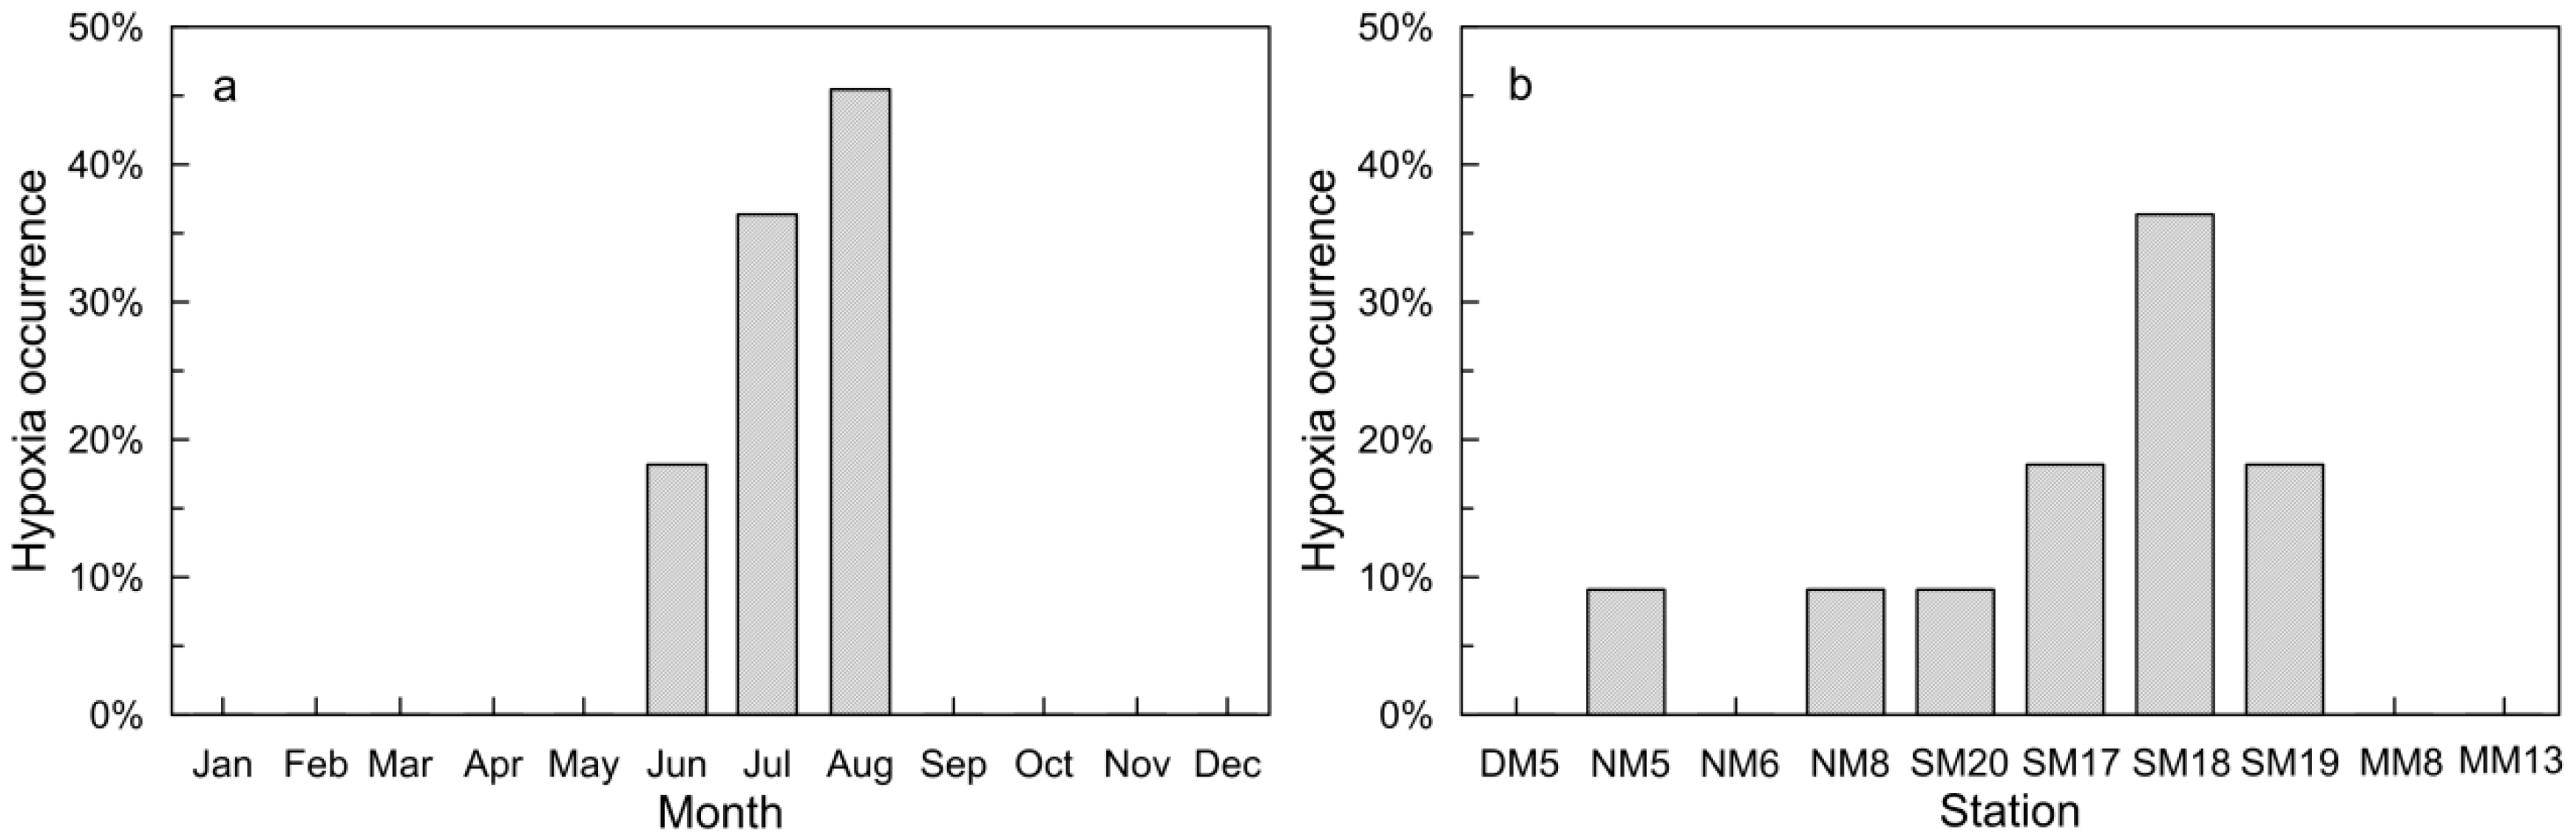
3.4. Bottom Hypoxia
4. Conclusions
Author Contributions
Funding
Acknowledgments
Conflicts of Interest
References
- Deutsch, C.; Brix, H.; Ito, T.; Frenzel, H.; Thompson, L. Climate-forced variability of ocean hypoxia. Science 2011, 333, 336. [Google Scholar] [CrossRef] [PubMed]
- Breitburg, D.; Levin, L.A.; Oschlies, A.; Grégoire, M.; Chavez, F.P.; Conley, D.J.; Garçon, V.; Gilbert, D.; Gutiérrez, D.; Isensee, K.; et al. Declining oxygen in the global ocean and coastal waters. Science 2018, 359, 46. [Google Scholar] [CrossRef]
- Grantham, B.A.; Chan, F.; Nielsen, K.J.; Fox, D.S.; Barth, J.A.; Huyer, A.; Lubchenco, J.; Menge, B.A. Upwelling-driven nearshore hypoxia signals ecosystem and oceanographic changes in the northeast Pacific. Nature 2004, 429, 749–754. [Google Scholar] [CrossRef] [PubMed]
- Diaz, R.J.; Rosenberg, R. Spreading dead zones and consequences for marine ecosystems. Science 2008, 321, 926–929. [Google Scholar] [CrossRef]
- Keeling, R.F.; Körtzinger, A.; Gruber, N. Ocean deoxygenation in a warming world. Annu. Rev. Mar. Sci. 2009, 2, 199–229. [Google Scholar] [CrossRef]
- Li, X.A.; Yu, Z.M.; Song, X.; Cao, X.; Yuan, L.Y. The seasonal characteristics of dissolved oxygen distribution and hypoxia in the Changjiang Estuary. J. Coast. Res. 2011, 27, 52–62. [Google Scholar] [CrossRef]
- Schmidtko, S.; Stramma, L.; Visbeck, M. Decline in global oceanic oxygen content during the past five decades. Nature 2017, 542, 335. [Google Scholar] [CrossRef]
- Diaz, R.J. Overview of hypoxia around the world. J. Environ. Qual. 2001, 30, 275–281. [Google Scholar] [CrossRef]
- Yin, K.D.; Lin, Z.F.; Ke, Z.Y. Temporal and spatial distribution of dissolved oxygen in the Pearl River Estuary and adjacent coastal waters. Cont. Shelf Res. 2004, 24, 1935–1948. [Google Scholar] [CrossRef]
- Chen, C.-T.A.; Wang, S.-L.; Lu, X.-X.; Zhang, S.-R.; Lui, H.-K.; Tseng, H.-C.; Wang, B.-J.; Huang, H.-I. Hydrogeochemistry and greenhouse gases of the Pearl River, its estuary and beyond. Quat. Int. 2008, 186, 79–90. [Google Scholar] [CrossRef]
- Lui, H.-K.; Chen, C.-T.A. The nonlinear relationship between nutrient ratios and salinity in estuarine ecosystems: Implications for management. Curr. Opin. Environ. Sustain. 2012, 4, 227–232. [Google Scholar] [CrossRef]
- Rabalais, N.N.; Díaz, R.J.; Levin, L.A.; Turner, R.E.; Gilbert, D.; Zhang, J. Dynamics and distribution of natural and human-caused coastal hypoxia. Biogeosci. Discuss. 2009, 6. [Google Scholar] [CrossRef]
- Tian, R. Factors controlling hypoxia occurrence in Estuaries, Chester River, Chesapeake Bay. Water 2020, 12, 1961. [Google Scholar] [CrossRef]
- Cai, W.-J.; Dai, M.H.; Wang, Y.C.; Zhai, W.D.; Huang, T.; Chen, S.T.; Zhang, F.; Chen, Z.Z.; Wang, Z.H. The biogeochemistry of inorganic carbon and nutrients in the Pearl River estuary and the adjacent Northern South China Sea. Cont. Shelf Res. 2004, 24, 1301–1319. [Google Scholar] [CrossRef]
- Harrison, P.J.; Yin, K.D.; Lee, J.H.W.; Gan, J.P.; Liu, H.B. Physical–biological coupling in the Pearl River Estuary. Cont. Shelf Res. 2008, 28, 1405–1415. [Google Scholar] [CrossRef]
- Dai, M.H.; Guo, X.H.; Zhai, W.D.; Yuan, L.Y.; Wang, B.W.; Wang, L.F.; Cai, P.H.; Tang, T.T.; Cai, W.J. Oxygen depletion in the upper reach of the Pearl River estuary during a winter drought. Mar. Chem. 2006, 102, 159–169. [Google Scholar] [CrossRef]
- Su, J.L. Overview of the South China Sea circulation and its influence on the coastal physical oceanography outside the Pearl River Estuary. Cont. Shelf Res. 2004, 24, 1745–1760. [Google Scholar] [CrossRef]
- Dong, L.X.; Su, J.L.; Wong, L.A.; Cao, Z.Y.; Chen, J.-C. Seasonal variation and dynamics of the Pearl River plume. Cont. Shelf Res. 2004, 24, 1761–1777. [Google Scholar] [CrossRef]
- Wong, L.A.; Chen, J.C.; Xue, H.; Dong, L.X.; Guan, W.B.; Su, J.L. A model study of the circulation in the Pearl River Estuary (PRE) and its adjacent coastal waters: 2. Sensitivity experiments. J. Geophys. Res. Oceans 2003, 108. [Google Scholar] [CrossRef]
- Lu, F.-H.; Ni, H.-G.; Liu, F.; Zeng, E.Y. Occurrence of nutrients in riverine runoff of the Pearl River Delta, South China. J. Hydrol. 2009, 376, 107–115. [Google Scholar] [CrossRef]
- He, B.Y.; Dai, M.H.; Zhai, W.D.; Guo, X.H.; Wang, L.F. Hypoxia in the upper reaches of the Pearl River Estuary and its maintenance mechanisms: A synthesis based on multiple year observations during 2000–2008. Mar. Chem. 2014, 167, 13–24. [Google Scholar] [CrossRef]
- Li, X.Q.; Lu, C.Q.; Zhang, Y.F.; Zhao, H.D.; Wang, J.Y.; Liu, H.B.; Yin, K.D. Low dissolved oxygen in the Pearl River estuary in summer: Long-term spatio-temporal patterns, trends, and regulating factors. Mar. Pollut. Bull. 2020, 151, 110814. [Google Scholar] [CrossRef]
- Qian, W.; Gan, J.P.; Liu, J.W.; He, B.Y.; Lu, Z.M.; Guo, X.H.; Wang, D.L.; Guo, L.G.; Huang, T.; Dai, M.H. Current status of emerging hypoxia in a eutrophic estuary: The lower reach of the Pearl River Estuary, China. Estuar. Coast. Shelf Sci. 2018, 205, 58–67. [Google Scholar] [CrossRef]
- Xu, J.; Yin, K.D.; Lee, J.H.W.; Liu, H.B.; Ho, A.Y.T.; Yuan, X.C.; Harrison, P.J. Long-term and seasonal changes in nutrients, phytoplankton biomass, and dissolved oxygen in Deep Bay, Hong Kong. Estuaries Coasts 2010, 33, 399–416. [Google Scholar] [CrossRef]
- Rabouille, C.; Conley, D.J.; Dai, M.H.; Cai, W.J.; Chen, C.T.A.; Lansard, B.; Green, R.; Yin, K.; Harrison, P.J.; Dagg, M.; et al. Comparison of hypoxia among four river-dominated ocean margins: The Changjiang (Yangtze), Mississippi, Pearl, and Rhône rivers. Cont. Shelf Res. 2008, 28, 1527–1537. [Google Scholar] [CrossRef]
- Luo, L.; Li, S.Y.; Wang, D.X. Hypoxia in the Pearl River Estuary, the South China Sea, in July 1999. Aquat. Ecosyst. Health Manag. 2009, 12, 418–428. [Google Scholar] [CrossRef]
- Hong, B.; Gong, W.P.; Peng, S.Q.; Xie, Q.; Wang, D.X.; Li, H.B.; Xu, H.Z. Characteristics of vertical exchange process in the Pearl River estuary. Aquat. Ecosyst. Health Manag. 2016, 19, 286–295. [Google Scholar] [CrossRef]
- Zhang, H.; Li, S.Y. Effects of physical and biochemical processes on the dissolved oxygen budget for the Pearl River Estuary during summer. J. Mar. Syst. 2010, 79, 65–88. [Google Scholar] [CrossRef]
- Wang, B.; Hu, J.T.; Li, S.Y.; Liu, D.H. A numerical analysis of biogeochemical controls with physical modulation on hypoxia during summer in the Pearl River estuary. Biogeosciences 2017, 14, 2979–2999. [Google Scholar] [CrossRef]
- Wang, B.; Hu, J.T.; Li, S.Y.; Yu, L.; Huang, J. Impacts of anthropogenic inputs on hypoxia and oxygen dynamics in the Pearl River estuary. Biogeosciences 2018, 15, 6105–6125. [Google Scholar] [CrossRef]
- Wei, X.; Zhan, H.G.; Ni, P.T.; Cai, S.Q. A model study of the effects of river discharges and winds on hypoxia in summer in the Pearl River Estuary. Mar. Pollut. Bull. 2016, 113, 414–427. [Google Scholar] [CrossRef] [PubMed]
- Lu, Z.M.; Gan, J.P.; Dai, M.H.; Liu, H.B.; Zhao, X.Z. Joint effects of extrinsic biophysical fluxes and intrinsic hydrodynamics on the formation of hypoxia west off the Pearl River Estuary. J. Geophys. Res. Oceans 2018, 123, 6241–6259. [Google Scholar] [CrossRef]
- Huang, J.; Hu, J.T.; Li, S.Y.; Wang, B.; Xu, Y.J.; Liang, B.; Liu, D.H. Effects of physical forcing on summertime hypoxia and oxygen dynamics in the Pearl River Estuary. Water 2019, 11, 2080. [Google Scholar] [CrossRef]
- Su, J.Z.; Dai, M.H.; He, B.Y.; Wang, L.F.; Gan, J.P.; Guo, X.H.; Zhao, H.D.; Yu, F.L. Tracing the origin of the oxygen-consuming organic matter in the hypoxic zone in a large eutrophic estuary: The lower reach of the Pearl River Estuary, China. Biogeosciences 2017, 14, 4085–4099. [Google Scholar] [CrossRef]
- Zhao, Y.Y.; Liu, J.; Uthaipan, K.; Song, X.; Xu, Y.; He, B.Y.; Liu, H.B.; Gan, J.P.; Dai, M.H. Dynamics of inorganic carbon and pH in a large subtropical continental shelf system: Interaction between eutrophication, hypoxia, and ocean acidification. Limnol. Oceanogr. 2020, 65. [Google Scholar] [CrossRef]
- Li, G.; Liu, J.X.; Diao, Z.H.; Jiang, X.; Li, J.J.; Ke, Z.X.; Shen, P.P.; Ren, L.J.; Huang, L.M.; Tan, Y.H. Subsurface low dissolved oxygen occurred at fresh- and saline-water intersection of the Pearl River estuary during the summer period. Mar. Pollut. Bull. 2018, 126, 585–591. [Google Scholar] [CrossRef]
- Cui, Y.S.; Wu, J.X.; Ren, J.; Xu, J. Physical dynamics structures and oxygen budget of summer hypoxia in the Pearl River Estuary. Limnol. Oceanogr. 2019, 64, 131–148. [Google Scholar] [CrossRef]
- Xu, J.; Yin, K.D.; Liu, H.B.; Lee, J.H.W.; Anderson, D.M.; Ho, A.Y.T.; Harrison, P.J. A comparison of eutrophication impacts in two harbours in Hong Kong with different hydrodynamics. J. Mar. Syst. 2010, 83, 276–286. [Google Scholar] [CrossRef]
- EPD. Marine Water Quality in Hong Kong in 2017; Environmental Protection Department (EPD), The Government of the Hong Kong Special Administrative Region: Hong Kong, China, 2018; pp. 1–32.
- ASTM. American Society for Testing and Materials Standards; American Society for Testing and Materials (ASTM): New York, NY, USA, 2001; p. 212. [Google Scholar]
- APHA. Standard Methods for the Examination of Water and Wastewater; American Public Health Association (APHA): Washington, DC, USA, 1995; p. 1268. [Google Scholar]
- Yin, K.D.; Harrison, P.J. Nitrogen over enrichment in subtropical Pearl River estuarine coastal waters: Possible causes and consequences. Cont. Shelf Res. 2008, 28, 1435–1442. [Google Scholar] [CrossRef]
- Lui, H.-K.; Chen, C.-T.A. Shifts in limiting nutrients in an estuary caused by mixing and biological activity. Limnol. Oceanogr. 2011, 56, 989–998. [Google Scholar] [CrossRef]
- Zhang, H.; Cheng, W.C.; Chen, Y.R.; Yu, L.Q.; Gong, W.P. Controls on the interannual variability of hypoxia in a subtropical embayment and its adjacent waters in the Guangdong coastal upwelling system, northern South China Sea. Ocean Dyn. 2018, 68, 923–938. [Google Scholar] [CrossRef]
- Richman, M.B. Rotation of principal components. J. Climatol. 1986, 6, 293–335. [Google Scholar] [CrossRef]
- Kaiser, H.F. The varimax criterion for analytic rotation in factor analysis. Psychometrika 1958, 23, 187–200. [Google Scholar] [CrossRef]
- Hannachi, A.; Jolliffe, I.T.; Stephenson, D.B.; Trendafilov, N. In search of simple structures in climate: Simplifying EOFs. Int. J. Climatol. 2006, 26, 7–28. [Google Scholar] [CrossRef]
- Redfield, A.C. The biological control of chemical factors in the environment. Am. Sci. 1958, 46, 205–221. [Google Scholar]
- Redfield, A.C.; Ketchum, B.H.; Richards, F.A. The Influence of Organisms on the Composition of Sea-Water; Interscience Publishers: New York, NY, USA, 1963; Volume 2, p. 554. [Google Scholar]
- Klausmeier, C.A.; Litchman, E.; Daufresne, T.; Levin, S.A. Optimal nitrogen-to-phosphorus stoichiometry of phytoplankton. Nature 2004, 429, 171–174. [Google Scholar] [CrossRef]
- Justić, D.; Rabalais, N.N.; Turner, R.E.; Dortch, Q. Changes in nutrient structure of river-dominated coastal waters: Stoichiometric nutrient balance and its consequences. Estuar. Coast. Shelf Sci. 1995, 40, 339–356. [Google Scholar] [CrossRef]
- Yin, K.D. Monsoonal influence on seasonal variations in nutrients and phytoplankton biomass in coastal waters of Hong Kong in the vicinity of the Pearl River estuary. Mar. Ecol. Prog. Ser. 2002, 245. [Google Scholar] [CrossRef]
- Shapiro, R. Smoothing, filtering, and boundary effects. Rev. Geophys. 1970, 8, 359–387. [Google Scholar] [CrossRef]
- Zhang, Z.; Moore, J.C. Chapter 6—Empirical orthogonal functions. In Mathematical and Physical Fundamentals of Climate Change; Zhang, Z., Moore, J.C., Eds.; Elsevier: Boston, MA, USA, 2015; pp. 161–197. [Google Scholar] [CrossRef]
- Lian, T.; Chen, D.K. An evaluation of rotated EOF analysis and its application to tropical Pacific SST variability. J. Clim. 2012, 25, 5361–5373. [Google Scholar] [CrossRef]
- Zheng, S.; Guan, W.; Cai, S.; Wei, X.; Huang, D. A model study of the effects of river discharges and interannual variation of winds on the plume front in winter in Pearl River Estuary. Cont. Shelf Res. 2014, 73, 31–40. [Google Scholar] [CrossRef]
- Kralj, M.; Lipizer, M.; Čermelj, B.; Celio, M.; Fabbro, C.; Brunetti, F.; Francé, J.; Mozetič, P.; Giani, M. Hypoxia and dissolved oxygen trends in the northeastern Adriatic Sea (Gulf of Trieste). Deep Sea Res. Part II 2019, 164, 74–88. [Google Scholar] [CrossRef]
- Rabalais, N.N.; Turner, R.E. Gulf of Mexico Hypoxia: Past, present, and future. Limnol. Oceanogr. Bull. 2019, 28, 117–124. [Google Scholar] [CrossRef]
- Dai, M.H.; Wang, L.F.; Guo, X.H.; Zhai, W.D.; Li, Q.; He, B.Y.; Kao, S.J. Nitrification and inorganic nitrogen distribution in a large perturbed river/estuarine system: The Pearl River Estuary, China. Biogeosciences 2008, 5, 1227–1244. [Google Scholar] [CrossRef]
- Dai, M.H.; Zhai, W.D.; Cai, W.-J.; Callahan, J.; Huang, B.Q.; Shang, S.L.; Huang, T.; Li, X.L.; Lu, Z.M.; Chen, W.F.; et al. Effects of an estuarine plume-associated bloom on the carbonate system in the lower reaches of the Pearl River estuary and the coastal zone of the northern South China Sea. Cont. Shelf Res. 2008, 28, 1416–1423. [Google Scholar] [CrossRef]
- Yin, K.; Qian, P.-Y.; Chen, J.C.; Hsieh, D.P.; Harrison, P.J. Dynamics of nutrients and phytoplankton biomass in the Pearl River estuary and adjacent waters of Hong Kong during summer: Preliminary evidence for phosphorus and silicon limitation. Mar. Ecol. Prog. Ser. 2000, 194, 295–305. [Google Scholar] [CrossRef]


| Method | Layer | Mode | DO | Temperature | Salinity | Chl a | DIN | PO4 |
|---|---|---|---|---|---|---|---|---|
| EOF | Surface | 1 | 69.2 | 98.7 | 94.3 | 60.7 | 90.7 | 69.7 |
| 2 | 18.0 | 0.7 | 3.7 | 23.8 | 5.5 | 18.1 | ||
| Bottom | 1 | 92.4 | 96.8 | 89.1 | 64.7 | 85.3 | 66.9 | |
| 2 | 3.3 | 2.3 | 5.4 | 21.4 | 7.9 | 18.3 | ||
| REOF | Surface | 1 | 45.6 | 52.2 | 75.5 | 55.9 | 82.0 | 69.6 |
| 2 | 41.6 | 47.2 | 22.5 | 28.6 | 14.2 | 18.1 | ||
| Bottom | 1 | 62.3 | 66.2 | 88.6 | 48.6 | 74.5 | 61.1 | |
| 2 | 33.4 | 32.9 | 6.0 | 37.5 | 18.7 | 24.1 |
| Layer | Mode | Temperature | Salinity | Chl a | DIN | PO4 |
|---|---|---|---|---|---|---|
| Surface | 1 | 0.84 ** | −0.95 ** | 0.99 ** | −0.94 ** | −0.94 ** |
| 2 | 0.91 ** | −0.96 ** | 0.93 ** | −0.85 ** | −0.94 ** | |
| Bottom | 1 | −0.61 *** | −0.83 ** | −0.48 *** | −0.81 ** | −0.87 ** |
| 2 | −0.66 * | −0.67 * | 0.61 *** | −0.16 *** | −0.85 ** |
| Layer | Mode | DO | Temperature | Salinity | Chl a | DIN | PO4 |
|---|---|---|---|---|---|---|---|
| Surface | 1 | 6,12,24 | 12 | 12 | 12 | 12 | 12 |
| 2 | 12 | 12 | 6,12 | -- | 6,12 | -- | |
| Bottom | 1 | 12 | 12 | 12 | -- | 12 | 12 |
| 2 | 12 | 6,12 | 12 | -- | 12 | -- |
| Layer | Mode | DO | Temperature | Salinity | Chl a | DIN | PO4 |
|---|---|---|---|---|---|---|---|
| Surface | 1 | 0.61 ** | 0.97 ** | 0.90 ** | 0.75 ** | 0.86 ** | 0.55 ** |
| 2 | 0.68 ** | 0.97 ** | 0.91 ** | -- | 0.86 ** | -- | |
| Bottom | 1 | 0.92 ** | 0.96 ** | 0.83 ** | -- | 0.74 ** | 0.53 ** |
| 2 | 0.92 ** | 0.96 ** | 0.67 ** | -- | 0.60 ** | -- |
| Layer | Mode | Temperature | Salinity | Chl a | DIN | PO4 | |||||
|---|---|---|---|---|---|---|---|---|---|---|---|
| CC | DM | CC | DM | CC | DM | CC | DM | CC | DM | ||
| Surface | 1 | 0.73 ** | +3 | −0.73 ** | +2 | 0.73 ** | +2 | 0.75 ** | +2 | 0.72 ** | +3 |
| 2 | −0.99 ** | −1 | 0.90 ** | −2 | -- | -- | −0.91 ** | −2 | -- | -- | |
| Bottom | 1 | −0.97 ** | 0 | 0.97 ** | −1 | -- | -- | −1.00 ** | −1 | −1.00 ** | +1 |
| 2 | −0.89 ** | 0 | −0.98 ** | −1 | -- | -- | −0.98 ** | −1 | -- | -- | |
| Layer | Mode | River Discharge | Alongshore Wind Speed |
|---|---|---|---|
| Surface | 1 | 0.19 ** | 0.45 ** |
| 2 | −0.58 ** | −0.29 ** | |
| Bottom | 1 | −0.75 ** | −0.65 ** |
| 2 | −0.73 ** | −0.59 ** |
| Station | Time | Difference of Surface and Bottom in DO/(mg L−1) | Difference of Surface and Bottom in Temperature/° | Difference of Surface and Bottom in Salinity | Surface N:P | Bottom N:P |
|---|---|---|---|---|---|---|
| SM18 | June, 2002 | 7.4 | 3.4 | −16.7 | 137 | 11 |
| SM17 | June, 2007 | 4.4 | 3.7 | −11.7 | 77 | 13 |
| SM18 | August, 2007 | 5.4 | 6.7 | −6.5 | >50 | 7 |
| SM20 | August, 2010 | 0.6 | 0.9 | −1.7 | 53 | 17 |
| SM18 | August, 2010 | 5.3 | 4.9 | −4.4 | >70 | 11 |
| SM18 | August, 2011 | 7.7 | 6.5 | −7.2 | >155 | 10 |
| SM19 | August, 2011 | 6.6 | 6.6 | −6.5 | >115 | 12 |
| NM8 | July, 2014 | 5.4 | 3.9 | −21.7 | 60 | 32 |
| SM17 | July, 2016 | 7.2 | 5.6 | −8.3 | >100 | 11 |
| NM5 | July, 2017 | 5.9 | 3.4 | −24.1 | 35 | 27 |
| SM19 | July, 2017 | 5.3 | 4.9 | −8.3 | 38 | 7 |
© 2020 by the authors. Licensee MDPI, Basel, Switzerland. This article is an open access article distributed under the terms and conditions of the Creative Commons Attribution (CC BY) license (http://creativecommons.org/licenses/by/4.0/).
Share and Cite
Liu, G.; He, W.; Cai, S. Seasonal Variation of Dissolved Oxygen in the Southeast of the Pearl River Estuary. Water 2020, 12, 2475. https://doi.org/10.3390/w12092475
Liu G, He W, Cai S. Seasonal Variation of Dissolved Oxygen in the Southeast of the Pearl River Estuary. Water. 2020; 12(9):2475. https://doi.org/10.3390/w12092475
Chicago/Turabian StyleLiu, Guangping, Weihong He, and Shuqun Cai. 2020. "Seasonal Variation of Dissolved Oxygen in the Southeast of the Pearl River Estuary" Water 12, no. 9: 2475. https://doi.org/10.3390/w12092475
APA StyleLiu, G., He, W., & Cai, S. (2020). Seasonal Variation of Dissolved Oxygen in the Southeast of the Pearl River Estuary. Water, 12(9), 2475. https://doi.org/10.3390/w12092475