Article

DEM-CFD Simulation and Experiments on the Flow Characteristics of Particles in Vortex Pumps

1
National Research Center of Pumps, Jiangsu University, Zhenjiang 212013, China
2
School of Mechanical Engineering, Nantong University, Nantong 226000, China
*
Authors to whom correspondence should be addressed.
Water 2020, 12(9), 2444; https://doi.org/10.3390/w12092444
Submission received: 6 July 2020 / Revised: 22 August 2020 / Accepted: 24 August 2020 / Published: 31 August 2020
(This article belongs to the Special Issue Hydraulic Dynamic Calculation and Simulation)

Abstract

:
Due to their outstanding anti-clogging ability, vortex pumps have been gradually promoted and applied in recent years. However, when transporting sewage containing solids, they will still encounter problems such as partial clogging, overwork wear, etc., therefore, it is particularly important to master the flow characteristics of solid particles in the vortex pump. In this paper, the Discrete Element Model-Computational Fluid Dynamics (DEM-CFD) coupled calculation method is introduced into the numerical simulation of vortex pumps and particles with diameters of 1, 2 and 3 mm and concentrations of 1% and 5%, were subjected to numerical simulation and study of the flow characteristics of the particles, then rapeseed was used to represent solid particles in tests. It was obvious that the CFD results were in good agreement with the experimental results, whereby the high speed photography experimental results of the pump inlet section show that the experimental results are consistent with the numerical simulation results. The results show that there are three typical movement tracks of solid particles in the vortex pump: in Track A particles flow through the impeller and enter the volute by the through flow, in Track B particles go directly into the volute through the lateral cavity under the influence of circulation flow and in Track C the particles enter the impeller from the front cover end area of the impeller blade inlet and then into the volute through the back half area of blade. It can be found that the particles are mainly distributed at the back of the volute.

1. Introduction

Because the impeller of a vortex pump is arranged on one side of the pump cavity, its working principle is different from that of general centrifugal pumps and it mainly relies on the interaction of the tinternal circulation flow and through flow to achieve the purpose of conveying media. Due to the semi-open impeller structure and the existence of a bladed area, the anti-clogging performance of vortex pumps is better than that of general pumps. However, the efficiency of vortex pumps is usually less than 50%, which is lower than that of traditional centrifugal pumps [1,2,3]. This is because the current state research on the movement of solid particles in pumps is still immature, especially for two-phase flow pumps such as vortex pumps which still use the hydraulic design method based on the clean water pump. The characteristics of the two-phase flow in the pump under different working conditions are not clear, which leads to a slightly lower efficiency when conveying complex media, and the overflow components are not optimized for particle movement, resulting in typical wear and blockage problems [4,5].
According to the Lagrange and Euler methods, two fluid model (TFM) and discrete particle method (DPM) are two widely used solid-liquid two-phase methods. In TFM, the mixture model is used to calculate the two-phase flow in the pump. In TFM, the mixture model is used to calculate the two-phase flow in the pump. Peng et al. [6] used the particle model to study the wear of a slurry pump under the condition of biased design. The results showed that under the condition of small flow, the interface between the sheath and the rotor near the tongue had serious local wear. Zhou et al. [7] analyzed the performances of pumps. The results show that the existence of end clearance reduces the flow rate, which leads to the aggravation of flow separation in the diffuser channel and further reduces the performance of electric submersible pumps. Zhao et al. [8] simulated the double channel pump by using the mixture multiphase flow model and compared it with the single-phase flow test of clean water. The results show that the method can be used to predict the external characteristics of the double channel pump. Meanwhile, Zhang et al. [9] studied the sediment wear characteristics of a centrifugal pump by an Eulerian algorithm and analyzed the effects of turbulence intensity and particle dynamic scale on the distribution of the solid phase. The results show that considering the turbulence effect is more in line with the actual wear situation of centrifugal pump. Huang and Zhao et al. [10,11] used the DPM model and semi empirical wear model to calculate the wear phenomenon in centrifugal pump. The DPM model was applied by Shen et al. [12] to simulate a spiral centrifugal pump. The results showed that the motion track of low-density fine particles is longer, the number of collisions with the flow passage parts is more and the energy loss is more.
Due to the difficulty and high cost of two-phase flow tests in actual pumps, numerical simulation is widely used at this stage. TFM assumes that the particles occupy the space of a pseudo fluid and a real fluid, which penetrate each other and generate an interphase force. Although the calculation speed is fast and the particle size cannot be limited, the key information of pseudo fluid particles is lost and it is difficult to approach the real physical phenomenon [13]. The DPM model assumes that particles are particles moving in the fluid, and the particles do not occupy the volume, so it does not consider the collisions between particles, so it is only suitable to simulate dilute phase flow, and it is difficult to accurately reflect the particle movement in the pump. Through the coupling of DEM and CFD, using the discrete element solver to calculate the particles, we can track the force and movement track of each discrete particle in the system, fully consider the various forces and the collision between particles, between particles and the wall, which can more intuitively analyze the flow law of particles in the pump, closer to the real physical phenomenon [14,15]. Blais et al. [16,17,18] carried out theoretical research and practical engineering analysis on DEM-CFD coupling, and made some achievements in the application of agitators, analyzed the influence of particle properties on mixing dynamics, and proved the reliability of this method in the simulation of rotating machinery through experiments. Li et al. [19] calculated the solid-liquid two-phase flow in the deep-sea mining pump by DEM-CFD coupling. The results show that when the rotating speed increases, the solid movement in the pump is more regular and the collision is reduced, which helps to reduce the blockage between the impeller and the guide vane.
In this paper, the flow of spherical particles in the internal flow field of the vortex pump is studied based on the DEM-CFD simulation method. In order to obtain the flow track characteristics of particles in the pump, and the influence of particle sizes and concentration on the pump performance, different particle sizes and volume fractions were selected to simulate the flow characteristics in the pump, and the vortex structure and flow separation of the flow field in the pump were analyzed.

2. Calculation Model

2.1. Physical Model

The research model of this paper is shown in Figure 1. The design parameters of the pump are: flow rate Qd = 23.5 m3/h, head H = 3.5 m, rotation speed n = 1485 r/min, efficiency η = 46%. The geometric dimensions of the model are shown in Table 1.

2.2. Numerical Calculation Methods

2.2.1. Particle Motion Model

In recent years, the research about solid-liquid two-phase flow of vortex pump only considering two-way coupling, while the four coupling close to the actual situation is seldom used [20]. In the coupling of CFD-DEM, the particle track is determined by the force in the flow field and the collision between particle and wall. The force of particles in the flow field will be listed in detail and the force model in Fluent will be used for calculation [20]:
F = f d , i + f p , i + f τ , i + f A r , i + f v m , i + f s a f f , i + f M a g , i
where fd,i is the drag, fp,i means the pressure gradient force, fτ,i is the viscous resistance, fAr,i is the buoyancy, fvw,i is the virtual mass force and the force that affects the surrounding fluid when particles accelerate, fsaff,i is the Salman lift which is caused by the pressure difference of non-rotating particles in the non-uniform flow field and in this study, the large particle volume needs to be considered, fMag,i is the Magnus lift which caused by the asymmetric pressure distribution and particle rotation. In this study, considering the Reynolds number is very large, particle spin should be added.

2.2.2. Particle Contact Model

DEM-CFD numerical simulation software, according to the particle contact mode, it can be divided into two models: soft sphere contact mode and hard sphere contact mode. The hard contact sphere model only considers the collision between two particles, which can only be used to simulate the case of fast particle motion in the Coulter flow and shear flow, while the soft sphere contact model, in which the contact process between particles is simplified as the damped motion of the spring oscillator, then, using Newton’s second law, the force on the particles can be calculated on the basis of the amount of overlap between the spheres, is widely used. Hence, the soft sphere contact model is selected for the calculation.
In the simulation process, the deformation of particles and the cohesive force of particles surface are not considered. Therefore, Hertz-Mindlin (no slip) with RVD rolling friction are selected as the contact model. This model is based on the basic Hertz-Mindlin contact model and adjusts the calculation method of rolling friction, which is suitable for the condition that the rolling characteristics of materials are strictly required in the strong rotation system. The calculation of the normal force between particles requires the elastic modulus and Poisson’s ratio of particles, the normal damping force requires the recovery coefficient between materials, and the tangential force and moment between particles need to define the friction coefficient, that is, the physical parameters and contact parameters directly affect the simulation of particle motion. The physical parameters and contact parameters used in this paper are shown in Table 2 and Table 3 [21].
This paper focuses on the flow of solid particles in the spiral case of the vortex pump. The rapeseed is taken as particles, and the major past component of pump is made of Plexiglass.

3. Numerical Methods

3.1. Grid Independence Verification

The ANSYS-ICEM 17.0 software was used to build the structured mesh of computational domains associated with the block topology of Y-type and O-type. By controlling the mesh growth rate of the boundary layer, the overall mesh thickness and density were ensured. This work applied the grid independence test to select the appropriate mesh density. This paper established four calculation schemes with different grid numbers. The head and efficiency of the pump were taken as grid independence indicators as demonstrated in Table 4. According to the prediction results of the performance of the pump, it was explicit that the numerical value of head and efficiency showed a stable trend, as the number of mesh increased. The predicted head and efficiency of Scheme 1 and Scheme 2 are lower than that of other schemes. Between Schemes 3 and 4, as the grid increased, there was no significant difference in head and efficiency, which means that Scheme 3 had sufficient grid density to achieve the required accuracy. Therefore, considering the configuration and calculation time of the computer, Scheme 3 was selected as the final grid scheme for numerical computation, and the total numbers of the grid were 1,362,164. Meanwhile, it was ensured that the entire computational domain 30 < y+ < 100 to meet the requirement of standard wall functions. Figure 2 is the final mesh for the impeller, volute.

3.2. Numerical Method and Boundary Conditions

In this study, the shear stress transfer (SST) k-omega [22] turbulence model is used to calculate the continuous flow. For the boundary conditions, the inlet was set as the mass flow inlet, the outlet boundary condition was the pressure outlet, the wall surface was the nonslip boundary condition, and the rotational speed was 1485 r/min. The impeller was a rotating domain and the rest of the computational domains were static domains. The convective and the diffusive terms were solved by second order upwind discretization. Second order implicit was used as the time dependent term scheme. Semi-implicit method for pressure linked equations-consistent (SIMPLEC) algorithm was employed to calculate the pressure-velocity coupling, and the convergence criterion was set as 10−4. More details about the boundary conditions are listed in Table 5. In this paper, it focuses on studying the movement of particles in the pump, and the Euler-Lagrange method was used to discrete solid phase. Considering that the solid volume fraction studied in this paper is relatively low, and according to Zhou’s [23] simulation comparison of applicability to different traction models, the Wen and Yu traction model is adopted:
( ρ m k ) t + ( ρ m k u i ) x j = x j [ ( μ + μ t σ k ) k x j ] + P k β ρ m k ω
( ρ m ω ) t + ( ρ m ω u i ) x j = x j [ ( μ + μ t σ ε ) ω x j ] + α ω k P k ω 2 + 2 ( 1 F 1 )   ρ m 1 σ ω 2 ω k x j ω x j
v t = α 1 k max ( α 1 ω , S F 2 ) = μ t ρ m
where k is turbulence kinetic energy, ω is turbulence frequency, ρ m is fluid density, μ t is turbulent viscosity, μ is kinetic viscosity, υt is eddy viscosity, Pk is the turbulence generation rate, β is the coefficient of thermal expansion, β′ is empirical coefficient, S is the fixed strain rate estimate, F1, F2 are hybrid functions.
Unsteady calculations are used in Fluent, and the time step is 8.9784 s, namely when the blade rotates 8°, the total simulation time is 50 revolutions of the impeller, and the convergence accuracy is 10−4. In EDEM, the time step is generally smaller than that of Fluent, which is controlled between 10% and 40% of the Rayleigh time, and the particle information is saved every 4° of impeller rotation.

3.3. Time Independent Analysis

In order to ensure stability particle movement in the pump and reliable analysis the independence of simulation time was applied. We extract the particle information in the volute exit section at different times, and the results are shown in Figure 3. The results show that the particle number at the outlet changes greatly before 1 s, which results from the particles not having completed a complete cycle in the pump, but after 1.2121 s, the particle number at the outlet section of the volute gradually stabilizes. Considering the calculation time and other issues, the following analysis selects the simulation data of 1.2121 s. Although the data at this time point cannot fully represent the particle flow law inside the vortex pump, it has a certain stability result, which can be used to reflect the difference of solid-liquid pumped by vortex pump under different particles size and concentration.

3.4. Sample Point Selection

As for the particle distribution in the volute, it is mainly analyzed by the number of particles near each section of the volute and at the inlet and outlet of the volute. As shown in Figure 4, a small area of 10 mm wide is established at each position, and all particle information in the area is counted. Section 1 selects the inlet section close to the volute, which can represent the amount of particles entering the vortex pump; Sections I–VIII correspond to Section I–VIII in the volute hydraulic design, which can analyze the movement of particles in the volute; Meanwhile, Section 2 is taken at the volute outlet, and compared with Section 1, it can directly see the retention number of particles in the volute.
Figure 4 shows the position of each section. The schematic diagram is cut under the condition of 2 mm particle size and 5% concentration. Meanwhile, it also visually reflects the distribution of particles in the pump. The colors represent the particle speeds.

4. Results and Discussion

4.1. Particle Track

Particles with diameters of 1, 2 and 3 mm and concentrations of 1% and 5% were tracked. In the particle movement, it can be clearly observed that there are three typical movement tracks of solid particles in the vortex pump, as shown in Figure 5, Figure 6 and Figure 7. In the figures, the three particle movement tracks are shown for the condition of 2 mm particle size and 5% concentration.
Track A is the movement process of particles pumped out of the vortex pump by the action of through flow. The particle flow characteristics are that the particles enter the lateral cavity from the center of the inlet, which is less affected by the internal circulation flow of the pump chamber and the particle movements are dominated by axial velocity. Therefore, the particles pass through the lateral cavity directly into the impeller and particles enter the volute through the rotation of the impeller and the particles movements near the back of the volute.
The motion of track B is mainly affected by the circulating flow of the cavity. The characteristic of the track movements are that the particles are greatly affected by the rotating reflow in the inlet. The particles have both of circumferential velocity and axial velocity, but the particle movements are dominated by the circumferential velocity. Therefore, the particles do not enter the impeller directly, but rather enter the volute with the vortex flow caused by the impeller.
Track C is affected by both of the circulation flow and the through flow. The characteristics of the particle track are that particles pass through lateral cavity, then enter the impeller from the impeller front cover inlet area, because there is a lateral cavity in the vortex pump, the particles do not enter the volute directly through the impeller, but re-enter the lateral cavity under the influence of the circulation flow.

4.2. Particle Distribution in Volute with Different Particle Size and Concentration

For different particle size and concentration conditions, the number of particles in the section was extracted, and the dimensionless number of absolute particle concentrations NN is defined to represent the particle concentration in this region:
N N = N x N 1
Among them, Nx is the number of particles in the area to be tested, and N1 is the number of particles in Section 1. The specific results are shown in Figure 8, which are the distribution of absolute concentration of particles in 1, 2 and 3 mm under six working conditions of 1% and 5%, and all are the rated flow. Figure 9 shows the average velocity distribution of particles in each volute section region. In the Figure 8 and Figure 9, “1 mm.1%” means the condition of particle size of 1 mm and concentration of 1%, and so on.
From Figure 8, it can be seen that with the increase of section area of volute I to VIII, the trend of particle number in each section area is basically the same, and the particle distribution fluctuates most violently under the condition of 3 mm particle size, which indicates that with the increase of particle size, particles in the volute no longer move along the volute chamber, becoming more disordered.
The number of particles in Section V increases sharply, and the number of particles in Section VI also fluctuates. This phenomena are caused by track B mentioned above, which basically enters the volute at Section V, which directly leads to an increase of the particle number. The particles pumped through the lateral cavity, i.e., track B, have a large kinetic energy. There is a phenomenon that the particles are far away from the area after collision at Section V at the same time, the influence of the weight of the particles and the increase of the number of particles cause a slow- down of the flow velocity of the particles in the area. It can be seen from Figure 9 that the particle velocity at Sections V and VI of the volute obviously declines compared with the previous section area. The results show that the increase of the number of particles in Section V results in the movement of more particles along track B, while the increase of the number of particles is no longer obvious under the condition of 3 mm particle size, indicating that the large particles are less affected by the swirl in the inlet. In the area of Section VI, the particle concentration decreases more under the condition of 2 mm, which is caused by the effect of gravity and the increase of particles number. As the particle number of 3 mm is less, the impact of accumulation is not significant, while the particle number of 1 mm is less at the Section VI due to its small weight and good follow-up.
Section VII is close to the outlet of volute and has the largest section area, so the number of particles in this area is the largest under all working conditions. However, the number of particles in Section VIII is reduced to some extent, which results from some particles entering into the volute chamber in the middle section area or losing part of their energy due to collisions and they do not have enough kinetic energy to enter the outlet section, so they are blocked by the tongue and enter the cochlear chamber circulation. It can be clearly seen that the particle number decreases most obviously under the condition of 3 mm, which indicates that 3 mm particles are more easily blocked by the tongue and re-enter the volute, but this does not mean that 3 mm particles have poor traffic ability in the volute. On the contrary, after the volute is recycled, 3 mm particles can achieve greater speed.

4.3. Analysis on the Transportability of Vortex Pumps with Different Particle Size and Concentration

According to the same method of Section 2 in the previous section, it can be seen that the retention amount of particles in the volute of the vortex pump under different working conditions can provide a reference for the evaluation of the whole pump delivery performance. The details are shown in Table 6.
It can be seen from the Table 5 that when the vortex pump works under the condition of 3 mm particle size and 1% concentration, it can send solid particles out of the volute very well, while under the condition of 2 mm.1%, some particles stay in the volute, which is mainly because the number of particles increases under this condition and the particle size is greater than 1 mm under the influence of gravity, and most particles lose kinetic energy through mutual extrusion and collision, resulting in insufficient velocity, the particles re-entry into the chamber by volute tongue obstructs, which results in the low concentration of Section 2 particles, and the phenomenon improves when the concentration increases. In general, the above table shows that solid particles have a good pumping performance and can be pumped out of the volute in time with pumping small particles. This is mainly due to the good follow-up of small particles, which is mainly affected by the force of the flow field. When the concentration increases, the collision probability between particles increases, and the particles in the pump become more disorderly which will reduce the delivery performance of the pump. It can be seen that the particles with a diameter of 3 mm have been great impacted.

4.4. Analysis of Particle Passing Time under Different Particle Size and Concentration

Under all working conditions, we take the particles in Section 1 as an example and count the time taken for particles to move to Section II, that is, the time taken for particles to pass through the volute, where T1 represents the time for the first particles to reach Section II, and T2 represents the time for all selected samples to pass Section II, as shown in Figure 10.
It can be seen from the Figure 10 that under various working conditions, the time for the first particle to pass through the volute is not much different, and the time for large particles is relatively less; however, the total passing time is more related to the number of particles, for example, the time for 1 mm.5% working condition is the longest, and the time for 3 mm.1% working condition is the shortest, and the relationship with particle size is not significant.

4.5. Analysis of Flow Pattern in Volute

In this paper, three kinds of different particle sizes and two kinds of particle volume fractions are involved in six simulation examples. A typical case of large particles, i.e., the case of 2 mm particle size 5% concentration, is selected to analyze the velocity distribution on the volute section at 1.2121 s. The vortex core is determined by the regularize helicity [24,25]. According to the angle between the velocity vector and the vorticity, this method captures the position of the vortex core, which is defined as the modeling of the point product of the velocity and the vorticity. It is used to determine the rotation direction of the vortex core, and its value is between [–1, 1], as follows [26]:
H n = w · Ω | w | | Ω |
where w is relative velocity, Ω is absolute vorticity.
Figure 11 shows the normalized helicity distribution of the impeller section, with the flow direction as the positive direction. Hn is negative value, and the vortex is rotating clockwise. Hn is positive, the vortex rotates counterclockwise, From Figure 12, it can be seen that there are a pair of whirlpools with opposite rotation direction near the outlet of the impeller passage, among which the whirlpool direction near the suction surface of the blade is consistent with the flow direction, and there are whirlpools with opposite flow direction in the middle of the passage. It can be seen from Figure 14b that the vortex structure opposite to the rotation direction of the impeller will be formed at the junction of the volute due to the weakening of the direct effect of the impeller in the bladed cavity.
Figure 13 shows the regularized helicity and streamline distribution of four sections of the volute. It can be seen from the streamline that the velocity distribution is obviously asymmetric. There are two opposite vortices on the four selected sections, among which the vortices near the front side of the volute exist in the lateral cavity and do not belong to the volute section, and the vortices near the back side of the volute are large and located in the volute chamber, which is different from the ordinary centrifugal pump, mainly due to the arrangement of the offset side of the impeller of the vortex pump. The vortices at the front side are mainly caused by cyclic flow. With the increase of the area of the volute section, the vortices in the cochlear chamber gradually move to the center of the cochlear chamber and occupy the main position.
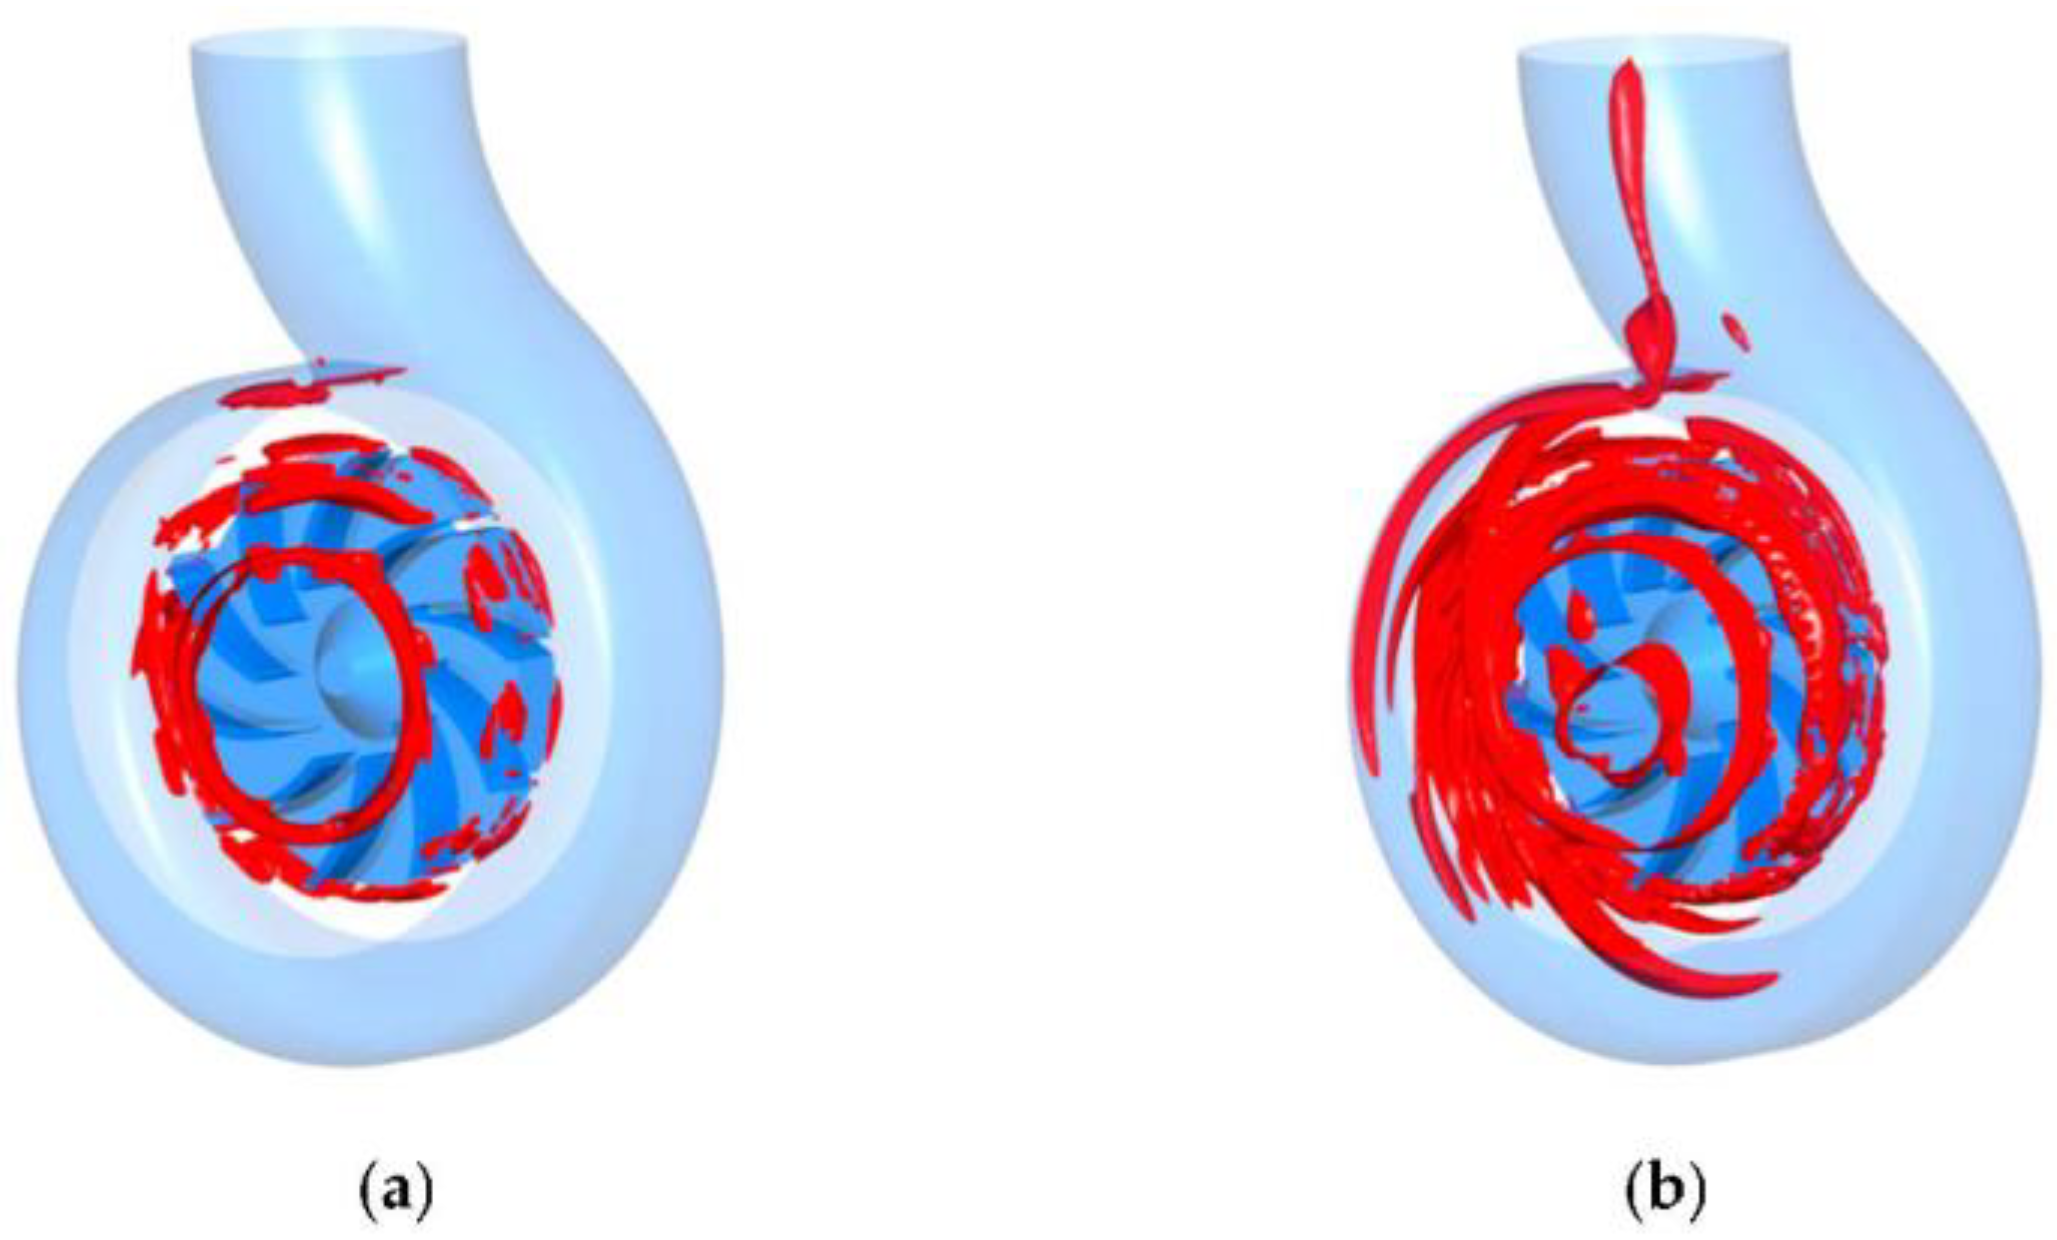
Vortexes can be judged by the Q criterion, that is, the rotation of the fluid in the vortex area of the pump plays a decisive role, rather than the strain rate of the fluid. Figure 13a,b show the evolution of vortex structure in the pump cavity. When Q = 54,288 s−2, the vortex structure appears at the outlet of impeller and the tongue, and the complete vortex appears at the place without blade cavity near the inlet, which is a symmetrical distribution. When the value of Q increases to 5301 s−2, there is a long vortex in the volute, because the fluid near the front side of the volute lacks the restriction of the impeller, which is only driven by the circulation flow. The fluid in the volute is easily blocked by the reverse pressure gradient at the tongue to separate the flow. The vortex formed is different from the rotation direction of the impeller. The reverse flow in the volute section at the front side of the volute goes through the tongue to mix with the incoming flow into the diffusion section, which shows that there are particles near the first and second sections of the volute which enter the diffusion section of the volute at the tongue, and the particles in the diffusion section will rise and flow out of the volute in a more obvious spiral shape.
Figure 14a shows the vortex structure of the diffusion segment of the volute with Q = 5301 s s−2, and the section is made with an interval of 22 mm. Through the analysis of the vorticity dynamics, it is found that there is an area with larger vorticity intensity in the diffusion section of the volute, which is located near the front side of the volute. The model value of the vorticity in the whole diffusion section is stable without large fluctuation, and the position of the vortex center does not have large transfer, and it can be seen that the main vortex is a bunch of return vortices generated from the volute section. There is obvious tensile tearing deformation at the septum tongue. The distribution of vortex core extracted by regularization helicity (b) is rather disordered. It can be seen that there are two pairs of vortex with opposite direction on the cross section near the septum tongue, while there is only one forward rotating vortex and one reverse vortex core accumulation area on the exit section of volute. The reverse vortex core is at the edge of the cross section and there is no dominant medium flow in the diffusion section. It can be inferred that it is the return vortex and the main-stream. The interaction and the disturbance to the main flow also show that the vortex structure in the criterion has obvious deformation.

5. Test Verification

In order to verify the accuracy of the numerical calculation, a performance test of the model pump was carried out, where the particle flow characteristics of the pump inlet were captured by high-speed photography. The impeller, volute and inlet section were manufactured from polymethyl methacrylate, which has good light transmission and is convenient for high frequency camera shooting, as presented in Figure 15. The design of the open test-bed, shown in Figure 16, included a flow control device, data acquisition device, and data processing device, An agitator is installed in the tank to stir the particles so that they are evenly mixed in the water.
The pump outlet flow is measured by a LDBE-80S-M2X100-80 electromagnetic flowmeter (Wuxi Dihua Automation Equipment Co. Ltd., Wuxi, Jiangsu, China); the motor power is measured by 8962c1 three-phase electrical parameter measuring instrument; the range of inlet pressure transmitter is −100~100 kpa; the range of outlet pressure transmitter is 0~100 kpa; the sampling frequency of the I-SPEED 3 high-speed camera (iX Cameras Ltd., Locks Hill Rochford Essex, UK) is 1000 Hz. In the test, rapeseed was used for solid particles. The diameter is about 2 mm and a particle concentration of 5% was selected. During the experiments, the agitator starts at a constant speed, the flow rate and the pressure were measured by the electromagnetic flowmeter and the pressure sensor. Then, by adjusting the valve opening, the pressure at different flow rates was measured, and all signals were input to the computer software for calculation. In this process, the rotating reflux phenomenon of the inlet was also photographed by high-speed photographic instrument.
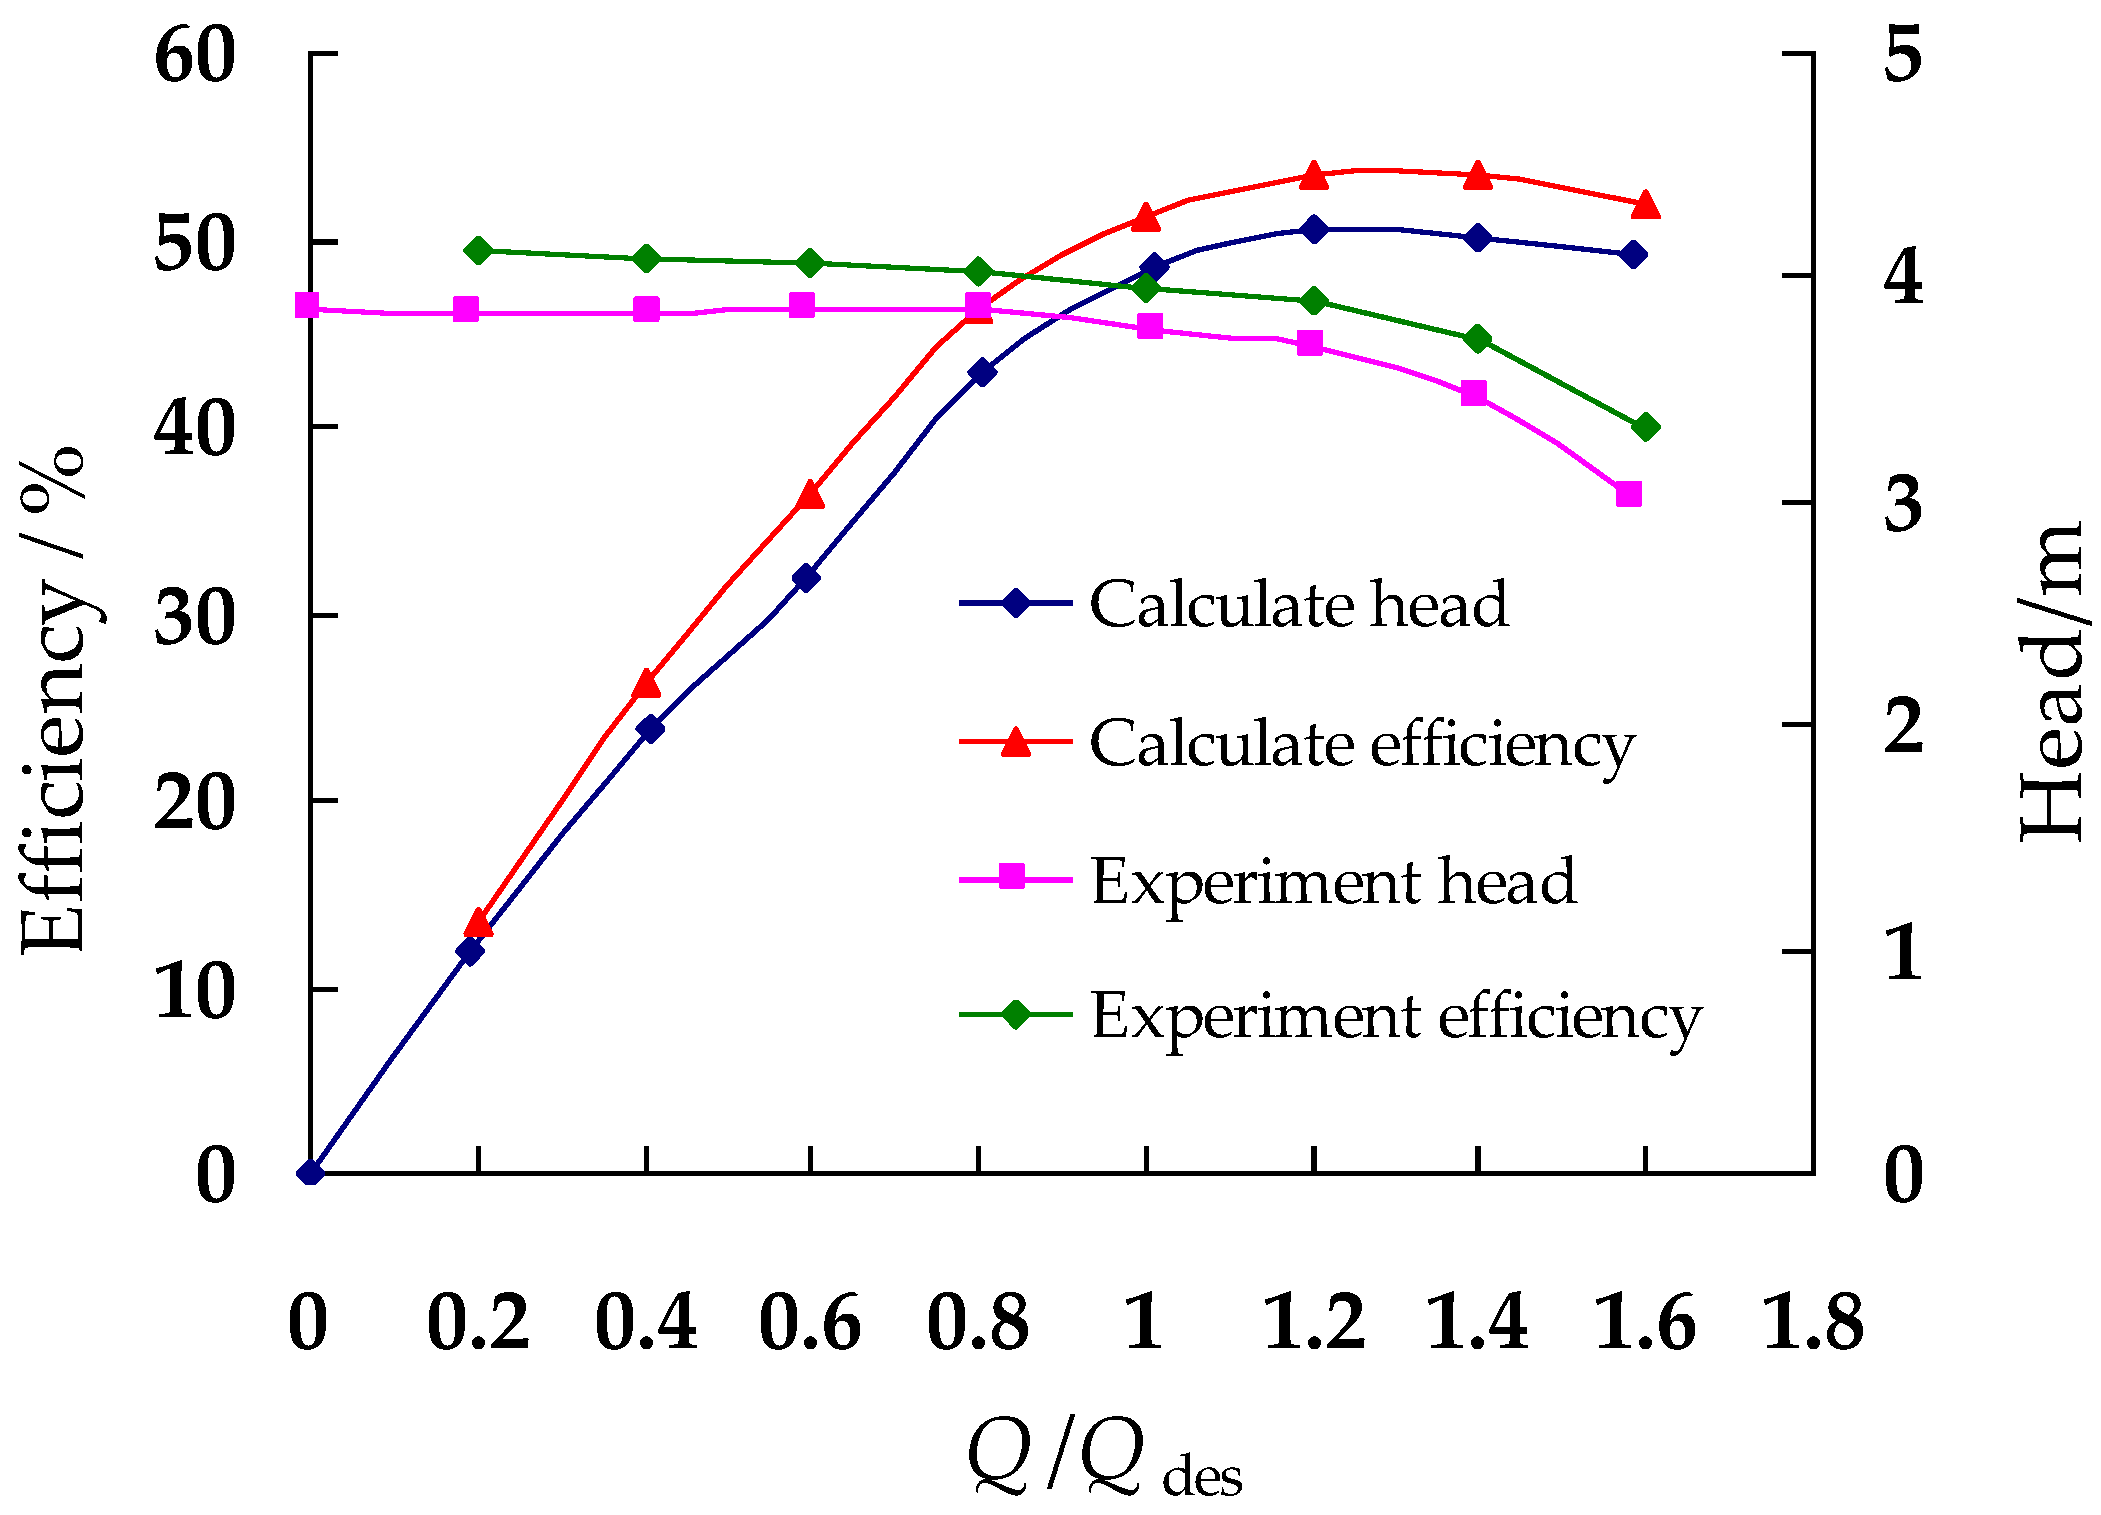
The experimental results are shown in Figure 17. The numerical simulation was carried out at 4.7, 9.4, 14.1, 18.8, 23.5, 28.2, 32.9 and 37.6 m3/h. It was obvious that the CFD results were in good agreement with the experimental results. The experimental results were relatively lower than the CFD results, but the error was less than 5% and they had the same change trend at different flow rates. Hence, the method of this study is credible. The reason for the decrease in test results was probably the neglect of mechanical losses in the calculations.
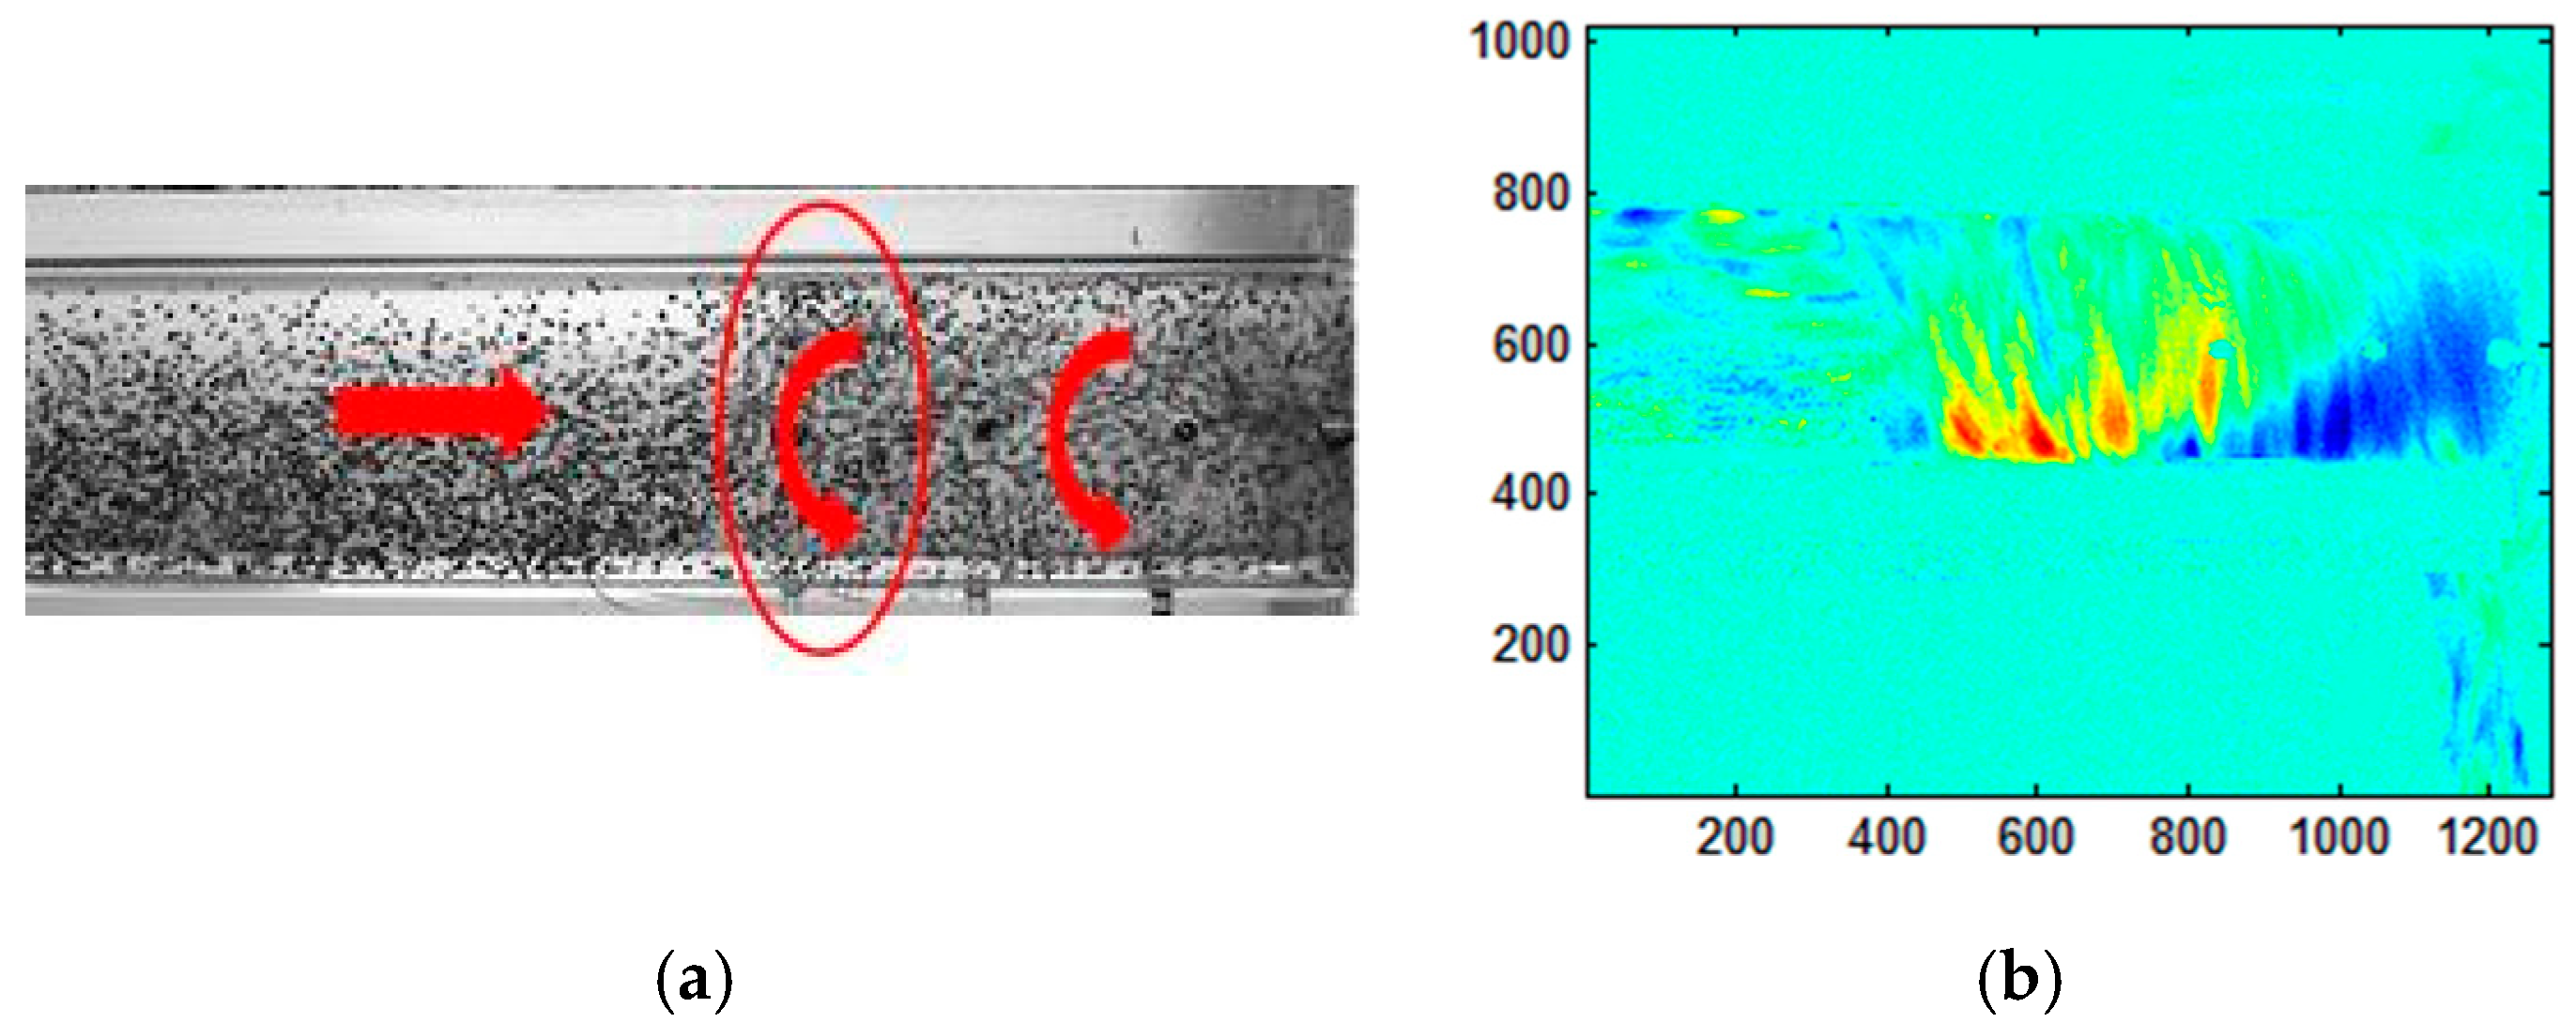
It can be seen from Figure 18a that the high-speed photography instrument can catch that the two-phase flow rotating reflux from the lateral cavity into the inlet section, and the spiral reflux movement against the wall of the inlet, the direction of rotation is the same as that of the impeller. The rotating reflux is stopped by mixing with the inlet incoming flow at a certain point. The stop position of the rotating reflux depends on the flow rate, the stop position of the rotating reflux is close to the pump cavity at large flow condition, while away from the pump cavity at small flow condition.
Through the snapshot POD method, the swirl phenomenon in the inlet is decomposed. The rotating reflux phenomenon of pump inlet photographed by high-speed photography instrument is modal decomposed. The first-order spatial modal as shown in Figure 18b, it can be intuitively seen that the energy of the first-order spatial modal is relatively high, and it presents a large scale reflux vortex structure. It can be seen from Figure 19 that the numerical simulation results show that the stop position of the rotating reflux is consistent with the experimental results. Hence, the method of this study is credible.

6. Conclusions

(1)
The particles rotate at the inlet of the vortex pump model with a rotational reflux motion along the inlet wall. The particles flow back from the lateral cavity and stop by mixing with the inlet incoming flow at a certain point, the direction of rotation is the same as that of the impeller. The results show that the DEM-CFD coupling method can be used to simulate the solid-liquid two-phase flow in the vortex pump.
(2)
There are three typical track of particles in the vortex pump. Track A is that particles flow through the impeller and enter the volute by the through flow, and it is less affected by the rotating reflux in the inlet section and enter the impeller through the lateral cavity dominated by through-flow, then enter the volute through the impeller rotation; track B is greatly affected by the circulation flow and enters the lateral cavity with a larger circumferential rotation velocity, and then directly enter the volute; Track C is where particles enter the impeller from the front cover end area of the impeller blade inlet and then into the volute through the back half area of blade. Therefore, the vortex pump is suitable for pumping medium containing large particles.
(3)
Three different particle sizes were simulated under rated conditions, and the results showed that the medium flow with small particle size has better performance. With the same particle size, the time of passing through the pump outlet increases slightly with the increase of concentration. With the same concentration of particles, the larger the particle size, the smaller the velocity, and the time of passing through the pump outlet is longer.
(4)
Most of the particles flow to the back of the volute; from the diffusion section to the outlet area of the volute, the particles flow out as a spiral way with the liquid medium; the first section of the volute forms a spiral vortex on the impeller side, and with the increase of the volute section, the spiral vortex moves to the middle area of the volute.
(5)
There are many different sizes of vortices in the lateral cavity and volute area, which makes the internal flow of the pump more disordered, which is also the reason for the low efficiency of the vortex pump; because of the existence of the volute tongue and the lateral cavity, large spiral vortex is formed at the tongue, and it diffuse to the outlet of the volute.

Author Contributions

Conceptualization, X.G. and W.S.; methodology, X.G. and W.S.; software, Y.S.; validation, H.C. and W.S.; formal analysis, X.G.; investigation, Y.S.; resources, X.G.; data curation, T.Z.; writing—original draft preparation, X.G.; writing—review and editing, W.S. and H.C.; visualization, T.Z.; supervision, W.S.; project administration, W.S.; funding acquisition, X.G. All authors have read and agreed to the published version of the manuscript.

Funding

This research was funded by the National Natural Science Foundation of China (Grant No. 51909108), National Natural Science Foundation of China (Grant No. 51979138), Six Talent Peaks High-Tech Innovation Talent Team Project of Jiangsu Province (Grant No. JNHB-CXTD-005).

Conflicts of Interest

The authors declare no conflict of interest.

Nomenclature

DEMDiscrete element Method
NNAbsolute particle concentration
NxNumber of particles in a section
N1Number of particles in Section-I
QFlow rate
QdesDesign flow
HnRegularization helicity
wRelative velocity
ΩAbsolute vorticity

References

  1. Sha, Y.; Hou, Y. Effect of impeller position on performance and measurement of vaneless cavity flow field. J. Agric. Mach. 2010, 11, 57–62. [Google Scholar]
  2. Gerlach, A.; Thamsen, P.U.; Wulff, S.; Jacobsen, C.B. Design parameters of vortex pumps: A meta-analysis of experimental studies. Energies 2017, 10, 58. [Google Scholar] [CrossRef] [Green Version]
  3. Gao, X.; Shi, W.; Zhang, D.; Zhang, Q.; Fang, B. Optimum design and test of cyclone pump based on CFD orthogonal test. J. Agric. Mach. 2014, 5, 101–106. [Google Scholar]
  4. Gerlach, A.; Perlitz, D.; Lykholt, U.F.; Jacobsen, C.B.; Thamsen, P.U. The clogging behavior of a vortex pump: An experimental study on the influence of impeller designs. In Proceedings of the ASME 2017 Fluids Engineering Division Summer Meeting, Waikoloa HI, USA, 30 July–3 August 2017. [Google Scholar]
  5. Sha, Y.; Liu, X. Experiment on solid-liquid two-phase flow transport characteristics of vortex pump. J. Agric. Mach. 2013, 22, 76–82. [Google Scholar]
  6. Peng, G.; Zhou, G.; Hu, Z.; Zhou, H. Influence of back blade on wear of heavy slurry pump under low flow condition. J. Drain. Irrig. Mach. Eng. 2020, 38, 332–338. [Google Scholar]
  7. Zhou, L.; Wang, W.; Hang, J.; Shi, W.; Yan, H.; Zhu, Y. Numerical Investigation of a High-Speed Electrical Submersible Pump with Different End Clearances. Water 2020, 12, 1116. [Google Scholar] [CrossRef] [Green Version]
  8. Zhao, B.; Yuan, S.; Liu, H.; Huang, Z.; Tan, M. Simulation of solid-liquid two-phase turbulent flow in double-channel pump based on Mixture model. Trans. Chin. Soc. Agric. Eng. 2008, 1, 7–12. [Google Scholar]
  9. Zhang, Z.; Wang, F.; Chen, X.; Liao, C.; Xu, H.; Lu, L. Study on sediment wear characteristics of double suction centrifugal pump based on improved Euler algorithm. J. Agric. Mach. 2017, 3, 124–133. [Google Scholar]
  10. Hang, S.; Zou, W.; Zhou, J.; He, D.; Peng, T. Unsteady numerical simulation onsolid-liquid flows and wear in a centrifugal pump based on DPM model. Mach. Tool Hydraul. 2016, 6, 1–5. [Google Scholar]
  11. Zhao, W.; Zheng, Y.; Liu, Y.; Han, X. The numerical analysis of the influence of sand volume fraction on the wear characteristics of centrifugal pumps. J. Drain. Irrig. Mach. Eng. 2018, 2, 98–103. [Google Scholar]
  12. Shen, Z.; Li, R.; Han, W.; Zhao, W.; Wang, X. The research on particle trajectory of solid-liquid two-phase flow and erosion predicting in screw centrifugal pump. IOP Conf. Ser. Mater. Sci. Eng. 2016, 129, 012052. [Google Scholar] [CrossRef]
  13. Askaripour, H.; Dehkordi, A.M. Simulation of 3D freely bubbling gas–solid fluidized beds using various drag models: TFM approach. Chem. Eng. Res. Des. 2015, 100, 377–390. [Google Scholar] [CrossRef]
  14. Shi, W.; Hou, Y.; Zhou, L.; Li, Y.; Xue, S. Numerical simulation and test of performance of deep-well centrifugal pumps with different stages. J. Drain. Irrig. Mach. Eng. 2019, 37, 562–567. [Google Scholar]
  15. Araoye, A.A.; Badr, H.M.; Ahmed, W.H.; Habib, M.A.; Alsarkhi, A.A. Erosion of a multistage orifice due to liquid-solid flow. Wear 2017, 390, 270–282. [Google Scholar] [CrossRef]
  16. Blais, B.; Bertrand, F. CFD-DEM investigation of viscous solid–liquid mixing: Impact of particle properties and mixer characteristics. Chem. Eng. Res. Des. 2017, 118, 270–285. [Google Scholar] [CrossRef]
  17. Blais, B.; Bertrand, O.; Fradette, L.; Bertrand, F. CFD-DEM simulations of early turbulent solid-liquid mixing: Prediction of suspension curve and just-suspended speed. Chem. Eng. Res. Des. 2017, 123, 388–406. [Google Scholar] [CrossRef]
  18. Blais, B.; Bertrand, O.; Fradette, L.; Bertrand, F. Development of an unresolved CFD-DEM model for the flow of viscous suspensions and its application to solid–liquid mixing. J. Comput. Phys. 2016, 318, 201–221. [Google Scholar] [CrossRef]
  19. Li, Y.; Liu, S.; Hu, X. Research on rotating speed’s influence on performance of Deep-Sea lifting motor pump based on DEM-CFD. Mar. Georesour. Geotechnol. 2019, 8, 1–10. [Google Scholar] [CrossRef]
  20. Norouzi, H.R.; Zarghami, R.; Sotudeh Gharebagh, R.; Mostoufi, R. DEM Formulation Coupled CFD-DEM Modeling: Formulation, Implementation and Application to Multiphase Flows; John Wiley & Sons: Manhattan, NY, USA, 2016. [Google Scholar]
  21. Zhou, L.; Zhang, L.; Bai, L.; Shi, W.; Li, W.; Wang, C.; Agarwal, R. Experimental study and transient CFD/DEM simulation in a fluidized bed based on different drag models. RSC Adv. 2017, 21, 64–74. [Google Scholar] [CrossRef] [Green Version]
  22. Zhang, D.; Feng, J.; Wan, F.; Li, J.; Shi, W. Modification and application of turbulence model for simulating cavitation flow in heat sensitive medium of airfoil. J. Agric. Mach. 2020, 51, 135–141. [Google Scholar]
  23. Li, J.; Zhang, R.; Guo, R.; Li, R. Influence of blade camber profile on hydraulic performance of slurry pump and impeller wear characteristic. J. Drain. Irrig. Mach. Eng. 2020, 38, 21–27. [Google Scholar]
  24. Shi, W.; Zhang, L.; Zhou, L.; Lu, W. DEM-based numerical simulation of unsteady gas-solid two phase flow in a fluidized bed and experimental validation. J. Drain. Irrig. Mach. Eng. 2017, 35, 404–409. [Google Scholar]
  25. Li, W.; Li, E.; Ji, L.; Zhou, L.; Shi, W.; Zhu, Y. Mechanism and propagation characteristics of rotating stall in a mixed-flow pump. Renew. Energy 2020, 153, 74–92. [Google Scholar] [CrossRef]
  26. Furukawa, M.; Inoue, M.; Saiki, K.; Yamada, K. The role of tip leakage vortex breakdown in compressor rotor aerodynamics. J. Turbomach. 1999, 3, 469–480. [Google Scholar] [CrossRef]
Figure 1. Sketch of the model: (a) calculation domains; (b) impeller model.
Water 12 02444 g001
Figure 2. Sketch of the structured mesh: (a) volute; (b) impeller.
Water 12 02444 g002
Figure 3. Time independence analysis.
Water 12 02444 g003
Figure 4. Section diagram.
Water 12 02444 g004
Figure 5. Particle track A.
Water 12 02444 g005
Figure 6. Particle track B.
Water 12 02444 g006
Figure 7. Particle track C.
Water 12 02444 g007
Figure 8. Particle concentration distribution with different valves of particle diameter and concentration.
Water 12 02444 g008
Figure 9. Particle velocity with different valves of particle diameter and concentration.
Water 12 02444 g009
Figure 10. Particle movement time with different valves of particle diameter and concentration.
Water 12 02444 g010
Figure 11. Hn of blades, interface and middle plane: (a) Impeller middle section; (b) Blade and interface.
Water 12 02444 g011
Figure 12. Vortex structures of pump cavity: (a) Q =54,288 s−2; (b) Q =5301 s−2.
Water 12 02444 g012
Figure 13. Hn and velocity curves of volute section: (a) Section I; (b) Section III; (c) Section V; (d) Section VII.
Water 12 02444 g013
Figure 14. Vortex structure of volute diffusion section: (a) Module distribution of vorticity; (b) Hn.
Water 12 02444 g014
Figure 15. Testing pump: (a) Volute, (b) Impeller, (c) Pump inlet section.
Water 12 02444 g015
Figure 16. Testing apparatus schematic diagram.
Water 12 02444 g016
Figure 17. Comparison of pump performance between numerical and experimental results.
Water 12 02444 g017
Figure 18. High speed photography result of inlet section. (a) The result of the inlet section, (b) The result of first-order spatial modal.
Water 12 02444 g018
Figure 19. Comparison of particles flow at pump inlet section between numerical and experimental.
Water 12 02444 g019
Table 1. Geometric dimensions of the impeller and volute.
ParameterValue
ImpellerBlade inlet setting angle β1/(°)60
Blade outlet setting angle β2/(°)45
Blade wrap angle ψ/(°)45
Outer diameter of impeller D2/mm128
Blade width b2/mm22
voluteInlet width b3/mm47
Base circle diameter D3/mm160
Table 2. Materials selected for simulation parameters.
MaterialPoisson’s RatioShear Modulus MPaDensity kg·m−3
Rapeseed Seed0.51 × 106950
PMMA Plexiglass0.394 × 1091200
Table 3. Contact parameter.
Coefficient of RestitutionCoefficient of Static FrictionCoefficient of Rolling Friction
Rapeseed-rapeseed0.10.540.01
Rapeseed-Plexiglass0.20.50.01
Table 4. Grid independence analysis.
Scheme No.Grid NumberHead (m)Efficiency (%)
Scheme 1848,5263.7649.68
Scheme 21,136,5953.9250.43
Scheme 31,362,1644.0150.86
Scheme 41,782,5684.0350.78
Table 5. Boundary conditions.
LocationBoundary Condition TypesSettings
InletMass flow inlet101,325 Pa, turbulence intensity
OutletPressure outletEqual to the operating flow rate
WallNonslip wallSurface roughness 0.01 mm
ImpellersRotating1485 r/min
VoluteStationary0 r/min
Table 6. Particle concentration NN on Section II.
1 mm.1%2 mm.1%3 mm.1%
Particle concentration NN0.8920.6961
1 mm.5%2 mm.5%3 mm.5%
Particle concentration NN0.870.7820.77

