Enhancing Nitrogen and Phosphorus Removal by Applying Effective Microorganisms to Constructed Wetlands


 ,
,  ,
,
Abstract
1. Introduction
2. Materials and Methods
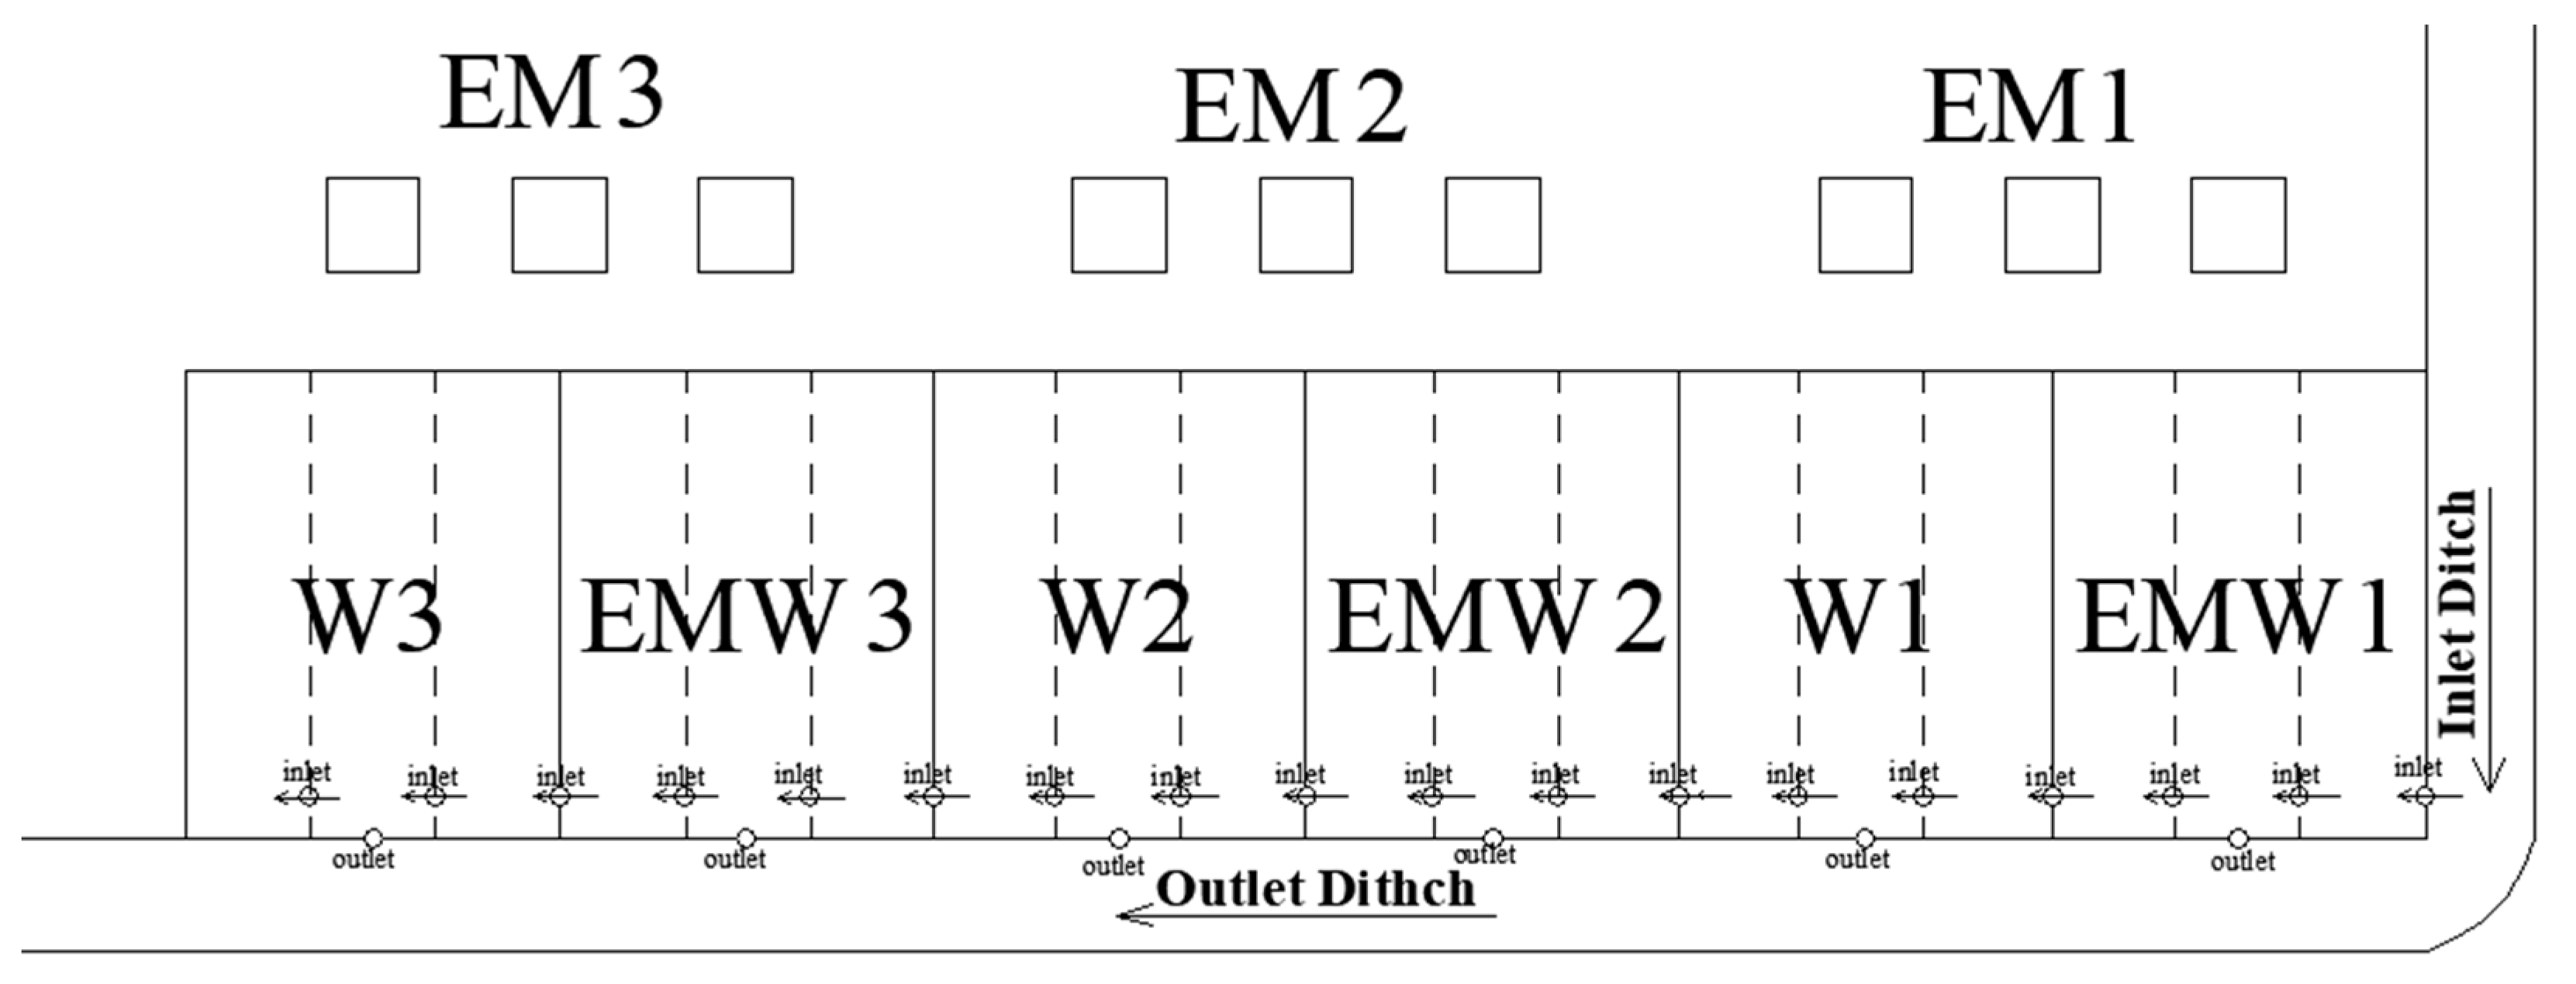
2.1. Wetland Layout
2.2. Application of EM
2.3. Measurement and Analysis
3. Results and Discussion
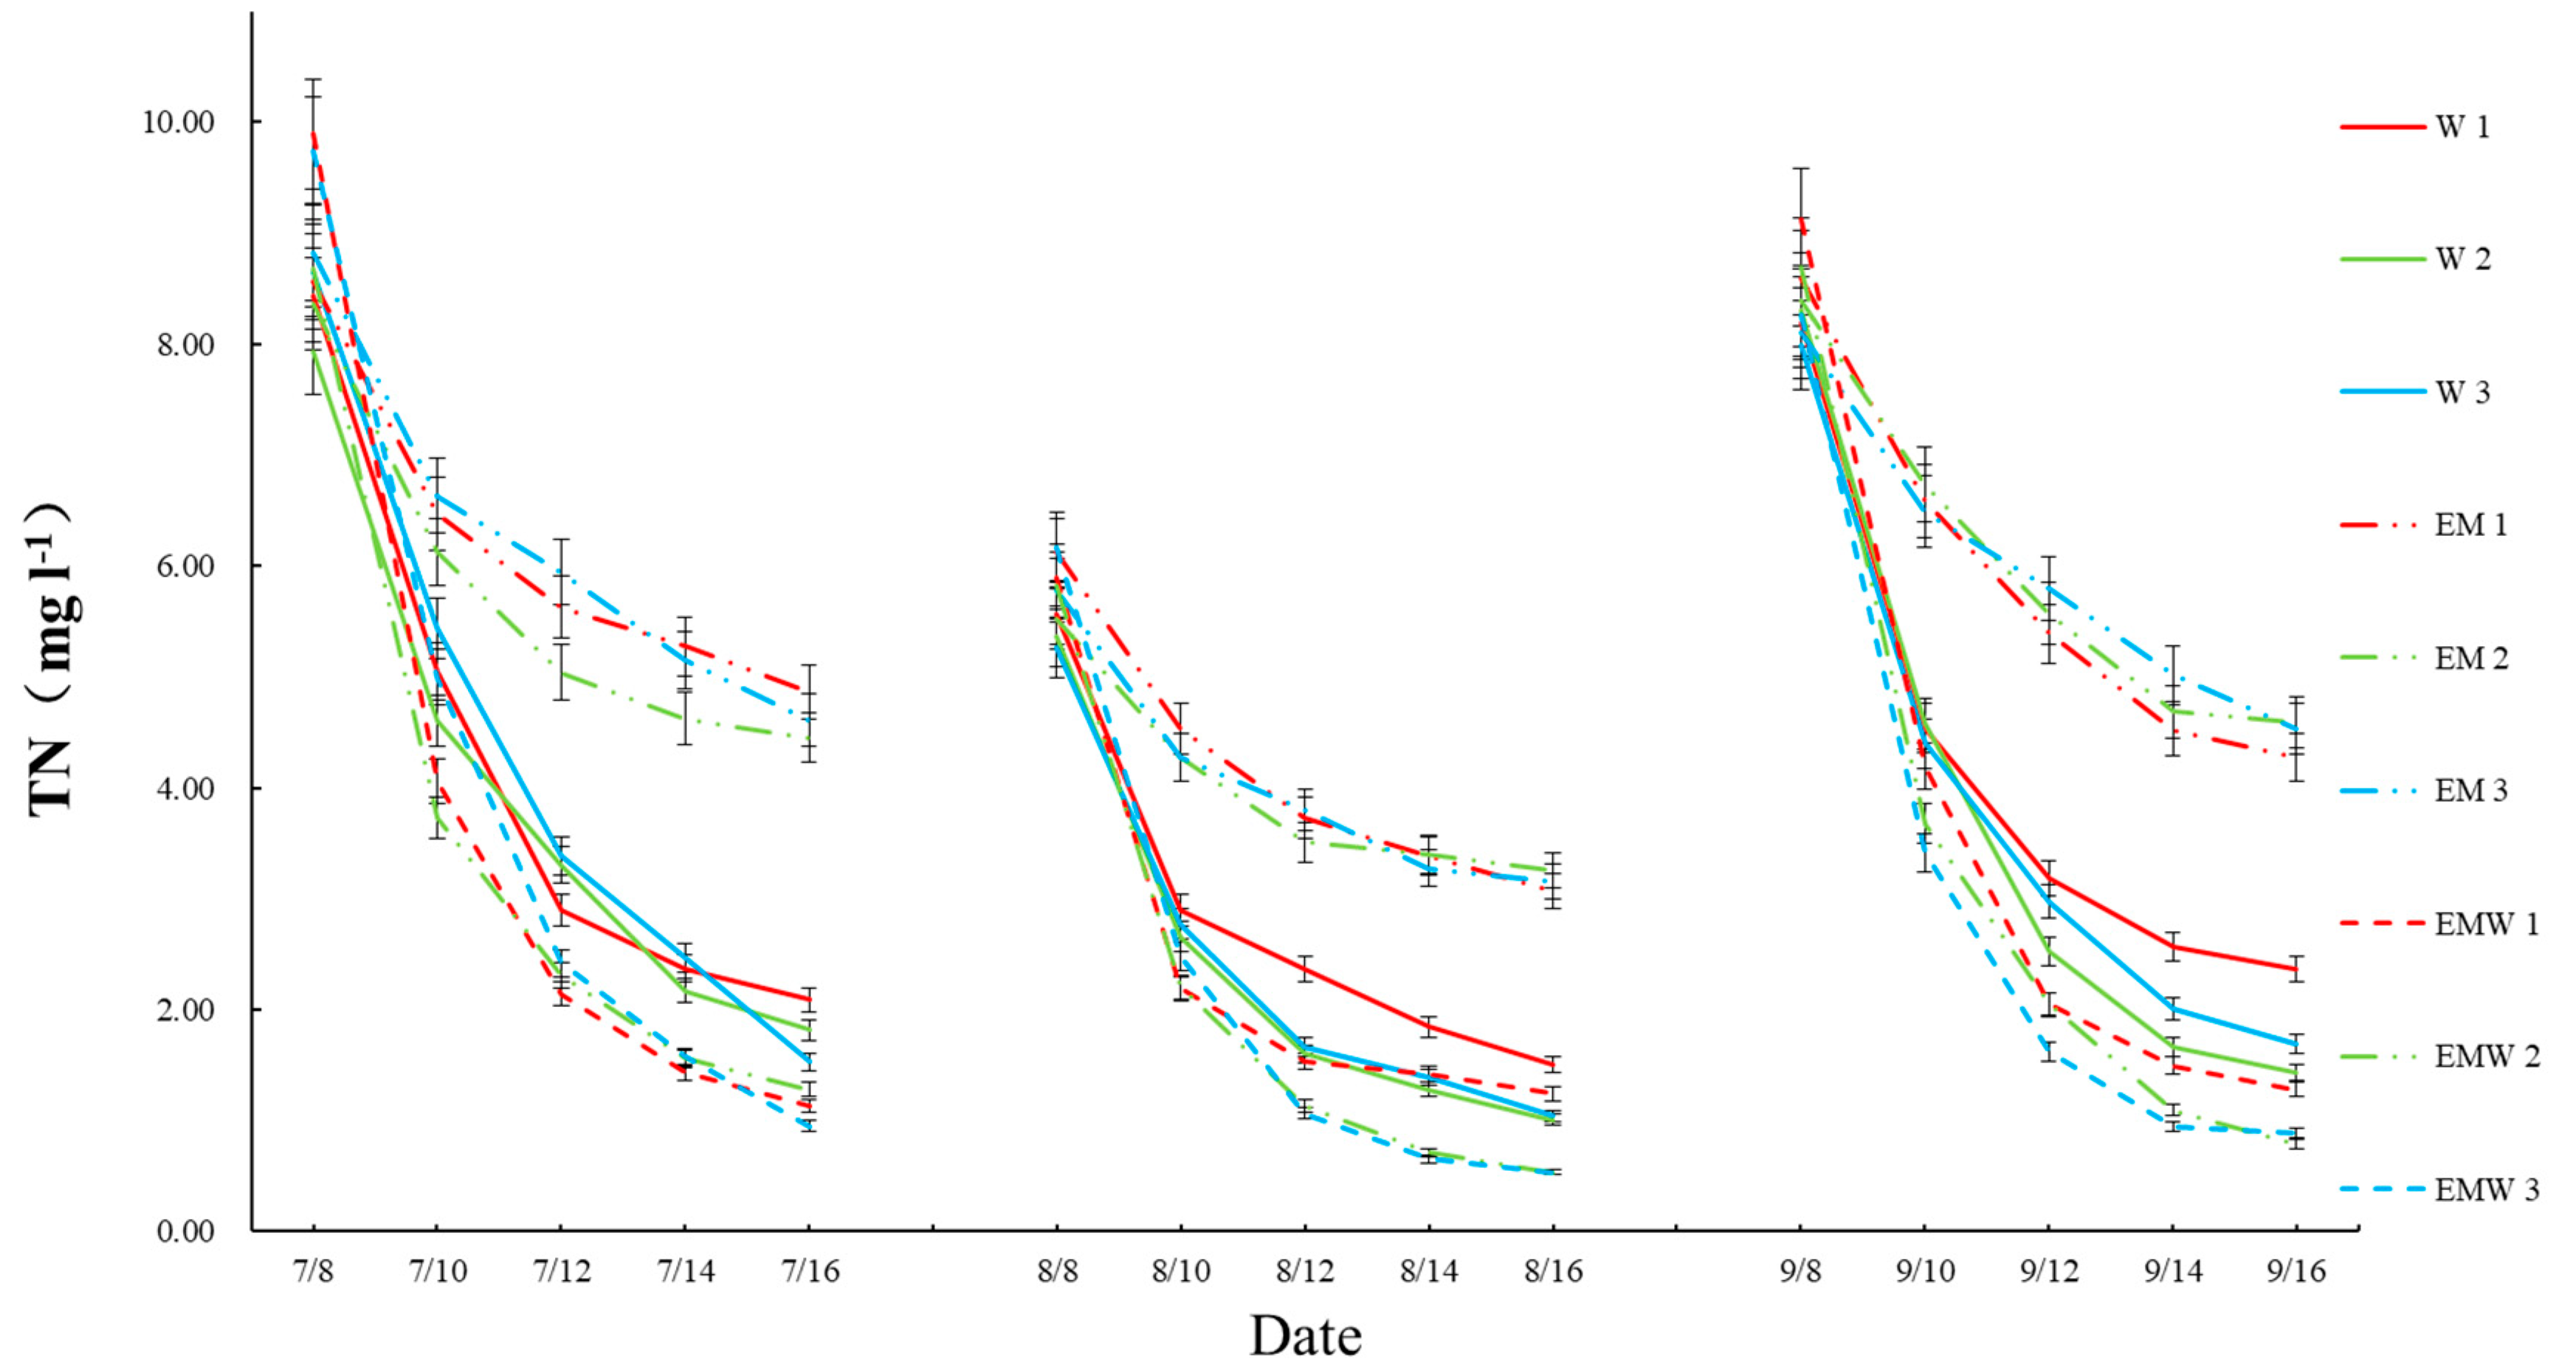
3.1. Concentrations and Reduction Rates of Nitrogen and Phosphorus in Wetlands
3.2. Nitrogen and Phosphorus Loads and Mass Removal Efficiencies in Wetlands
3.3. TN and TP Uptake by Aquatic Vegetables
4. Conclusions
Author Contributions
Funding
Acknowledgments
Conflicts of Interest
References
- Xu, J.; Peng, S.; Yang, S.; Wang, W. Ammonia volatilization losses from a rice paddy with different irrigation and nitrogen managements. Agric. Water Manag. 2012, 104, 184–192. [Google Scholar] [CrossRef]
- Xiong, Y.; Peng, S.; Luo, Y.; Xu, J.; Yang, S. A paddy eco-ditch and wetland system to reduce non-point source pollution from rice-based production system while maintaining water use efficiency. Environ. Sci. Pollut. Res. 2015, 22, 4406–4417. [Google Scholar] [CrossRef]
- Mendes, L.R.D.; Tonderski, K.; Iversen, B.V.; Kjaergaard, C. Phosphorus retention in surface-flow constructed wetlands targeting agricultural drainage water. Ecol. Eng. 2018, 120, 94–103. [Google Scholar] [CrossRef]
- Mojiri, A.; Ziyang, L.; Tajuddin, R.M.; Farraji, H.; Alifar, N. Co-treatment of landfill leachate and municipal wastewater using the ZELIAC/zeolite constructed wetland system. J. Environ. Manag. 2016, 166, 124–130. [Google Scholar] [CrossRef] [PubMed]
- Ramprasad, C.; Smith, C.S.; Memon, F.A.; Philip, L. Removal of chemical and microbial contaminants from greywater using a novel constructed wetland: GROW. Ecol. Eng. 2017, 106, 55–65. [Google Scholar] [CrossRef]
- Upadhyay, A.K.; Bankoti, N.S.; Rai, U.N. Studies on sustainability of simulated constructed wetland system for treatment of urban waste: Design and operation. J. Environ. Manag. 2016, 169, 285–292. [Google Scholar] [CrossRef]
- Sharley, D.J.; Sharp, S.M.; Marshall, S.; Jeppe, K.; Pettigrove, V.J. Linking urban land use to pollutants in constructed wetlands: Implications for stormwater and urban planning. Landsc. Urban Plan. 2017, 162, 80–91. [Google Scholar] [CrossRef]
- Dires, S.; Birhanu, T.; Ambelu, A.; Sahilu, G. Antibiotic resistant bacteria removal of subsurface flow constructed wetlands from hospital wastewater. J. Environ. Chem. Eng. 2018, 6, 4265–4272. [Google Scholar] [CrossRef]
- Koottatep, T.; Polprasert, C. Role of plant uptake on nitrogen removal in constructed wetlands located in the tropics. Water Sci. Technol. 1997, 36, 1–8. [Google Scholar] [CrossRef]
- Kröger, R.; Holland, M.; Moore, M.; Cooper, C. Agricultural drainage ditches mitigate phosphorus loads as a function of hydrological variability. J. Environ. Qual. 2008, 37, 107–113. [Google Scholar] [CrossRef]
- Braskerud, B. Factors affecting nitrogen retention in small constructed wetlands treating agricultural non-point source pollution. Ecol. Eng. 2002, 18, 351–370. [Google Scholar] [CrossRef]
- Kröger, R.; Moore, M.; Locke, M.; Cullum, R.; Steinriede, R., Jr.; Testa Iii, S.; Bryant, C.; Cooper, C. Evaluating the influence of wetland vegetation on chemical residence time in Mississippi Delta drainage ditches. Agric. Water Manag. 2009, 96, 1175–1179. [Google Scholar] [CrossRef]
- Jia, S.; Zhu, G.; Zhao, J.; Lü, X. Treatment of biogas slurry of stored algae by biological contact oxidation combined with aquatic vegetable constructed wetland. Front. Environ. Sci. 2014, 3, 38–43. [Google Scholar]
- Shimp, J.; Tracy, J.; Davis, L.; Lee, E.; Huang, W.; Erickson, L.; Schnoor, J. Beneficial effects of plants in the remediation of soil and groundwater contaminated with organic materials. Crit. Rev. Environ. Sci. Technol. 1993, 23, 41–77. [Google Scholar] [CrossRef]
- Huett, D.; Morris, S.; Smith, G.; Hunt, N. Nitrogen and phosphorus removal from plant nursery runoff in vegetated and unvegetated subsurface flow wetlands. Water Res. 2005, 39, 3259–3272. [Google Scholar] [CrossRef]
- Mongkolthanaruk, W.; Dharmsthiti, S. Biodegradation of lipid-rich wastewater by a mixed bacterial consortium. Int. Biodeterior. Biodegrad. 2002, 50, 101–105. [Google Scholar] [CrossRef]
- Namsivayam, S.K.R.; Narendrakumar, G.; Kumar, J.A. Evaluation of Effective Microorganism (EM) for treatment of domestic sewage. J. Exp. Sci. 2011, 2, 30–32. [Google Scholar]
- Abdel-Shafy, H.; Al-Sulaiman, A.; Galal-El-Deen, M.M.; Abdel-Hameed, H. Greywater treatment via integration effective microorganisms and constructed wetlands. J. Eng. Appl. Sci. 2013, 60, 497–516. [Google Scholar]
- El-Mageed, T.A.A.; Rady, M.M.; Taha, R.S.; El Azeam, S.A.; Simpson, C.R.; Semida, W.M. Effects of integrated use of residual sulfur-enhanced biochar with effective microorganisms on soil properties, plant growth and short-term productivity of Capsicum annuum under salt stress. Sci. Hortic. 2020, 261, 108930. [Google Scholar] [CrossRef]
- Hu, C.; Qi, Y. Long-term effective microorganisms application promote growth and increase yields and nutrition of wheat in China. Eur. J. Agron. 2013, 46, 63–67. [Google Scholar] [CrossRef]
- Chen, D.Q.; He, H.; Chen, Y.Q. Purification of nitrogen and phosphorus in lightly polluted landscape river by effective microorganisms combined with submerged plants. Appl. Mech. Mater. 2013, 316–317, 430–434. [Google Scholar] [CrossRef]
- Wei, Q.; Liu, J.; Peng, Y.; Xu, J.; Liao, L.; Yang, S. Storing and removing nitrogen in drainage from paddy field by using aquatic crops wetland. Paddy Water Environ. 2020, 18. [Google Scholar] [CrossRef]
- Yang, S.; Xu, J.; Zhang, J.; Wang, Y.; Peng, S. Reduction of non-point source pollution from Paddy fields through controlled drainage in an aquatic vegetable wetland–ecological ditch system. Irrig. Drain. 2016, 65, 734–740. [Google Scholar] [CrossRef]
- Bao, S.T. Soil and Agro-Chemistry Analysis, 3rd ed.; China Agricultural Press: Beijing, China, 1999; pp. 44–76. (In Chinese) [Google Scholar]
- China, S.E.P.A.O. Standard Methods for Water and Wastewater Monitoring and Analysis, 4th ed.; China Environmental Science Press: Beijing, China, 2002; pp. 243–281. [Google Scholar]
- Paschoal, A.; Homma, S.; Jorge, M.; Nogueira, M. Effect of EM on soil properties and nutrient cycling in a citrus agroecosystem. In Proceedings of the 3rd International Conference on Kyusei Nature Farming. Proceedings of a Conference on Nature Farming for a Sustainable Agriculture, Santa Barbara, CA, USA, 5–7 October 1993. [Google Scholar]
- Khaliq, A.; Abbasi, M.K.; Hussain, T. Effects of integrated use of organic and inorganic nutrient sources with effective microorganisms (EM) on seed cotton yield in Pakistan. Bioresour. Technol. 2006, 97, 967–972. [Google Scholar] [CrossRef] [PubMed]
- Wang, P.; Wu, X.; Li, K.; Hu, Y. Study of preliminary test with utilization of effective microorganisms (EM) in algae--type eutrophical water treatment. Res. Environ. Sci. 2004, 17, 39–43. [Google Scholar]
- Higa, T.; Wididana, G.N. The concept and theories of effective microorganisms. In Proceedings of the First International Conference on Kyusei Nature Farming, Khon Kaen, Thailand, 17–21 October 1989; Parr, J.F., Hornick, S.B., Whitman, C.E., Eds.; Department of Agriculture: Washington, DC, USA, 1991; pp. 118–124. [Google Scholar]


| Wetland Groups | Label Name |
|---|---|
| Water bamboo and arrowhead | W1 |
| Water bamboo and water spinach | W2 |
| Water bamboo and cress | W3 |
| EM 1 (no aquatic plants) | EM1 |
| EM 2 (no aquatic plants) | EM2 |
| EM 3 (no aquatic plants) | EM3 |
| EM water bamboo and arrowhead | EMW1 |
| EM water bamboo and water spinach | EMW2 |
| EM water bamboo and cress | EMW3 |
| Test No. | Time | Wetland 1 | Wetland with EM 1 | EM-Only 1 | Wetland 2 | Wetland with EM 2 | EM-Only 2 | Wetland 3 | Wetland with EM 3 | EM-Only 3 |
|---|---|---|---|---|---|---|---|---|---|---|
| 1 | 2 days | 40.16% | 58.98% | 24.43% | 42.08% | 57.08% | 26.71% | 37.14% | 48.69% | 24.86% |
| 4 days | 65.64% | 78.36% | 34.26% | 58.38% | 73.46% | 39.74% | 60.89% | 75.19% | 32.68% | |
| 8 days | 75.26% | 88.48% | 43.14% | 77.10% | 85.26% | 46.76% | 82.32% | 90.22% | 47.77% | |
| 2 | 2 days | 47.98% | 62.84% | 25.99% | 50.49% | 62.22% | 22.47% | 47.25% | 59.80% | 26.05% |
| 4 days | 57.54% | 73.96% | 39.04% | 70.11% | 80.50% | 36.44% | 68.34% | 82.71% | 34.30% | |
| 8 days | 72.99% | 78.93% | 49.90% | 81.24% | 90.77% | 41.02% | 80.22% | 91.29% | 45.42% | |
| 3 | 2 days | 44.61% | 54.08% | 23.49% | 44.87% | 57.71% | 19.84% | 44.92% | 58.73% | 19.89% |
| 4 days | 61.12% | 77.60% | 37.32% | 69.61% | 76.38% | 33.65% | 62.79% | 80.40% | 28.41% | |
| 8 days | 71.13% | 86.00% | 50.27% | 82.75% | 90.93% | 45.36% | 78.78% | 89.25% | 44.01% |
| Test No. | Time | Wetland 1 | Wetland with EM 1 | EM-Only 1 | Wetland 2 | Wetland with EM 2 | EM-Only 2 | Wetland 3 | Wetland with EM 3 | EM-Only 3 |
|---|---|---|---|---|---|---|---|---|---|---|
| 1 | 2 days | 42.39% | 51.27% | 38.50% | 52.90% | 64.05% | 38.74% | 50.89% | 68.90% | 28.91% |
| 4 days | 67.38% | 76.36% | 51.50% | 73.36% | 80.21% | 52.37% | 71.58% | 83.49% | 44.07% | |
| 8 days | 81.16% | 91.46% | 63.19% | 84.71% | 90.24% | 59.37% | 86.28% | 90.30% | 55.47% | |
| 2 | 2 days | 44.56% | 60.97% | 25.99% | 51.69% | 68.05% | 32.50% | 55.61% | 60.84% | 29.15% |
| 4 days | 63.84% | 77.21% | 37.47% | 67.41% | 85.41% | 45.81% | 74.99% | 78.22% | 38.03% | |
| 8 days | 84.09% | 90.37% | 53.03% | 84.56% | 95.56% | 54.99% | 85.63% | 88.27% | 52.50% | |
| 3 | 2 days | 50.22% | 58.83% | 35.60% | 49.79% | 63.04% | 49.93% | 56.94% | 65.57% | 45.42% |
| 4 days | 68.16% | 76.86% | 48.47% | 71.26% | 83.03% | 57.92% | 75.20% | 80.51% | 52.89% | |
| 8 days | 83.80% | 87.99% | 55.32% | 86.47% | 92.85% | 62.85% | 86.38% | 90.98% | 55.35% |
| Test No. | Time | Wetland 1 | Wetland with EM 1 | EM-Only 1 | Wetland 2 | Wetland with EM 2 | EM-Only 2 | Wetland 3 | Wetland with EM 3 | EM-Only 3 |
|---|---|---|---|---|---|---|---|---|---|---|
| 1 | 2 days | 45.10% | 62.76% | 39.44% | 51.89% | 58.78% | 30.52% | 52.28% | 71.80% | 31.24% |
| 4 days | 67.02% | 82.63% | 50.06% | 72.00% | 85.84% | 47.34% | 70.26% | 80.35% | 50.29% | |
| 8 days | 80.10% | 90.75% | 60.68% | 81.02% | 90.68% | 56.26% | 83.08% | 86.32% | 62.02% | |
| 2 | 2 days | 51.78% | 65.27% | 35.09% | 61.44% | 73.36% | 50.80% | 52.70% | 70.23% | 37.45% |
| 4 days | 72.55% | 82.05% | 48.98% | 80.09% | 85.93% | 59.90% | 71.62% | 83.80% | 45.80% | |
| 8 days | 83.19% | 89.63% | 56.88% | 86.43% | 92.62% | 64.31% | 80.15% | 89.05% | 52.09% | |
| 3 | 2 days | 53.92% | 63.96% | 40.80% | 46.91% | 63.03% | 37.19% | 44.32% | 69.77% | 42.49% |
| 4 days | 70.04% | 80.92% | 57.53% | 75.06% | 78.49% | 55.97% | 75.62% | 86.30% | 49.31% | |
| 8 days | 80.88% | 88.27% | 66.07% | 82.24% | 82.16% | 66.23% | 80.92% | 91.74% | 57.43% |
| Test No. | Time | Time | Wetland 1 | Wetland with EM 1 | EM-Only 1 | Wetland 2 | Wetland with EM 2 | EM-Only 2 | Wetland 3 | Wetland with EM 3 |
|---|---|---|---|---|---|---|---|---|---|---|
| 1 | 2 days | 14.43% | 30.00% | 3.87% | 15.03% | 20.37% | 14.32% | 5.18% | 18.20% | 13.24% |
| 4 days | 28.11% | 39.53% | 8.25% | 21.72% | 33.99% | 22.94% | 14.49% | 39.23% | 25.14% | |
| 8 days | 35.92% | 48.91% | 25.23% | 37.62% | 46.87% | 36.59% | 27.17% | 53.16% | 30.35% | |
| 2 | 2 days | 8.56% | 27.58% | 9.29% | 14.84% | 21.66% | 18.05% | 15.92% | 18.07% | 16.50% |
| 4 days | 17.61% | 37.24% | 22.15% | 19.66% | 38.60% | 30.05% | 24.91% | 36.57% | 26.30% | |
| 8 days | 25.12% | 48.35% | 30.75% | 29.83% | 45.45% | 32.36% | 36.43% | 46.00% | 35.45% | |
| 3 | 2 days | 21.46% | 31.03% | 21.97% | 14.98% | 26.71% | 18.32% | 24.46% | 30.28% | 21.88% |
| 4 days | 32.41% | 44.14% | 30.84% | 25.86% | 37.47% | 36.87% | 38.08% | 43.23% | 25.70% | |
| 8 days | 36.80% | 54.15% | 36.62% | 36.26% | 51.56% | 39.52% | 40.22% | 58.12% | 30.96% |
| Condition | Test No. 1 | Test No. 2 | Test No. 3 | |||||||||||||||
|---|---|---|---|---|---|---|---|---|---|---|---|---|---|---|---|---|---|---|
| TN | TP | TN | TP | TN | TP | |||||||||||||
| 0 days (kg ha−1) | 8 days (kg ha−1) | Removal Efficiency (%) | 0 days (kg ha−1) | 8 days (kg ha−1) | Removal Efficiency (%) | 0 days (kg ha−1) | 8 days (kg ha−1) | Removal Efficiency (%) | 0 days (kg ha−1) | 8 days (kg ha−1) | Removal Efficiency (%) | 0 days (kg ha−1) | 8 days (kg ha−1) | Removal Efficiency (%) | 0 days (kg ha−1) | 8 days (kg ha−1) | Removal Efficiency (%) | |
| W1 | 26.32 | 2.19 | 91.67 | 3.92 | 0.85 | 78.43 | 16.44 | 1.94 | 88.19 | 4.18 | 1.37 | 67.26 | 27.12 | 2.69 | 90.23 | 3.62 | 0.77 | 78.61 |
| W2 | 23.26 | 2.40 | 89.68 | 3.80 | 1.07 | 71.90 | 15.89 | 1.23 | 92.27 | 4.21 | 1.22 | 71.08 | 25.06 | 1.87 | 92.52 | 3.16 | 0.88 | 72.35 |
| W3 | 28.55 | 2.22 | 92.23 | 4.02 | 1.29 | 68.00 | 15.20 | 1.03 | 93.23 | 4.09 | 0.89 | 78.22 | 25.08 | 2.25 | 91.01 | 3.67 | 0.93 | 74.68 |
| EM1 | 27.39 | 11.68 | 57.36 | 3.66 | 2.05 | 43.92 | 19.10 | 6.07 | 68.21 | 4.46 | 1.96 | 56.05 | 26.14 | 8.51 | 67.44 | 3.94 | 1.64 | 58.51 |
| EM2 | 26.33 | 10.59 | 59.77 | 3.98 | 1.91 | 52.09 | 16.61 | 6.58 | 60.42 | 4.44 | 2.01 | 54.61 | 26.62 | 9.31 | 65.01 | 4.19 | 1.62 | 61.27 |
| EM3 | 27.54 | 11.07 | 59.82 | 4.17 | 2.24 | 46.42 | 17.34 | 7.16 | 58.70 | 4.16 | 2.03 | 51.15 | 25.92 | 9.12 | 64.83 | 3.77 | 1.64 | 56.63 |
| EMW1 | 31.95 | 1.33 | 95.83 | 3.80 | 0.70 | 81.49 | 17.76 | 1.48 | 91.67 | 4.43 | 0.91 | 79.58 | 29.12 | 1.69 | 94.21 | 4.11 | 0.78 | 81.03 |
| EMW2 | 26.75 | 1.63 | 93.92 | 4.15 | 0.91 | 78.09 | 18.06 | 0.76 | 95.77 | 4.44 | 1.11 | 75.01 | 25.92 | 0.86 | 96.68 | 4.25 | 0.75 | 82.28 |
| EMW3 | 29.13 | 1.06 | 96.37 | 4.37 | 0.76 | 82.61 | 18.52 | 0.53 | 97.16 | 3.95 | 0.70 | 82.36 | 26.05 | 1.06 | 95.94 | 3.75 | 0.59 | 84.18 |
| Vegetable | Wetland 1 | Wetland with EM 1 | Wetland 2 | Wetland with EM 2 | Wetland 3 | Wetland with EM 3 |
|---|---|---|---|---|---|---|
| Water Bamboo | 573.33 | 803.33 | 536.67 | 672.33 | 513.33 | 593.33 |
| Water spinach | - | - | 1526.67 | 1896.67 | - | - |
| Cress | - | - | - | - | 773.33 | 1016.67 |
| Arrowhead | 336.67 | 450.00 | - | - | - | - |
| Vegetable | Wetland 1 | Wetland with EM 1 | Wetland 2 | Wetland with EM 2 | Wetland 3 | Wetland with EM 3 | ||||||
|---|---|---|---|---|---|---|---|---|---|---|---|---|
| TN | TP | TN | TP | TN | TP | TN | TP | TN | TP | TN | TP | |
| Water Bamboo | 24.26 | 2.55 | 33.99 | 3.58 | 22.71 | 2.93 | 28.45 | 3.67 | 21.72 | 2.29 | 25.11 | 2.64 |
| Water Spinach | - | - | - | - | 31.78 | 1.57 | 39.48 | 1.95 | - | - | - | - |
| Cress | - | - | - | - | - | - | - | - | 42.34 | 15.66 | 55.66 | 20.59 |
| Arrowhead | 48.00 | 6.93 | 64.15 | 9.27 | - | - | - | - | - | - | - | - |
© 2020 by the authors. Licensee MDPI, Basel, Switzerland. This article is an open access article distributed under the terms and conditions of the Creative Commons Attribution (CC BY) license (http://creativecommons.org/licenses/by/4.0/).
Share and Cite
Li, X.; Guo, Q.; Wang, Y.; Xu, J.; Wei, Q.; Chen, L.; Liao, L. Enhancing Nitrogen and Phosphorus Removal by Applying Effective Microorganisms to Constructed Wetlands. Water 2020, 12, 2443. https://doi.org/10.3390/w12092443
Li X, Guo Q, Wang Y, Xu J, Wei Q, Chen L, Liao L. Enhancing Nitrogen and Phosphorus Removal by Applying Effective Microorganisms to Constructed Wetlands. Water. 2020; 12(9):2443. https://doi.org/10.3390/w12092443
Chicago/Turabian StyleLi, Xiaotian, Qizhong Guo, Yintang Wang, Junzeng Xu, Qi Wei, Lina Chen, and Linxian Liao. 2020. "Enhancing Nitrogen and Phosphorus Removal by Applying Effective Microorganisms to Constructed Wetlands" Water 12, no. 9: 2443. https://doi.org/10.3390/w12092443
APA StyleLi, X., Guo, Q., Wang, Y., Xu, J., Wei, Q., Chen, L., & Liao, L. (2020). Enhancing Nitrogen and Phosphorus Removal by Applying Effective Microorganisms to Constructed Wetlands. Water, 12(9), 2443. https://doi.org/10.3390/w12092443