Article

Combining Water Quality Indices and Multivariate Modeling to Assess Surface Water Quality in the Northern Nile Delta, Egypt

1
Hydrogeology, Evaluation of Natural Resources Department, Environmental Studies and Research Institute, University of Sadat City, Minufiya 32897, Egypt
2
Agricultural Engineering, Evaluation of Natural Resources Department, Environmental Studies and Research Institute, University of Sadat City, Minufiya 32897, Egypt
3
Soil and Water Department, Faculty of Agriculture, Kafrelsheikh University, Kafr El-Sheikh 33516, Egypt
4
Arid Land Agriculture Department, Faculty of Meteorology, King Abdulaziz University, Jeddah 21589, Saudi Arabia
5
Biology Department, College of Science, University of Ha’il, Ha’il 55476, Saudi Arabia
6
Department of Civil Engineering, College of Engineering, King Khalid University, Abha 61321, Saudi Arabia
7
Department of Civil Engineering, High Institute of Technological Studies, Mrezgua University Campus, Nabeul 8000, Tunisia
8
Biology Department, College of Science, King Khalid University, Abha 61321, Saudi Arabia
9
Botany Department, Faculty of Science, Kafrelsheikh University, Kafr El-Sheikh 33516, Egypt
10
Geology Department, Faculty of Science, Damanhour University, Damanhour 22511, Egypt
*
Author to whom correspondence should be addressed.
Water 2020, 12(8), 2142; https://doi.org/10.3390/w12082142
Submission received: 14 June 2020 / Revised: 25 July 2020 / Accepted: 26 July 2020 / Published: 29 July 2020
(This article belongs to the Section Water Quality and Contamination)

Abstract

:
Assessing surface water quality for drinking use in developing countries is important since water quality is a fundamental aspect of surface water management. This study aims to improve surface water quality assessments and their controlling mechanisms using the drinking water quality index (DWQI) and four pollution indices (PIs), which are supported by multivariate statistical analyses, such as principal component analysis, partial least squares regression (PLSR), and stepwise multiple linear regression (SMLR). Twenty-two physicochemical parameters were analyzed using standard analytical methods for 55 surface water sites in the northern Nile Delta, Egypt. The DWQI results indicated that 33% of the tested samples represented good water, and 67% of samples indicated poor to unsuitable water for drinking use. The PI results revealed that surface water samples were strongly affected by Pb and Mn and were slightly affected by Fe and Cr. The SMLR models of the DWQI and PIs, which were based on all major ions and heavy metals, provided the best estimations with R2 = 1 for the DWQI and PIs. In conclusion, integration between the DWQI and PIs is a valuable and applicable approach for the assessment of surface water quality, and the PLSR and SMLR models can be used through applications of chemometric techniques to evaluate the DWQI and PIs.

1. Introduction

Surface water is an essential natural resource and a sensitive issue for human life in developing countries. The pollution of freshwater resources by heavy metals has become one of the main environmental concerns in recent decades and is due to natural contamination processes and human practices, which have significantly degraded surface water quality and have led to serious health hazards for drinking use with local and regional implications [1,2,3,4]. The water quality in any region is under stress from both natural processes and anthropogenic activities, as well as from the transportation of nutrients and heavy metals to surface waters [5,6,7].
The present study area is one of the most important developed regions in the northern Nile Delta (Egypt) with many reclamation projects and industrial activities and a large population density; thus, the surface water network in the study area is considered an important water resource for drinking and many other purposes. The surface water network in the study area receives substantial quantities of pollutants from agricultural areas, sewage, and industrial activities [8]. For example, El-Bouraie et al. 2010 [9] studied the distribution of heavy metals in surface water, such as Al, Ba, Cd, Co, Cr, Cu, Fe, Mn, Ni, Pb, and Zn and their impacts on the water quality. Significant local water contamination issues were found due to the increasing swept-out effluents along different drains into the River Nile and extensive use of water.
In addition, the concentrations of the trace elements in the study area showed Fe to be the most abundant element in all water points followed by Mn, Cr, Pb, Al, Cu, Ba, Ni, Cd, Co, and Zn [10,11]. These are due to agricultural and industrial activities mainly responsible for elevated levels of the measured elements in river water. In addition, the other sources of the polluting heavy metals in freshwater include atmospheric deposition, contamination of water in natural geologic deposits, manufacturing processes related to metals, and discharges of municipal waste.
Assessing surface water quality for drinking use is determined through the drinking water quality index (DWQI), which presents a useful interpretation of water quality for drinking [12]. The DWQI is a powerful approach for creating simple and easily understandable monitoring tools that reveal the cumulative influences of different physicochemical parameters, is based on the weight and rate of each parameter, and expresses water quality. Physicochemical parameters provide a useful interpretation for evaluating trends, identifying specific environmental issues, and communicating information on water quality and water vulnerability to pollution [13,14,15].
A single water quality parameter by itself is not appropriate for evaluating water quality because it may be limiting and may produce insufficient performance; therefore, some documented pollution indices (PIs) have defined indices for B, Cd, Cr, Cu, F, Fe, Mn, Ni, Pb, and Zn contents and include the heavy metal pollution index (HPI), heavy metal evaluation index (HEI), contamination index (CD), and pollution index (PI), which can be used to understand the current status of surface water hydrochemistry and evaluate water suitability for drinking purposes. Surface water sources are vulnerable to impacts from human activities that may contribute to potential ecosystem destruction, so water pollution indices, including the HPI, HEI, CD, and PI, are useful approaches for surface water quality assessment and reflect overall water quality by considering the cumulative effects of heavy metals [16,17,18]. Water pollution indices are deemed a cost-effective means of preserving safety by establishing a control scheme for assessing the development, growth, urban production, and direction of human activities to reduce detrimental impacts on water quality resources. Many studies on water pollution and water quality monitoring have used documented pollution indices for heavy metals and include works by AbouZakhem and Hafez 2015 [19], Balakrishna and Ramu 2016 [20], El Fehri et al. 2014 [21], Gad and El-Hattab 2019 [1], and Sobhanardakani et al. 2017 [22].
The HPI is an effective method for rating the combined effect of individual heavy metals on overall water quality and the perception of surface water suitability for human use [23]. In addition, the HEI also considers the possible additive impact of heavy metals, which enables rapid assessment of overall drinking water quality [24,25]. The CD independently tests the relative toxicity of specific metals and reflects the cumulative effects of all metals on water quality, and the PI measures the levels of contamination effects on water quality with respect to individual heavy metals [26]. Therefore, water quality is assessed by measuring the degree of heavy metal exposure as an integration of the individual contamination parameters through the cumulative effects of heavy metals that are deemed hazardous for human consumption [18,22,27]. Although the DWQI and PIs are useful for water quality evaluation, multivariate statistical analyses are also broadly used to assess water quality, such as principal component analysis (PCA), which is widely used in hydrochemical and hydrogeological studies [28,29,30,31]. Therefore, PCA is a multivariate technique to identify significant heavy metals and the interrelationships between those metals and to understand the main factors influencing the distribution of those metals in surface water resources [3,32].
Integration of the DWQI and PIs is a valuable and applicable approach for assessing surface water quality through learning machine models, which are essential to describe the status of surface water quality and its controlling mechanisms for policymakers, which is helpful for selecting appropriate treatment techniques to address issues of concern [33,34]. Calculating the DWQI and PIs requires many calculation steps that require significant time and effort to transform large amounts of water characterization data into a single value describing the water quality level and reflecting the overall water quality level [17,26,35,36]. The partial least squares regression (PLSR) and stepwise multiple linear regression (SMLR) could be used to overcome this problem since they are typical methods that specify a linear relationship between a set of independent and response variables [37,38,39,40,41,42,43]. To the best of our knowledge, there is very little information available on comparative assessments of the performance of PLSR and SMLR models for predicting the DWQI and PIs.
Therefore, the objectives of this work were to (i) investigate water faces, heavy metals and geochemical processes by using physicochemical parameters; (ii) evaluate the suitability of the surface water for drinking purposes using the DWQI; (iii) evaluate surface water vulnerability to contamination using PIs, such as the HPI, HEI, CD, and PI; (iv) evaluate the performance of PLSR models as rapid methods based on major ions and heavy metals to predict the DWQI and PIs; and (v) evaluate stepwise multiple linear regression analyses based on the most influential major ions and heavy metals to estimate the DWQI and predict PIs.

2. Material and Methods

2.1. Study Area

The study area is located in the northern Nile Delta (Egypt), which is located between 30°59′38″ and 31°36′00″ E latitude and between 30°21′40″ and 31°18′40″ N longitude (Figure 1). Thus, it is considered the end of the disposal of all pollutants (agricultural and industrial). This area is bounded by the Mediterranean Sea to the north, with a coastline of approximately 100 km, by the Rosetta Nile Branch to the west, by the Damietta Nile Branch to the east, and by the Al Gharbiya Governorate to the south. According to Central Agency for Public Mobilization and Statistics (CAPMAS) 2012 [44], the study region has a total population of approximately 2.9 million people, which represents approximately 3.6% of the total population in Egypt.

2.2. Sampling and Analyses

Fifty-five water samples were collected from the surface water network in the studied area during summer 2019, and the geographical locations of each sampling site were recorded using Universal Transverse Mercator (UTM) coordinates by a handheld MAGELLAN GPS 315 (Figure 1). Two sets of surface water samples were collected from each sampling location in 500 mL polyethylene bottles and were filtered through 0.45 µm Whatman filter paper. For trace elements analysis, the first set was acidified using nitric acid to a pH < 2. The other set was used to measure the rest of the physicochemical parameters. All the water samples were stored in a 4 °C refrigerator. In this study, 22 physicochemical parameters, including water temperature, pH, total dissolved solids (TDS), electrical conductivity (EC), K+, Na+, Ca+2, Mg2+, Cl, SO42−, alkalinity, NO3, B, Cd, Cr, Cu, F, Fe, Mn, Ni, Pb, and Zn, were analyzed using standard analytical techniques [45]; the results are presented in Table 1 and Table S1. Alkalinity was referred to the HCO3 since CO32− was below the detection limit. Water temperature, total dissolved solids (TDS), pH, and electrical conductivity (EC)were measured in situ using a portable calibrated salinity multi-parameter instrument (Hanna HI 9811-5, Hanna Instruments Italia Srl, 35030 Sarmeola di Rubano-PD, Italy). Alkalinity and Cl were analyzed by volumetric titration, while K+, Na+, Ca+2, Mg2+, Cd, Cr, Cu, Fe, Mn, Ni, Pb, and Zn were analyzed using an atomic absorption spectrometer (FAAS-Zeeman AASZ-5000, Hitachi, Japan). In addition, a UV/visible spectrophotometer was used to analyze SO42−, NO3, B, and F. These procedures are highlighted in American Public Health Association (APHA) 2012 [45].

2.3. Indexing Approach

Water quality indices (WQIs), such as the DWQI, HPI, HEI, CD, and PI, were estimated with respect to heavy metal concentrations.

2.3.1. Drinking Water Quality Index (DWQI)

The DWQI is defined by mathematical methods and is considered the most useful index for measuring the overall quality of surface water for drinking use. The DWQI is calculated using the arithmetic weight method according to Equation (1):
D W Q I = i = 1 n Q i W i
Qi is the sub-quality index of each parameter, Wi is the weight unit of each parameter, and 22 physicochemical parameters, expressed in mg/L (n = 22), were used. The computed value of Qi depends on the surface water concentration (Ci) and standard (Si) for the drinking water value of each surface water parameter according to the World Health Organization (WHO) 2011 [46], as shown in Equation (2):
Q i = C i S i × 100  
W i = w i   w i
wi for each parameter was calculated according to the recommended standards [46] by Equation (4):
wi = K/Si
where K is the proportionality constant.
To compute the DWQI, assigning a weight to each surface water parameter (wi) and calculating the relative weight (Wi) and quality rating range (Qi) are required. Therefore, Wi values were assigned for pH, EC, TDS, TH, K+, Na+, Ca+2, Mg2+, alkalinity, Cl, SO42−, NO3, B, Cd, Cr, Cu, F, Fe, Mn, Ni, Pb, and Zn, while wi was calculated using Equation (4). Weighted values were assigned according to the relative significance of the surface water parameters for drinking water quality and ranged from 1 to 5 [35]. The computed values of the standards, weights (wi), and relative weights (Wi) for the surface water parameters are presented in Table 2.

2.3.2. Pollution Indices (PIs)

The pollution indices, including the HPI, HEI, CD, and PI, were estimated for the concentrations of heavy metal, such as B, Cd, Cr, Cu, F, Fe, Mn, Ni, Pb, and Zn, according to the equations presented in Table 3.

Heavy Metal Pollution Index (HPI)

The overall water quality was represented by a toxicological index (HPI) based on rating the arithmetic weights of heavy metals. The HPI values reflect the combined influence of the metals on total water quality [17,22] with respect to the recommended standard guidelines (Si) for each metal, namely, B, Cd, Cr, Cu, F, Fe, Mn, Ni, Pb, and Zn. The HPI values were estimated according to Equation (5):
H P I = i = 1 n W i Q i i 1 n W i
where Wi and Qi are the unit weights and the sub-indices for B, Cd, Cr, Cu, F, Fe, Mn, Ni, Pb, and Zn, respectively, and n = 10, which represents the number of heavy metals monitored. The HPI values were classified into three categories, which consisted of low heavy metal pollution (HPI < 100), heavy metal pollution with threshold risk (HPI = 100), and high heavy metal pollution (HPI > 100) [16,47].

Heavy Metal Evaluation Index (HEI)

Water quality conditions under the stress of heavy metals were represented by the HEI according to Equation (6):
H E I = i = 1 n H c H m a x
where Hc is heavy metal concentration, Hmax is the maximum allowed concentration for each metal, and the subscript i is the i-th sample [36].

Contamination Index (CD)

The surface water contamination levels were measured using the contamination factors of individual heavy metals that exceeded permissible limits, which are expressed by CD values [16,26] according to Equations (7) and (8):
C D = i = 1 n C f i
C f i = C A i C N i 1
where Cfi is the contamination factor for an individual heavy metal, CAi is the analytical value for each metal, CNi is the permissible concentration of each metal, and CNi is taken as MAC.

Pollution Index (PI)

The effect of pollution on surface water was measured for heavy metals using PI values. These reflect the individual contamination effect of each heavy metal on surface water quality and categorized to five classes (Table 4) according to Equation (9):
P I = [ ( C i S i ) m a x 2 + ( C i S i ) m i n 2 ] 2
where Ci is the concentration of each metal and Si is the metal level according to the concentration of each metal in water [2,26].

2.4. Data Analysis

SPSS software version 22 (SPSS Inc., Chicago, IL, USA) was used to calculate statistical parameters (e.g., minimum, maximum, mean, and standard deviation) of the physicochemical parameters. The imitative techniques, such as the Piper diagram [48] and Gibbs diagram [49], were applied using Geochemist’s Workbench Student Edition 12.0 software to identify surface water facies, geochemical processes, and the dominant surface water chemistry control factors.
Multivariate statistical analyses are widely used for water quality assessments to improve the identification of effective pollutant factors in surface water by reducing the chemical analysis data into common patterns [28,29,30,31]. PCA was applied to recognize the sources or factors that were responsible for changes in water quality by transforming the original variables into a new set of variables that reflected the influence of major ions and heavy metals on surface water quality. The analytical chemical results of the physicochemical concentrations were processed for PCA using PAST software version 3.25 (Øyvind Hammer, University of Oslo, Oslo, Norway).
Chemometric methods, such as PLSR, are important modeling techniques that can effectively analyze data with many strongly multi collinear and noisy variables. PLSR was built by using unscramble X software version 10.2 (CAMO Software AS, Oslo, Norway). It was used to construct predictive models of the DWQI based on the major ions and heavy metals as input parameters and for PIs with respect to heavy metals. For example, PLSR is a standard calibration method for testing a single dependent variable (e.g., HPI) and multiple independent variables (e.g., B, Cd, Cr, Cu, F, Fe, Mn, Ni, Pb, and Zn). The PLSR tool can construct accurate models if the number of independent variables significantly exceeds the number of measured traits (e.g., dependent variables) [43,50,51]. The calibration and validation models were constructed through cross-validation of PLSR to minimize overfitting.
An important step in PLSR analysis is to select the optimum number of latent factors (PCs) to represent the calibration data without overfitting. To increase the model performances, 12-fold cross-validation was performed on the data to increase the robustness of the results, and the maximum number of latent factors was selected for the DWQI and PIs, as suggested by the software. The accuracies of the calibration (Cal.) and validation (Val.) models were indicated by the adjusted coefficients of determination, root mean square errors (RMSE), and slopes of the linear relationship models between the observed and predicted of values of the DWQI and PIs. The best model for both Cal. and Val. was chosen based on the RMSE minimum value and the maximum R2 value and slope value.
SPSS software version 22 was used to construct stepwise multiple linear regressions (SMLR). Stepwise multiple linear regression (SMLR) is also a statistical regression method that is used to analyze the relationship between the single variable responses (e.g., dependent variable) with two or more variables (e.g., independent variables).
The major ions and heavy metals were further analyzed using the SMLR method to identify the most influential parameters that explained the greatest variability in the DWQI and PIs. This approach incorporated forward selection and backward elimination and selects the input variable (e.g., major ions or heavy metals) for the step-by-step regression equation depending on the significance of the input variables. Only those parameters that remained relevant at p-values with an F-statistic of 0.05 in the models were retained at each step. In addition, the parameters were discarded with a significant probability level set at 0.01 during backward elimination [52]. The equation for stepwise multiple linear regression models can be represented as:
Y = β0 + β1X1+ β2X2 + β3X3 + ... βmXm
where Y = response variable, such as DWQI and PIs, β0 = Constant variable, β1 to βm = coefficients of control variables of major elements or heavy metals, and X1 to Xm = control variables of major elements or heavy metals.

3. Results

3.1. Physicochemical Data

Physiochemical parameters play a decisive role in water quality assessments and are considered a significant reference for understanding the nature of water chemistry and relevant control mechanisms. Statistical descriptions of the physicochemical parameters in the collected surface water network are presented in Table 1. For example, the physiochemical parameters obtained show that the TDS values for the surface water samples ranged from 260 mg/L to 506 mg/L, with a mean value of 359.7 mg/L, and were associated with EC values, which varied from 406.3 to 790.6 μS/cm. The cation and anion concentrations of K+, Mg+2, Na2+, Ca+2, Cl, SO42−, alkalinity, and NO3 showed mean values of 7.4, 17.0, 32.5, 39.6, 28.8, 52.1, 184.3, and 1.5 mg/L, respectively (Table 1). On the other hand, the heavy metal concentrations of B, Cd, Cr, Cu, F, Fe, Mn, Ni, Pb, and Zn showed mean values of 0.07, 0.0005, 0.047, 0.0087, 0.265, 0.206, 0.104, 0.0170, 0.0213, and 0.0034 mg/L, respectively.

3.2. Geochemical Facies and Controlling Mechanisms

Piper’s trilinear diagram was applied with respect to dominant cations and anions in surface water samples (Figure 2). According to the chemical composition of the analyzed surface water samples, there are two water types presented by Ca-Mg-alkalinity and Ca-Mg-Cl-SO4. In addition, the main controlling processes that drive the surface water geochemistry are recognized using Gibb‘s diagram by plotting TDS vs. the ratios (Na + K)/(Na + K + Ca) and Cl/(Cl + alkalinity). According to the plot of geochemical data on the Gibbs diagram, the surface water points were scattered in the weathering and rock dominance fields (Figure 3).

3.3. Water Quality Indices

Statistical descriptions of water quality indices, including the DWQI, HPI, HEI, and CD, are presented in Table 5. The DWQI values ranged from 36.72 to 136.73, with a mean value of 66.99, and the results obtained indicated that 33% of surface water samples fell in the good water category, while 58% of samples were in the poor water category, and 9% of samples were in the very poor to unsuitable water categories for drinking use. The spatial distribution map of DWQIs of the surface water network in the studied area indicated that most of the surface water quality degradation was observed near Burulus Lake at the end of the Rosetta Branch along the trend of the northwestern portion of the Nile Delta (Figure 4a). The HPI values ranged from 26.28 to 222.51, with a mean value of 68.24, which revealed that 87% of samples were lower than the critical HPI value (100), representing low polluted water values, while 13% of samples were above the critical HPI value, representing water highly polluted by heavy metals (Figure 4b). The HEI values of the surface water samples ranged from 1.98 to 17.23, with a mean value of 6.59, and the HEI results indicated that all surface water samples were gradually affected by heavy metals, where 4% of samples were moderately affected, 49% of samples were strongly affected, and 47% of samples were seriously affected by heavy metals. According to the spatial variation map of HEI results, surface water samples were more affected by heavy metals in the central and northwestern parts in the direction of surface water flow from the south to northwest parts of the Nile Delta (Figure 4c). The computed values for CD for the studied surface water samples revealed that the CD values ranged from −8.02 to 7.23, with a mean value of 3.33. The CD values revealed that the majority of surface water samples (91%) had negative values (CD < 1), indicating better quality with respect to heavy metals, while the remaining samples (9%) had positive values (CD > 1), indicating medium to highly contaminated surface water (Figure 4d).
The PI results revealed two classes of heavy metal effects based on the classification of PI levels (Table 6). The PI values obtained revealed that the surface water samples were slightly affected by Cr (PI = 1.0) and Fe (PI = 1.17). In addition, the surface water network was strongly affected by Mn (PI = 4.50) and Pb (PI = 4.50), while there were no effects exerted by B, Cd, Cu, F, Ni, and Zn (PI > 1.0).

Relationships between the Drinking Water Quality Index and Pollution Indices

The relationships between the DWQI and PIs (as dependent variables) were calculated via simple regressions, as shown in Figure 5. The plot of DWQI vs. PIs, including HPI, HEI, and CD, showed a high positive correlation coefficient (R2 = 0.91) with HEI and CD, while the relationship with HPI also had a high positive correlation (R2 = 0.79).

3.4. Multivariate Statistical Analysis

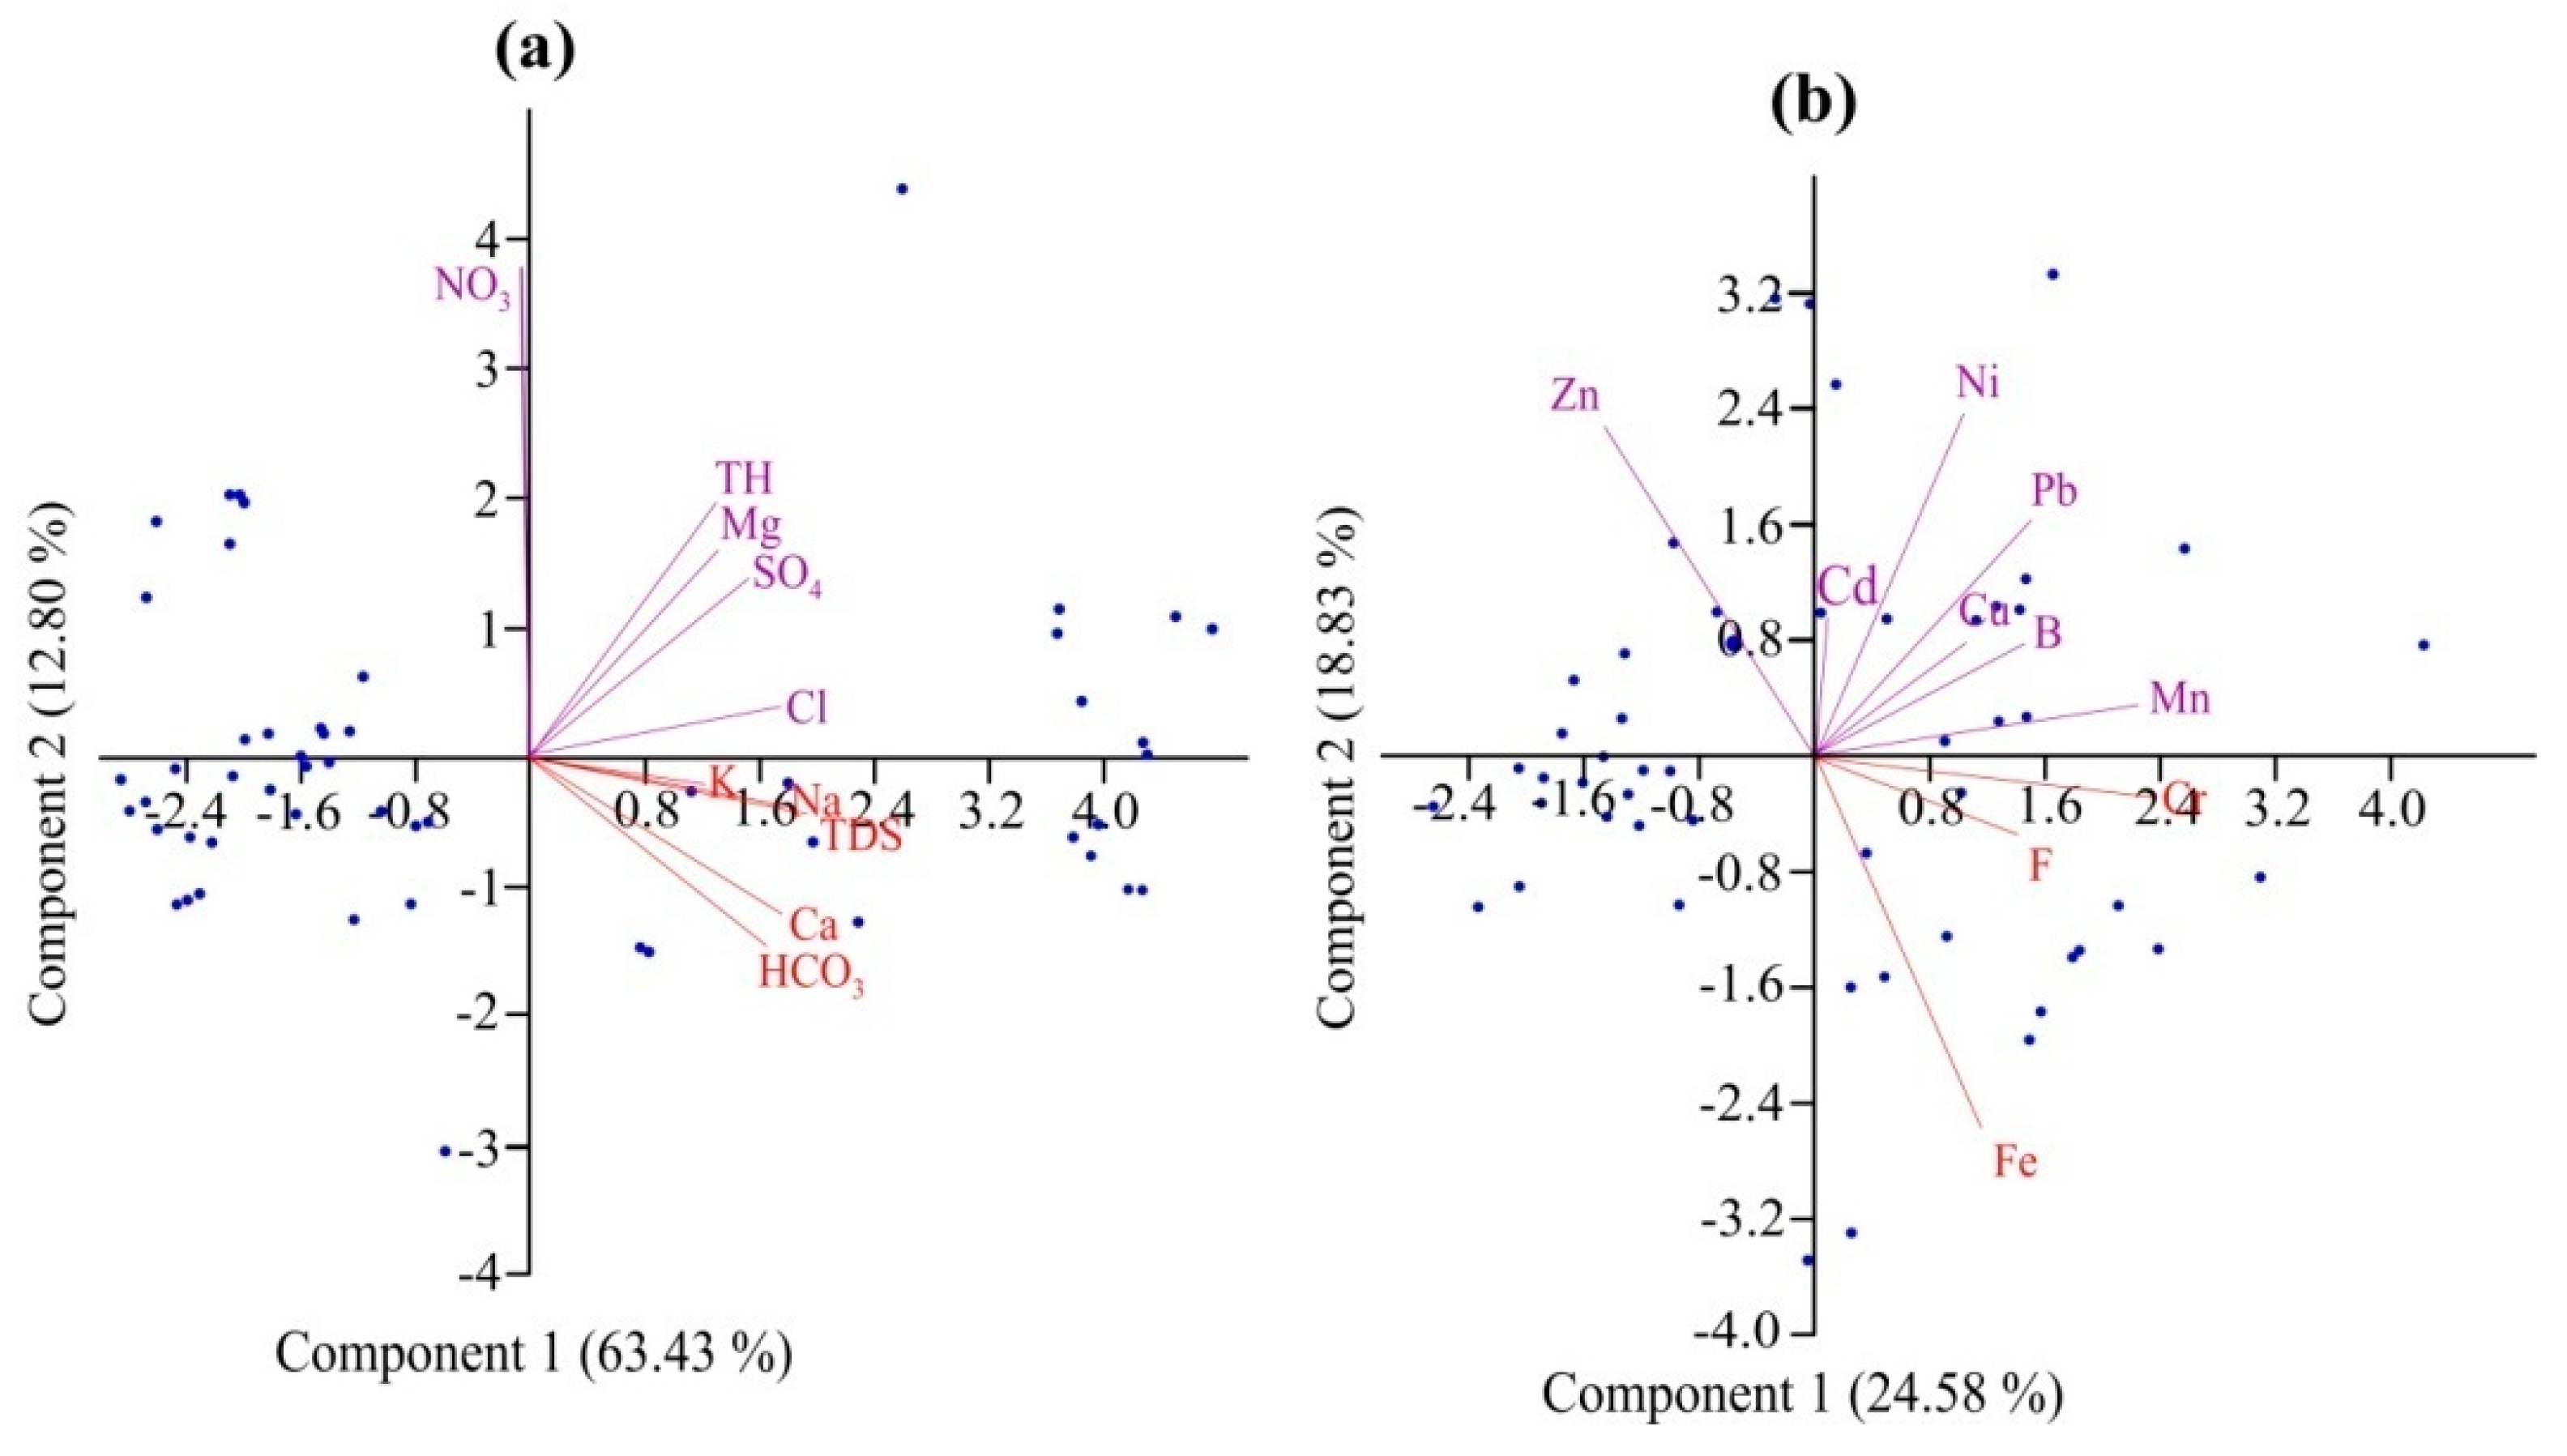
3.4.1. Principal Component Analysis

PCA was performed for all major ions and heavy metals for the surface water sites, and the results are presented in Figure 6. PCA explained 63.43% and 12.80% of the total variation between major ions (Figure 6a) as well as 24.58% and 18.83% of the total variation between heavy metals (Figure 6b). All major ions were grouped in a positive direction expect for NO3, and all major ions and heavy metals were grouped in a positive direction except for Zn. The PCA results revealed that the presence of ten fundamental principal components indicated the effect of heavy metals on surface water quality in the study area; therefore, PC1 showed maximum loading of Fe, Cr, and F, while PC2 showed maximum loading of Pb, Mn, Ni, B, Cd, and Cu (Figure 6b).

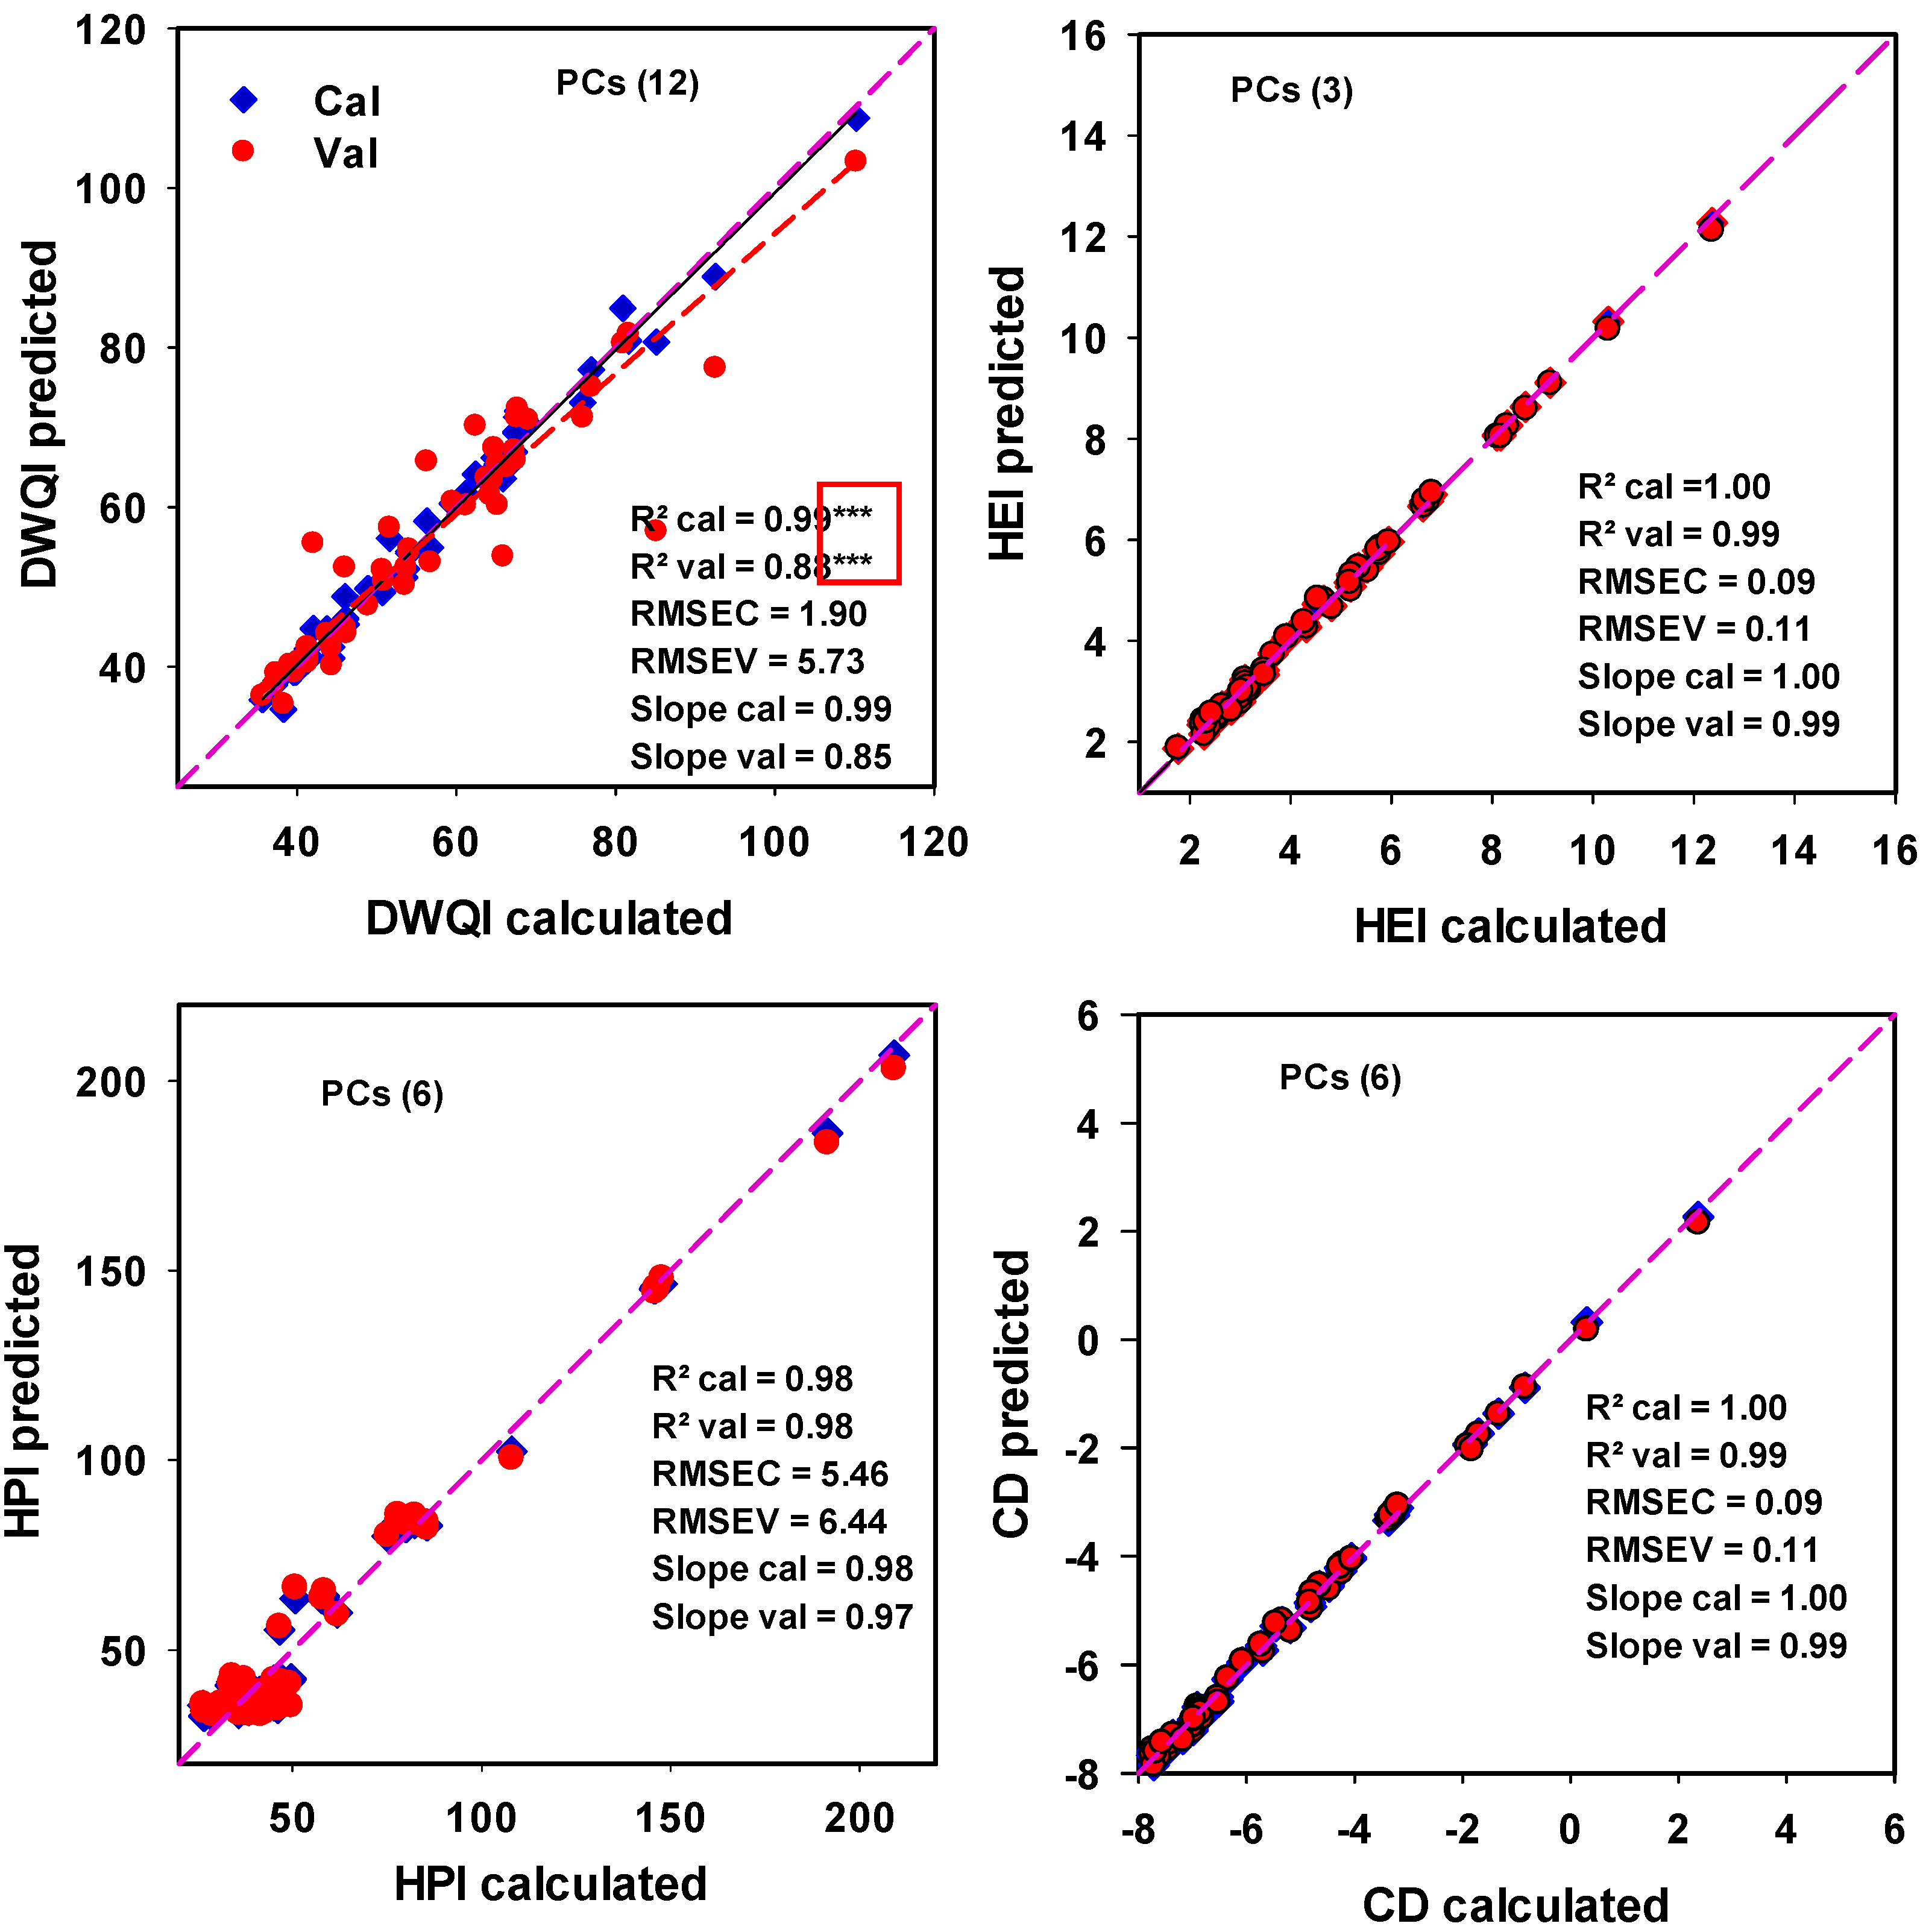
3.4.2. The Performance of Partial Least Square Regression Models and Stepwise Multiple Linear Regressions to Predict the Drinking Water Quality Index and Pollution Indices

Figure 7 shows a 1:1 scatter plot of the observed and predicted values for the DWQI and PIs for the PLSR analysis of water sites. The PLSR models provided accurate predictions of the DWQI, HPI, HEI, and CD for both the Cal. and Val. datasets, with R2 values ranging from 0.98 to 1.00 in the Cal. dataset and from 0.88 to 0.99 in the Val. Analysis of the optimum number of latent factors (PCs) to represent the calibration data without overfitting in the PLSR models was indicated (Figure 7).
Stepwise multiple linear regression was used to estimate the most influential parameters to better assess the greatest variations for the DWQI and PIs. For example, The SMLR model using all the major ions and heavy metals as input data, performed better for estimating the DWQI as output variable of water samples in Table 7 with (R2 = 1 and standard error = 0.394). Since SMLR model (21) in Table 7 had the lowest standard error and highest R2, this model was selected to estimate the DWQI. The equation for the model is:
DWQI = 2.713 × 10⁻⁸ + 684.932 × (Pb) + 0.022 × (TDS) + 18.265 × (Fe) + 109.589 × (Cr) + 58.708 × (Ni) + 13.699 × (Mn) + 1369.863 × (Cd) + 0.274 × (K) + 0.091 × (Mg) + 0.034 × (alkalinity) + 3.653 × (F) + 0.009 × (TH) + 0.016 × (SO4) + 0.731 × (pH) + 1.712 × (B) + 0.137 × (NO3) + 0.037 × (Ca) + 0.021 × (Na) + 0.005 × (Cl) + 1.37 × (Cu) + 0.548 × (Zn)
SMLR model (10) using all heavy metals as input data performed better for estimating the three pollution indices (e.g., HPI, HEI, and CD) as output variable in Table 7. SMLR and the equations of three models are:
HPI = 1.167 × 10⁻⁸ + 2104.22 × (Pb) + 23380.21 × (Cd) + 84.17 × (Cr) + 42.94 × (Ni) + 2.34 × (Fe) + 1.32 × (Mn) + 0.94 × (F) + 0.04 × (B) + 0.05 × (Cu) + 0.01 × (Zn)
HEI = 1.891 ×10⁻¹⁰ + 100.0 × (Pb) + 3.333 × (Fe) + 20.0 × (Cr) + 14.286 × (Ni) + 2.5 × (Mn) + 0.667 × (F) + 333.333 × (Cd) + 0.417 × (B) + 0.5 × (Cu) + 0.2 × (Zn)
CD = 100 × (Pb) + 3.333 × (Fe) + 20 × (Cr) + 14.286 × (Ni) + 2.5 × (Mn) + 0.667 × (F) + 333.333 × (Cd) + 0.417 × (B) + 0.5 × (Cu) + 0.2 × (Zn) − 10.0
In general, the four above equations performed the best estimation for the DWQI, HPI, HEI, and CD, respectively, with the lowest standard error and highest R2.

4. Discussion

4.1. Physiochemical Parameters

Ostensibly, the physicochemical parameters obtained show that the pH values were slightly acidic to alkaline and fell in the range of acceptable drinking water according to the guidelines of the WHO 2011 [46]. The pH values revealed the presence of Ca2+, Mg2+, and CO32− in the water samples and a reduction in heavy metal toxicity [53,54]. The TDS levels for the collected samples indicated that the surface water quality was of the freshwater type (e.g., less than 1000 mg/L) because of the effects of very little solute dissolution and rapid ion exchange between soil and water through continuous recharging from the Nile Delta branches. Seemingly, the EC values were lower than the permissible limit for drinking water according to the guidelines of the WHO 2011 [46] (1500 μS/cm), which indicated the suitability for drinking purposes.
The cation and anion concentrations indicated that calcium was the dominant cation, and sodium was the second most prevalent cation. In addition, alkalinity was the dominant anion, and sulfate was the second most prevalent anion. Based on the results of cation and anion concentrations, the surface water of the study area had values below the WHO 2011 [46] guidelines except for alkalinity in some samples from the southern part of the study area. The high alkalinity concentrations indicated that the surface water in the study area was in the first stage of water quality evolution.
On the other hand, the heavy metal concentrations for B, Cd, Cr, Cu, F, Fe, Mn, Ni, Pb, and Zn varied significantly between samples, which indicated that the surface water in the study area was contaminated with chromium, iron, manganese, and lead at levels that exceeded the proposed permissible limits according to the WHO 2011 [46]; these heavy metal results were also reported by Masoud et al. 2007 [8]. The obtained physicochemical results for the studied area are comparable to those reported by many studies in this region [8,9,10,11].
The physicochemical properties of water are considered natural, and can be used to comprehensively understand the factors influencing pathways affecting the quality of surface water. Surface water chemistry focused on hydrochemical criteria provides preliminary information on water types and various geochemical processes [14,55,56,57].
Piper’s classification revealed that alkaline earths (Ca, Mg) and weak acids (alkalinity) were in preponderance over alkalis (Na, K) and strong acids (SO4, Cl) in the majority of the selected water points in the study area, thereby indicating Ca-Mg-alkalinity water type. The prevailing water types in the study area, as shown by the Piper diagram (Figure 2), were Ca-Mg-alkalinity and Ca-Mg-Cl-SO4 facies. These facies indicated that the surface water was affected by rock water interaction and weathering processes [58].
According to the plot of geochemical data on Gibbs diagram, the surface water points were scattered in the weathering and rock dominance fields (Figure 3). Therefore, these processes are considered the main factors controlling mechanisms that effect surface water geochemistry in the study area. The impact of these geochemical processes on ambient water quality of the Nile River water has not been significant due to the high self-assimilation capacity of the river water.

4.2. Assessment of Water Quality Indices

WQIs are viewed as a significant tool to detect the suitability of water for drinking use with respect to heavy metals [59]. The WQIs results obtained showed that the majority of surface water sites in the study area were not recommended for drinking use, especially in the northwestern parts of the study area near Burulus Lake in the downstream portion of the Rosetta Branch (Figure 4). This may be attributed to the poor drainage network and runoff from extensive tracts of farmed areas [60]. Accordingly, surface water in the study area should be treated before it can be used for drinking purposes. The pollution indices, including the HPI, HEI, and CD, revealed that surface water in the study area was contaminated by heavy metals and that heavy metal pollution increased gradually from the south to northwestern parts in the direction of the surface water network flow (Figure 1). In the present study, there was no significant correlation between the distribution of the contamination and the flow directions, and this could be due to the proportions of variables in the heavy metal measurement schemes. Therefore, the contamination of surface water by heavy metals reached high levels in the areas that were dissected by drainage networks and aggregation of heavy metal content during surface water low-flow states, high temperatures, and evaporation in the study area as reported by Abdel-Satar 2001 [61] (Figure 4). In addition, the PI results revealed that the surface water sites were slightly affected by Cr and Fe and were strongly affected by Mn and Pb (Table 6). The high loadings of Fe and Mn may be attributed to soil–water interactions, while the high loading of Cr revealed industrial activities. In addition, the high contribution of Pb could be considered to be due to traffic activities [62,63], and poor sanitation infrastructure. A comparison of the spatial distribution maps of both DWQI and HEI results (Figure 4a,c) reflected the degradation of surface water quality for drinking use near the downstream part of the Rosetta Branch. Deterioration in surface water quality in the study area was influenced by heavy metals, based on the relationship between the DWQI and PIs (Figure 5). Thus, the water quality degradation in the studied area indicated that the surface water network was highly polluted according to HPI and was strongly to seriously affected by heavy metals according to HEI while reflecting low water pollution levels for CD due to variations in the evaluation schemes for heavy metal concentrations. Surface water quality in the studied area was subject to degradation due to the increasing levels of swept-out effluents along different drains into the surface water network. Therefore, the integration of the DWQI and PIs is a valuable and applicable approach for assessment of surface water quality for drinking purposes based on physicochemical parameters with respect to heavy metals.

4.3. Multivariate Statistical Analysis

4.3.1. Principal Component Analysis

PCA of surface water samples for the major ions revealed lithogenic sources that resulted from soil–water interactions and were represented by the loadings of TDS, K+, Na+, Ca+2, and alkalinity on PC1 and the loadings of TH, Mg2+, Cl, and SO42− on PC2 (Figure 6a). On the other hand, PCA of surface water sites for metals also revealed the loadings of Fe, Cr, and F on PC1 and the loadings of Mn, Cr, Cu, Ni, B, and Cd on PC2 (Figure 6b). Therefore, these results may be attributed to soil–water interaction, industrial practices, and anthropogenic practices [3,64,65] that lead to surface water network contamination by individual heavy metals, especially the high loadings of Fe, Cr, Mn, Ni, and Pb. A strong agreement between PCA and HEI was observed, which indicated that the majority of surface water locations in the study area had poor water due to heavy metal contamination. A comparison between PCA and PI results was consistent with these results. Therefore, the integration of heavy metal contributions in PCA and PIs revealed lithogenic sources, industrial activities, and agricultural management practices that have developed close to the Rosetta Branch in recent years. Therefore, integrating PCA and PI is a valuable and applicable approach for surface water quality assessment with respect to heavy metals and shows special promise and unique insights for surface water quality assessment.

4.3.2. Partial Least Square Regression Models and Stepwise Multiple Linear Regressions to Predict the Drinking Water Quality Index and Pollution Indices

Accurate estimates of the DWQI, HPI, HEI, and CD of water sites can be performed by mathematical methods [17,26,35,36]. However, these methods are complicated because they need several mathematical equations to transform large amounts of water characterization data into a single value that describes water quality levels and reflects the overall water quality level. For that, the PLSR model was tested in this study to predict the DWQI based on the multiple response variables of major ions and heavy metals and PIs based on multiple response variables of heavy metals. PLSR is used in different fields. A common application is to model relationships between spectral measurements (e.g., Near-infrared (NIR), Infrared (IR), Ultraviolet (UV)), which involves several variables that are often correlated with each other [64,66]. The models presented robust and accurate estimations for the different indices by showing the highest R2 values, and greatest slope values were close to 1.00, in addition to the lowest RMSE values for the calibration and validation datasets. For example, the PLSR model for HEI showed that the R2 values were as high as 1.00 and 0.99, the slope values were as high as 1.00 and 0.99, and the RMSE values were as high as 0.09 and 0.11 for the calibration and validation datasets, respectively.
In addition, stepwise multiple linear regressions were evaluated to estimate the DWQI and PIs. The SMLR models produced good estimations for all indices by using some or all of the major ions and heavy metals with R2 value = 1 and a very small standard error with the DWQI. These results agree with those of Mustapha and Aris 2012 [38], who found that the multiple linear regression model for water quality in Jakara–Getsi (Nigeria) could predict high heavy metal concentrations with R2 values of 0.97 and a significance effect of 0.001. The SMLR models showed that the standard error when estimating the DWQI and PIs decreased with an increased number of input variables for the major elements and heavy metals.

5. Conclusions

This study presented integrated approaches for characterizing the suitability of surface water quality for drinking use with respect to physicochemical characteristics in the northern Nile Delta, Egypt, which was supported by multivariate statistical analyses, such as PCA, PLSR and SMLR. According to the obtained analytical results, surface water in the investigated area belongs to Ca-Mg-alkalinity and Ca-Mg-Cl-SO4 water types. The surface water network in the study area was strongly affected by Pb and Mn and slightly affected by Fe and Cr. The deterioration of surface water quality can be attributed to large applications of agrochemical pesticides, industrial activities, and poor drainage networks. Therefore, the application of efficient treatment techniques for irrigation wastewater before disposing into the fresh surface water network will lead to better remediation of surface water quality deterioration in the study area. The utilization of physicochemical parameters and water quality indices, including DWQI, HPI, HEI, CD, and PI, with the support of multivariate statistical analysis, is an effective and applicable approach to provide a clear picture of surface water quality and controlling mechanisms. The PLSR models are easy, fast, and reliable methods to calculate the measured indices. The PLSR models presented robust and accurate estimations for the different indices by showing the highest R2 values and greatest slope values close to 1.00 in addition to the lowest RMSE values for the calibration and validation datasets. The SMLR models produced the best models to estimate DWQI and PIs by using all major ions and heavy metals as input data with R2 values =1. Future studies should test the PLSR and SMLR models under different environmental conditions for surface water.

Supplementary Materials

The following are available online at https://www.mdpi.com/2073-4441/12/8/2142/s1, Table S1: Analytical results of the measured physicochemical parameters in the collected surface water samples.

Author Contributions

Conceptualization, M.G. and S.E.; Methodology, F.S.M. and H.H.; Software, M.G., S.E., F.S.M., H.H., and K.M.K.; Formal Analysis, F.S.M., H.H., M.G., and S.E.; Resources, K.M.K.; Data Curation, M.H.A. and A.S.A.; Writing–Original Draft Preparation, M.G., S.E., F.S.M., and H.H.; Writing–Review and Editing, E.M.E.; Supervision, E.M.E.; Project Administration, E.M.E.; Funding Acquisition, K.M.K. All authors have read and agreed to the published version of the manuscript.

Funding

This work was supported by the Deanship of Scientific Research at King Khalid University under Grant number R.G.P. 2/54/40.

Conflicts of Interest

All of the authors confirm that there are no conflicts of interest.

References

  1. Gad, M.; El-Hattab, M. Integration of water pollution indices and DRASTIC model for assessment of groundwater quality in El Fayoum Depression, Western Desert, Egypt. J. Afr. Earth Sci. 2019, 158, 103554. [Google Scholar] [CrossRef]
  2. Goher, M.E.; Farhat, H.I.; Abdo, M.H.; Salem, S.G. Metal pollution assessment in the surface sediment of Lake Nasser, Egypt. Egypt. J. Aquat. Res. 2014, 40, 213–224. [Google Scholar] [CrossRef] [Green Version]
  3. Kumar, V.; Sharma, A.; Kumar, R.; Bhardwaj, R.; Thukral, A.K.; Rodrigo-Comino, J. Assessment of heavy-metal pollution in three different Indian water bodies by combination of multivariate analysis and water pollution indices. Hum. Ecol. Risk Assess. 2018, 26, 1–16. [Google Scholar] [CrossRef]
  4. Taheri, M.; Mehrzad, J.; MahmudyGharaie, M.H.; Afshari, R.; Dadsetan, A.; Hami, S. High soil and groundwater arsenic levels induce high body arsenic loads, health risk and potential anemia for inhabitants of northeastern Iran. Environ. Geochem. Health 2016, 38, 469–482. [Google Scholar] [CrossRef]
  5. Smith, V.H. Effects of eutrophication on maximum algal biomass in lake and river ecosystems. Inland Waters 2016, 6, 147–154. [Google Scholar] [CrossRef] [Green Version]
  6. Wu, Z.; Wang, X.; Chen, Y.; Cai, Y.; Deng, J. Assessing river water quality using water quality index in Lake Taihu Basin, China. Sci. Total Environ. 2018, 612, 914–922. [Google Scholar] [CrossRef]
  7. Zhao, Y.; Xia, X.H.; Yang, Z.F.; Wang, F. Assessment of water quality in Baiyangdian Lake using multivariate statistical techniques. Procedia Environ. Sci. 2012, 13, 1213–1226. [Google Scholar] [CrossRef] [Green Version]
  8. Masoud, A.H.; El-Fakharany, I.I.; Abd El-Razik, M.A.S. Monitoring of some agrochemical pollutants in surface water in Kafr El-Sheikh Governorate. J. Pest. Cont. Environ. Sci. 2007, 15, 21–41. [Google Scholar]
  9. El-Bouraie, M.M.; El-Barbary, A.A.; Yehia, M.M.; Motawea, E.A. Heavy metal concentrations in surface river water and bed sediments at Nile Delta in Egypt. Suoseura 2010, 61, 1–12. [Google Scholar]
  10. El-Bana, T.A. Agro-Ecological Assessment of Land and Water Resources Norther Nile Delta: A Case Study in Kafr El-Sheikh Governorate. Master’s Thesis, Alexandria University, Alexandria, Egypt, 2003. [Google Scholar]
  11. El-Bana, T.A.; Gaber, H.M.; Bahnassy, M.H.; Suliman, A.S. Quality assessment of water resources in Northern Nile Delta: A case study in Kafr El-Sheikh Governorate. Egypt. J. Soil Sci. 2006, 46, 409–423. [Google Scholar]
  12. Bora, M.; Goswami, D.C. Water quality assessment in terms of water quality index (DWQI): Case study of the Kolong River, Assam, India. Appl. Water Sci. 2017, 7, 3125–3135. [Google Scholar] [CrossRef] [Green Version]
  13. Jalali, M. Salinization of groundwater in arid and semiarid zones: An example from Tajarak, Western Iran. Environ. Geol. 2007, 52, 1133–1149. [Google Scholar] [CrossRef]
  14. Mondal, N.C.; Singh, V.P. Hydrochemical analysis of salinization for a tannery belt in Southern India. J. Hydrol. 2011, 405, 235–247. [Google Scholar] [CrossRef]
  15. Mondal, N.C.; Tiwari, K.K.; Sharma, K.C.; Ahmed, S. A diagnosis of groundwater quality from a semiarid region in Rajasthan, India. Arab. J. Geosci. 2016, 9, 1–22. [Google Scholar] [CrossRef]
  16. Edet, A.E.; Offiong, O.E. Evaluation of water quality pollution indices for heavy metal contamination monitoring. A study case from Akpabuyo-Odukpani area, Lower Cross River Basin (south Nigeria). GeoJ 2002, 4, 295–304. [Google Scholar] [CrossRef]
  17. Sheykhi, V.; Moore, F. Geochemical characterization of Kor River water quality, Fars Province, Southwest Iran. Water Qual. Expo Health 2012, 4, 25–38. [Google Scholar] [CrossRef]
  18. Sobhanardakani, S.; Yari, A.R.; Taghavi, L.; Tayebi, L. Water quality pollution indices to assess the heavy metal contamination, case study: Groundwater resources of Asadabad Plain in 2012. Arch. Hyg. Sci. 2016, 5, 221–228. [Google Scholar]
  19. AbouZakhem, B.; Hafez, R. Heavy metal pollution index for groundwater quality assessment in Damascus Oasis, Syria. Environ. Earth Sci. 2015, 73, 6591–6600. [Google Scholar] [CrossRef]
  20. Balakrishnan, A.; Ramu, A. Evaluation of heavy metal pollution index (HPI) of ground water in and around the coastal area of Gulf of Mannar biosphere and Palk strait. J. Adv. Chem. Sci. 2016, 2, 331–333. [Google Scholar]
  21. El Fehri, I.C.; El Abidi, A.; Fekhaoui, M.; Bellaouchou, A.; Benakan, R.; El Jaoudi, R. Level of contamination by trace metals in groundwater in the agricultural area of Sidi abdelrrazak (Province of Khémisset, Morocco). J. Mater. Environ. Sci. 2014, 5, 705–710. [Google Scholar]
  22. Sobhanardakani, S.; Taghavi, L.; Shahmoradi, B.; Jahangard, A. Groundwater quality assessment using the water quality pollution indices in Toyserkan Plain. Environ. Health Eng. Manag. 2017, 4, 21–27. [Google Scholar] [CrossRef] [Green Version]
  23. Prasad, B.; Kumari, S. Heavy metal pollution index of ground water of an abandoned open cast mine filled with fly ash: A case study. Mine Water Environ. 2008, 27, 265–267. [Google Scholar] [CrossRef]
  24. Reza, R.; Singh, G. Assessment of heavy metal contamination and its indexing approach for river water. Int. J. Environ. Sci. Tech. 2010, 7, 785–792. [Google Scholar] [CrossRef] [Green Version]
  25. Reza, R.; Singh, G.; Manish, J. Application of heavy metal pollution index for ground water quality assessment in Angul District of Orissa, India. Int. J. Res. Chem. Environ. 2011, 1, 118–122. [Google Scholar]
  26. Caerio, S.; Costa, M.H.; Ramos, T.B.; Fernandes, F.; Silveira, N.; Coimbra, A.; Painho, M. Assessing heavy metal contamination in Sado Estuary sediment: An index analysis approach. Ecol. Indic. 2005, 5, 155–169. [Google Scholar] [CrossRef]
  27. Mustafa, O.M. Evaluating water quality of Waraz mountainous area, using contamination index, Sulaimaniya Governorate, Northeast Iraq. Iraqi Bull. Geol. Min. 2008, 4, 59–66. [Google Scholar]
  28. Kamtchueng, B.T.; Fantong, W.Y.; Wirmvem, M.J. Hydrogeochemistry and quality of surface water and groundwater in the vicinity of Lake Monoun, West Cameroon: Approach from multivariate statistical analysis and stable isotopic characterization. Environ. Monit. Assess. 2016, 188, 524. [Google Scholar] [CrossRef]
  29. Kumar, V.; Sharma, A.; Chawla, A.; Bhardwaj, R.; Thukral, A.K. Water quality assessment of River Beas, India, using multivariate and remote sensing techniques. Environ. Monit. Assess. 2016, 188, 137. [Google Scholar] [CrossRef]
  30. Matiatos, I.; Alexopoulos, A.; Godelitsas, A. Multivariate statistical analysis of the hydrogeochemical and isotopic composition of the groundwater resources in northeastern Peloponnesus (Greece). Sci. Total Environ. 2014, 476, 577–590. [Google Scholar] [CrossRef]
  31. Rakotondrabe, F.; Ngoupayou, J.R.; Mfonka, Z. Water quality assessment in the Betare-Oya gold mining area (East-Cameroon): Multivariate statistical analysis approach. Sci. Total Environ. 2018, 610, 831–844. [Google Scholar] [CrossRef]
  32. Li, P.; Tian, R.; Liu, R. Solute geochemistry and multivariate analysis of water quality in the Guohua Phosphorite Mine, Guizhou Province, China. Expo Health 2019, 11, 81–94. [Google Scholar] [CrossRef]
  33. Ahmed, U.; Mumtaz, R.; Anwar, H.; Shah, A.A.; Irfan, R.; García-Nieto, J. Efficient water quality prediction using supervised machine learning. Water 2019, 11, 2210. [Google Scholar] [CrossRef] [Green Version]
  34. Banda, T.D.; Kumarasamy, M. Application of multivariate statistical analysis in the development of a surrogate water quality index. Water 2020, 12, 1584. [Google Scholar] [CrossRef]
  35. Chowdhury, R.M.; Muntasir, S.Y.; Hossain, M.M. Water quality index of water bodies along Faridpur-Barisal road in Bangladesh. Glob. Eng. Technol. Rev. 2012, 2, 1–8. [Google Scholar]
  36. Tamasi, G.; Cini, R. Heavy metals in drinking waters from Mount Amiata (Tuscany, Italy) possible risks from arsenic for public health in the province of Siena. Sci. Total Environ. 2004, 327, 41–51. [Google Scholar] [CrossRef]
  37. Ahmad, S.; Ghani, M.M.I. Stepwise multiple regression method to forecast fish landing. Procedia Soc. Behav. Sci. 2010, 8, 549–554. [Google Scholar]
  38. Mustapha, A.; Aris, Z.A. Multivariate statistical analysis and environmental modeling of heavy metals pollution by industries. Pol. J. Environ. Stud. 2012, 21, 1359–1367. [Google Scholar]
  39. Chen, J.; Lu, J. Effects of land use, topography and socio-economic factors on river water quality in a mountainous watershed with intensive agricultural production in East China. PLoS ONE 2014, 9, e102714. [Google Scholar] [CrossRef] [PubMed]
  40. Garriga, M.; Romero-Bravo, S.; Estrada, F.; Escobar, A.; Matus, I.A.; del Pozo, A.; Astudillo, C.A.; Lobos, G.A. Assessing wheat traits by spectral reflectance: Do we really need to focus on predicted trait-values or directly identify the elite genotypes group? Front. Plant Sci. 2017, 8, 280. [Google Scholar] [CrossRef] [PubMed] [Green Version]
  41. Cho, H.J.; Lee, H.J. Multiple linear regression models for predicting nonpoint-source pollutant discharge from a highland agricultural region. Water 2018, 10, 1156. [Google Scholar] [CrossRef] [Green Version]
  42. Wei, L.; Huang, C.; Zhong, Y.; Wang, Z.; Hu, X.; Lin, L. Inland waters suspended solids concentration retrieval based on PSO-LSSVM for UAV-borne hyperspectral remote sensing imagery. Remote Sens. 2019, 11, 1455. [Google Scholar] [CrossRef] [Green Version]
  43. Xu, G.; Ren, X.; Yang, Z.; Long, H.; Xiao, J. Influence of landscape structures on water quality at multiple temporal and spatial scales: A case study of Wujiang River Watershed in Guizhou. Water 2019, 11, 159. [Google Scholar] [CrossRef] [Green Version]
  44. CAPMAS. Egypt in Figures; Central Agency for Public Mobilization and Statistics (CAPMAS): Cairo, Egypt, 2012. [Google Scholar]
  45. APHA. Standard Methods for the Examination of Water and Wastewater; American Public Health Association: Washington, DC, USA, 2012. [Google Scholar]
  46. WHO. Guidelines for Drinking-Water Quality, 4th ed.; World Health Organization: Geneva, Switzerland, 2011. [Google Scholar]
  47. Nasrabadi, T. An index approach to metallic pollution in river waters. Int. J. Environ. Res. 2015, 9, 385–394. [Google Scholar]
  48. Piper, A.M. A graphic procedure in the geochemical interpretation of water-analyses. Trans. Am. Geophys. Union 1944, 25, 914–928. [Google Scholar] [CrossRef]
  49. Gibbs, R.J. Mechanisms controlling world water chemistry. Science 1970, 170, 10881. [Google Scholar] [CrossRef]
  50. Madrid, C.H.; Vázquez, L.A.; Soriano, P.L.; Mejía, J.M.; Fatjó, V.G.; Rodríguez, S.D.M.; Oliva, E.A.M.; Jiménez, C.J. Identification of key factors affecting the trophic state of four tropical small water bodies. Water 2020, 12, 1454. [Google Scholar] [CrossRef]
  51. Twisa, S.; Kazumba, S.; Kurian, M.; Buchroithner, F.M. Evaluating and predicting the effects of land use changes on hydrology in Wami River Basin, Tanzania. Hydrology 2020, 7, 17. [Google Scholar] [CrossRef] [Green Version]
  52. Vasques, G.M.; Grunwald, S.; Sickman, J.O. Comparison of multivariate methods for inferential modeling of soil carbon using visible/near-infrared spectra. Geoderma 2008, 146, 14–25. [Google Scholar] [CrossRef]
  53. Aktar, M.W.; Paramasivam, M.; Ganguly, M.; Purkait, S.; Sengupta, D. Assessment and occurrence of various heavy metals in surface water of Ganga River around Kolkata: A study for toxicity and ecological impact. Environ. Monit. Assess. 2010, 160, 207–213. [Google Scholar] [CrossRef]
  54. Begum, A.; Ramaiah, M.; Khan, H.I.; Veena, K. Heavy metal pollution and chemical profile of Cauvery River Water. J. Chem. 2009, 6, 47–52. [Google Scholar] [CrossRef]
  55. Saxena, V.K.; Singh, V.S.; Mondal, N.C.; Jain, S.C. Use of chemical parameters to delineation fresh ground water resources in Potharlanka Island, India. Environ. Geol. 2003, 44, 516–521. [Google Scholar] [CrossRef]
  56. Sarwade, D.V.; Nandakumar, M.V.; Kesari, M.P.; Mondal, N.C.; Singh, V.S.; Singh, B. Evaluation of sea water ingress into an Indian Attoll. Environ. Geol. 2007, 52, 1475–1483. [Google Scholar] [CrossRef]
  57. Zhang, W.; Ma, L.; Abuduwaili, J.; Ge, Y.; Issanova, G.; Saparov, G. Hydrochemical characteristics and irrigation suitability of surface water in the Syr Darya River, Kazakhstan. Environ. Monit. Assess. 2019, 191, 572. [Google Scholar] [CrossRef] [Green Version]
  58. Bhat, A.N.; Bhat, A.A.; Nath, S.; Singh, P.B.; Guha, B.D. Assessment of drinking and irrigation water quality of surface water resources of South-West Kashmir, India. J. Civ. Environ. Eng. 2016, 6, 222. [Google Scholar]
  59. Kachroud, M.; Trolard, F.; Kefi, M.; Jebari, S.; Bourrié, G. Water quality indices: Challenges and application limits in the literature. Water 2019, 11, 361. [Google Scholar] [CrossRef] [Green Version]
  60. Wu, Y.F.; Liu, C.Q.; Tu, C.L. Atmospheric deposition of metals in TSP of Guiyang, PR China. Bull. Environ. Contam. Toxicol. 2008, 80, 465–468. [Google Scholar] [CrossRef]
  61. Abdel-Satar, A.M. Environmental studies on the impact of the drains effluent upon the southern sector of Lake Manzalah. Egypt. J. Aquat. Biol. Fish. 2001, 5, 17–30. [Google Scholar] [CrossRef] [Green Version]
  62. Pulles, T.; van der Gon, H.D.; Appelman, W.; Verheul, M. Emission factors for heavy metals from diesel and petrol used in European vehicles. Atmos. Environ. 2012, 61, 641–651. [Google Scholar] [CrossRef]
  63. Saleem, M.; Iqbal, J.; Shah, M.H. Geochemical speciation, anthropogenic contamination, risk assessment and source identification of selected metals in freshwater sediments—A case study from Mangla Lake, Pakistan. Environ. Nanotechnol. Monit. Manag. 2015, 4, 27–36. [Google Scholar] [CrossRef] [Green Version]
  64. Wang, J.; Liu, G.; Liu, H.; Lam, P.K. Multivariate statistical evaluation of dissolved trace elements and a water quality assessment in the middle reaches of Huaihe River, Anhui, China. Sci. Total Environ. 2017, 583, 421–431. [Google Scholar] [CrossRef]
  65. Xiao, M.; Bao, F.; Wang, S.; Cui, F. Water quality assessment of the Huaihe River segment of Bengbu (China) using multivariate statistical techniques. Water Res. 2016, 43, 166–176. [Google Scholar]
  66. Elsayed, S.; Elhewity, M.; Ibrahim, H.H.; Dewir, Y.H.; Migdadi, H.M.; Schmidhalter, U. Thermal imaging and passive reflectance sensing to estimate the water status and grain yield of wheat under different irrigation regimes. Agric. Water Manag. 2017, 189, 98–110. [Google Scholar] [CrossRef]
Figure 1. Location map of surface water network flow and collected surface water points.
Water 12 02142 g001
Figure 2. Geochemical facies and water types according to the Piper diagram.
Water 12 02142 g002
Figure 3. Geochemical controlling mechanisms, according to the Gibbs diagram.
Water 12 02142 g003
Figure 4. Water quality indices distribution maps of surface water network: (a) Drinking water quality index, (b) Heavy metal pollution index, (c) Heavy metal evaluation index, and (d) Contamination index.
Water 12 02142 g004
Figure 5. The relationships between the drinking water quality index (DWQI) and HPI, HEI, and CD, with respect to heavy metals. ***: p < 0.001.
Water 12 02142 g005
Figure 6. Principal component analysis (PCA) for physicochemical parameters in surface water network: (a) PCA for major ions and (b) PCA for heavy metals.
Water 12 02142 g006
Figure 7. Observed and predicted relationships for the calibration and validation datasets of the DWQI and HPI, HEI, and CD with respect to heavy metals using the partial least squares regression model. ***: p < 0.001.
Water 12 02142 g007
Table 1. Statistical descriptions of the measured physicochemical parameters. All parameters are expressed in mg/L.
ParameterTemperaturepHECTDSTHK+Na+Mg2+Ca2+ClSO42−
Minimum27.07.2406.3260.02.804.515.08.222.64.026.2
Maximum33.78.7790.6506.023611.255.025.064.655.0104.1
Mean28.38.0562.0359.7183.257.432.517.039.628.852.1
SD1.90.3138.988.936.232.011.64.311.012.218.1
ParameterAlkalinityNO3BCdCrCuFFeMnNiPbZn
Minimum118.00.8000.020.00020.0050.0010.1000.0500.0100.0010.0010.001
Maximum278.34.4200.490.03300.3400.0300.7001.2000.4500.05031.000.220
Mean184.31.5060.120.00600.0610.0090.2650.2250.1050.0170.6050.025
SD44.60.5820.110.00900.0600.0050.1680.2060.0870.0174.1750.060
SD: standard deviation; Alkalinity was referred to the HCO3 since CO32− was below the detection limit.
Table 2. Estimates of the drinking water quality index (DWQI) according to the relative weights for the surface water parameters determined in the present study.
ParameterWeight (wi)WHO 2011 [46]Relative Weight (Wi)
pH47.500.0548
EC410000.0548
TDS55000.0685
TH23000.0274
K+210.00.0274
Na+32000.0411
Ca2+275.00.0274
Mg2+230.00.0274
Cl12500.0137
SO42−32500.0411
Alkalinity31200.0411
NO3550.00.0685
B30.500.0411
Cd30.0030.0411
Cr40.050.0548
Cu22.000.0274
F41.500.0548
Fe40.300.0548
Mn40.050.0548
Ni30.070.0411
Pb50.010.0685
Zn23.000.0274
wi = 73 Wi = 1
Table 3. Arithmetic rating method for calculation of heavy metal pollution index (HPI), heavy metal evaluation index (HEI), contamination index (CD), and pollution index (PI). W is weight (1/MAC), S is standard permissible level in ppm, I is highest permissible level in ppm, and MAC is maximum admissible concentration.
Heavy MetalWHO 2011 [46]
Si (mg/L)
MACiUnit Weight WiSub index QiWi × Qi
B0.505000.004044.000.016179516
Cd0.0033.000.674156.664.494309883
Cr0.0550.00.0404510.000.404487889
Cu2.0020000.001010.500.00050561
F1.5015000.0013520.000.026965859
Fe0.303000.00674100.00.674146482
Mn0.0550.00.0404520.000.808975779
Ni0.0770.00.028892.850.082548549
Pb0.0110.00.20224100.020.22439447
Zn3.0030000.000670.1660.000112358
∑ (Wi) = 1 ∑ (Wi × Qi)
Table 4. Levels of pollution, according to PI [26].
ClassPI ValueEffect
1<1No effect
21–2Slightly affected
32–3Moderately affected
43–5Strongly affected
5>5Seriously affected
Table 5. Assessment of surface water according to water quality indices.
Water Quality Indices (WQIs)Sample RangeRangeWater ClassSamples (%)
MinimumMaximumMeanSD
Drinking water quality index
(DWQI)
36.72136.7366.9921.250–25Excellent waterNil
26–50Good water33% (18 samples)
51–75Poor water58% (32 samples)
76–100Very poor water5% (3 samples)
>100Unsuitable4% (2 samples)
Heavy metal pollution index
(HPI)
26.28222.5168.2442.42<100Low polluted87% (48 samples)
>100High polluted13% (7 samples)
Heavy metal evaluation index
(HEI)
1.9817.236.593.33<0.3Very pureNil
0.3–1.0PureNil
1.0–2.0Slightly affectedNil
2.0–3.0Moderately affected4% (2 samples)
3.0–6.0Strongly affected49% (27 samples)
>6.0Seriously affected47% (26 samples)
Contamination index
(CD)
−8.027.23−3.413.33>1Low91% (50 samples)
1–3Medium2% (1 sample)
<3High7% (4 samples)
SD: standard deviation.
Table 6. Assessment of surface water quality according to the effects of heavy metals.
Heavy MetalPIClassEffect
B0.20INo effect
Cd0.15INo effect
Cr1.00IISlightly affected
Cu0.01INo effect
F0.24INo effect
Fe1.17IISlightly affected
Mn4.50IVStrongly affected
Ni0.36INo effect
Pb4.50IVStrongly affected
Zn0.00INo effect
Table 7. Extraction of the most influential major elements and heavy metals using stepwise multiple linear regression for the drinking water quality index and pollution indices.
Model No.Influential Heavy Metals for DWQIR2SE
1Pb0.7747.62614
2Pb, TDS0.9214.54227
3Pb, TDS, Fe0.9613.22618
4Pb, TDS, Fe, Cr0.9852.02108
5Pb, TDS, Fe, Cr, Ni0.9941.24464
6Pb, TDS, Fe, Cr, Ni, Mn0.9980.68741
7Pb, TDS, Fe, Cr, Ni, Mn, Cd0.9990.63303
8Pb, TDS, Fe, Cr, Ni, Mn, Cd, K0.9990.59664
9Pb, TDS, Fe, Cr, Ni, Mn, Cd, K, Mg0.9990.56404
10Pb, TDS, Fe, Cr, Ni, Mn, Cd, K, Mg, Alkalinity0.9990.51314
11Pb, TDS, Fe, Cr, Ni, Mn, Cd, K, Mg, Alkalinity, F0.9990.41374
12Pb, TDS, Fe, Cr, Ni, Mn, Cd, K, Mg, Alkalinity, F, TH1.0000.2414
13Pb, TDS, Fe, Cr, Ni, Mn, Cd, K, Mg, Alkalinity, F, TH, SO41.0000.17705
14Pb, TDS, Fe, Cr, Ni, Mn, Cd, K, Mg, Alkalinity, F, TH, SO4, PH1.0000.08731
15Pb, TDS, Fe, Cr, Ni, Mn, Cd, K, Mg, Alkalinity, F, TH, SO4, PH, B1.0000.06297
16Pb, TDS, Fe, Cr, Ni, Mn, Cd, K, Mg, Alkalinity, F, TH, SO4, PH, B, NO31.0000.05622
17Pb, TDS, Fe, Cr, Ni, Mn, Cd, K, Mg, Alkalinity, F, TH, SO4, PH, B, NO3, Ca1.0000.04346
18Pb, TDS, Fe, Cr, Ni, Mn, Cd, K, Mg, Alkalinity, F, TH, SO4, PH, B, NO3, Ca, Na1.0000.01118
19Pb, TDS, Fe, Cr, Ni, Mn, Cd, K, Mg, Alkalinity, F, TH, SO4, PH, B, NO3, Ca, Na, Cl1.0000.00487
20Pb, TDS, Fe, Cr, Ni, Mn, Cd, K, Mg, Alkalinity, F, TH, SO4, PH, B, NO3, Ca, Na, Cl, Cu1.0000.00074
21Pb, TDS, Fe, Cr, Ni, Mn, Cd, K, Mg, Alkalinity, F, TH, SO4, PH, B, NO3, Ca, Na, Cl, Cu, Zn1.0000.00000
Model No.Influential Heavy Metals for HPIR2SE
1Pb0.985.88732
2Pb, Cd0.9981.90212
3Pb, Cd, Cr1.0000.72319
4Pb, Cd, Cr, Ni1.0000.38778
5Pb, Cd, Cr, Ni, Fe1.0000.10818
6Pb, Cd, Cr, Ni, Fe, Mn1.0000.01196
7Pb, Cd, Cr, Ni, Fe, Mn, F1.0000.00125
8Pb, Cd, Cr, Ni, Fe, Mn, F, B1.0000.00024
9Pb, Cd, Cr, Ni, Fe, Mn, F, B, Cu1.0000.00001
10Pb, Cd, Cr, Ni, Fe, Mn, F, B, Cu, Zn1.0000.00000
Model No.Influential Heavy Metals for HEIR2SE
1Pb0.8610.88209
2Pb, Fe0.9290.63571
3Pb, Fe, Cr0.9680.43119
4Pb, Fe, Cr, Ni0.9890.25051
5Pb, Fe, Cr, Ni, Mn0.9980.11135
6Pb, Fe, Cr, Ni, Mn, F0.9990.08108
7Pb, Fe, Cr, Ni, Mn, F, Cd1.0000.01419
8Pb, Fe, Cr, Ni, Mn, F, Cd, B1.0000.00221
9Pb, Fe, Cr, Ni, Mn, F, Cd, B, Cu1.0000.00027
10Pb, Fe, Cr, Ni, Mn, F, Cd, B, Cu, Zn1.0000.00000
Model No.Influential Heavy Metals For CDR2SE
1Pb0.8610.88209
2Pb, Fe0.9290.63571
3Pb, Fe, Cr0.9680.43119
4Pb, Fe, Cr, Ni0.9890.25051
5Pb, Fe, Cr, Ni, Mn0.9980.11135
6Pb, Fe, Cr, Ni, Mn, F0.9990.08108
7Pb, Fe, Cr, Ni, Mn, F, Cd1.0000.01419
8Pb, Fe, Cr, Ni, Mn, F, Cd, B1.0000.00221
9Pb, Fe, Cr, Ni, Mn, F, Cd, B, Cu1.0000.00027
10Pb, Fe, Cr, Ni, Mn, F, Cd, B, Cu, Zn1.0000.00000
SE: standard error; Alkalinity was referred to the HCO3 since CO32− was below the detection limit.

