Article

Ecosystem-Based Restoration to Mitigate Eutrophication: A Case Study in a Shallow Lake

1
College of Fisheries, Hubei Provincial Engineering Laboratory for Pond Aquaculture, Freshwater Aquaculture Collaborative Innovation Center of Hubei Province, Huazhong Agricultural University, Wuhan 430000, China
2
CCCc Shanghai Waterway Engineering Design and Consulting Co., Ltd., Shanghai 200120, China
3
Centre of Lake Engineering & Technology, State Key Laboratory of Environmental Criteria and Risk Assessment, Chinese Research Academy of Environmental Sciences, Beijing 100012, China
4
Donghu Experimental Station of Lake Ecosystems, State Key Laboratory of Freshwater Ecology and Biotechnology of China, Institute of Hydrobiology, Chinese Academy of Sciences, Wuhan 430072, China
*
Author to whom correspondence should be addressed.
Water 2020, 12(8), 2141; https://doi.org/10.3390/w12082141
Submission received: 16 June 2020 / Revised: 17 July 2020 / Accepted: 24 July 2020 / Published: 29 July 2020
(This article belongs to the Special Issue Lake Ecology and Restoration)

Abstract

:
Under the influence of human activities, eutrophication has become an increasingly serious global phenomenon, especially in shallow lakes. Many studies have shown that aquatic macrophytes play a significant role in controlling eutrophication, but only few of these studies are ecosystem based. In this paper, we applied a mass-balance ecosystem model to a shallow eutrophic lake (Lake Datong, China) as a case study with the aims of evaluating the status of ecosystem restoration via the recovery of aquatic vegetation and providing adaptive management suggestions. Results showed that the ecosystem was immature with weak energy flows and nutrient cycling largely due to the excessive submerged macrophytes and the lack of fish as consumer. In the early stages of restoration, the number of fish should be reduced, and aquatic vegetation needs to be recovered to mitigate eutrophication. When the aquatic vegetation community tends to be stable, herbivorous and omnivorous fish should be moderately stocked, and dead aquatic macrophytes should be harvested to maintain the healthy and sustainable development of the ecosystem. This study provided insights for the ecological restoration of shallow eutrophic lakes and revealed the urgent need for ecosystem-based restoration.

1. Introduction

Eutrophication is a global environmental problem wherein the excessive amount of nutrients in water leads to the growth of primary producers [1,2,3]. Eutrophication of aquatic ecosystem is mainly caused by excessive nutrient input and global warming [4,5]. Most of the freshwater lakes and wetlands are facing the problem of water quality deterioration and ecological imbalance due to the increasing anthropogenic activities particularly in developing countries [6]. Eutrophication not only affects water quality and aquatic organisms, but also may change the trophic relationship and structure of the food web. Eutrophic lakes have simpler food web structure, lower biodiversity, and shorter food chains than non-eutrophic ones [7].
Extensive research on eutrophication has been conducted during the past five or six decades and major advances in controlling eutrophication of lakes has been made [8]. The restoration methods of eutrophic lakes can be classified into the following categories: managing nutrient inputs, removing algal, biomanipulation and bioremediation [9,10,11]. Managing nutrient inputs is a traditional and effective method to control eutrophication. With the deepening of the research on eutrophication of lake ecosystems, it is gradually realized that eutrophication is a typical ecological problem and research on bioremediation of shallow lakes via the recovery of aquatic vegetation is getting more attention [12,13].
It is generally accepted that excessive nutrient input mainly nitrogen and phosphorus, are the key factors accelerating the process of eutrophication in aquatic ecosystems [14]. Aquatic macrophytes can assimilate nitrogen and phosphorus in water and sediments, absorb suspended matter in water, reduce the nutrient level of water, improve water transparency, release oxygen through photosynthesis, increase the concentration of dissolved oxygen in water, and improve the water environment [15,16,17,18,19]. The eutrophication of water bodies and decline in aquatic vegetation can lead to the collapse of aquatic ecosystems and deteriorate water quality, and many studies have shown that the recovery of aquatic vegetation (especially submerged vegetation) can greatly improve the ecological environment of damaged shallow lakes [20]. Studies have also shown that when exogenous pollution is effectively controlled, the artificial recovery of aquatic vegetation may accelerate the ecological restoration of shallow eutrophic lakes [21]. In other words, the recovery of aquatic vegetation is an effective ecological restoration approach for mitigating eutrophication of shallow lakes [21,22].
The recovery of aquatic vegetation has become a prospective field in global aquatic ecosystem research and is increasingly becoming a research hotspot in conservation work [23,24]. Experimental studies on aquatic vegetation began in China in the early 1990s. However, the traditional assessment methods only monitor the physicochemical factors of water environments and examine certain species. Moreover, species-based work is not a very useful way for examining ecosystem processes that involve many species [25], thereby making ecosystem-based restoration particularly important. Ensuring the continuance of ecosystem sustainability and diversity requires the knowledge of food webs and the abundance and structure of resources, whereas the fulfilment of societal requirements and desires requires ecosystem models that offer predictions given specific environmental changes or conditions [26].
In China, water eutrophication had been reported in 67 lakes which is about 51.2% of the total number of lakes [6]. However, only few eutrophic lakes were assessed by using ecosystem models. Using models to guide ecosystem-based restoration is imperative to mitigate eutrophication in China, where numerous lakes are suffering from eutrophication. Therefore, we applied an ecosystem model to a shallow eutrophic lake undergoing ecological restoration via aquatic vegetation recovery, to evaluate this ecosystem and predict the restoration outcomes by performing scenario and management simulations. The objectives of this study are (1) to evaluate the status of the lake ecosystem in the process of ecological restoration; (2) to predict the effects of different combinations of aquatic macrophyte and fish biomasses from the ecosystem perspective; and (3) to provide adaptive management suggestions for follow-up restoration and predict the outcomes (Figure 1). Our study also provided scientific and theoretical support for the ecosystem-based restoration of shallow eutrophic lakes.

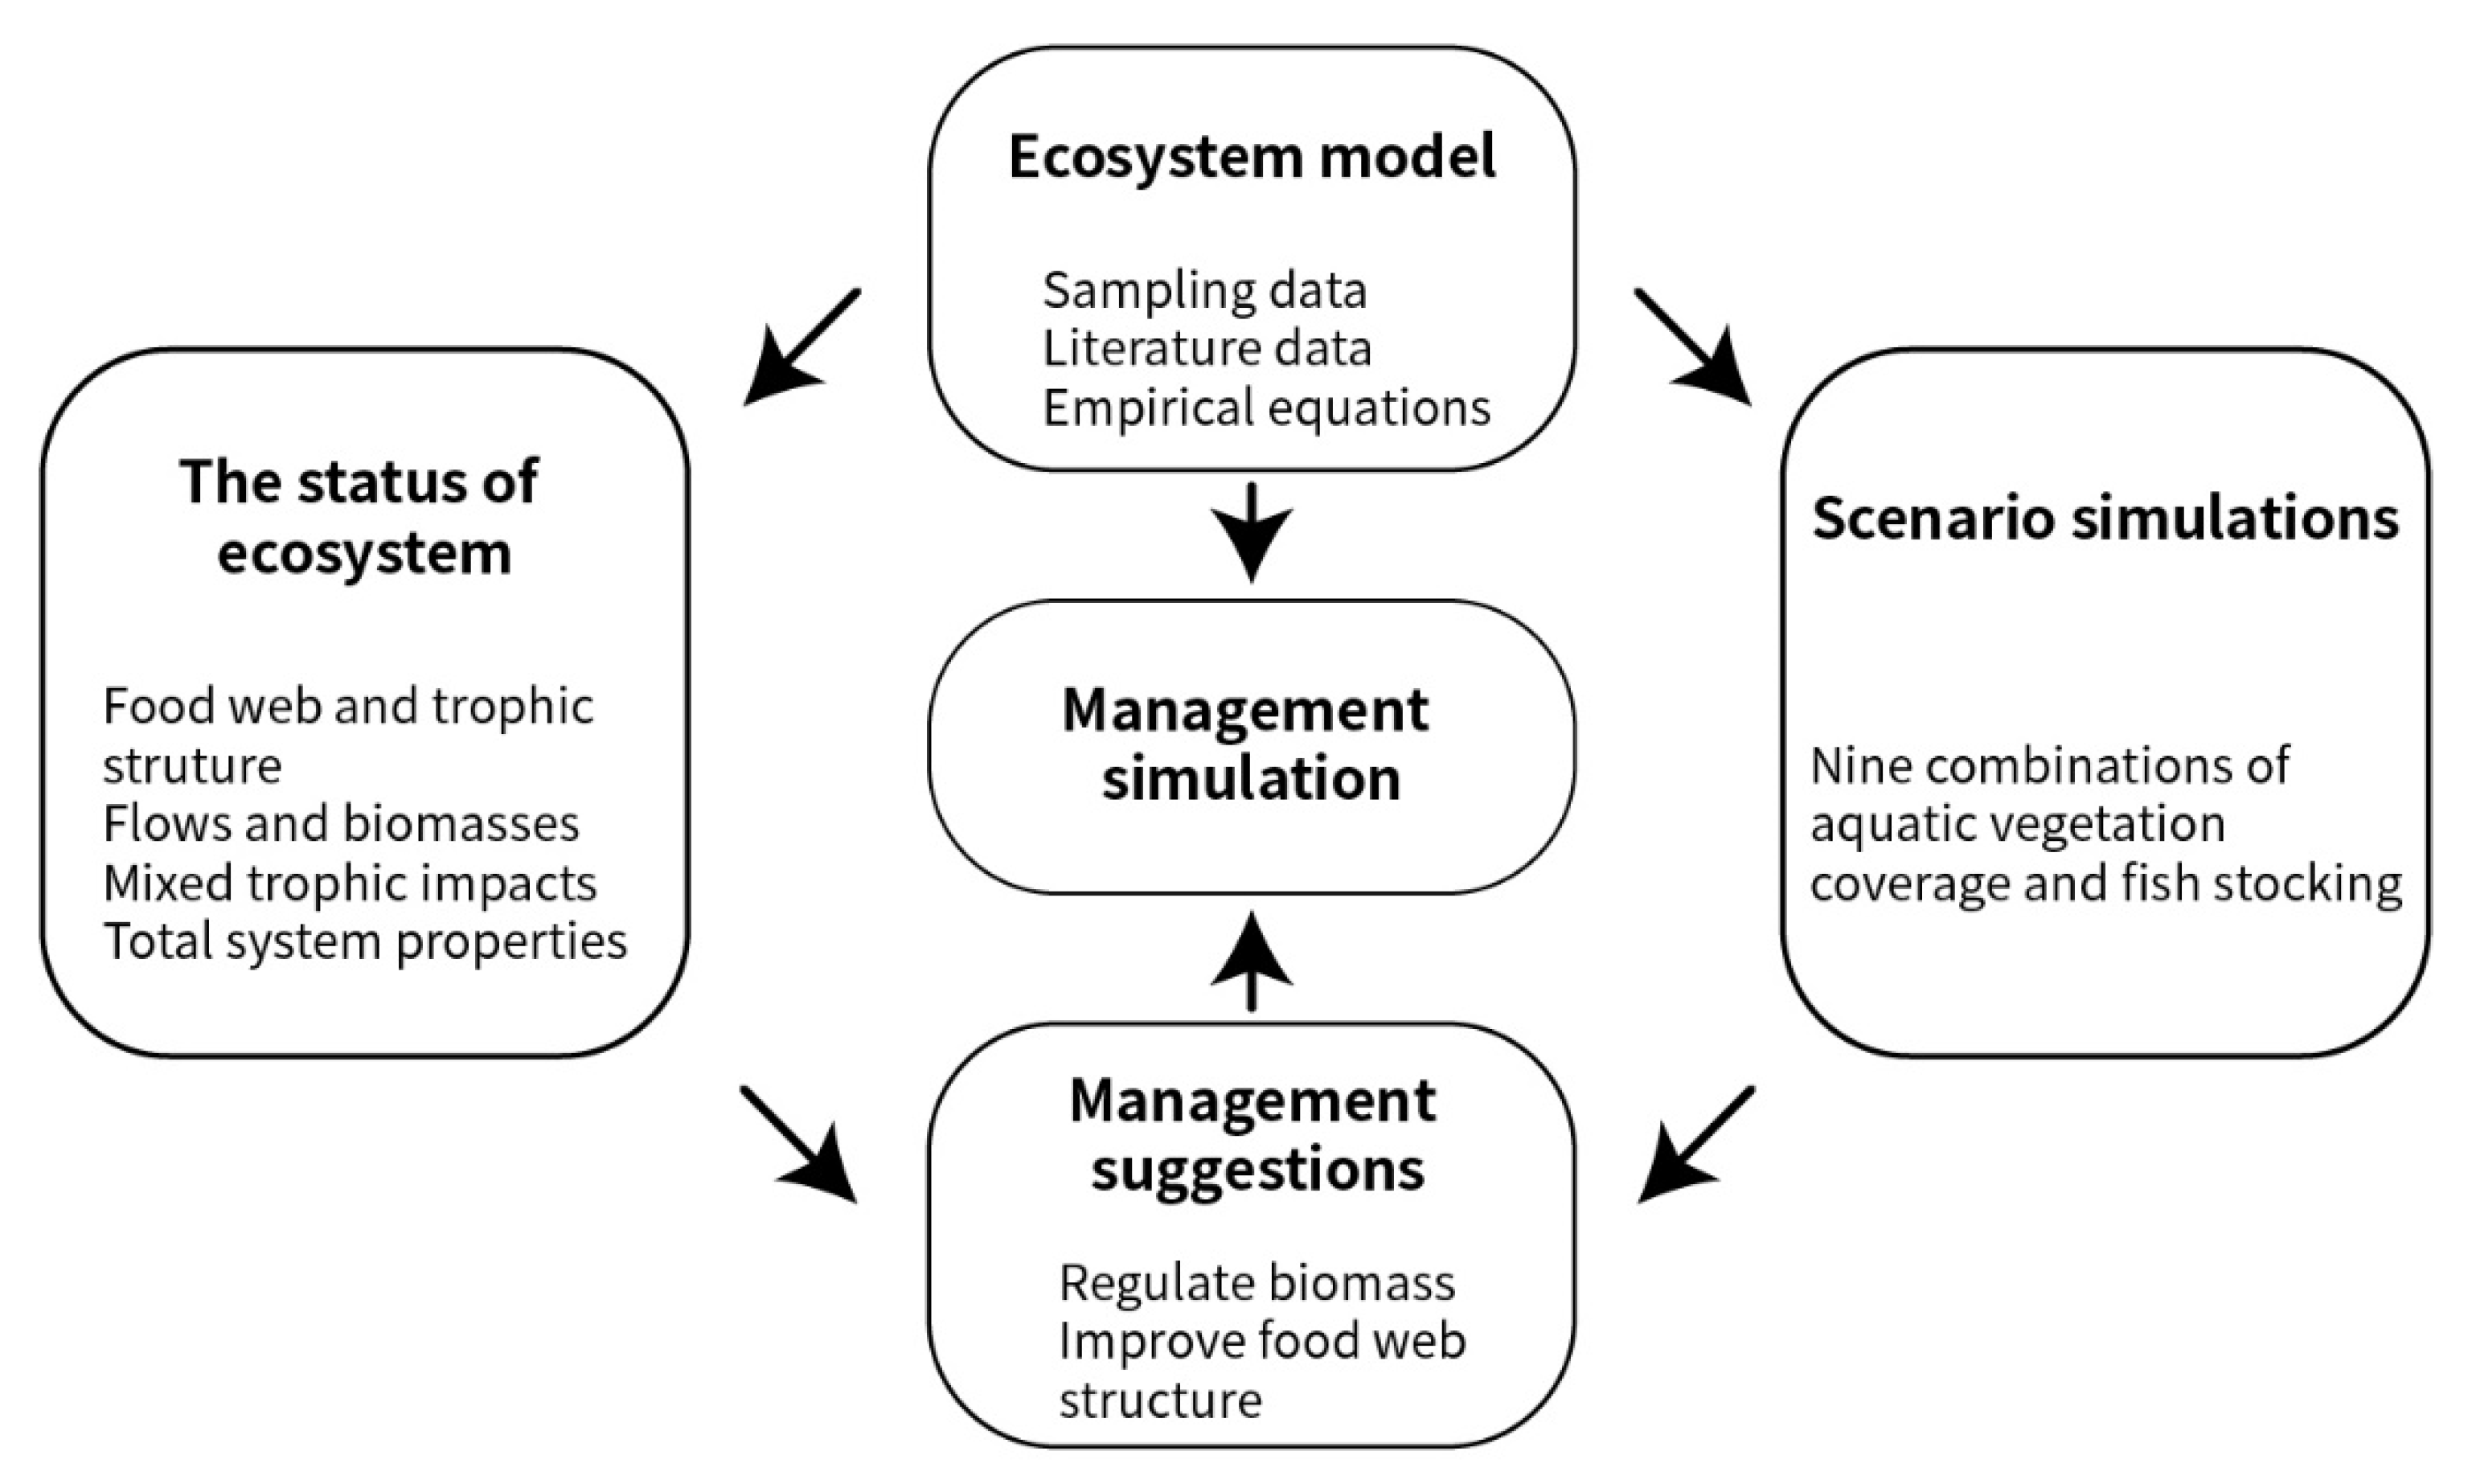
2. Materials and Methods

2.1. Study Area

Lake Datong, which is located 112°1′–112°42′ E and 29°4′–29°22′ N in Hunan Province, China, was selected as the shallow eutrophic lake for this study. This lake is 15.75 km long from east to west and 13.7 km wide from south to north [27] and has an area and average depth of 82.67 km2 and 2.5 m, respectively. The water quality of this lake began to deteriorate as a result of the fishing and agricultural activities in the area and the discharge of domestic sewage [28]. The lake was eutrophic with a low aquatic vegetation coverage [27,29]. Restoration measures in Lake Datong began in late 2017, including banning fishing, removing fish, controlling sewage, and recovering aquatic vegetation, and the lake was in a state of forced human control. The monitoring data from January to November 2019 are shown in Table 1. The measurements were conducted by the Chinese Research Academy of Environmental Sciences using standard methods [30]. The data showed that it was still assessed as mild to moderate eutrophication, although the water quality had been improved. The coverage of aquatic vegetation in Lake Datong had reached 47.46% in July 2019, but due to the removal, the biomass of fish was very low. This study focuses on the combined effects of aquatic vegetation with fish on biomass and the follow-up management.

2.2. Modeling the Lake Datong Ecosystem

2.2.1. Ecosystem Model

The Ecopath with Ecosim (EwE) model, developed by International Center for Living Aquatic Resources Management, has a friendly interface and powerful functions to simulate the aquatic ecosystems. EwE is a mass-based whole ecosystem model that takes all trophic levels of the ecosystem into account and is mainly used to simulate ecosystem status and internal energy flows [31]. It is widely used to simulate the structure of aquatic food webs, and predict the impact of fishery activities on fishery resources. There are several examples, such as the construction of the great lakes’ food webs and the assessment of marine fisheries resources, mostly using the EwE model [32,33]. While, it is less used to evaluate ecological restoration of lakes. Given the urgency of restoring eutrophic lakes, we use the Ecopath model, a module of EwE, for ecosystem-based restoration in this work.
The Ecopath model is developed from Polovina’s steady-state model to reflect the energy balance of each component of an ecosystem. At any time, any biological or functional group in an ecosystem can satisfy the following relationship [34]:
Production = catches + predation mortality + biomass accumulation + net migration + other mortality. The relationship is based on the mass per unit area.
This model can be expressed concisely and intuitively as
B i × ( P / B ) i × E E i j B j × ( Q / B ) j × D C i j Y i = 0
where Bi is the biomass of functional group i, (P/B)i is the biological turnover rate of functional group i, that is, the ratio of production to biomass, EEi is the ecotrophic efficiency of functional group i, Bj is the biomass of predator functional group j, (Q/B)j is the consumption-to-biomass ratio of functional group j, DCji is the proportion of group i in the diet of group j,   Σ j = 1 n B j · ( Q / B ) j · D C j i represents the amount of functional group i ingested by all n functional groups, and Yi is the fishery yield of group i [34,35]. In this model, ecotrophic efficiency (EE) represents the yield loss ratio of each group due to predation or fishing and can be estimated after the input of B, P/B, Q/B, and DC for all groups. EE < 1 is guaranteed after the parameters are entered.
The energy balance in the Ecopath model is modeled as
( P / Q ) i + ( U / Q ) i + ( R / Q ) i = 1
where (P/Q)i is the production-to-consumption ratio, (U/Q)i is the proportion of unassimilated food in consumption, and (R/Q)i is the respiration-to-consumption ratio [35]. In the model, (P/Q)i is calculated based on the input values of (P/B)i and (Q/B)i, (U/Q)i is treated as an input, and (R/Q)i is estimated by using (2). We also ensure that the Ecopath model can achieve energy balance (R/Q > 0) at parameterization.

2.2.2. Functional Groups

According to the trophic habits (mainly diet) and the available information, we divided the Lake Datong ecosystem into 10 functional groups (Table A1, Appendix A) [34]. Since we focused on ecosystem-based restoration rather than fisheries management, we did not divide each fish species into a functional group, but divided fish into as few functional groups as possible based on diet, thereby simplifying the ecosystem and facilitating research. Due to the large number of small fish species and low biomass, we divided the small fish into a functional group and considered them omnivores as a whole. The zooplankton functional group included protozoans, rotifers, cladoceras and copepodas, of which protozoa dominated the biomass. The phytoplankton functional group included chlorophytes, bacillariophytes, cyanophytes, euglenophytes, cryptophytes, dinophytes and chrysophytes, of which cryptophytes dominated the biomass. Unfortunately, we did not get data on organisms such as aquatic oligochaetes and aquatic insects, so we only considered molluscs as benthic invertebrates. The recovery of aquatic vegetation was mainly through submerged macrophytes, and submerged macrophytes accounted for a large part of aquatic macrophytes in Lake Datong, so we only considered submerged macrophytes as aquatic macrophytes. These functional groups must include the detritus group [34], which is the sum of all inanimate organic matter in the ecosystem, including dead animal and plant corpses, animal manure, residues from feeding, and organic matter carried into lakes by rivers in the form of dissolved or solid particles [36].

2.2.3. Input Parameters

The biomasses of phytoplankton, zooplankton, molluscs and submerged macrophytes and fish catches in Lake Datong were taken from July 2019 sampling data. Phytoplankton and zooplankton were collected along with water, and the biomasses were calculated as wet weight based on microscopic counts. The biomass of submerged macrophytes was solved by differential method based on survey data. The molluscs were collected using Petersen dredger and quadrat method. Fish was caught using gill nets and ground cages. The biomass (B), P/B, and Q/B of fish were estimated from catches and morphological data based on empirical formulas [35,37,38]. The parameters of fish functional groups with multiple species were calculated as the sum the parameters of each species by weighting the biomass. Meanwhile, the P/B of phytoplankton, zooplankton, submerged macrophyte and molluscs, the P/Q of molluscs and zooplankton, and the diet compositions were obtained from studies conducted in similar lakes [33,39,40,41]. The biomass of detritus in the ecosystem was estimated by the linear model of Pauly et al. [42]. U/Q was set to its default values of 0.20 and 0.40 for carnivore and herbivore groups, respectively [35]. Following Kao et al. [33], we set U/Q to 0.55 for molluscs. The units of biomasses were converted into t/km2. The input and output parameters and diet compositions of the Lake Datong model are listed in Table 2 and Table A2, respectively.

2.2.4. Model Balancing and Uncertainty

After inputting the necessary parameters for all functional groups, the model was debugged for balancing. The EE < 1 and GE (=P/Q), which mostly ranges between 0.1 and 0.3, estimated by this model typically show physiological significance [23]. We also used pre-balance (PREBAL) diagnostics to diagnose the model data [43]. As is included by the diagnosis, biomass should span 5–7 orders of magnitude, levels of biomass decline with increasing trophic level by ~5–10% slope (on log scale) and P/B and Q/B ratios of predator groups should be lower than that of prey groups. According to Christensen et al. [35], to balance and optimize the model, its input parameters, especially the diet compositions, need to be fine-tuned.
The uncertainty was assessed by a ‘pedigree’ index in EwE. Each input parameter was assigned an index value and a confidence interval based on its origin and precision (high or low precision, estimated by model, “guesstimated”, approximate or indirect method, from other models, or from literature, etc.) [44]. The overall ‘pedigree’ index τ of the information was calculated:
τ = i = 1 n j = 1 l i j n ,
where lij is the pedigree index for group i and parameter j, n is the total number of groups [34].

2.3. Scenario Simulations

To predict the effects of combinations of aquatic macrophyte and fish biomasses from the ecosystem perspective, we performed scenario simulations based on the original model as a full factorial experiment that included two three-level factors, namely, aquatic vegetation coverage and fish stocking. Aquatic vegetation coverage was set to 10% (2000), 35%, and 70% (1970s) [29], and fish stocking was set to 0, 50, and 100 t/km2. Nine combinations were inputted as parameters before running the model. Several key indicators were compared to determine their impacts on the ecosystem structure and the function of aquatic macrophyte and fish biomasses.

2.4. Management Suggestions

According to the scenario simulations, EE of each functional group, the analysis of mixed trophic impacts, energy flows and food web structure, and overall ecosystem indicators, we proposed several suggestions on the follow-up management of ecological restoration in Lake Datong from the aspects of biomass regulation and food web structure optimization.

2.5. Management Simulation

We used our model in a simulation to verify the feasibility of the management suggestions and then compared the ecosystems before and after management in terms of their energy flows, nutrient cycling, and food web structures based on several indicators. The new input parameters were obtained from Guo et al. [39].

3. Results and Discussion

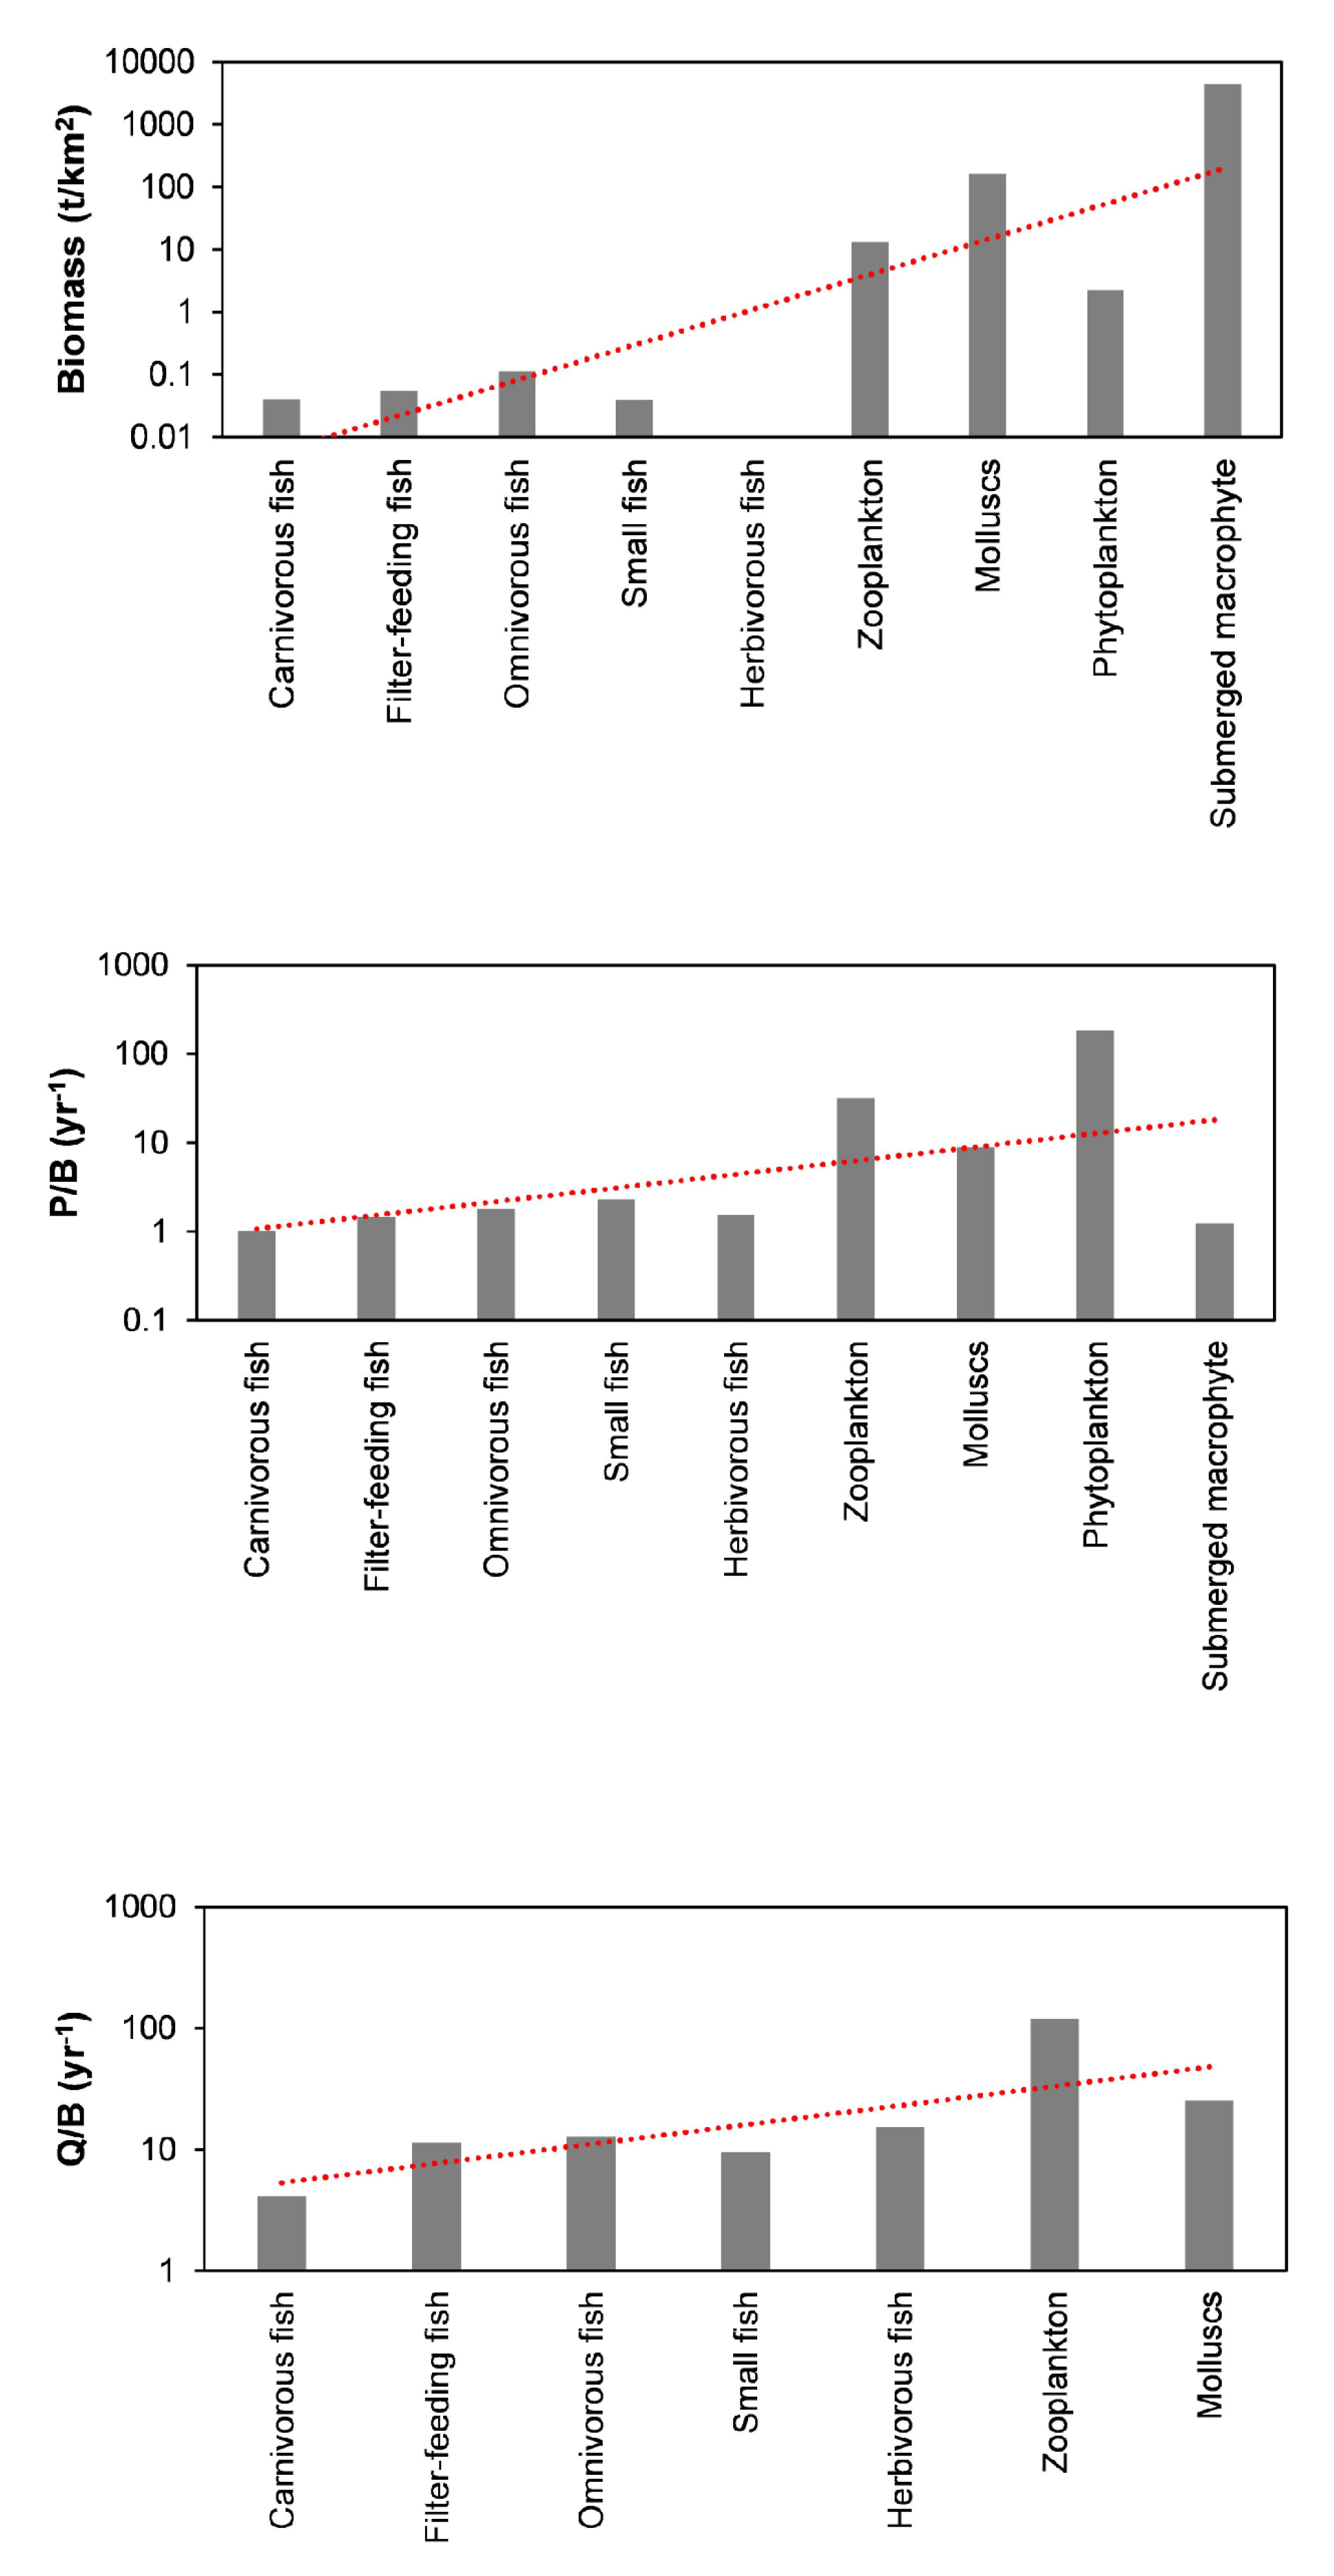
3.1. PREBAL and Uncertainty

The PREBAL analysis showed that biomass, P/B and Q/B generally decreased with increasing trophic levels (Figure 2). Biomass spanned 7 orders of magnitude, which was consistent with PREBAL’s diagnosis. But the slope of the decline was higher because the fish was removed, resulting in low biomass of the fish at high trophic levels. For P/B and Q/B, each functional group roughly conformed to the trend line, indicating good diagnostic results.
The pedigree index was 0.459, which belonged to superior middling from 150 EwE models (0.16–0.68) [45]. Moreover, PREBAL’s rules of thumb were used to adjust the data to make the model parameters more reasonable. The PREBAL and pedigree Index results indicated that the parameters of the model were reliable and the results of the model could describe the ecosystem well.

3.2. Status of the Lake Datong Ecosystem

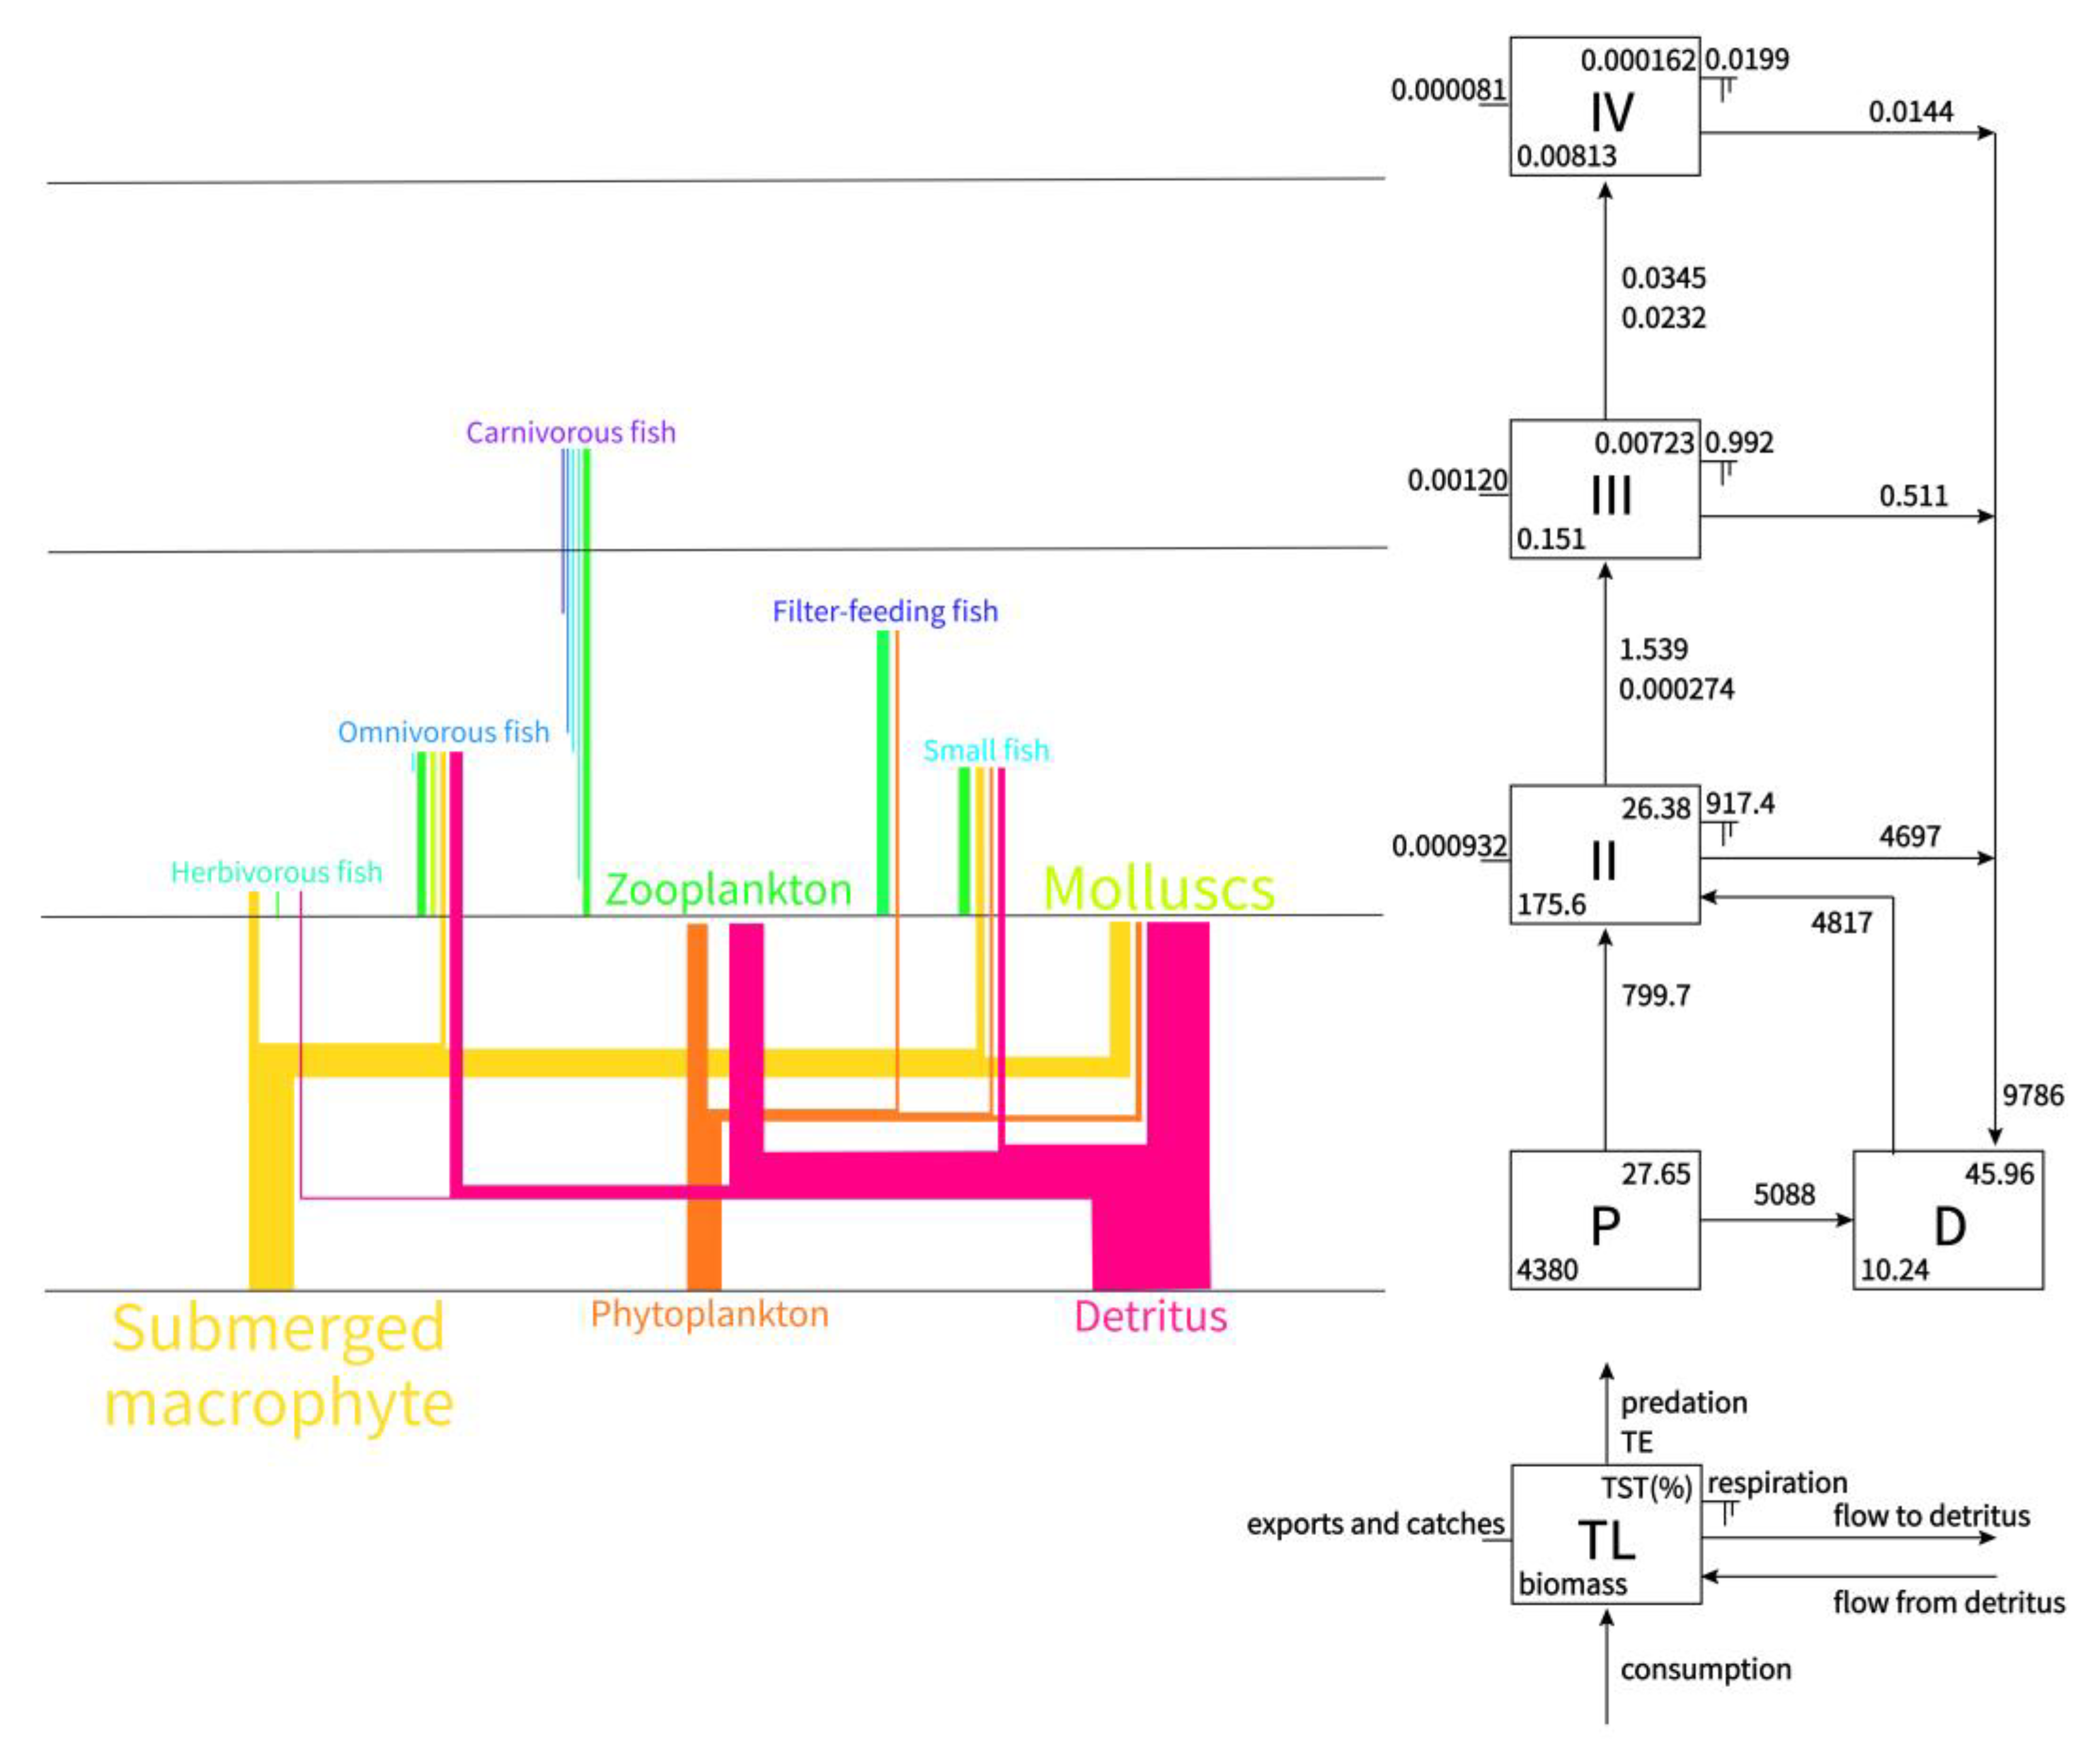
3.2.1. Food Web and Trophic Structure

Our model estimated the trophic level of each functional group of the Lake Datong ecosystem. These levels varied between 1 (primary producer) and 3.232 (Carnivorous fish; Table 2). According to the integrated trophic level of the food web as proposed by Lindeman [46], the primary producers and detritus of the food web were defined as level I, and the trophic levels of consumers gradually increased [35]. Primary producers included submerged macrophytes and phytoplankton. The two primary producers and detritus groups in Lake Datong were all level I, the molluscs and zooplankton were level II, and fish groups occupied higher trophic levels (Table 2). The food web energy flows of the Lake Datong ecosystem were mainly driven by three pathways, including two grazing food chains (from submerged macrophytes and phytoplankton) and one detrital food chain. Among these pathways, detritus acted as the main energy source of the Lake Datong food web (Figure 3).

3.2.2. Flows and Biomasses

Throughput refers to the flux of nutrients flowing through a trophic level per unit time. The total throughput of each trophic level includes the amount of output (amount of catching and deposition from the ecosystem), predation, respiration (excluding respiration from plants and detritus), and flow to detritus [36]. Trophic level I accounted for most of the system throughput and total biomass (Table 3), thereby indicating that the bottom-up effect dominated in the Lake Datong ecosystem. As shown in Figure 3, the throughput of primary producers was 5887.7 t·km−2·a−1, the amount of predation was only 799.7 t·km−2·a−1 because of the limited number of herbivores, and the amount of flow to detritus was 5088 t·km−2·a−1, which accounted for 86.42% of the throughput of primary producers. The total flow to detritus from each trophic level was 9786 t·km−2·a−1, of which 4817 t·km−2·a−1 was consumed, whereas the remaining 4969 t·km−2·a−1 (50.78%) was separated from the ecosystem due to mineralization [47]. Therefore, a large amount of submerged macrophytes was neither grazed nor recycled but was deposited to the sediment as reflected in the low EE values of the submerged macrophyte and detritus groups. The throughput from primary producers was 6688 t·km−2·a−1 (Table 3), whereas that from detritus was 14,604 t·km−2·a−1, which accounted for 68.59% of the system throughput.
The transfer efficiencies (TEs) of the primary producers and detrital pathways in the Lake Datong ecosystem were 0.321% and 0.283%, respectively. The total TE was 0.289%, which was far lower than the average ecosystem transfer efficiency (9.2%) reported by Christensen et al. [48] and the optimal “1/10 Law” of ecological pyramid energy conversion efficiency [46]. The total throughput of trophic levels II and that of trophic levels III were 5616 t·km−2·a−1 and 1.539 t·km−2·a−1, respectively. The ratio of those, the TE of trophic level II, was 0.0274%. The TE values of trophic levels III and IV were 2.319% and 0.381%, respectively. The TE of each trophic level in Lake Datong is shown in Table 4.

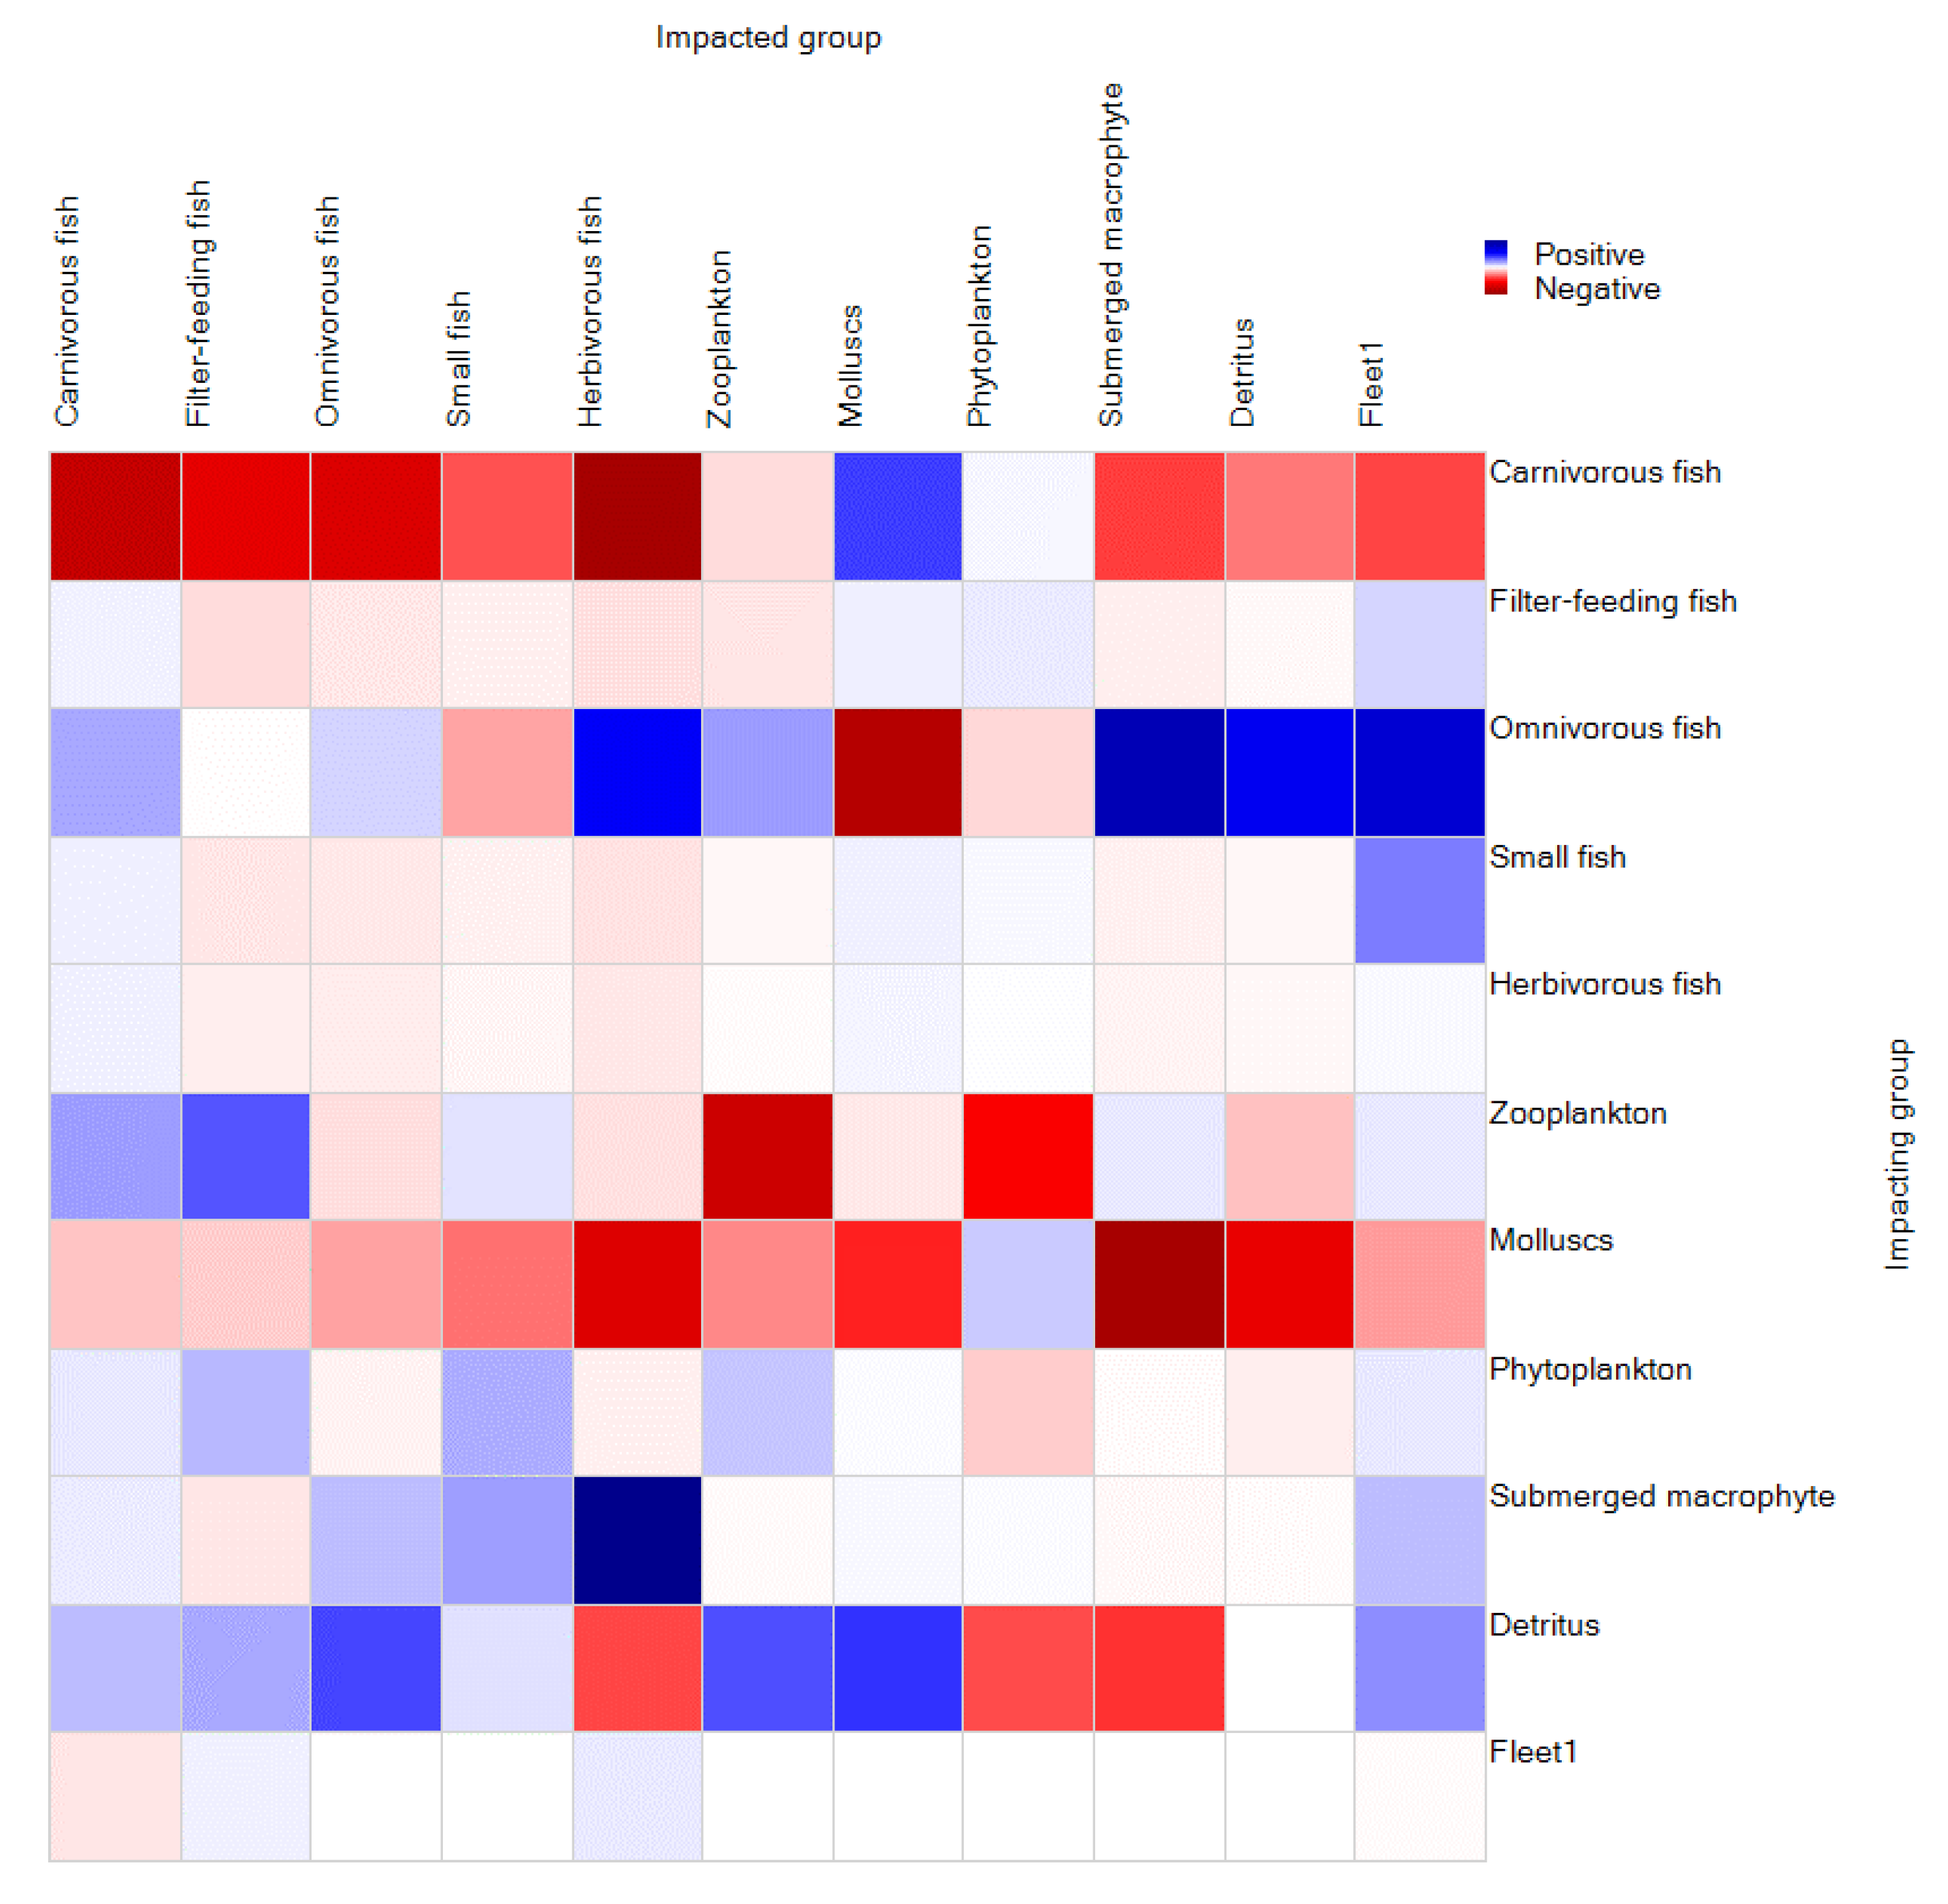
3.2.3. Mixed Trophic Impacts

The trophic relationship among the functional groups was analyzed by using the module of mixed trophic impacts (Figure 4). Primary producers positively affected most functional groups mainly because they acted as food sources of other functional groups. The molluscs functional group had negative effects on the submerged macrophyte and detritus groups (through consumption) and all the consumers (through competition). The carnivorous fish group had strong negative effects on all the fish functional groups through top-down predation. The omnivorous fish group affected positively on the submerged macrophyte and detritus groups and affected negatively on the molluscs group.

3.2.4. Total Properties of the Ecosystem

The 24 indicators of Odum evaluated ecosystems based on six aspects, namely, community energetics, nutrient cycling, community structure, life history, selection pressure, and overall homeostasis [49]. The summary statistics and key indicators of the Lake Datong ecosystem are listed in Table 5.
For community energetics, as the system biomass increases, the ratio of total primary production to total respiration (TPP/TR) gradually decreases from greater than 1 to close to 1. TPP and TR are two important indicators that describe ecosystems. The difference between these indicators lies in net system production. The TPP/TR in mature ecosystems is close to 1, whereas the net system production is close to 0 [50]. The TPP/TR and net system production of the Lake Datong ecosystem obtained from the model were 6.411 and 4969.63 t·km−2·a−1, respectively, thereby suggesting that too many nutrients were left unutilized in this ecosystem.
The ratio of total primary production to total biomass (TPP/TB) is also expected to be a function of system maturity [51]. As discussed above, the respiration for immature systems is less than their primary production, that is, the TPP/TR is greater than 1. In this case, more biomass is accumulated as the system matures. Therefore, immature systems are expected to have the highest TPP/TB, which diminishes as these systems mature. The Lake Datong ecosystem had a TPP/TB of 1.231.
The connectance index (CI) and system omnivory index (SOI) reflect the complexity of internal connections in an ecosystem [51]. A greater system maturity corresponds to higher connection complexity (food web) among its functional groups [50]. In this case, CI and SOI are positively correlated with system maturity. The Lake Datong ecosystem had a CI and a SOI of 0.277 and 0.070, respectively, which suggested that this ecosystem was immature with a linear food web structure and low internal connection complexity.
With regard to nutrient cycling, Finn’s cycling index (FCI) refers to the ratio of cycling flow to the total system throughput, whereas Finn’s mean path length (FMPL) refers to the average length of each cycle through the food chain [52]. A mature system typically has a high degree of material recycling and a long food chain through which energy flows pass [35]. The Lake Datong ecosystem had an FCI and an FMPL of 17.55% and 2.923, respectively, which pointed toward its low maturity. The vast unutilized components of each functional group entered the detritus group, and the food chains from detritus accounted for more than half of the total system throughput. Given that most of the detritus leaved the system due to mineralization and sedimentation, many matters could not be recycled and the cycling proportion was decreased, that is, the FCI decreased. FMPL was also limited by the degree of circulation. The high TPP/TR and TPP/TB, and the low TE, FCI, FMPL, CI, and SOI suggested that the Lake Datong ecosystem was in an immature stage of development.

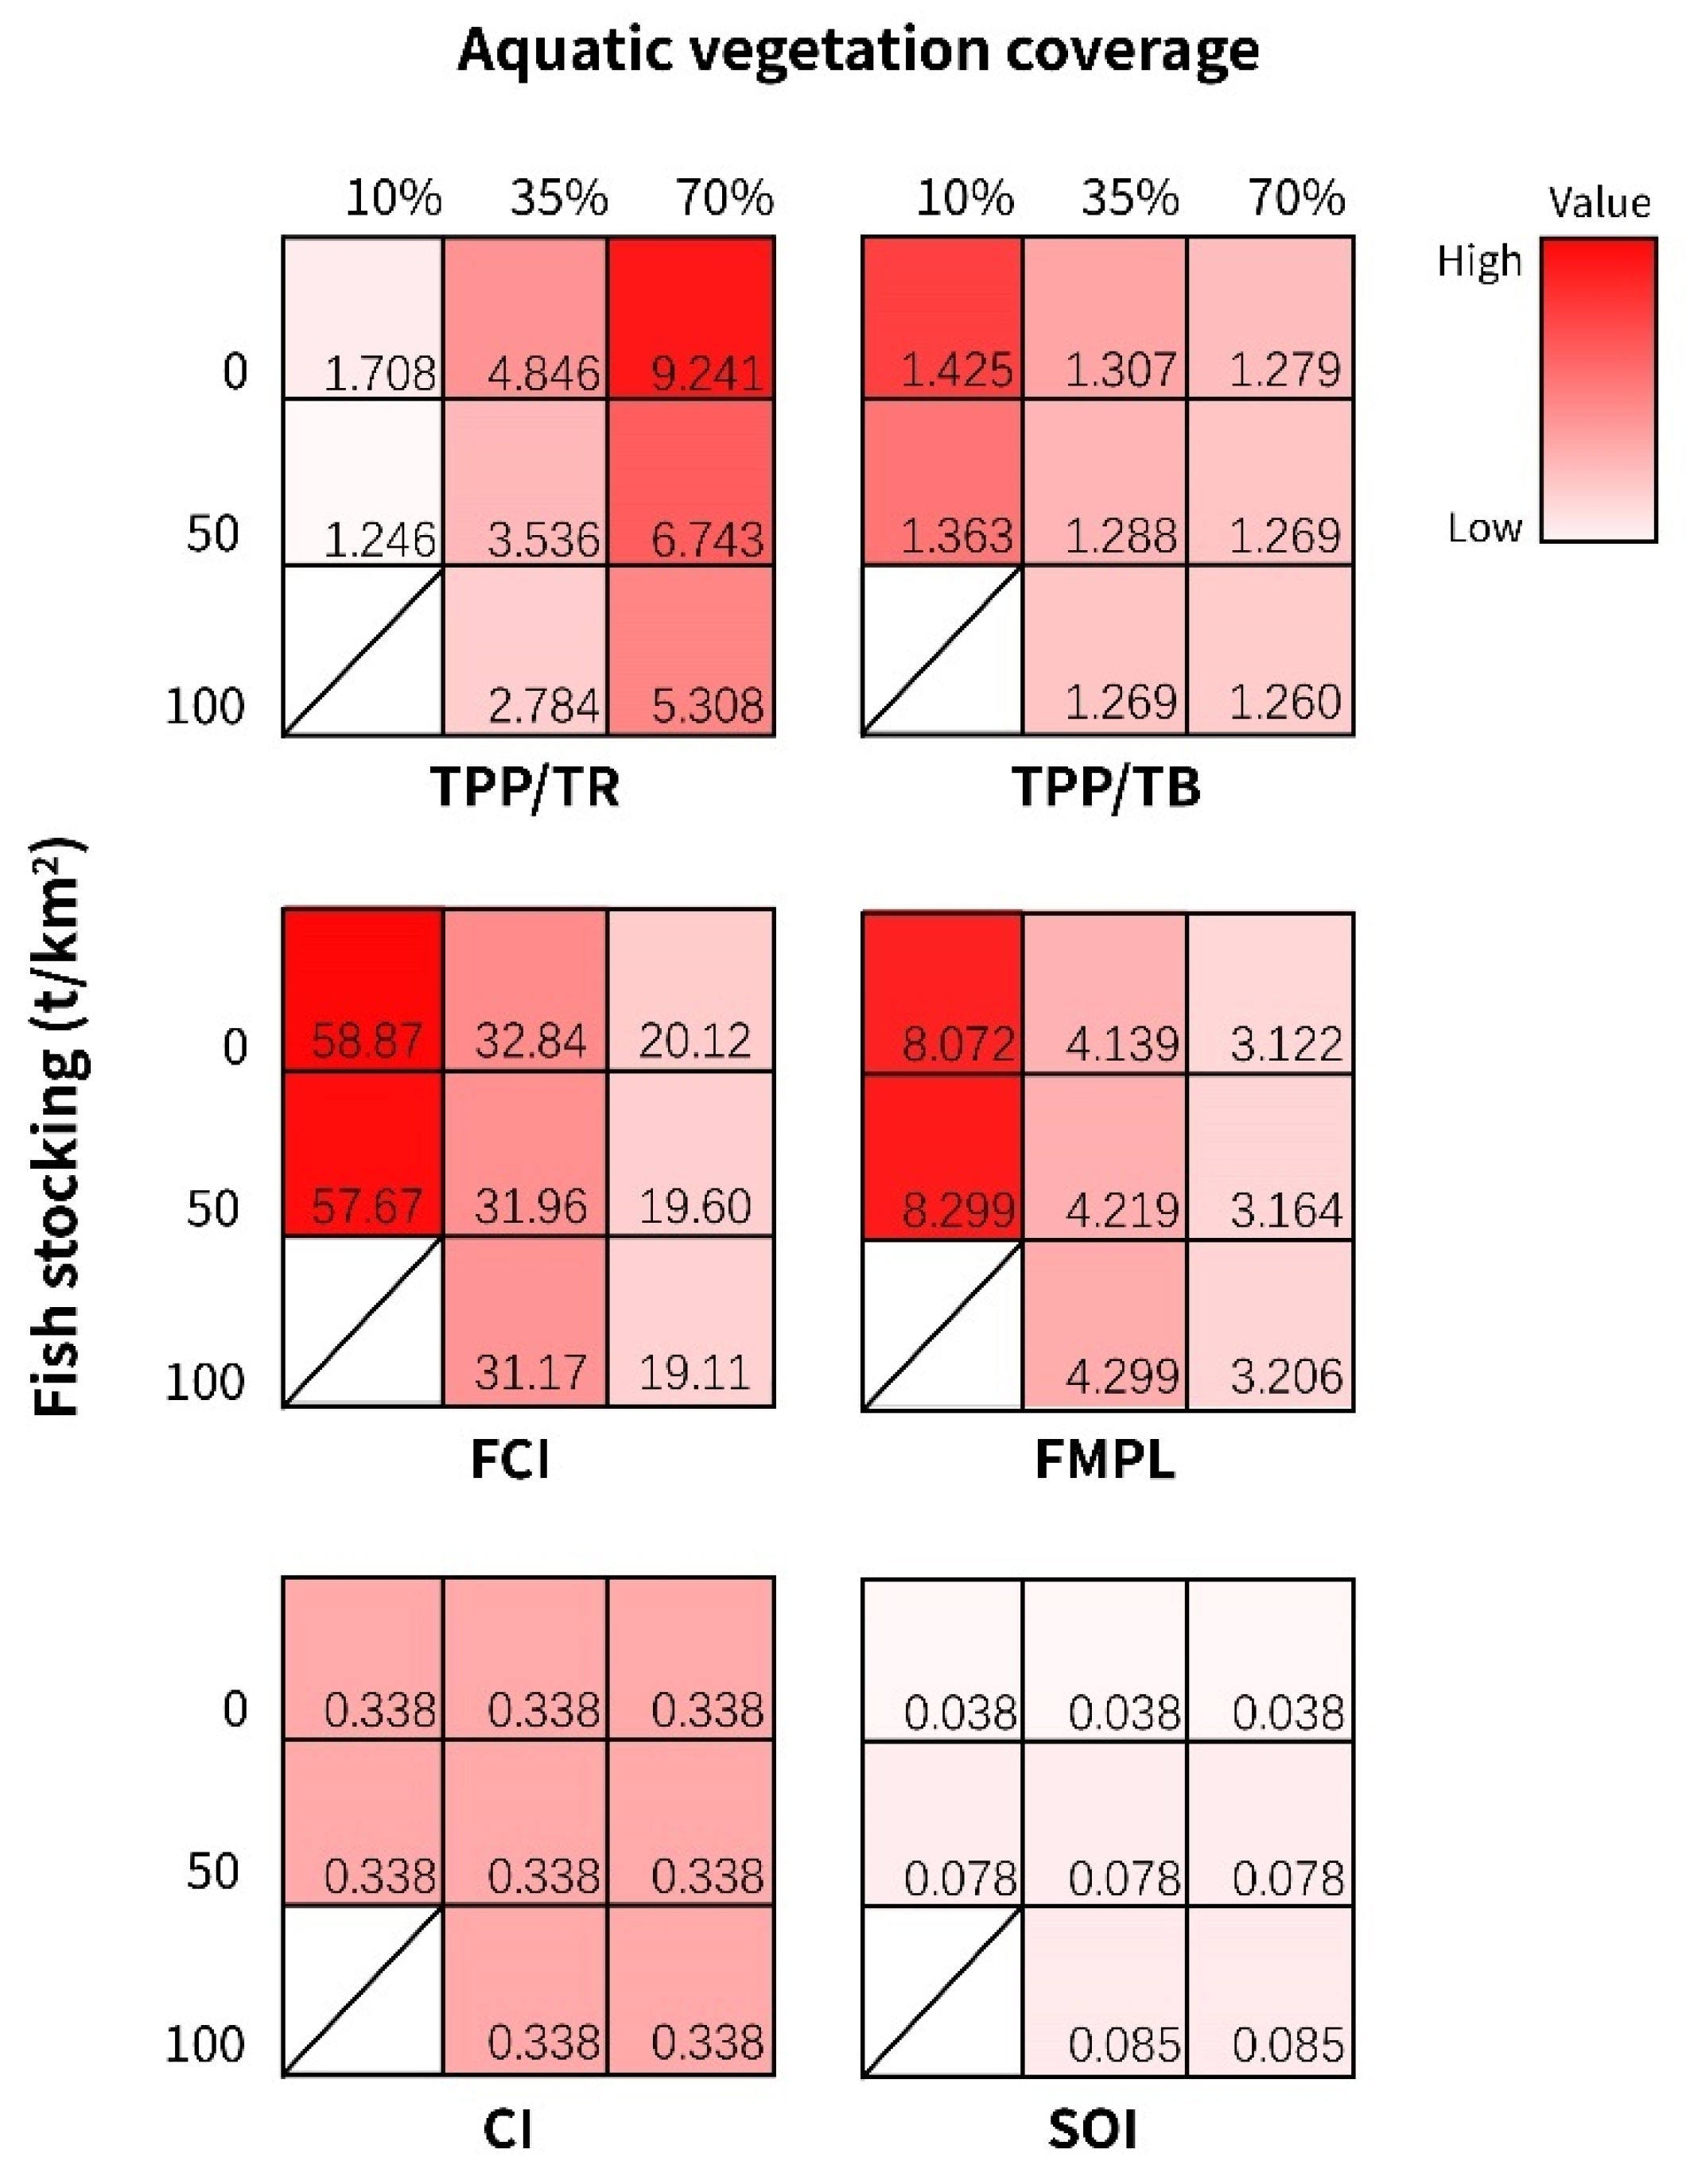
3.3. Scenario Simulations

We ran 9 scenario combinations, and the results of several key indicators that reflect ecosystem maturity are shown in Figure 5. Along with an increasing aquatic vegetation coverage and decreasing fish stocking, the color of TPP/TR square deepened (denoting an increasing value), which indicated a decreasing system maturity. The TPP/TB was greatly affected by submerged macrophytes, making it closer to P/B of the submerged macrophyte group (1.25). The effect of fish stocking on TPP/TB was relatively smaller, so that we couldn’t observe the results intuitively from the color, but through numerical comparison, we could find that: the TPP/TB decreased with the increase of fish stocking when controlling the aquatic vegetation coverage. In the process of ecosystem development, with the accumulation of biomass, the TPP/TB gradually decreases and approaches to 1. This result showed that, fish stocking could accelerate the development process and increase the maturity of the system. The color depths also suggested the significant influence of aquatic vegetation coverage on FCI and FMPL. Meanwhile, the color for fish stocking hardly changed. A comparison of their values revealed that FCL and FMPL were consistent with TPP/TR and TPP/TB even though their values reflected opposite trends because high FCL and FMPL corresponded to the high maturity of the ecosystem. Our factors didn’t significantly influence CI and SOI because these indices reflected the complexity of the food web, whereas the factor changes didn’t change the diet compositions. Under the combined scenario of 10% aquatic vegetation coverage and 100 t/km2 fish stocking, the model was unbalanced, which mean that excessive fish stocking would also cause ecosystem collapse, although fish stocking could increase system maturity.
The results suggested that enough fish as consumers must be present in a lake with a high aquatic vegetation coverage. The TPP/TR, TPP/TB, FCI, and FMPL results showed that the fish stocking could enhance the utilization of nutrients, accelerate the accumulation of biomass, improve nutrient cycling, and extend the length of food chains, thereby enhancing the maturity of the ecosystem. However, too much fish could also lead to ecosystem collapse due to the lack of food. Meanwhile, the CI and SOI results suggested that the complexity of the food web couldn’t be improved only by increasing fish biomass. We also need to increase species diversity and improve the structure of the food web to make food chains web-like.
Submerged macrophytes are important primary producers in an aquatic ecosystem that provide a nutrition foundation and living environment for aquatic animals [53,54,55]. In the early stage of shallow lake ecosystem restoration, submerged macrophytes, as pioneer species, can accelerate the succession of the ecosystem and maintain its biodiversity and stability [56]. However, in our scenario simulations, decreasing the biomass of submerged macrophytes and increasing that of fish can significantly enhance the energy flows and nutrient cycling of the ecosystem, which is consistent with the findings of Li [36]. This result indicated that the low maturity of the Lake Datong ecosystem was largely driven by the excessive submerged macrophytes and the lack of fish. A similar situation can also be observed in the waters of other regions, which maintain appropriate biomass levels by using herbivory management approaches [26]. On the one hand, the large-scale planting of aquatic macrophytes to improve the aquatic vegetation coverage leads to high primary production that can’t be consumed. On the other hand, the nutrients deposited by aquatic macrophytes, as endogenous nutrients, begin to be released when the nutrient load from exogenous inputs decreases, thereby decelerating the restoration process of eutrophic lakes [57]. Therefore, removing excessive aquatic macrophytes and stocking fish are important in the later stage of ecological restoration, which has guiding significance for the restoration of shallow, eutrophic lakes.

3.4. Management Suggestions

The results of the scenario simulations showed that only increasing or decreasing biomass hardly improved the food web structure. Therefore, we proposed several management suggestions from the aspects of regulating biomass and improving food web structure.

3.4.1. Regulate Biomass

After the sewage discharge reduction, aquatic vegetation recovery, and fish removal, the Lake Datong ecosystem was in a state of reconstruction. The biomass of fish in Lake Datong was low, whereas that of submerged macrophytes was high, thereby leading to the utilization of a large amount of primary production and reducing the EE of the submerged macrophytes group (0.059). Withered submerged macrophytes should be removed during autumn and winter to improve water quality and avoid excessive mineralization [36,58]. Increasing the biomass of herbivorous fish can increase the consumption of submerged macrophytes [59,60]. However, given the stability of the submerged macrophytes community and its important role in water purification, the EE of the submerged macrophytes group should not be too high, so the biomass of herbivorous fish should not be excessive.
The detrital food chain accounted for 68.59% of the total system throughput. In the molluscs group with large biomass, 88% of diet came from detritus, but its EE was almost 0. The large amount of energy from the molluscs group couldn’t be passed on. The molluscs group should have played an important part in the energy flows of the Lake Datong ecosystem. According to mixed trophic impacts, omnivorous fish had a strong effect on molluscs. Therefore, increasing the biomass of omnivorous fish will significantly enhance the energy flow.

3.4.2. Improve Food Web Structure

The food web of the Lake Datong ecosystem had three pathways for energy flows, including two grazing food chains and one detrital food chain. For the grazing food chains from submerged macrophytes, herbivore fish can be introduced. Meanwhile, for detrital food chains, stocking omnivorous fish and small fish can enhance the utilization and flows of detritus [39,61]. Introducing shrimp not only remits the predation pressure on small fish as bait base but also enhances the food web structure. Compared with the grazing chains from submerged macrophytes and detrital food chains, the grazing chains from phytoplankton in the Lake Datong ecosystem were extremely fragile. The EE of phytoplankton was as high as 0.848, whereas that of zooplanktons was as low as 0.019. Therefore, consistent with biomanipulation [62], the amount of filter-feeding fish should not be increased.
Small fish as bait positively affected most fish (Figure 3) and provided the high species diversity of the ecosystem (Table A1). But the biomass of small fish in Lake Datong was very low, thereby making this group extremely vulnerable. Small fish also played an important role in upward energy transfer. To maintain food web stability, the biomass must be increased and the species diversity of small fish must be maintained [63,64].
Given the top-down effect on the species we stocked, introducing carnivorous fish was not recommended at this stage. To balance the ecosystem inputs and outputs, we recommend fisheries management measures for rational fishing, such as determining the species and seasons of fishing and setting the minimum fish length and catch. Biodiversity conservation and fishery management should be performed simultaneously [65,66].

3.5. Management Simulation

We performed a management simulation based on management suggestions. We simulated the Lake Datong ecosystem after stock enhancement (a total of 17 t/km2 aquatic organisms, including 5 t/km2 omnivorous fish, 2 t/km2 herbivorous fish, 5 t/km2 small fish, and 5 t/km2 shrimps), the timely removal of withered submerged macrophytes in autumn and winter (removal rate of 80%), and rational fishing (fishing mortality of 50%). We then reanalyzed the ecosystem and compared its structure and function with the pre-management results (Table 6).
After the management simulation, all indicators except for TPP/TB and CI had demonstrated great improvements. Specifically, TPP/TR reduced from 6.411 to 1.401, total TE increased from 0.289% to 3.515%, and FCI and FMPL increased greatly to 59.19% and 8.427, respectively. In sum, the energy flows and nutrient cycling in the Lake Datong ecosystem were strengthened after the management simulation.
The SOI used for describing the food web structure also increased. However, the CI of the Lake Datong ecosystem decreased slightly. The connectance for a given food web is quantified as the ratio of the number of actual links to the number of possible links [67]. Even though we planned to introduced more species, it couldn’t be well reflected in this simplified model, thereby explaining the reduction in CI. The food web structure of the Lake Datong ecosystem may actually be more complex that what we had expected because of the lack of information on benthos, such as aquatic oligochaetes and aquatic insects. The decrease of TPP/TB was due to the influence of submerged macrophytes. The removal of submerged macrophytes leaded to the shift of TPP/TB away from the P/B of the submerged macrophyte functional group.
Our management simulation based on the management suggestions showed significant improvement in energy flows, nutrient cycling, and food web structure. Overall, our findings verified the feasibility of the suggestions and provided a reference for the ecological restoration of shallow eutrophic lakes. However, using these findings as reference in ecological restoration does not signify in any way an attempt to immobilize the same ecological community at some point in time but rather to optimize the potential for local species and communities to recover and continuously reassemble, adapt, and evolve [68].
Numerous shallow eutrophic lakes can be found in the middle and lower reaches of the Yangtze River Basin, some of which have shown good performance in their aquatic vegetation recovery to mitigate eutrophication, such as Lake Donghu [56] and Wuli Lake [21]. However, aquatic macrophytes may also accelerate eutrophication owing to the release of nutrients from actively growing or senescing macrophytes [69,70]. In this study, we took Lake Datong as an example to examine the ecosystem-based restoration of shallow eutrophic lakes and illustrated the short-term benefits and long-term effects of aquatic macrophytes in ecological restoration. In this way, we offered theoretical and scientific support for the ecosystem-based restoration of these types of lakes. In the early stage of restoration of shallow eutrophic lakes, the number of fish should be reduced, and the aquatic vegetation should be recovered to mitigate eutrophication. When the aquatic vegetation community tends to be stable, herbivorous and omnivorous fish should be moderately stocked, and dead aquatic macrophytes should be harvested to maintain the healthy and sustainable development of the ecosystem.

4. Conclusions

(1) The ecosystem model of Lake Datong was constructed successfully. The high TPP/TR and TPP/TB, and the low TE, FCI, FMPL, CI, and SOI of the Lake Datong ecosystem suggested an immature stage of development.
(2) The low maturity of the Lake Datong ecosystem was largely driven by the excessive submerged macrophytes and the lack of fish. Decreasing the biomass of submerged macrophytes and increasing that of fish can significantly enhance the energy flows and nutrient cycling of the ecosystem. But increasing or decreasing biomass hardly improved the food web structure.
(3) Removing macrophytes, stocking herbivorous and omnivorous fish, and rational fishing can not only enhance the energy flows and nutrient cycling of the ecosystem, but also improve the food web structure. This study offered theoretical and scientific support for the ecosystem-based restoration of shallow, eutrophic lakes.

Author Contributions

Conceptualization, M.Z. and J.X.; methodology, K.Z. and J.X.; formal analysis, K.Z., Y.W., and C.L.; resources, J.X., Y.W., and C.L.; writing—original draft preparation, K.Z.; writing—review and editing, J.X. and M.Z.; supervision, M.Z. All authors have read and agreed to the published version of the manuscript.

Funding

This research was supported by the National Key R&D Program of China (Grant No. 2018YFD0900904), the International Cooperation Project of the Chinese Academy of Sciences (Grant No. 152342KYSB20190025), the National Natural Science Foundations of China (Grant No. 31872687), and the Water Pollution Control and Management Project of China (Grant No. 2018ZX07208005).

Acknowledgments

We thank researchers from the Chinese Research Academy of Environmental Sciences for providing the original data used in this study.

Conflicts of Interest

The authors declare no conflict of interest.

Appendix A

Table A1. Functional groups of the Lake Datong ecosystem.
No.Functional GroupComposition
1Carnivorous fishSiniperca chuatsi, Culter alburnus, Culter mongolicus, Erythroculter dabryi, Cultrichthys erythropterus, Coilia brachygnathus
2Filter-feeding fishAristichthys nobilis, Hypophthalmichthys molitrix
3Omnivorous fishPelteobagrus fulvidraco, Cyprinus carpio, Carassius auratus
4Small fishParacanthobrama guichenoti, Acheilognathus macropterus, Squalidus argentatus, Sarcocheilichthys sinensis, Saurogobio dabryi, Rhodeus sinensis, Hemibarbus maculatus, Sarcocheilichthys nigripinnis, Hyporhamphus intermedius, Pseudorasbora parva, Hemiculter leucisculus, Hemiculter bleekeri, Mastacembelus aculeatus
5Herbivorous fishParabramis pekinensis, Megalobrama amblycephala
6ZooplanktonProtozoans, Rorifers, Cladoceras, Copepodas
7MolluscsCristaria plicata, Unio douglasiae, Lanceolaria gladiola, Arconaia lanceolate, Hyriopsis cumingii, Cristaria plicata, Bellamya sp.
8PhytoplanktonChlorophytes, Bacillariophytes, Cyanophytes, Euglenophytes, Cryptophytes, Dinophytes, Chrysophytes
9Submerged macrophyteHydrilla verticillata, Myriophyllum spicatum, Ceratophyllum demersum, Vallisneria natans
10DetritusDetritus
Table A2. Diet compositions of the Lake Datong ecosystem.
No.Groups1234567
1Carnivorous fish0.03
2Filter-feeding fish0.076
3Omnivorous fish0.175
4Small fish0.077 0.004
5Herbivorous fish0.053
6Zooplankton0.5890.9370.2930.4200.1700.004
7Molluscs 0.152
8Phytoplankton 0.063 0.120 0.2000.01
9Submerged macrophyte 0.1310.2000.796 0.11
10Detritus 0.4200.2600.0340.7960.88
11Sum1111111

References

  1. Dodds, W. Freshwater Ecology: Concepts and Environmental Applications; Elsevier Science: Amsterdam, The Netherlands, 2002. [Google Scholar]
  2. Frumin, G.T.; Gildeeva, I.M. Eutrophication of water bodies—A global environmental problem. Russ. J. Gen. Chem. 2014, 84, 2483–2488. [Google Scholar] [CrossRef]
  3. Khan, F.A.; Ansari, A.A. Eutrophication: An ecological vision. Bot. Rev. 2005, 71, 449–482. [Google Scholar] [CrossRef]
  4. Mooij, W.M.; Hülsmann, S.; De Senerpont Domis, L.N.; Nolet, B.A.; Bodelier, P.L.E.; Boers, P.C.M.; Pires, L.M.D.; Gons, H.J.; Ibelings, B.W.; Noordhuis, R.; et al. The impact of climate change on lakes in the Netherlands: A review. Aquat. Ecol. 2005, 39, 381–400. [Google Scholar] [CrossRef]
  5. Paerl, H.W.; Paul, V.J. Climate change: Links to global expansion of harmful cyanobacteria. Water Res. 2012, 46, 1349–1363. [Google Scholar] [CrossRef] [PubMed]
  6. Bhagowati, B.; Ahamad, K.U. A review on lake eutrophication dynamics and recent developments in lake. Ecohydrol. Hydrobiol. 2019, 19, 155–166. [Google Scholar] [CrossRef]
  7. Söderström, M.; Nylund, K.; Järnberg, U.; Lithner, G.; Rosén, G.; Kylin, H. Seasonal Variations of DDT Compounds and PCB in a Eutrophic and an Oligotrophic Lake in Relation to Algal Biomass. AMBIO 2000, 29, 230–237. [Google Scholar] [CrossRef]
  8. Smith, V.H.; Schindler, D.W. Eutrophication science: Where do we go from here? Trends Ecol. Evol. 2009, 24, 201–207. [Google Scholar] [CrossRef]
  9. Hosper, S.H. Biomanipulation, new perspectives for restoration of shallow, eutrophic lakes in The Netherlands. Hydrobiol. Bull. 1989, 23, 5–10. [Google Scholar] [CrossRef]
  10. Wang, Z.; Li, D.; Qin, H.; Li, Y. An integrated method for removal of harmful cyanobacterial blooms in eutrophic lakes. Environ. Pollut. 2012, 160, 34–41. [Google Scholar] [CrossRef]
  11. Shan, M.; Wang, Y.; Xue, S. Study on bioremediation of eutrophic lake. J. Environ. Sci. 2009, 21, S16–S18. [Google Scholar] [CrossRef]
  12. Hilt, S.; Gross, E.M.; Hupfer, M.; Morscheid, H.; Mählmann, J.; Melzer, A.; Poltz, J.; Sandrock, S.; Scharf, E.-M.; Schneider, S.; et al. Restoration of submerged vegetation in shallow eutrophic lakes—A guideline and state of the art in Germany. Limnologica 2006, 36, 155–171. [Google Scholar] [CrossRef] [Green Version]
  13. Wang, G.; Cheng, X. Lake Eutrophication Control in Technology, Theory and Application. J. Lake Sci. 2002, 14, 273–282. [Google Scholar]
  14. Conley, D.J.; Paerl, H.W.; Howarth, R.W.; Boesch, D.F.; Seitzinger, S.P.; Havens, K.E.; Lancelot, C.; Likens, G.E. Controlling eutrophication: Nitrogen and phosphorus. Science 2009, 323, 1014–1015. [Google Scholar] [CrossRef] [PubMed]
  15. Dhote, S.; Dixit, S. Water quality improvement through macrophytes—A review. Environ. Monit. Assess. 2009, 152, 149–153. [Google Scholar] [CrossRef] [PubMed]
  16. Krot, Y. The use of higher aquatic plants in biotechnologies of surface water and wastewater treatment. Hydrobiol. J. 2006, 42, 44–55. [Google Scholar] [CrossRef]
  17. Nina, C.; Jonathan, C.; Stuart, F.; Cathleen, W. Vascular plants as engineers of oxygen in aquatic systems. Bioscience 2006, 56, 219–225. [Google Scholar]
  18. Reddy, K.R.; DeBusk, T.A. State-of-the-art utilization of aquatic plants in water pollution control. Water Sci. Technol. 1987, 19, 61–79. [Google Scholar] [CrossRef]
  19. Zhao, F.L.; Xi, S.; Yang, X.E.; Yang, W.D.; Li, J.J.; Gu, B.H.; He, Z.L. Purifying eutrophic river waters with integrated floating island systems. Ecol. Eng. 2012, 40, 53–60. [Google Scholar] [CrossRef]
  20. Scheffer, M. Ecology of Shallow Lakes; Springer: New York, NY, USA, 1997. [Google Scholar]
  21. Li, W.C. Ecological restoration of shallow, eutrophic lakes-experimental studies on the recovery of aquatic vegetation in Wuli Lake. J. Lake Sci. 1996, 8, 1–10. [Google Scholar]
  22. Zhang, Y.L.; Liu, X.H.; Qin, B.Q.; Shi, K.; Deng, J.M.; Zhou, Y.Q. Aquatic vegetation in response to increased eutrophication and degraded light climate in Eastern Lake Taihu: Implications for lake ecological restoration. Sci. Rep. 2016, 6, 23867. [Google Scholar] [CrossRef]
  23. Nakamura, K.; Tockner, K.; Amano, K. River and wetland restoration: Lessons from Japan. Bioscience 2006, 56, 419–429. [Google Scholar] [CrossRef]
  24. Sayah, S.M.; Boillat, J.-L.; Schleiss, A. The use of soft shore protection measures in shallow lakes: Research methodology and case study. Limnologica 2004, 34, 65–74. [Google Scholar] [CrossRef] [Green Version]
  25. Keddy, P.A. Wetland Ecology: Principles and Conservation; Cambridge University Press: Cambridge, UK, 2010. [Google Scholar]
  26. Chambers, P.A.; DeWreede, R.E.; Irlandi, E.A.; Vandermeulen, H. Management issues in aquatic macrophyte ecology: A Canadian perspective. Can. J. Bot. 1999, 77, 471–487. [Google Scholar] [CrossRef]
  27. Li, D.L.; Zhang, T.; Yu, J.B.; Mao, X.W.; Wang, H.Q.; Chen, K.J.; Liu, A.M.; Li, Z.J.; Xiao, T.Y. Temporal and spatial distributional patterns of mollusca in a typical aquacultural lake—Datong Lake. Acta Hydrobiol. Sin. 2011, 35, 946–954. [Google Scholar]
  28. Wu, K. The Evolutional Characteristics of Water Environment and Total Amount Control of Pollutant in Lake Datong Basin Based on GIS. Master’s Thesis, Hunan University of Science and Technology, Xiangtan, China, 2015. [Google Scholar]
  29. Jian, Y.X.; Wang, J.B.; He, G.Q.; Chen, J.K. A comparative study on aquatic plant diversity and its long-term changes in the three lakes of dongtinghu district in china. Acta Hydrobiol. Sin. 2002, 2, 160–167. [Google Scholar]
  30. APHA. Standard Methods for the Examination of Water and Wastewater, 20th ed.; American Public Health Association: Washington, DC, USA, 1998. [Google Scholar]
  31. Plagányi, É.E.; Food and Agriculture Organization of the United Nations. Models for an Ecosystem Approach to Fisheries; Food and Agriculture Organization of the United Nations: Rome, Italy, 2007. [Google Scholar]
  32. Heymans, J.J.; Coll, M.; Libralato, S.; Morissette, L.; Christensen, V. Global patterns in ecological indicators of marine food webs: A modelling approach. PLoS ONE 2014, 9, e95845. [Google Scholar] [CrossRef] [PubMed] [Green Version]
  33. Kao, Y.-C.; Adlerstein, S.; Rutherford, E. The relative impacts of nutrient loads and invasive species on a Great Lakes food web: An Ecopath with Ecosim analysis. J. Great Lakes Res. 2014, 40, 35–52. [Google Scholar] [CrossRef]
  34. Christensen, V.; Walters, C.J. Ecopath with Ecosim: Methods, capabilities and limitations. Ecol. Model. 2004, 172, 109–139. [Google Scholar] [CrossRef]
  35. Christensen, V.; Walters, C.J.; Pauly, D.; Forrest, R. Ecopath with Ecosim Version 6: User Guide; University of British Columbia Fisheries Centre: Vancouver, BC, Canada, 2008. [Google Scholar]
  36. Li, C.-H.; Xian, Y.; Ye, C.; Wang, Y.-H.; Wei, W.-W.; Xi, H.-Y.; Zheng, B.-H. Wetland ecosystem status and restoration using the Ecopath with Ecosim (EWE) model. Sci. Total Environ. 2019, 658, 305–314. [Google Scholar] [CrossRef]
  37. Palomares, M.L.D.; Pauly, D. Predicting food consumption of fish populations as functions of mortality, food type, morphometrics, temperature and salinity. Mar. Freshw. Res. 1998, 49, 447–453. [Google Scholar] [CrossRef]
  38. Von Bertalanffy, L. A quantitative throry of organic growth (inquiries on growth laws. II). Hum. Biol. 1938, 10, 181–213. [Google Scholar]
  39. Guo, C.B.; Ye, S.W.; Lek, S.; Liu, J.S.; Zhang, T.L.; Yuan, J.; Li, Z.J. The need for improved fishery management in a shallow macrophytic lake in the Yangtze River basin: Evidence from the food web structure and ecosystem analysis. Ecol. Model. 2013, 267, 138–147. [Google Scholar] [CrossRef]
  40. Li, Y.K.; Liu, E.S.; Wang, H.; Gong, Y. Analysis on the ecosystem structure and function of Lake Taihu based on ecopath model. Chin. J. Appl. Ecol. 2014, 25, 2033–2040. [Google Scholar]
  41. Wang, Y.Y.; Kao, Y.-C.; Zhou, Y.M.; Zhang, H.; Yu, X.B.; Lei, G.C. Can water level management, stock enhancement, and fishery restriction offset negative effects of hydrological changes on the four major Chinese carps in China’s largest freshwater lake? Ecol. Model. 2019, 403, 1–10. [Google Scholar] [CrossRef]
  42. Pauly, D.; Bartz, M.L.S.; Palomares, M.L.D. Improved construction, parametrization and interpretation of steady-state ecosystem models. In Trophic Models of Aquatic Ecosystems; Christensen, V., Pauly, D., Eds.; ICLARM: Penang, Malaysia, 1993. [Google Scholar]
  43. Link, J.S. Adding rigor to ecological network models by evaluating a set of pre-balance diagnostics: A plea for PREBAL. Ecol. Model. 2010, 221, 1580–1591. [Google Scholar] [CrossRef]
  44. Pauly, D.; Christensen, V.; Walters, C. Ecopath, Ecosim, and Ecospace as tools for evaluating ecosystem impact of fisheries. ICES J. Mar. Sci. 2000, 57, 697–706. [Google Scholar] [CrossRef]
  45. Morissette, L.; Hammill, M.O.; Savenkoff, C. The trophic role of marine mammals in the northern Gulf of ST. Lawrence. Mar. Mamm. Sci. 2006, 22, 74–103. [Google Scholar] [CrossRef]
  46. Lindeman, R.L. The trophic-dynamic aspect of ecology. Ecology 1942, 23, 399–417. [Google Scholar] [CrossRef]
  47. Li, Y.K.; Chen, Y.; Song, B.; Olson, D.; Yu, N.; Chen, L.Q. Ecosystem structure and functioning of Lake Taihu (China) and the impacts of fishing. Fish. Res. 2009, 95, 309–324. [Google Scholar] [CrossRef]
  48. Christensen, V.; Pauly, D.; The International Center for Living Aquatic Resources Management; Immigration and Customs Enforcement. Trophic Models of Aquatic Ecosystems; International Center for Living Aquatic Resources Management: Penang, Malaysia, 1993.
  49. Odum, E.P. The strategy of ecosystem development. Science 1969, 164, 262–270. [Google Scholar] [CrossRef] [Green Version]
  50. Odum, E.P. Fundamental of Ecology; Saunders: Philadelphia, PA, USA, 1971. [Google Scholar]
  51. Christensen, V. Ecosystem maturity—Towards quantification. Ecol. Model. 1995, 77, 3–32. [Google Scholar] [CrossRef]
  52. Finn, J.T. Measures of ecosystem structure and function derived from analysis of flows. J. Theor. Biol. 1976, 56, 363–380. [Google Scholar] [CrossRef]
  53. Findlay, S.E.G.; Nieder, W.C.; Blair, E.A.; Fischer, D.T. Multi-scale controls on water quality effects of submerged aquatic vegetation in the tidal freshwater Hudson River. Ecosystems 2006, 9, 84–96. [Google Scholar] [CrossRef]
  54. Meerhoff, M.; Clemente, J.; Teixeira de Mello, F.; Iglesias, C.; Pedersen, A.; Jeppesen, E. Can warm climate-related structure of littoral predator assemblies weaken clear water state in shallow lakes? Glob. Chang. Biol. 2007, 13, 1888–1897. [Google Scholar] [CrossRef]
  55. Yamaki, A.; Yamamuro, M. Floating-leaved and emergent vegetation as habitat for fishes in a eutrophic temperate lake without submerged vegetation. Limnology 2013, 14, 257–268. [Google Scholar] [CrossRef]
  56. Qiu, D.R.; Wu, Z.B.; Liu, B.Y.; Deng, J.Q.; Fu, G.P.; He, F. The restoration of aquatic macrophytes for improving water quality in a hypertrophic shallow lake in Hubei Province, China. Ecol. Eng. 2001, 18, 147–156. [Google Scholar] [CrossRef]
  57. Webster, J.R.; Benfield, E.F. Vascular plant breakdown in freshwater ecosystems. Annu. Rev. Ecol. Syst. 1986, 17, 567–594. [Google Scholar] [CrossRef]
  58. Environmental Protection Agency Office of Water Planning and Standards. Lake Restoration, Proceedings of the National Conference, Minneapolis, MN, USA, 22–24 August 1978; U.S. Environmental Protection Agency, Office of Water Planning and Standards: Minneapolis, USA, 1979.
  59. Dall Armellina, A.A.; Bezic, C.R.; Gajardo, O.A. Submerged macrophyte control with herbivorous fish in irrigation channels of semiarid Argentina. Hydrobiologia 1999, 415, 265–269. [Google Scholar] [CrossRef]
  60. Colle, D.E.; Shireman, J.V. Coefficients of condition for largemouth bass, bluegill, and redear sunfish in hydrilla-infested lakes. Trans. Am. Fish. Soc. 1980, 109, 521–531. [Google Scholar] [CrossRef]
  61. Polis, G.A.; Power, M.E.; Huxel, G.R. Food Webs at the Landscape Level; University of Chicago Press: Chicago, IL, USA, 2004. [Google Scholar]
  62. Shapiro, J.; Lamarra, V.; Lynch, M. Biomanipulation: An ecosystem approach to lake restoration. In Water Quality Management through Biological Control; Brezonik, P.L., Fox, J.L., Eds.; University of Florida: Gainesville, FL, USA, 2013. [Google Scholar]
  63. Carey, M.P.; Wahl, D.H. Fish diversity as a determinant of ecosystem properties across multiple trophic levels. Oikos 2011, 120, 84–94. [Google Scholar] [CrossRef]
  64. Hargrave, C.W. Effects of fish species richness and assemblage composition on stream ecosystem function. Ecol. Freshw. Fish. 2009, 18, 24–32. [Google Scholar] [CrossRef]
  65. Allan, J.D.; Abell, R.; Hogan, Z.; Revenga, C.; Taylor, B.W.; Welcomme, R.L.; Winemiller, K. Overfishing of inland waters. Bioscience 2005, 55, 1041–1051. [Google Scholar] [CrossRef] [Green Version]
  66. Myers, R.A.; Rosenberg, A.A.; Mace, P.M.; Barrowman, N.; Restrepo, V.R. In search of thresholds for recruitment overfishing. ICES J. Mar. Sci. 1994, 51, 191–205. [Google Scholar] [CrossRef]
  67. Gardner, M.R.; Ashby, W.R. Connectance of large dynamic (cybernetic) systems: Critical values for stability. Nature 1970, 228, 784. [Google Scholar] [CrossRef] [PubMed]
  68. Gann, G.D.; McDonald, T.; Walder, B.; Aronson, J.; Nelson, C.R.; Jonson, J.; Hallett, J.G.; Eisenberg, C.; Guariguata, M.R.; Liu, J.; et al. International principles and standards for the practice of ecological restoration, 2nd Ed. Restor. Ecol. 2019, 27, S1–S46. [Google Scholar] [CrossRef] [Green Version]
  69. Carignan, R.; Kalff, J. Phosphorus release by submerged macrophytes: Significance to epiphyton and phytoplankton. Limnol. Oceanogr. 1982, 27, 419–427. [Google Scholar] [CrossRef]
  70. Landers, D.H. Effects of naturally senescing aquatic macrophytes on nutrient chemistry and chlorophyll a of surrounding waters. Limnol. Oceanogr. 1982, 27, 428–439. [Google Scholar] [CrossRef]
Figure 1. Analytical flowchart of this study.
Water 12 02141 g001
Figure 2. The PREBAL diagnostic analysis of input parameters (Biomass, P/B and Q/B). All y axis values are log-scaled whereas species on the x axis are ranked from highest to lowest trophic level. The red dotted line represents regression between trophic level and other values.
Water 12 02141 g002
Figure 3. Flow diagram (left) and Lindeman spine (right) of the Lake Datong food web. Different colors correspond to different functional groups, the thickness of each line segment denotes the relative energy flow, and the font size represents the relative biomass. P: producer; D: detritus; TL: trophic levels; TST (%): total system throughput (%); TE: transfer efficiency.
Water 12 02141 g003
Figure 4. Mixed trophic impacts among the functional groups of the Lake Datong food web.
Water 12 02141 g004
Figure 5. Several key indicators across 9 scenarios of aquatic vegetation coverage and fish stocking. TPP/TR: total primary production/total respiration; TPP/TB: total primary production/total biomass; FCI: Finn’s cycling index; FMPL: Finn’s mean path length; CI: connectance index; SOI: system omnivory index. The ‘/’ represents the model imbalance under this scenario.
Water 12 02141 g005
Table 1. The monitoring data from January to November 2019.
ParametersUnitAverageMaximumMinimumStandard Deviation
Chlorophyll amg/L0.0140.0420.0010.014
Total phosphorusmg/L0.1210.1840.0780.034
Total nitrogenmg/L0.981.750.410.44
Secchi depthcm39861119
Chemical oxygen demand (Mn)mg/L5.36.54.30.6
Table 2. Input and output (BOLD) parameters of the Lake Datong model.
GroupsTrophic LevelBiomass (t/km2)P/B
(year−1)
Q/B
(year−1)
EEP/Q
Carnivorous fish3.2320.0401.0204.1560.1320.245
Filter-feeding fish2.9410.0541.44011.470.1670.126
Omnivorous fish2.4520.1121.80012.880.1510.140
Small fish2.4220.0402.3009.4080.2110.244
Herbivorous fish2.1710.0101.55015.310.5760.101
Zooplankton2.00412.9831.69120.00.0190.264
Molluscs2.000162.68.83025.000.0000.353
Phytoplankton1.0002.245185 0.848
Submerged macrophyte1.00043781.25 0.082
Detritus1.00010.24 0.492
P/B is the ratio of production to biomass, and Q/B is the ratio of consumption to biomass, EE is the ecotrophic efficiency, P/Q is the ratio of production to consumption.
Table 3. Flows and biomasses of the Lake Datong ecosystem (t/km2).
Trophic LevelTotal ThroughputThroughput from Primary ProducersThroughput from DetritusBiomass
IV0.03450.006590.02790.00813
III1.5390.3021.2370.151
II5616799.74817175.6
I15,674588897864380
Sum21,2926688146044556
Table 4. Transfer efficiency (TE) of each trophic level of the Lake Datong ecosystem (%).
SourceTrophic Level
IIIIIIV
Primary producer0.03782.2650.388
Detritus0.02570.3320.379
All flows0.02742.3190.381
From primary producers0.321
From detritus0.283
Total0.289
Table 5. Summary statistics and key indicators of the Lake Datong ecosystem.
ParametersValueUnits
Sum of all consumption5624.34t·km−2·a−1
Sum of all exports4969.63t·km−2·a−1
Sum of all respiratory flows918.42t·km−2·a−1
Sum of all flows into detritus9786.15t·km−2·a−1
Total system throughput21,298.54t·km−2·a−1
Sum of all production7735.19t·km−2·a−1
Calculated total net primary production5888.05t·km−2·a−1
Total primary production/total respiration (TPP/TR)6.411-
Net system production4969.63t·km−2·a−1
Total primary production/total biomass (TPP/TB)1.292-
Total biomass (excluding detritus)4556.28t·km−2·a−1
Total transfer efficiency (Total TE)0.289%
Connectance Index (CI)0.325-
System Omnivory Index (SOI)0.038-
Finn’s Cycling Index (FCI)28.84% of total throughput
Finn’s Mean Path Length (FMPL)3.617-
Ecopath pedigree index0.459-
Table 6. Key indicators of the Lake Datong ecosystem before and after the management simulation.
ParametersBefore the Management SimulationAfter the Management SimulationUnits
Total primary production/total respiration (TPP/TR)6.4111.401-
Total primary production/total biomass (TPP/TB)1.2921.410-
Total transfer efficiency (Total TE)0.2893.515%
Connectance Index (CI)0.3250.323-
System Omnivory Index (SOI)0.0380.121-
Finn’s Cycling Index (FCI)26.8459.19% of total throughput
Finn’s Mean Path Length (FMPL)3.6178.427-

