Article

Effects of Straw Returning Combine with Biochar on Water Quality under Flooded Condition

1
College of Agricultural Science and Engineering, Hohai University, Nanjing 210098, China
2
State Key Laboratory of Hydroscience and Engineering, Department of Hydraulic Engineering, Tsinghua University, Beijing 100084, China
3
State Key Laboratory of Hydrology-Water Resources and Hydraulic Engineering, Hohai University, Nanjing 210098, China
4
Collaborative Innovation Center for Water Security and Water Science, Hohai University, Nanjing 210098, China
*
Author to whom correspondence should be addressed.
Water 2020, 12(6), 1633; https://doi.org/10.3390/w12061633
Submission received: 11 May 2020 / Revised: 1 June 2020 / Accepted: 4 June 2020 / Published: 7 June 2020
(This article belongs to the Section Water Quality and Contamination)

Abstract

:
Biochar is generally available to absorb nitrogen, phosphorus and other pollutants to improve water quality. However, the feasibility of biochar in improving water quality deterioration after straw returning is still unclear. In this study, pot experiments were conducted to evaluate the effects of straw decomposition on total phosphorus (TP), ammonium nitrogen (NH4+-N), nitrate nitrogen (NO3-N) and potassium permanganate index (CODMn) under CK (no straw returning), ST (straw of 7 t/hm2 returning) and SC (straw of 7 t/hm2 and biochar of 20 t/hm2 returning) conditions. Results showed that straw returning could significantly increase the nitrogen and phosphorus contents in field water. After adding biochar, there were significant differences in TP, NH4+-N, NO3-N and CODMn both in surface water and 0–10 cm soil water in SC treatment compared to ST treatment. The concentration of TP, NH4+-N, NO3-N and CODMn in surface water under SC treatment were always lower than that under ST treatment, and the maximum concentration could decrease by 52.29%, 39.67%, 35.23% and 44.50%, respectively. In 0–10 cm soil water, the concentration of TP, NO3-N and CODMn under SC treatment was always significantly higher than that under ST treatment, and the NH4+-N concentration in SC treatment was gradually higher than that under ST treatment at the middle-late observation period. Results indicate that straw returning combined with biochar can effectively decrease the nitrogen concentration, phosphorus concentration and organic pollutants in surface water, inhibit the diffusion of non-point source pollutant, and reduce the risk of water pollution caused by straw returning.

1. Introduction

Crop straw is the main byproduct of agricultural production, with approximately 4 billion metric tons per year generated globally [1]. As a great agricultural country, China has a large amount of straw resources, which accounts for around 20% of global crop straw annual production. The traditional treatment method of straw is burned in field, which could not only cause serious air pollution, but also waste straw resources. With the development of agricultural technology, straw returning has gradually developed into the main way of re-utilization of straw resources. Straw returning is a method to apply straw (including wheat, maize and rice straw) directly, or apply to soil after accumulation and maturity. However, the crop straw decomposition will produce nitrogen, phosphorus and organic materials, which are all important organic fertilizer sources in agriculture [2,3].
Straw returning is a common measure to increase the soil fertilizer and crop yields. It is very popular in China, as it can improve soil nutrients and structure [4,5], promote soil microbial activity and crop root growth [6,7] and increase crop yields [8,9]. However, returning crop straw to the field undoubtedly also induces negative effects. On the one hand, the negative problems brought by straw returning are water quality deterioration, crop diseases and insect pests aggravation, which inhibit the growth of crop at the seeding stage, seriously affecting the yield and quality of crop even though they are well irrigated accordingly [10,11,12,13]. On the other hand, straw returning induces greater levels of nitrous oxide (N2O), carbon dioxide (CO2) and methane (CH4), which accelerate the process of global warming [14,15,16].
The rice-wheat rotation system is the most popular cropping system in southeast China. In this region, wheat straw is often incorporated into paddy field using plowing or no tillage [17,18]. After straw returning, the field will experience a period of soaking. Water quality deterioration occurred on the paddy field surface water during the steeping field stage. The nitrogen, phosphorus and organic material produced by straw decomposition will diffuse with water flow. Excessive phosphorus and nitrogen may lead to water eutrophication, which is the main reason of non-point source pollution in paddy fields [19,20,21].
Biochar is an adsorption material, which is made by pyrolysis of biomass in low-oxygen, high-temperature environments [22]. The physicochemical properties of biochar are very stable, due to the highly aromatic structure with excellent physicochemical and thermal stability properties. It can be stored in the natural environment for a long time without being mineralized [23]. The large porous structure and specific surface area of biochar make it have a good adsorption effect on non-point source pollutants such as nitrogen, phosphorus and organic material [24,25,26,27,28]. For examples, Xu and Elzobair found that biochar application could not only improve the metabolic patterns of microbial communities, but also accelerate the utilization of soil organic material, and could increase the diversity of soil microbial community [29,30]. Beck indicated that the adding of biochar could make it have a good absorption effect on pollutants such as nitrogen and phosphorus, which could reduce these materials of loss in the soil [31]. Yu and Odlare found that biochar addition could not only improve the pH of paddy water, but also significantly promote the nitrification and inhibit denitrification [32,33].
However, it is uncertain whether the crop straw mixed with biochar can be returned to paddy fields to further improve the water quality of straw returning during the steeping field stage. Therefore, this paper focuses on the water environment in paddy fields, and returns straw and biochar to investigate the effect of straw returning to water quality under flooded conditions. The objectives of this research were to improve the water quality deterioration caused by straw returning, and provide theoretical guidance for solving the water pollution problem of paddy fields.

2. Materials and Methods

2.1. Site Description

The experiment was carried out in the water-saving park facility agriculture and environment test field of Hohai University, located in Jiangsu province, China (31°54′ N, 118°46′ E). This region is characterized by a subtropical monsoon climate with an average annual evaporation of 900 mm and an average frost-free period of 224 days. The minimal, maximal and mean annual temperatures are −13.1 °C, 39.7 °C and 15.4 °C, respectively. The mean annual precipitation is 1106 mm, which is unevenly distributed throughout the year. Most of the rainfall is in May to September, and the precipitation during this period accounts for more than 60% of the annual precipitation.

2.2. Experimental Materials

The straw used in the experiment was wheat straw, which was collected from the water-saving park facility agriculture and environment test field of Hohai University. The straw was air-dried and chopped to approximately 3–5 cm length. The common physicochemical properties are as follows: total N 3.80 g/kg; total P 0.66 g/kg; and total K 2.07 g/kg.
The soil used in the experiment was also collected from the cultivated layer soil in the water-saving park facility agriculture and environment test field of Hohai University. The soil was air-dried, and impurities were removed and sieved to 4 mm. The common physicochemical properties are as follows: total N 0.83 g/kg; total P 0.35 g/kg; available N 47.40 mg/kg; available P 10.37 mg/kg; and available K 90.00 mg/kg. The water used in the experiment was running water.
The biochar used in the experiment was produced by Henan Sanli New Energy Company, Henan province, China, and the source material was wheat straw. The pyrolysis carbonization temperature of the experimental biochar was 350–500 °C, with the common physicochemical properties of total N 3.29 g/kg, total P 6.30 g/kg and total K 19.20 g/kg.

2.3. Experimental Design and Samples Collection

The experiment had a randomized design with three replicates for all treatments. In the rice-wheat rotation district in Southeast China, the wheat straw returning to the field is about 7 t/hm2 and 20 t/hm2 biochar is better than other amount of biochar returning [34,35]. So, three treatments were designed for the experiment as follows (Table 1): (i): no wheat straw returning (CK); (ii): 7 t/hm2 straw returning (ST); (iii): 7 t/hm2 straw returning combined with 20 t/hm2 biochar (SC). Each plastic box had a dimension of 0.66 m long, 0.45 m wide and 0.35 m deep (Figure 1). The experimental soil is loaded into the box and trapped until the soil bulk density of 1.2 g·cm−3 was obtained, and each soil layer was leveled and roughed. The boxes were divided into three layers: 0.15 m soil layer to the bottom, straw and biochar were returned to the soil at 0–10 cm, and water layer, respectively. For ST treatment, the straw was mixed with the experimental soil at 7 t/hm2 in 0–10 cm soil layer. For SC treatment, the mixture of straw and biochar was evenly mixed with the 0–10 cm soil layer. The surface water depth under three treatments was maintained at 8 cm during the observation period. In addition, PVC pipes were inserted to a depth between 0 and 10 cm to collect 0–10 cm soil water.
The experiment was carried out during 14–29 July 2019. The water samples were taken five times during the experimental period. The first sampling was in the fourth day after straw returning, and the other samplings were collected every three days. The sampling was from 9:30 to 10:30 on the sampling day. The points of water samples were distributed in the surface water and 0−10 cm soil water, and sample points can be seen in Figure 1. For 0–10 cm soil water, the water sampling was sucked out from a PVC pipe with a syringe.

2.4. Samples Measurement and Data Statistical Analysis

The collected water samples were stored at 4 °C and transported back to the laboratory. Water samples were filtered through filter paper to measure total phosphorus (TP), ammonium nitrogen (NH4+-N), nitrate nitrogen (NO3-N) and potassium permanganate index (CODMn). The average value of the measured value as the analysis data. The TP concentration was analyzed with an ultraviolet spectrometer. The NH4+-N concentration was measured through Nessler’s reagent colorimetry. The NO3-N concentration was measured through ultraviolet spectroscopy, and the CODMn was measured by the Titration method. The standards we used to measure the NH4+-N, NO3-N, TP and CODMn are the national standard of the People’s Republic of China. Among them, the perchloric acid (HClO4) and hydrochloride (HCl) were both in excellent purity, with concentrations of 1.68 g/mL and 1.0 mol/L, respectively. The other reagents adopt analytical reagent that meet the national standard, and the water for measurement in the experiment was deionized water. Additionally, the concentration of TP, NH4+-N, NO3-N and CODMn in all treatments were the values after deducting the measured values of the blank samples. The statistical analysis of the experiment was completed by SPSS20.0 (SPSS, Chicago, IL, USA) and Excel 2016.

3. Results

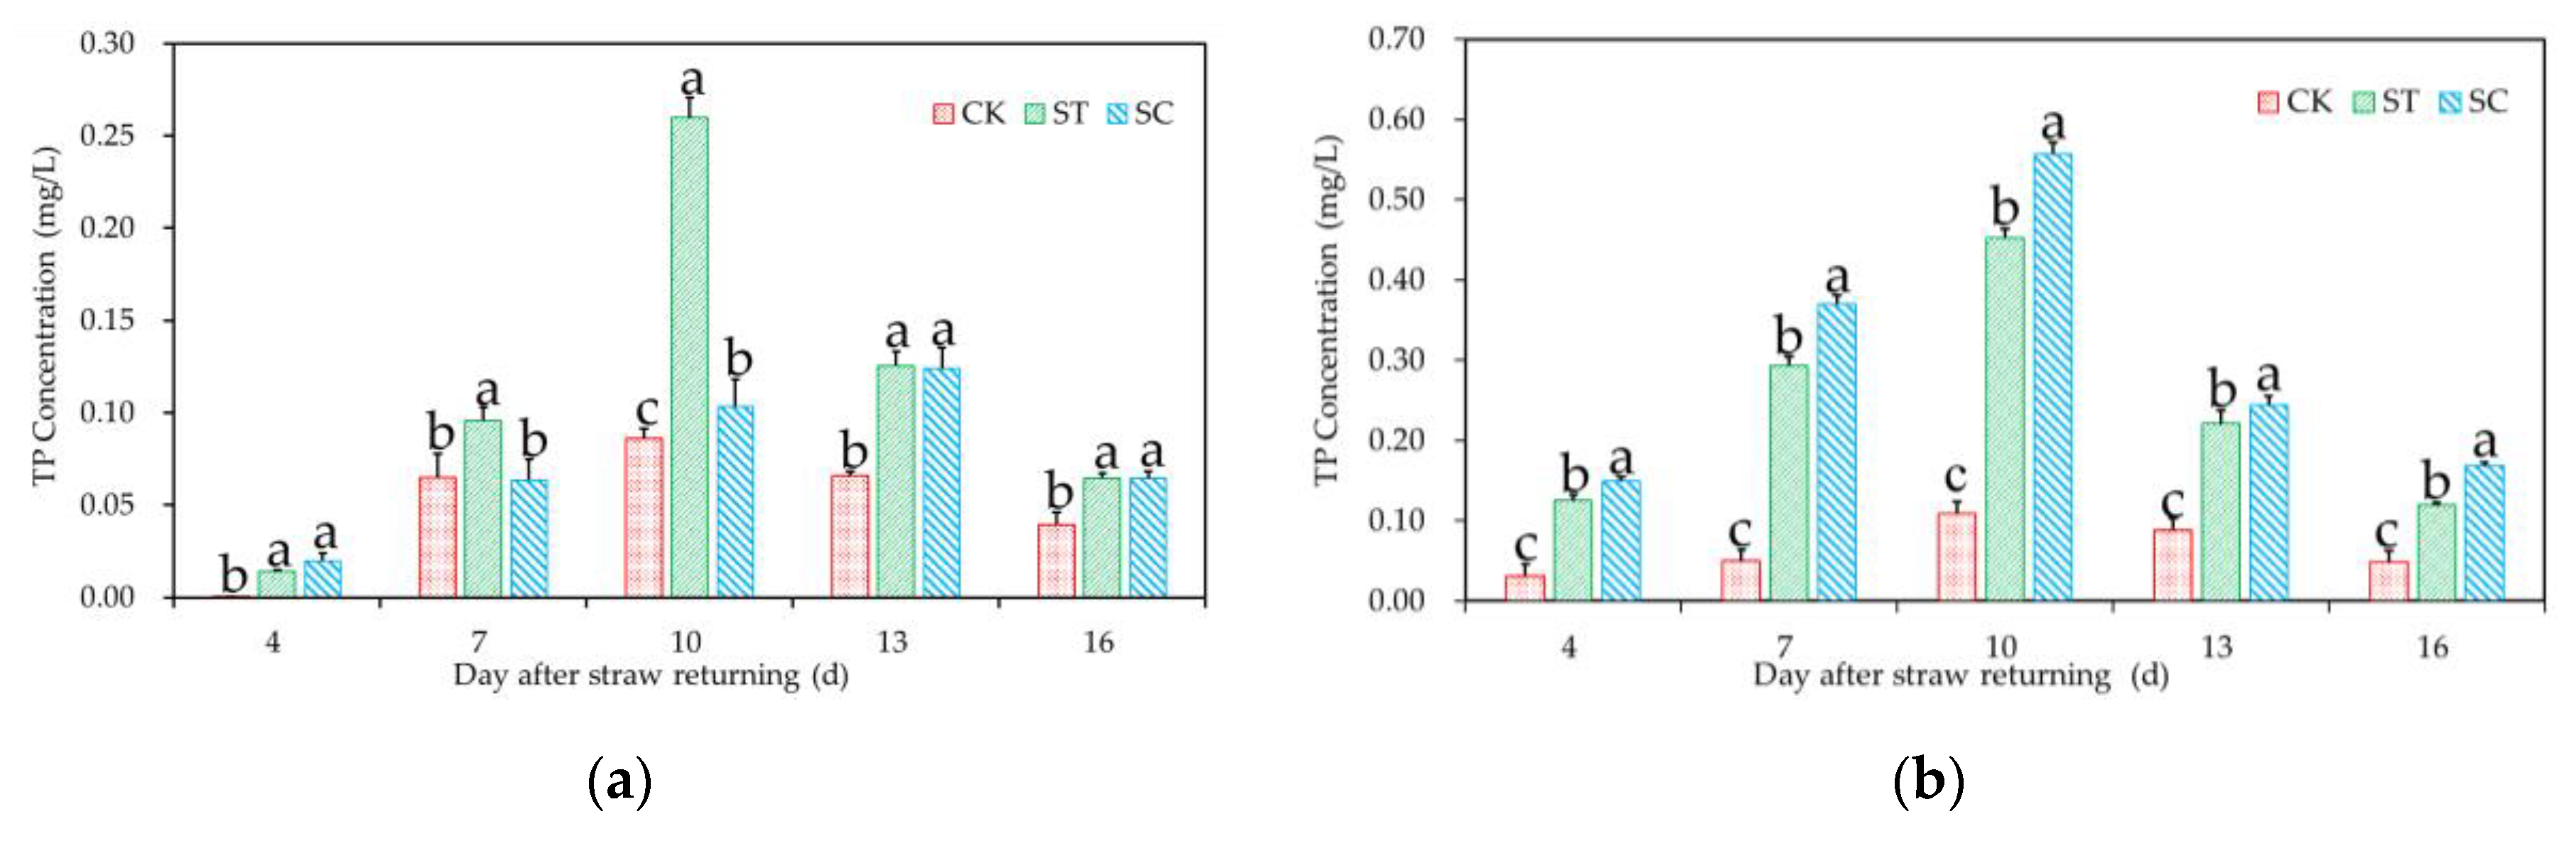
3.1. Dynamic Changes of Total Phosphorus (TP) Concentration

TP concentration at surface water and 0–10 cm soil water under different treatments are shown in Figure 2. Results show that TP concentration increased at the beginning after straw returning, and it then began to decrease at 10 to 16 days after straw returning. TP concentration was larger than the initial concentration at the end of the experiment, and there was more phosphorus under straw returning than no straw returning condition. The reason for this was that humic acid would release to the water when straw was decomposing, and the dissolution of soil phosphate would be promoted under humic acid conditions [36]. With the prolonged flooding time, the TP concentration in the water would increase to be large enough, and the release of phosphorus would be re-absorbed by the soil.
The TP concentration in surface water under different treatments was CST > CSC > CCK. The reason for this was that the straw would be decomposed under the action of microorganism and release phosphorus to the water environment [37]. TP concentration in surface water under straw returning combined with biochar was lower than under straw returning only, indicating that biochar can contribute to reduce the phosphorus concentration of surface water. The peak values of TP concentration in surface water under ST and CK treatments were observed in the 10th day after straw returning, which were 0.260 mg/L and 0.086 mg/L, respectively. Meanwhile, the peak value of TP concentration under SC treatment was observed on the 13th day, with a decrease of 52.29% compared to ST treatment. The TP concentration of soil water under 0–10 cm showed a significant difference compared to in the surface water. Among these, the TP concentration of 0–10 cm soil water was higher than surface water (Figure 2b). The highest TP concentration was observed at 0.5569 mg/L under SC treatment, which was 23.02% higher than that under ST treatment. Additionally, there were substantial differences of TP concentration difference between the surface water and 0–10 cm under SC treatment compared to the other two treatments. The maximal TP concentration difference reached 0.454 mg/L. The main reason was that the porous structure and large specific surface area of biochar make it become a carrier of pollutants [38], which benefits the enrichment of phosphorus. When the wheat straw was decomposed, most of the generated phosphorus material will be adsorbed by biochar, and the TP in surface water was decreased. In addition, biochar addition increased soil pH [32,39], which would inhibit the solubility of soil phosphate to a certain extent [31]. Therefore, TP concentration in surface water under SC treatment was lower than that in ST treatment.

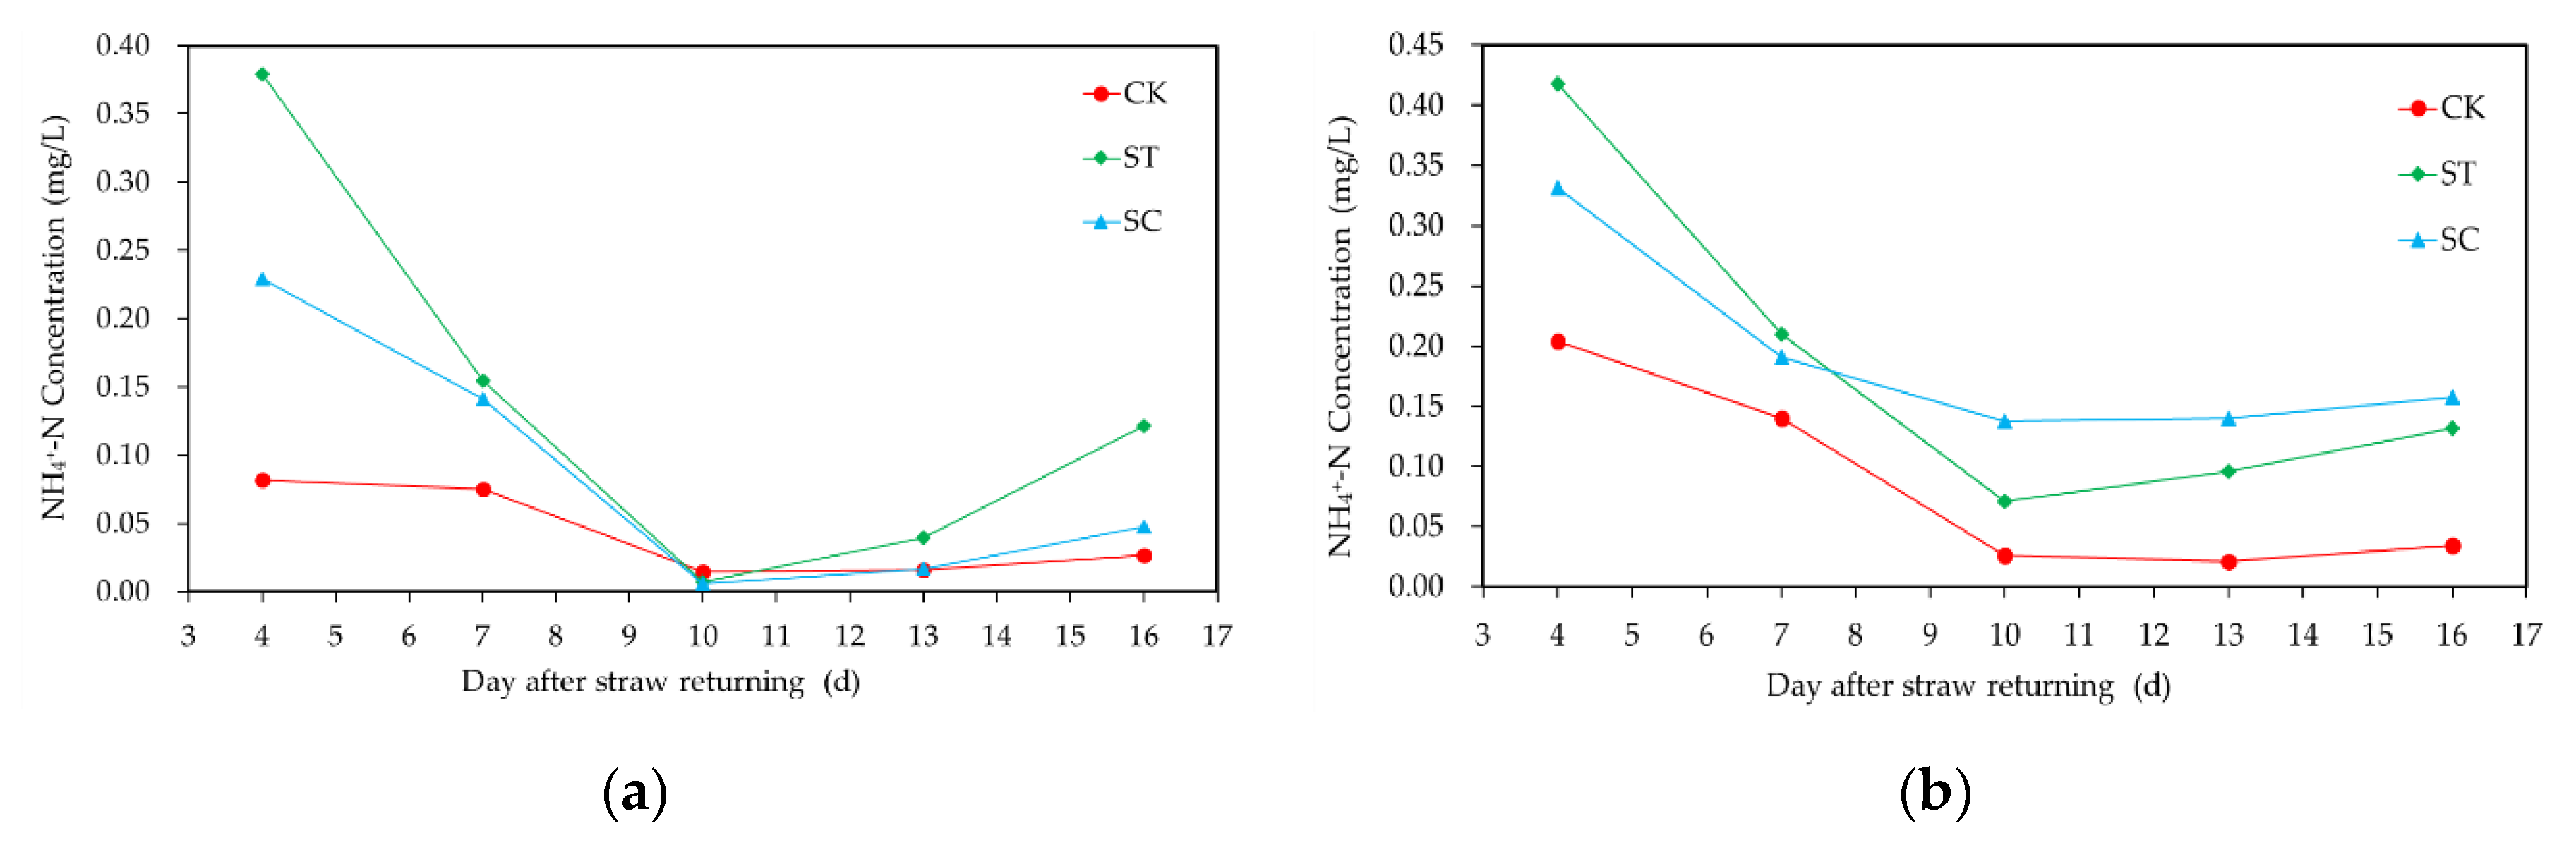
3.2. Dynamic Changes of Ammonium Nitrogen (NH4+-N) Concentration

Figure 3 shows the NH4+-N concentration at surface water and 0–10 cm soil water under different treatments. Results show that NH4+-N concentration decreased rapidly due to ammonia volatilization, microbial digestion and nitrogen infiltration during the first 10 days after straw returning [40,41]. With the consumption of oxygen, the content of dissolved oxygen in water decreased gradually, and the denitrification intensity was gradually stronger than the nitrification intensity. Under anaerobic condition, the denitrification produces N2O, N2 and a small amount of NH4+-N. Therefore, the NH4+-N concentration under the three treatments increased slowly after the 10th day of straw returning.
At the early stage of the experiment, the NH4+-N concentration in surface water and 0–10 cm soil water was CST > CSC > CCK, and the difference in three treatments decreased gradually. The NH4+-N concentration under all treatments appeared the minimum at the 7th to 13th day. The lowest concentration of surface water under CK, ST and SC were 0.015, 0.007 and 0.006 mg/L, respectively, while in 0–10 cm soil water it was 0.021, 0.071 and 0.138 mg/L, respectively. During this period, there was no discernable difference in NH4+-N concentration between surface water and 0–10 cm soil water under CK treatment, while the changes of NH4+-N concentration under ST and SC treatment were significantly different. For surface water, the NH4+-N concentration under ST treatment was always higher than that under SC treatment, while the increment of NH4+-N concentration under ST treatment was greater than that under SC treatment. For 0–10 cm soil water, the NH4+-N concentration under SC treatment was higher than that in ST treatment, and the difference between ST treatment and SC treatment was significant. After the 13th day of straw returning, the NH4+-N concentration in both surface water and 0–10 cm soil water under SC and ST treatments showed an obvious upward trend. The NH4+-N concentration in surface water under ST treatment was higher than that under SC treatment, while in 0–10 cm soil water it was the opposite to surface water.
NH4+-N concentration under SC treatment was lower than that in the ST treatment in the early stage of straw returning, as biochar could improve soil aeration [42]. The biochar properties promote the soil nitrification process and effectively inhibit denitrification, which is consistent with the findings of Zhao [43]. Due to contact with the atmosphere, the NH4+-N in surface water produced ammonia volatilization after the 7th day of the experimental period, which shows no discernable difference of the NH4+-N concentration in surface water under all treatments. Additionally, the addition of biochar could significant inhibited the diffusion of NH4+-N, and it appeared that the NH4+-N concentration in 0–10 cm soil water under SC treatment was greater than ST treatment at the middle-late times (Figure 3b).

3.3. Dynamic Changes of Nitrate Nitrogen (NO3-N) Concentration

NO3-N concentration at surface water and 0–10 cm soil water under different treatments are shown in Table 2. Results show that NO3-N concentration under SC and ST treatments were higher than under CK treatment, which indicated that straw returning would improve the content of NO3-N in surface water. The NO3-N concentration under ST and SC treatments showed a downward trend in the first seven days, and the lowest value appeared on the 7th day, with the value range from 1.587 to 6.870 mg/L, and an enhanced trend in the 7th to 13th days. The peak values of NO3-N were observed in the 13th day under all treatments. The maximal values of NO3-N concentration in the surface water were: CST > CSC, with 11.310 and 7.325 mg/L, respectively. The peak values under these two treatments were significantly different.
However, the peak value of NO3-N concentration in 0–10 cm soil water was different to surface water, with CSC > CST. The reason was that biochar had a strong ion absorption and exchange capacity, which inhibited the diffusion of NO3-N. The concentration showed a weakened trend after the 13th day of straw returning, mainly because the dissolved oxygen content was lower during this period, and the denitrification intensity was much stronger than the nitrification. Therefore, the NO3-N concentration decreased, while the NH4+-N concentration increased slowly. Additionally, for 0–10 cm soil water, the increment of NO3-N under SC treatment from 7 to 13 days was higher than that under ST treatment, and after the 13th day, the decrement was the greater in ST treatment compared to SC treatment. The reason might be that biochar could enhance the number of nitrogen-fixing microorganisms in the soil, and reduce the denitrification of nitrogen [43].

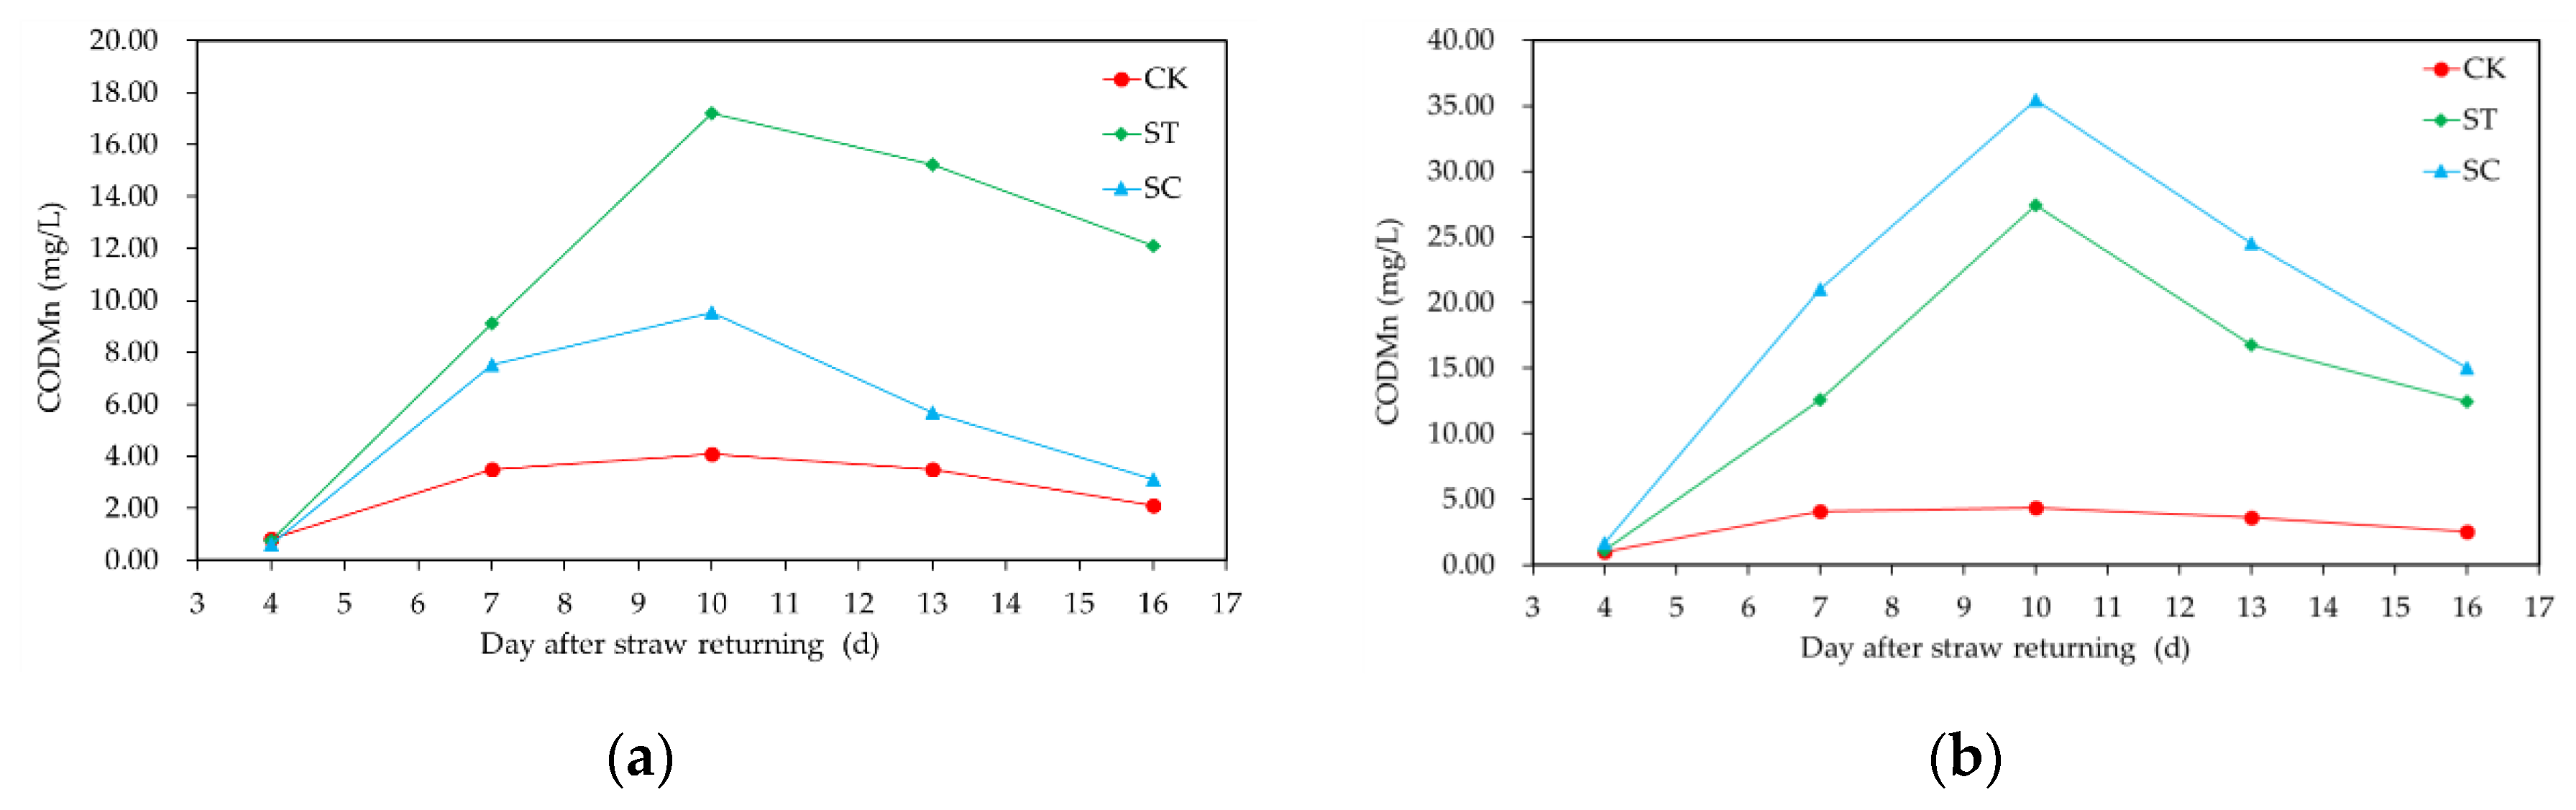
3.4. Change Characteristics of Potassium Permanganate Index (CODMn)

Figure 4 shows the CODMn at surface water and 0–10 cm soil water under different treatments. It can be seen from Figure 4 that the trend of CODMn changes under three treatments were similar, and showed an arched shape trend over time, which was also consistent with the results of Yang [44]. For CK treatment, the CODMn in both surface water and 0–10 cm soil water had no clear trend during the experimental period. However, the CODMn in 0–10 cm soil water under ST treatment was higher than that in surface water, with an increase of 2.89% to 59.32%. CODMn under SC treatment was consistent under ST treatment, and the 0–10 cm soil water was higher than in surface water, but the CODMn in 0–10 cm soil water under SC treatment was 2.76 to 4.84 times higher than in surface water, which was much greater than ST treatment.
For the surface water, the difference of CODMn among the three treatments was significant in different time, showing ST > SC > CK (Figure 4a), which indicated that CODMn content in surface water increased after straw returning. As the straw decomposed, the CODMn difference in surface water between the ST and SC treatment increased gradually. In the rising stage, the increment of CODMn in surface water under ST treatment was higher than that in SC treatment, while the decrement under ST treatment was lower than that in SC treatment in the declining stage. For the 0–10 cm soil water, the CODMn under ST and SC treatments was different to the surface water. The CODMn under SC treatment was always higher than that in ST treatment, and the peak value of CODMn in SC treatment was 35.46 mg/L, which is 29.48% higher than in ST treatment.
CODMn is an indicator of straw decomposition, and the product also provides the organic material and energy for microorganism. In the process of straw decomposition, the change of CODMn was related to the diversity of microbial community [45]. At the early stage of straw returning, the amount of microbial community was little, and the organic material produced by straw decomposition entered the water environment, which increased the amounts of organic materials in the field water. Therefore, the CODMn increased gradually. With the increase of nutriments, the microbial diversity gradually increased. When the consumption rate of organic materials is greater than the rate of straw decomposition, the CODMn of field water showed a downward trend on the 10th–16th day. Biochar has a strong absorption capacity for organic pollutants [46]. Compared to ST treatment, the addition of biochar could improve the fixation of the soil on organic pollutants and inhibit the diffusion of organic material to surface water [47]. It showed that the CODMn of 0–10 cm soil water under SC treatment was always higher than that in ST treatment during the observation period, and the surface water was lower than ST treatment.

4. Discussion

Water quality degradation is a common problem after straw returning in the south rice-wheat rotational district of China. The decomposition of straw would increase the content of nitrogen, phosphorus and organic material in paddy fields. These materials may lead to the risk of water pollution in paddy fields. In this study, the concentration of nitrogen, phosphorus and organic pollutants in both surface water and 0–10 cm soil water under straw returning increased significantly compared to no wheat straw returning.
After straw combined with biochar returning, the concentrations of nitrogen and phosphorus showed a significant difference compared to ST treatment. The addition of biochar decreased the concentration of nitrogen and phosphorus in surface water, while the nitrogen and phosphorus in the 0–10 cm soil water were significantly higher than those in ST treatment. The reason for this was that biochar has a stronger adsorption and fixation capacity for nitrogen and phosphorus, which inhibit the diffusion of nitrogen, phosphorus and other non-point source pollutants [31,45,48,49]. Additionally, biochar has a great impact on the microbial community and the biochemical reaction process, which promotes nitrification and inhibits denitrification. Biochar can also improve soil structure, which may reduce the diffusion of phosphorus [50].
The changes of CODMn in both surface water and 0–10 cm soil water were consistent with TP concentration, which showed an arched shape trend over time. The CODMn in surface water under SC treatment was lower than that under ST treatment, while the CODMn in 0–10 cm soil water was higher than that in ST treatment. The main reason was that the absorption property of biochar inhibits the diffusion of organic pollutants. In addition, Liu found that biochar could provide more suitable growth conditions for soil bacteria [51]. Therefore, it is also possible that biochar could provide available carbon sources and habitats to support the microorganism growth, which accelerates the propagation of microorganisms to improve the diversity of microbial community, which also accelerates the degradation of organic pollutants produced by straw decomposition [52,53].

5. Conclusions

Biochar has been widely used in the field of water purification. For paddy fields, nitrogen and phosphorus are easy to diffuse with water, which has an impact on water quality. These produced materials may also lead to non-point source pollution in paddy fields. Therefore, it is important to reduce the loss of nitrogen and phosphorus in paddy fields to reduce the risk of water pollution. In this paper, biochar and straw have been returned to explore the effect on the diffusion of nitrogen, phosphorous and organic material produced by straw decomposition. Conclusions are drawn as follows:
  • Straw returning can significantly increase the contents of nitrogen, phosphorous and organic material in field water. After straw returning, the nitrogen and phosphorus were all significantly higher under ST treatment than CK, and the peak values of NH4+-N, NO3-N, TP and CODMn all increased more than three times compared to CK treatment. There is a risk to causing water pollution in paddy fields.
  • Compared to ST treatment, after adding biochar, the contents of TP, NH4+-N, NO3-N and CODMn in surface water under SC treatment were reduced by 52.29%, 39.67%, 35.23% and 44.50%, respectively. While the content of TP, NO3-N and CODMn in 0–10 cm soil water under SC treatment is higher than that ST treatment, with increases of 23.02%, 15.87% and 29.48%, respectively. The NH4+-N concentration in SC treatment was 19.73% higher than ST treatment at the late observation period. It suggests that biochar has a good fixation effect on nitrogen, phosphorous and organic pollutants, and the addition of biochar can significantly reduce the content of surface source pollutants in the field.
  • Straw returning combined with biochar is an effective way to inhibit the diffusion of non-point source pollutants in soil water, and which could decrease the risk of water pollution caused by straw decomposition to some extent. The biochar can mix with straw returning to solve the water quality problem in paddy fields.

Author Contributions

Y.L., Y.A. and X.J. conceived and designed the experiments; H.L., Y.L. and Y.A. conducted the experiments; Y.L, K.L. and H.L. analyzed the data; and Y.L. and J.L. wrote the paper. All authors have read and agreed to the published version of the manuscript.

Funding

This work was funded by the Fundamental Research Funds for the Central Universities (grant No. 2019B06114) and Joint Open Research Fund Program of State key Laboratory of Hydroscience and Engineering and Tsinghua—Ningxia Yinchuan Joint Institute of Internet of Waters on Digital Water Governance (No. sklhse-2020-Iow02).

Acknowledgments

The authors thank Chuanmeng Shi, Yanchuan Pan and Weiyu Hu of Hohai University for their help and support during the experiment.

Conflicts of Interest

The authors declare no conflict of interest.

References

  1. Lal, R. World crop residues production and implications of its use as a biofuel. Environ. Int. 2005, 31, 575–584. [Google Scholar] [CrossRef] [PubMed]
  2. Christensen, B.T. Wheat and barley straw decomposition under field conditions: Effect of soil type and plant cover on weight loss, nitrogen and potassium content. Soil Boil. Biochem. 1985, 17, 691–697. [Google Scholar] [CrossRef]
  3. Devêvre, O.C.; Horwath, W.R. Decomposition of rice straw and microbial carbon use efficiency under different soil temperatures and moistures. Soil Boil. Biochem. 2000, 32, 1773–1785. [Google Scholar] [CrossRef]
  4. Yin, H.; Zhao, W.; Li, T.; Cheng, X.; Liu, Q. Balancing straw returning and chemical fertilizers in China: Role of straw nutrient resources. Renew. Sustain. Energy Rev. 2018, 81, 2695–2702. [Google Scholar] [CrossRef]
  5. Zhang, J.; Bo, G.; Zhang, Z.-F.; Wang, Y.; Shen, G.-M. Effects of Straw Incorporation on Soil Nutrients, Enzymes, and Aggregate Stability in Tobacco Fields of China. Sustainability 2016, 8, 710. [Google Scholar] [CrossRef] [Green Version]
  6. Li, Z.; Schneider, R.L.; Morreale, S.J.; Xie, Y.; Li, C.; Li, J. Woody organic amendments for retaining soil water, improving soil properties and enhancing plant growth in desertified soils of Ningxia, China. Geoderma 2018, 310, 143–152. [Google Scholar] [CrossRef]
  7. Yan, F.; Sun, Y.; Xu, H.; Yin, Y.; Wang, H.; Wang, C.; Guo, C.; Yang, Z.; Sun, Y.; Ma, J. Effects of wheat straw mulch application and nitrogen management on rice root growth, dry matter accumulation and rice quality in soils of different fertility. Paddy Water Environ. 2018, 16, 507–518. [Google Scholar] [CrossRef]
  8. Hu, N.; Wang, B.; Gu, Z.; Tao, B.; Zhang, Z.; Hu, S.; Zhu, L.; Meng, Y. Effects of different straw returning modes on greenhouse gas emissions and crop yields in a rice–wheat rotation system. Agric. Ecosyst. Environ. 2016, 223, 115–122. [Google Scholar] [CrossRef]
  9. Zhang, S.; Wang, Y.; Shen, Q. Influence of Straw Amendment on Soil Physicochemical Properties and Crop Yield on a Consecutive Mollisol Slope in Northeastern China. Water 2018, 10, 559. [Google Scholar] [CrossRef] [Green Version]
  10. Wang, X.D.; Shen, G.X.; Zhu, Y.; Qian, X.Y. Changes of Water Quality and Bacterial Number in Overlying Water during the Wheat-Straw Returning to Field. Adv. Mater. Res. 2013, 726, 43–46. [Google Scholar] [CrossRef]
  11. Du, K. Effects of Cultivation Practices on Rice Seedling Growth under Wheat Straw Returning; Nanjing Agricultural University: Nanjing, China, 2015. [Google Scholar]
  12. Kimber, R. Phytotoxicity from plant residues. I. The influence of rotted wheat straw on seedling growth. Aust. J. Agric. Res. 1967, 18, 361–374. [Google Scholar] [CrossRef]
  13. Gu, Z.; Qi, Z.M.; Burghate, R.; Yuan, S.Q.; Jiao, X.Y.; Xu, J.Z. Irrigation scheduling approaches and applications: A review. J. Irrig. Drain. E-ASCE. 2020, 146, 04020007. [Google Scholar] [CrossRef]
  14. Lu, F.; Wang, X.; Han, B.; Ouyang, Z.; Duan, X.; Zheng, H.; Miao, H. Soil carbon sequestrations by nitrogen fertilizer application, straw return and no-tillage in China’s cropland. Glob. Chang. Boil. 2009, 15, 281–305. [Google Scholar] [CrossRef]
  15. Xu, S.; Hou, P.; Xue, L.; Wang, S.; Yang, L. Treated domestic sewage irrigation significantly decreased the CH4, N2O and NH3 emissions from paddy fields with straw incorporation. Atmos. Environ. 2017, 169, 1–10. [Google Scholar] [CrossRef]
  16. Zhou, Y.; Zhang, Y.; Tian, D.; Mu, Y. The influence of straw returning on N2O emissions from a maize-wheat field in the North China Plain. Sci. Total. Environ. 2017, 584, 935–941. [Google Scholar] [CrossRef]
  17. Yao, Z.; Zheng, X.; Wang, R.; Xie, B.; Butterbach-Bahl, K.; Zhu, J. Nitrous oxide and methane fluxes from a rice–wheat crop rotation under wheat residue incorporation and no-tillage practices. Atmos. Environ. 2013, 79, 641–649. [Google Scholar] [CrossRef]
  18. Zhang, Z.; Guo, L.; Liu, T.; Li, C.; Cao, C. Effects of tillage practices and straw returning methods on greenhouse gas emissions and net ecosystem economic budget in rice–wheat cropping systems in central China. Atmos. Environ. 2015, 122, 636–644. [Google Scholar] [CrossRef]
  19. Tan, X.; Shao, D.; Liu, H.; Yang, F.; Xiao, C.; Yang, H. Effects of alternate wetting and drying irrigation on percolation and nitrogen leaching in paddy fields. Paddy Water Environ. 2012, 11, 381–395. [Google Scholar] [CrossRef]
  20. Wu, L.; Long, T.-Y.; Liu, X.; Ma, X.-Y. Modeling impacts of sediment delivery ratio and land management on adsorbed non-point source nitrogen and phosphorus load in a mountainous basin of the Three Gorges reservoir area, China. Environ. Earth Sci. 2013, 70, 1405–1422. [Google Scholar] [CrossRef]
  21. Li, J.; Li, H.; Shen, B.; Li, Y. Effect of non-point source pollution on water quality of the Weihe River. Int. J. Sediment Res. 2011, 26, 50–61. [Google Scholar] [CrossRef]
  22. Gaunt, J.L.; Lehmann, J. Energy Balance and Emissions Associated with Biochar Sequestration and Pyrolysis Bioenergy Production. Environ. Sci. Technol. 2008, 42, 4152–4158. [Google Scholar] [CrossRef] [PubMed]
  23. Liang, B.; Lehmann, J.; Solomon, D.; Kinyangi, J.; Grossman, J.M.; O’Neill, B.; Skjemstad, J.O.; Thies, J.; Luizão, F.J.; Petersen, J.; et al. Black Carbon Increases Cation Exchange Capacity in Soils. Soil Sci. Soc. Am. J. 2006, 70, 1719–1730. [Google Scholar] [CrossRef] [Green Version]
  24. Hollister, C.C.; Bisogni, J.J.; Lehmann, J. Ammonium, Nitrate, and Phosphate Sorption to and Solute Leaching from Biochars Prepared from Corn Stover (Zea mays L.) and Oak Wood (Quercus spp.). J. Environ. Qual. 2013, 42, 137–144. [Google Scholar] [CrossRef] [PubMed]
  25. Kookana, R.S. The role of biochar in modifying the environmental fate, bioavailability, and efficacy of pesticides in soils: A review. Soil Res. 2010, 48, 627–637. [Google Scholar] [CrossRef]
  26. Liu, Q.; Zheng, T.; Wang, P.; Jiang, J.-P.; Li, N. Adsorption isotherm, kinetic and mechanism studies of some substituted phenols on activated carbon fibers. Chem. Eng. J. 2010, 157, 348–356. [Google Scholar] [CrossRef]
  27. Jun, B.-M.; Kim, Y.; Han, J.; Yoon, Y.; Kim, J.; Park, C.M. Preparation of Activated Biochar-Supported Magnetite Composite for Adsorption of Polychlorinated Phenols from Aqueous Solutions. Water 2019, 11, 1899. [Google Scholar] [CrossRef] [Green Version]
  28. Dang, T.; Marschner, P.; Fitzpatrick, R.; Mosley, L. Assessment of the Binding of Protons, Al and Fe to Biochar at Different pH Values and Soluble Metal Concentrations. Water 2018, 10, 55. [Google Scholar] [CrossRef] [Green Version]
  29. Xu, W.; Wang, G.; Deng, F.; Zou, X.; Ruan, H.; Chen, H.Y.H. Responses of soil microbial biomass, diversity and metabolic activity to biochar applications in managed poplar plantations on reclaimed coastal saline soil. Soil Use Manag. 2018, 34, 597–605. [Google Scholar] [CrossRef]
  30. Elzobair, K.A.; Stromberger, M.E.; Ippolito, J.; Lentz, R.D. Contrasting effects of biochar versus manure on soil microbial communities and enzyme activities in an Aridisol. Chemosphere 2016, 142, 145–152. [Google Scholar] [CrossRef]
  31. Beck, D.A.; Johnson, G.R.; Spolek, G.A. Amending greenroof soil with biochar to affect runoff water quantity and quality. Environ. Pollut. 2011, 159, 2111–2118. [Google Scholar] [CrossRef]
  32. Yu, Y.; Odindo, A.; Xue, L.; Yang, L. Influences of biochar addition on vegetable soil nitrogen balance and pH buffering capacity. In Proceedings of the IOP Conference Series: Earth and Environmental Science, 2nd International Conference on Agricultural and Biological Sciences, Shanghai, China, 28 September 2016; Volume 41, p. 012029. [Google Scholar]
  33. Odlare, M.; Pell, M. Effect of wood fly ash and compost on nitrification and denitrification in agricultural soil. Appl. Energy 2009, 86, 74–80. [Google Scholar] [CrossRef]
  34. Gao, D.C.; Zhang, L.; Liu, Q.; Rong, X.M.; Zhang, Y.P.; Tian, C. Effects of biochar on CO2, CH4, N2O emission and its environmental benefits in dryland soil. Acta Ecol. Sin. 2015, 35, 3615–3624. [Google Scholar] [CrossRef] [Green Version]
  35. Qin, X.B.; Li, Y.E.; Wang, H.; Li, J.L.; Wan, Y.F.; Li, Y.; Liao, Y.L.; Fan, M.R.; Zhu, J.M.; Gao, Q.Z.; et al. Impact of biochar amendment on carbon emissions intensity in double rice field in south China. Trans. CSAE 2015, 31, 226–234. (In Chinese) [Google Scholar]
  36. Xiong, X.; Li, Y.; Yang, M.; Zhang, F.; Li, W. Increase in complexation ability of humic acids with the addition of ligneous bulking agents during sewage sludge composting. Bioresour. Technol. 2010, 101, 9650–9653. [Google Scholar] [CrossRef]
  37. Villegas-Pangga, G.; Blair, G.; Lefroy, R. Measurement of decomposition and associated nutrient release from straw (Oryza sativa L.) of different rice varieties using a perfusion system. Plant Soil 2000, 223, 1–11. [Google Scholar] [CrossRef]
  38. Wang, D.; Fonte, S.J.; Parikh, S.J.; Six, J.; Scow, K.M. Biochar additions can enhance soil structure and the physical stabilization of C in aggregates. Geoderma 2017, 303, 110–117. [Google Scholar] [CrossRef] [Green Version]
  39. Shi, R.-Y.; Li, J.-Y.; Jiang, J.; Kamran, M.A.; Xu, R.-K.; Qian, W. Incorporation of corn straw biochar inhibited the re-acidification of four acidic soils derived from different parent materials. Environ. Sci. Pollut. Res. 2018, 25, 9662–9672. [Google Scholar] [CrossRef]
  40. Chen, A.; Lei, B.; Hu, W.; Lu, Y.; Mao, Y.; Duan, Z.; Shi, Z. Characteristics of ammonia volatilization on rice grown under different nitrogen application rates and its quantitative predictions in Erhai Lake Watershed, China. Nutr. Cycl. Agroecosyst. 2014, 101, 139–152. [Google Scholar] [CrossRef]
  41. Reddy, K.R.; Patrick, W.H. Effect of Placement and Concentration of Applied Nh4+-N on Nitrogen Loss from Flooded Soil. Soil Sci. 1977, 123, 142–148. [Google Scholar] [CrossRef]
  42. Case, S.D.C.; Mcnamara, N.P.; Reay, D.S.; Whitaker, J. The effect of biochar addition on N2O and CO2 emissions from a sandy loam soil—The role of soil aeration. Soil. Biol. Biochem. 2012, 51, 125–134. [Google Scholar] [CrossRef]
  43. Zhao, X.; Wang, S.; Xing, G. Nitrification, acidification, and nitrogen leaching from subtropical cropland soils as affected by rice straw-based biochar: Laboratory incubation and column leaching studies. J. Soils Sediments 2013, 14, 471–482. [Google Scholar] [CrossRef]
  44. Yang, Z.M.; Chen, Y.C.; Zhang, Y.; Li, P.; Chen, Q.H. Releasing characteristics of nonpoint source pollutants from straws under submerging condition. Acta Ecol. Sin. 2012, 32, 1854–1860. [Google Scholar] [CrossRef]
  45. Zhang, X.; Wang, H.; He, L.; Lu, K.; Sarmah, A.; Li, J.; Bolan, N.S.; Pei, J.; Huang, H. Using biochar for remediation of soils contaminated with heavy metals and organic pollutants. Environ. Sci. Pollut. Res. 2013, 20, 8472–8483. [Google Scholar] [CrossRef] [PubMed]
  46. Powlson, D.; Prookes, P.; Christensen, B. Measurement of soil microbial biomass provides an early indication of changes in total soil organic matter due to straw incorporation. Soil Boil. Biochem. 1987, 19, 159–164. [Google Scholar] [CrossRef]
  47. Kizito, S.; Lv, T.; Wu, S.; Ajmal, Z.; Luo, H.; Dong, R. Treatment of anaerobic digested effluent in biochar-packed vertical flow constructed wetland columns: Role of media and tidal operation. Sci. Total. Environ. 2017, 592, 197–205. [Google Scholar] [CrossRef]
  48. Rens, H.; Bera, T.; Alva, A.K. Effects of Biochar and Biosolid on Adsorption of Nitrogen, Phosphorus, and Potassium in Two Soils. Water Air Soil Pollut. 2018, 229, 281. [Google Scholar] [CrossRef]
  49. Steiner, C.; Das, K.; Melear, N.; Lakly, D. Reducing Nitrogen Loss during Poultry Litter Composting Using Biochar. J. Environ. Qual. 2010, 39, 1236–1242. [Google Scholar] [CrossRef] [Green Version]
  50. Soinne, H.; Hovi, J.; Tammeorg, P.; Turtola, E. Effect of biochar on phosphorus sorption and clay soil aggregate stability. Geoderma 2014, 219, 162–167. [Google Scholar] [CrossRef]
  51. Liu, S.; Meng, J.; Jiang, L.; Yang, X.; Lan, Y.; Cheng, X.; Chen, W. Rice husk biochar impacts soil phosphorous availability, phosphatase activities and bacterial community characteristics in three different soil types. Appl. Soil Ecol. 2017, 116, 12–22. [Google Scholar] [CrossRef]
  52. Quilliam, R.S.; Glanville, H.C.; Wade, S.C.; Jones, D.L. Life in the ‘charosphere’—Does biochar in agricultural soil provide a significant habitat for microorganisms? Soil. Biol. Biochem. 2013, 65, 287–293. [Google Scholar] [CrossRef]
  53. Lehmann, J.; Rillig, M.C.; Thies, J.; Masiello, C.A.; Hockaday, W.C.; Crowley, D. Biochar effects on soil biota—A review. Soil. Biol. Biochem. 2011, 43, 1812–1836. [Google Scholar] [CrossRef]
Figure 1. A schematic diagram for the experiment treatments: (a) No wheat straw returning (CK); (b) Wheat straw returning (ST); and (c) Both wheat straw and biochar returning. Point1, point2 and point3 represent the 0–10 cm soil water sampling point, which is repeated three times.
Water 12 01633 g001
Figure 2. Concentration of total phosphorus (TP) in field water at different times. (a) Surface water. (b) 0–10 cm soil water. Note: Values followed by the same letter within the same treatment are not significantly different based on the LSD multiple range test (p ≤ 0.05). The letters a, b, c represents 5% significant level. The same letter of two data indicates that there is no significant difference between them. While different letters indicate that there is significant difference between them.
Water 12 01633 g002
Figure 3. Characteristics of NH4+-N concentration in field water with different treatments: (a) surface water; and (b) 0–10 cm soil water.
Water 12 01633 g003
Figure 4. Characteristics of CODMn under flood conditions with different treatments: (a) surface water; and (b) 0–10 cm soil water.
Water 12 01633 g004
Table 1. Test design.
Series NumberTreatment Repetitive Treatment
CKNo wheat straw returningabc
STWheat straw of 7 t/hm2 abc
SCWheat straw of 7 t/hm2 and biochar of 20 t/hm2abc
Table 2. NO3-N concentration of different treatments.
Sampling PointTreatmentDay after Straw Returning/day
47101316
Surface waterCK1.067 b,11.253 a3.287 b3.535 c1.621 c
ST3.823 a1.728 a4.744 a11.310 a7.160 a
SC3.512 a1.587 a4.136 a7.325 b2.900 b
0–10 cm soil waterCK5.529 b1.815 b3.093 b3.550 b2.881 c
ST12.025 a6.295 a12.045 a12.080 a8.646 b
SC12.528 a6.870 a13.150 a13.997 a12.146 a
1 Note: Values followed by the same letter within the same rows (lowercase letter) are not significantly different based on the LSD multiple range test (p ≤ 0.05). The letters a, b, c represents 5% significant level. The same letter of two data indicates that there is no significant difference between them. While different letters indicate that there is significant difference between them.

