Article

The Costs of Sea-Level Rise: Coastal Adaptation Investments vs. Inaction in Iberian Coastal Cities

1
BC3 Basque Centre for Climate Change, Sede Building 1, 1st floor, Scientific Campus of the University of the Basque Country, 48940 Leioa, Spain
2
Grantham Research Institute, London School of Economics and Political Science (LSE), London WC2A 2AZ, UK
*
Author to whom correspondence should be addressed.
Water 2020, 12(4), 1220; https://doi.org/10.3390/w12041220
Submission received: 3 March 2020 / Revised: 16 April 2020 / Accepted: 21 April 2020 / Published: 24 April 2020
(This article belongs to the Special Issue Relative Sea-Level Changes and their Impact on Coastal Zones)

Abstract

:
Iberian coastal cities are subject to significant risks in the next decades due to climate change-induced sea-level rise. These risks are quite uncertain depending on several factors. In this article, we estimate potential economic damage in 62 Iberian coastal cities from 2020 to 2100 using regional relative sea-level rise data under three representative concentration pathways (RCP 8.5, RCP 4.5 and RCP 2.6). We analyze the expected accumulated damage costs if no adaptation actions take place and compare this scenario to the investment cost of some adaptation strategies being implemented. The results show that some adaptation strategies are less costly than the potential damage under inaction. In other words, it is economically rational to invest in adaptation even in a context of high uncertainty. These calculations are very relevant to inform climate change adaptation decisions and to better manage the risk posed by sea-level rise. Moreover, our findings show the importance of a good understanding of the shape of the sea-level rise and damage cost distributions to calculate the expected damage. We show that using the 50th percentile for these calculations is not adequate as it leads to a serious underestimation of expected damage and coastal risk.

1. Introduction

Sea-level rise is one of the main consequences of anthropogenic climate change [1]. Sea level worldwide was stable from approximately 7000 years before present until the end of the 19th century, but since then the geological and tide gauge record presents signs of acceleration [2]. During the 20th century, a significant acceleration of sea-level rise has occurred, quantified at about 1.2 mm per year from 1901 to 1990 [3,4]. The same analysis applied to the period 1993–2010 revealed a much larger acceleration, of about three millimetres per year [4]. Other calculations [5] show an increasing sea-level rise since 2010 of up to 4.4 ± 0.5 mm yr−1, so since the 1880s, the global sea level has increased more than 20 cm and continues rising at more than 4 mm yr−1 [6]. Nonetheless, sea-level rise can vary significantly in magnitude and rate of change regionally and these differences can be of up to four times larger in some areas [7].
The global sea-level rise projections by the Intergovernmental Panel for Climate Change (IPCC) [1], as well as the regionalized assessments for each emission scenario (representative concentration pathways, RCP), foresee an acceleration in sea-level rise over the course of the present century [8,9,10,11]. Sea-level rise will accelerate in the future and over the next centuries even if emissions stabilize [12]. The magnitude of change, however, remains uncertain because it depends on the ambition of mitigation efforts, as well as the location and the time considered. Let us illustrate this point: if the global average temperature is stabilized at 2 °C above preindustrial levels, by 2100 global sea-level rise could reach 26 cm at the median of the distribution and 81 cm at the 95th percentile. In a high emission scenario in which global temperatures could reach +5 °C, sea-level rise could reach 51 cm and 178 cm at the median and 95th percentile, respectively. Moreover, sea level could even exceed 2 m in 2100 (95th percentile) if thermal expansion and the contribution of major ice sheets are accounted for [13].
Sea-level rise will also lead to more frequent coastal flooding. The latest global estimations show that, by 2100, extreme sea level events that have occurred once every century are expected to take place annually under all emission scenarios considered [14]. The combination of sea-level rise and extreme events represents a growing risk to coastal areas around the world. In Europe, one-third of the population resides in a 50 km strip of the coast, where many ecosystems, assets and infrastructures are located [15]. Therefore, even if during the 20th century, socioeconomic factors have been the main cause of increased exposure and vulnerability in coastal areas, climate change is expected to aggravate this situation in the future [16].
These changes in sea level and the frequency and magnitude of extreme events may cause severe economic impacts. With no additional investments in adaptation, global damage due to coastal flooding could reach between 93,000 and 961,000 million euros, and the number of people affected would rise to 1.5–3.65 million by 2100, considering three climatic and socio-economic scenario combinations (RCP 4.5-SSP1, RCP 8.5-SSP3 and RCP 8.5-SSP5) [17]. In Europe, coastal flooding and erosion by 2050 could have a cost of between 6500 and 40,000 million euros per year for RCP4.5 and RCP 8.5, respectively, combined with the SSP5 socio-economic development scenario [15]. The same study estimated for the same scenarios that the number of people affected could vary between 460,000 and 740,000 annually. Nonetheless, the differences between RCPs is small until mid-century, when sea-level rise scenarios start to diverge. This situation could lead to a current underestimation of coastal risk and a delay in the definition and implementation of adaptation measures [18].
Just as for future sea-level rise, economic impacts (and adaptation investment costs) depend on the emission scenario, the time considered and location [19]. The use of mean values or probable ranges in the assessments of the impacts of climate change is very frequent, but due to the existing uncertainty, several authors have insisted on the importance of considering the full distribution of probabilities and especially paying attention to the upper tail of the distribution, i.e., the most negative impacts [20,21,22]. These types of risk approaches that analyse situations of low probability but great impact are not new in disciplines such as financial or energy economics and allow for more informed risk management as well as more risk-averse approaches.
In recent years, these approaches have proved very useful for the analysis of climate change impacts. For example, financial risk measures, despite their complex modelling, can support decision-making with regards to climate change adaptation as they offer a more comprehensive picture of the risks faced. These risk measures can be used to assess the risk of low probability situations whose impacts may have catastrophic consequences [23], to assess the suitability of an investment plan [24] or to perform stress testing for urban planning, adaptation measures, large investments or infrastructure plans [25].
In this study, we aim at determining the costs of adaptation inaction in 62 Iberian coastal cities in the context of sea-level rise and increased climate risks. We define the cost of inaction as the damage due to climate change in the lack of additional adaptation measures. In order to do so, we compare adaptation investment costs with expected damage due to sea-level rise under three scenarios (RCP8.5, RCP 4.5 and RCP 2.6). These estimations are first obtained annually, and in a second step, we calculate accumulated costs in 2030, 2050 and 2100. These accumulated costs of adaptation inaction are then compared to the costs of adaptation investment under different adaptation strategies. This work contributes to the literature by, first, calculating the full distribution of sea-level rise and, second, combining the percentiles of sea-level rise distributions [9] with deterministic damage curves for a large number of European coastal cities [19]. This allows the full distribution of economic damage (or costs) to be estimated.
The rest of the paper is organised as follows: Section 2 presents a summary of the foreseen impacts of sea-level rise in the Iberian coastal areas. Section 3 describes the methods used; the results are presented in Section 4, and the overall discussion is included in Section 5.

2. The Impacts of and Adaptation to Sea-Level Rise in the Iberian Peninsula

Coastal risks have increased in the Iberian Peninsula during the last decades. The urban development model and the overexploitation of some resources have put enormous pressure on these coastal areas, causing biodiversity loss and environmental degradation, while increasing their exposure and vulnerability to climatic events [26]. In some areas of the Basque Coast, habitat and ecosystem destruction induced by sea-level rise could generate losses of up to 2.3 million euros per hectare [27]. The increase in flood exposure in certain areas of the Spanish Mediterranean coast (Murcia and Alicante) has been directly linked to two urban development peaks, between 1978–1982 and 1997–2007 [28]. In fact, the Spanish Mediterranean coast has high or very high vulnerability and exposure values, compared to other areas of the Mediterranean subject to larger hazards. This situation repeats, however, in other densely populated areas such as the French southwest coast and the north Adriatic coast [29].
Assuming that the trend of rising sea levels continues during the first half of the century, flood-risk could increase by 2040 by 8% in the Atlantic and Cantabrian coasts of Spain and the Alboran Sea, 6% in the Canary Islands and between 2% and 3% in the rest of the Mediterranean coast and the Gulf of Cádiz [30]. In some locations, the frequency and intensity of extreme events are expected to increase in the future. For example, in the city of Bilbao, located on the Cantabrian coast, the intensity, measured as the change in the flood level, could increase from 3.85 m in 2010 to 4 m in 2040, and its frequency will increase from once every 50 years (2010) to once every 15 years in 2040 [30]. In Barcelona, however, changes in intensity are not expected and the increase in frequency is expected to be smaller: the return period could vary from once every 50 to once in 40 years [30,31].
In Portugal, sea-level rise and changes in storminess are expected to cause higher coastal flooding and erosion, among other impacts such as coastal wetland inundation and retreat, and have been identified as one of the most important consequences of climate change [32,33]. The coast north of Lisbon and the Algarve were identified as the areas most at risk [32]. Recent studies have addressed these areas of the Portuguese coast in further detail, identifying the areas of Aveiro [34], south of Porto, and the Algarve as hotspots for coastal inundation and erosion [35,36]. Moreover, it has been estimated that 900 km2 of the Portuguese coast could be subject to flood risk in 2050, considering 50 year return period extreme events and empirical sea-level rise projections. At the end of the century, the areas at risk of coastal flooding could increase by 27%, where Lisbon, Faro and Aveiro are the districts most at risk [37,38].
With regards to coastal protection and adaptation to climate change, Spain was already among those countries in Europe with a larger expenditure in the period between 1998 and 2015 [39]. Projections to 2040 estimate that the population exposed to permanent flooding on the Cantabrian coast could reach 2–3%. If extreme events are also incorporated, the exposed population could range between 4% and 9%. As for the economic impact, at the end of the century, permanent flood damage in the Bay of Biscay could reach between 1 billion euros (0.1% of regional GDP(2008)) under RCP 4.5 and 8 billion euros (0.6% of regional GDP(2008)) under a high-end sea-level rise scenario. Direct average damage could double if extreme weather events are considered [30].

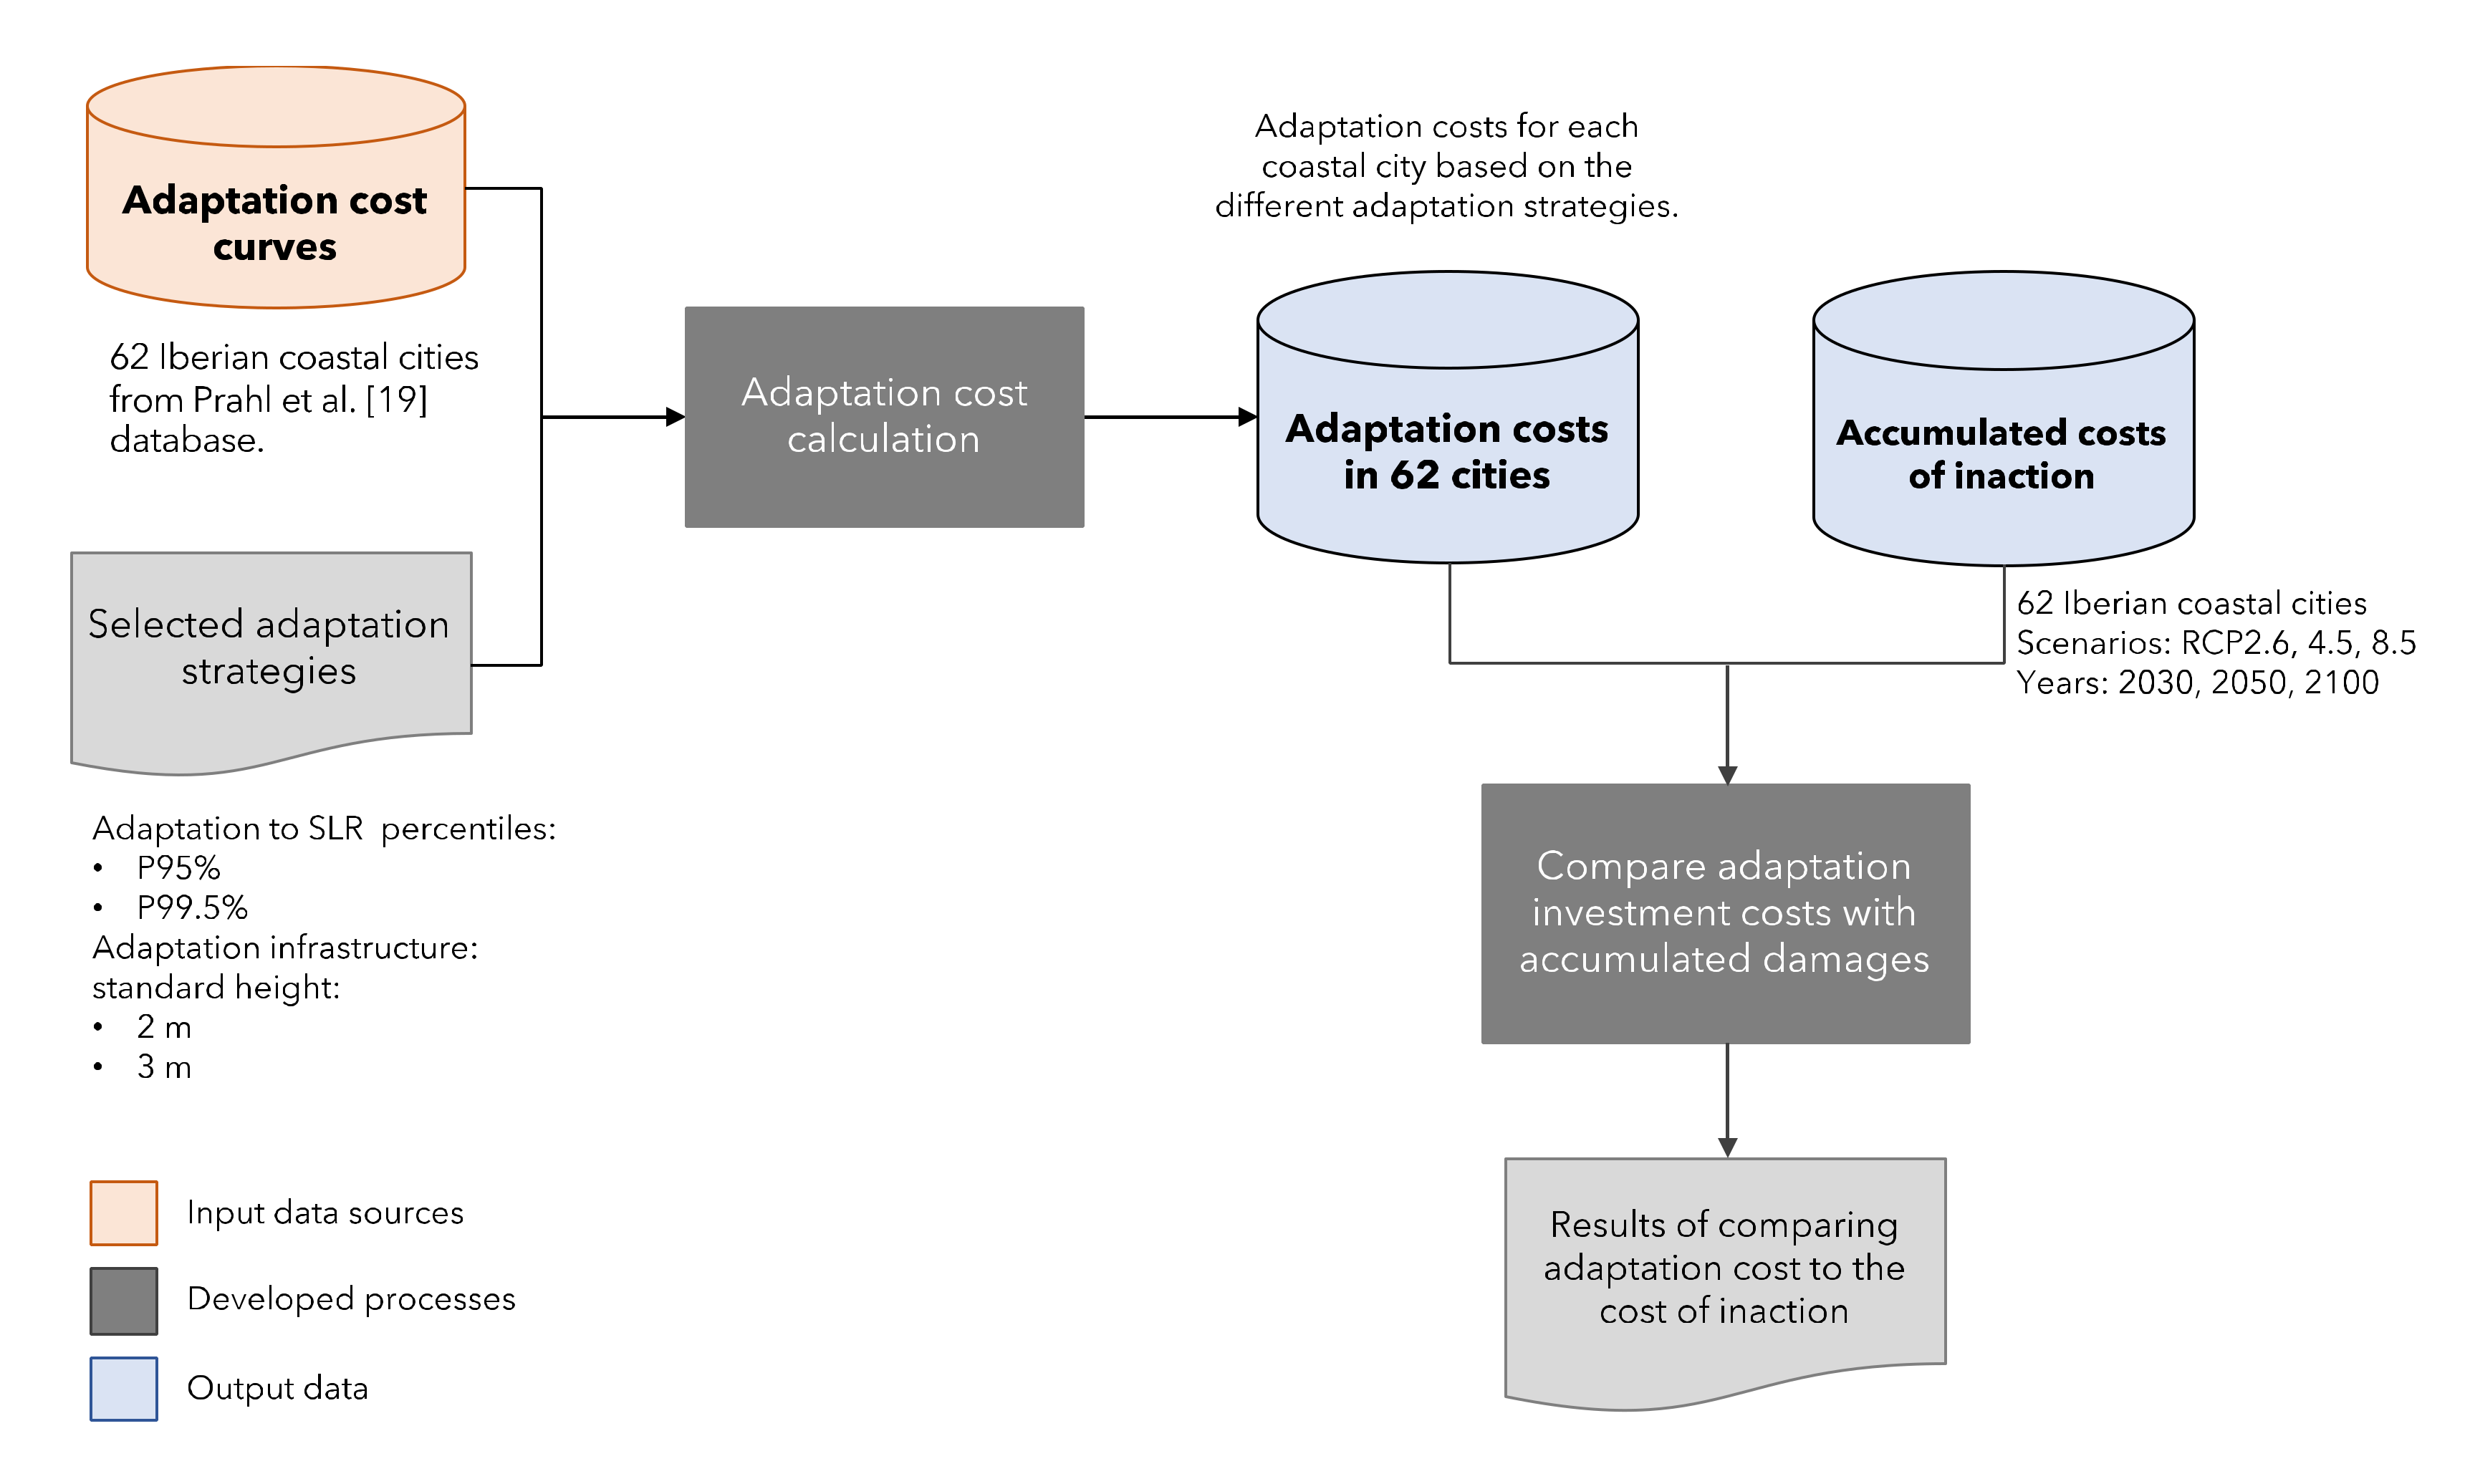
3. Materials and Methods

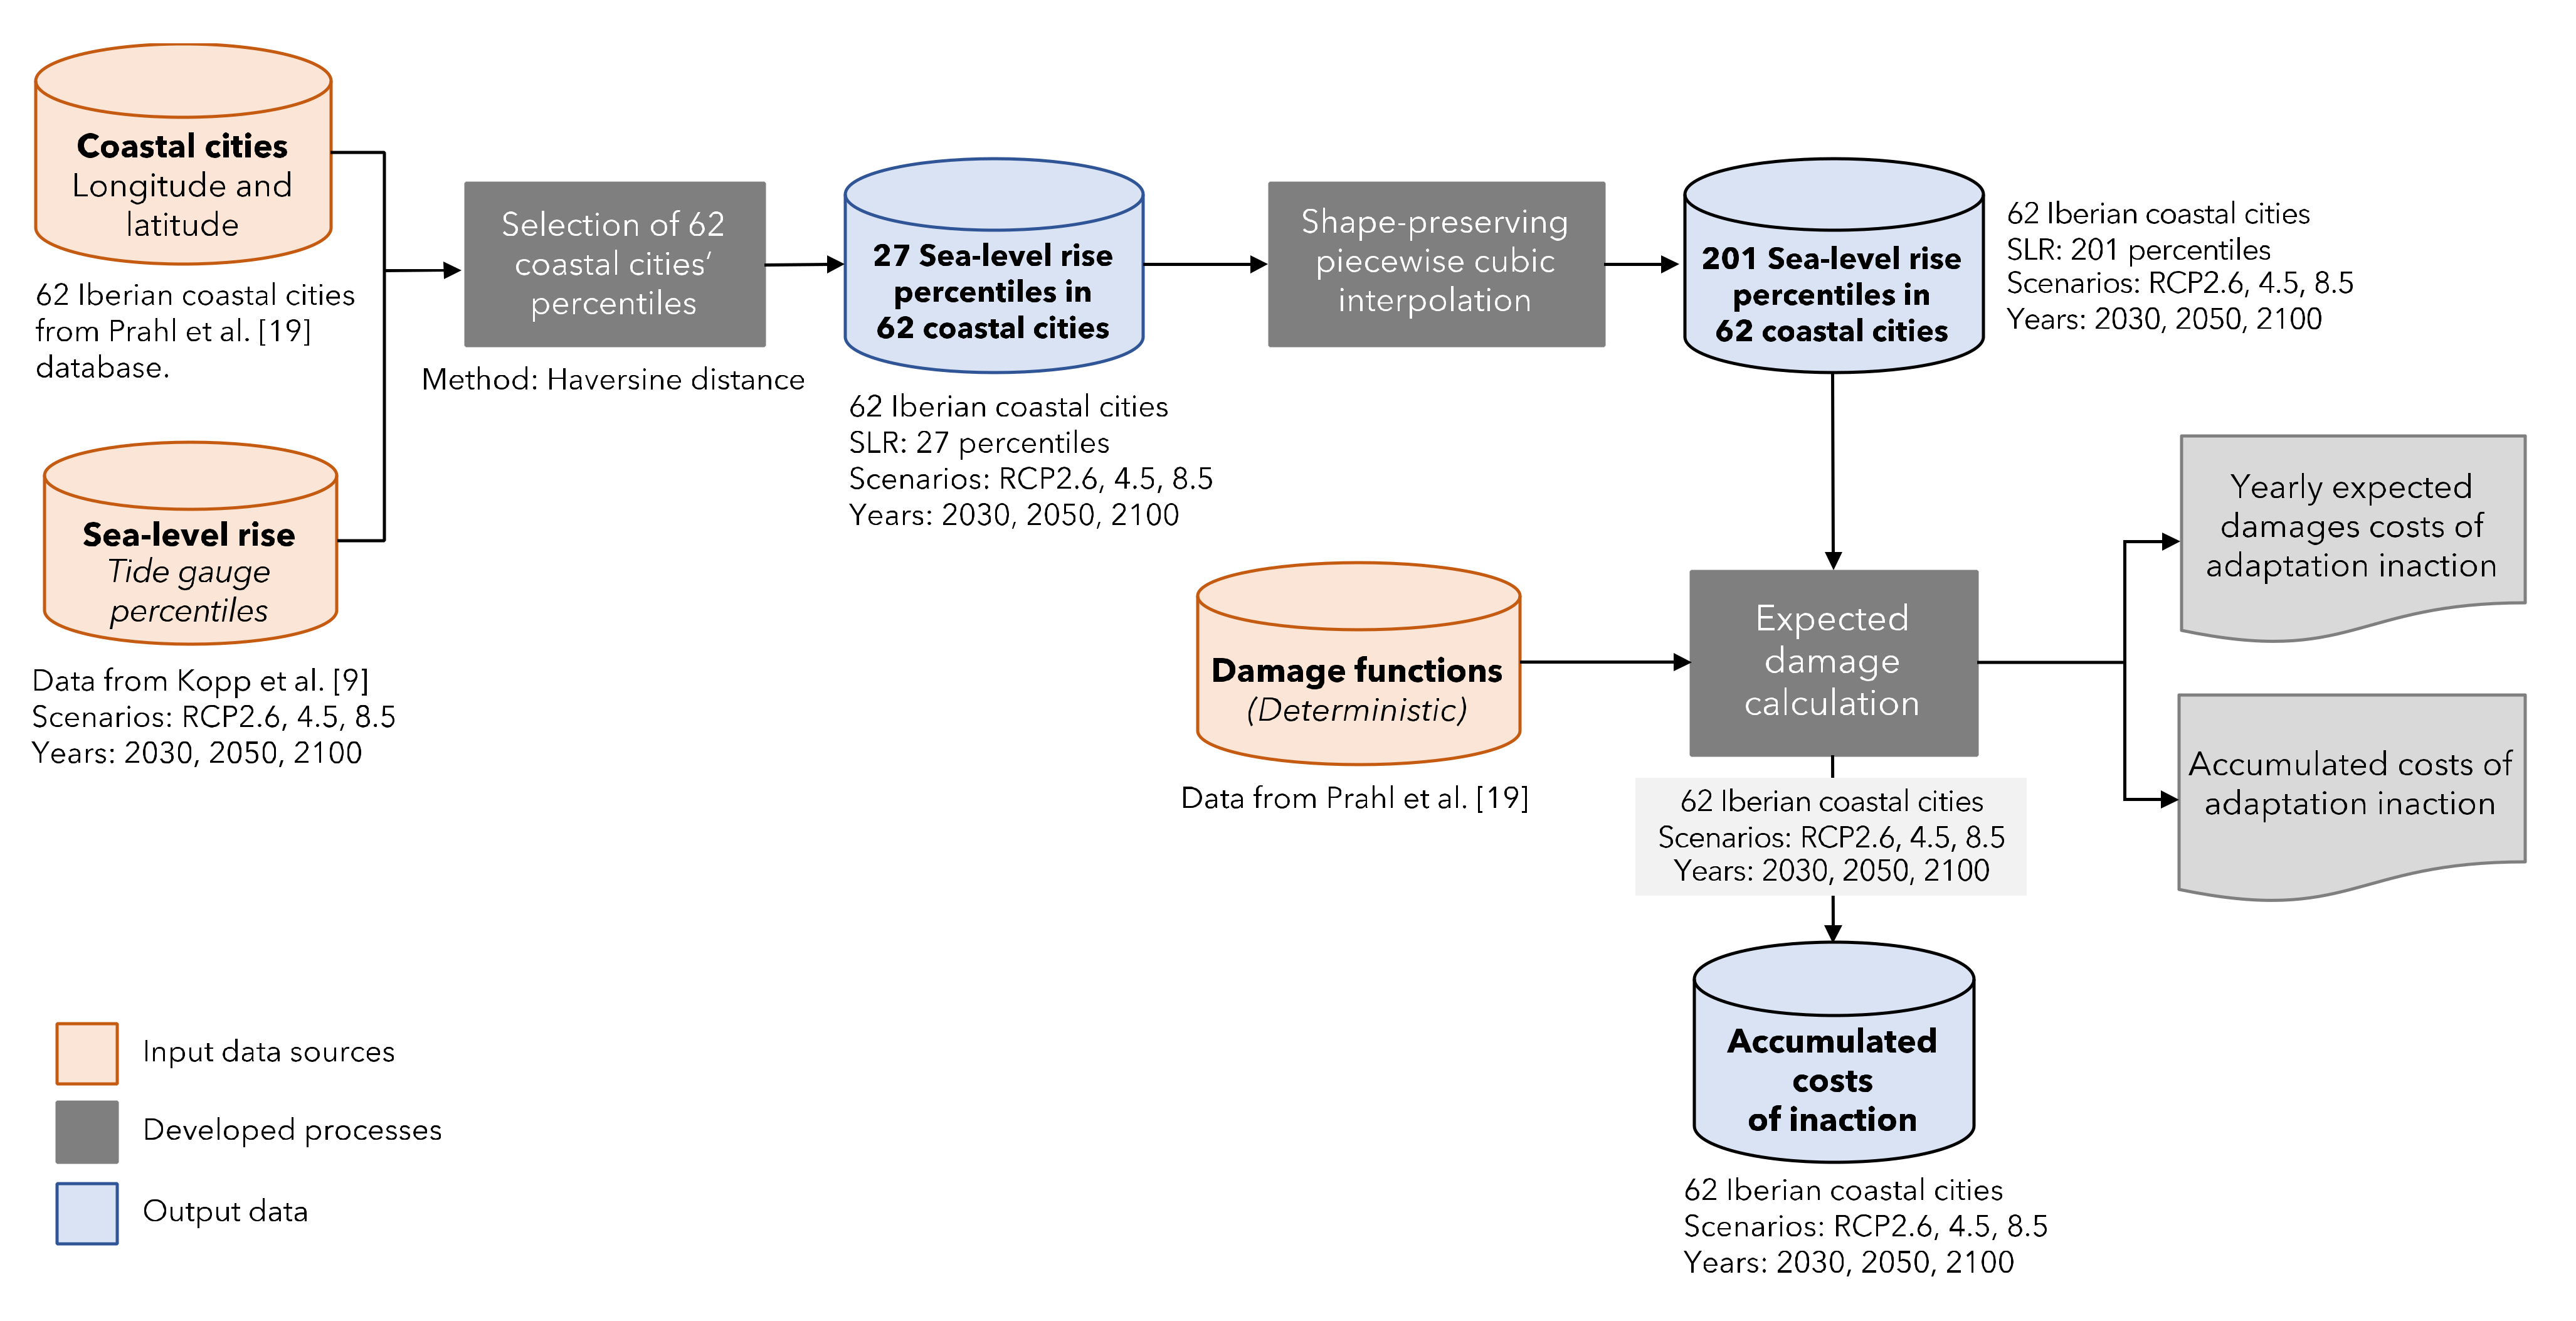
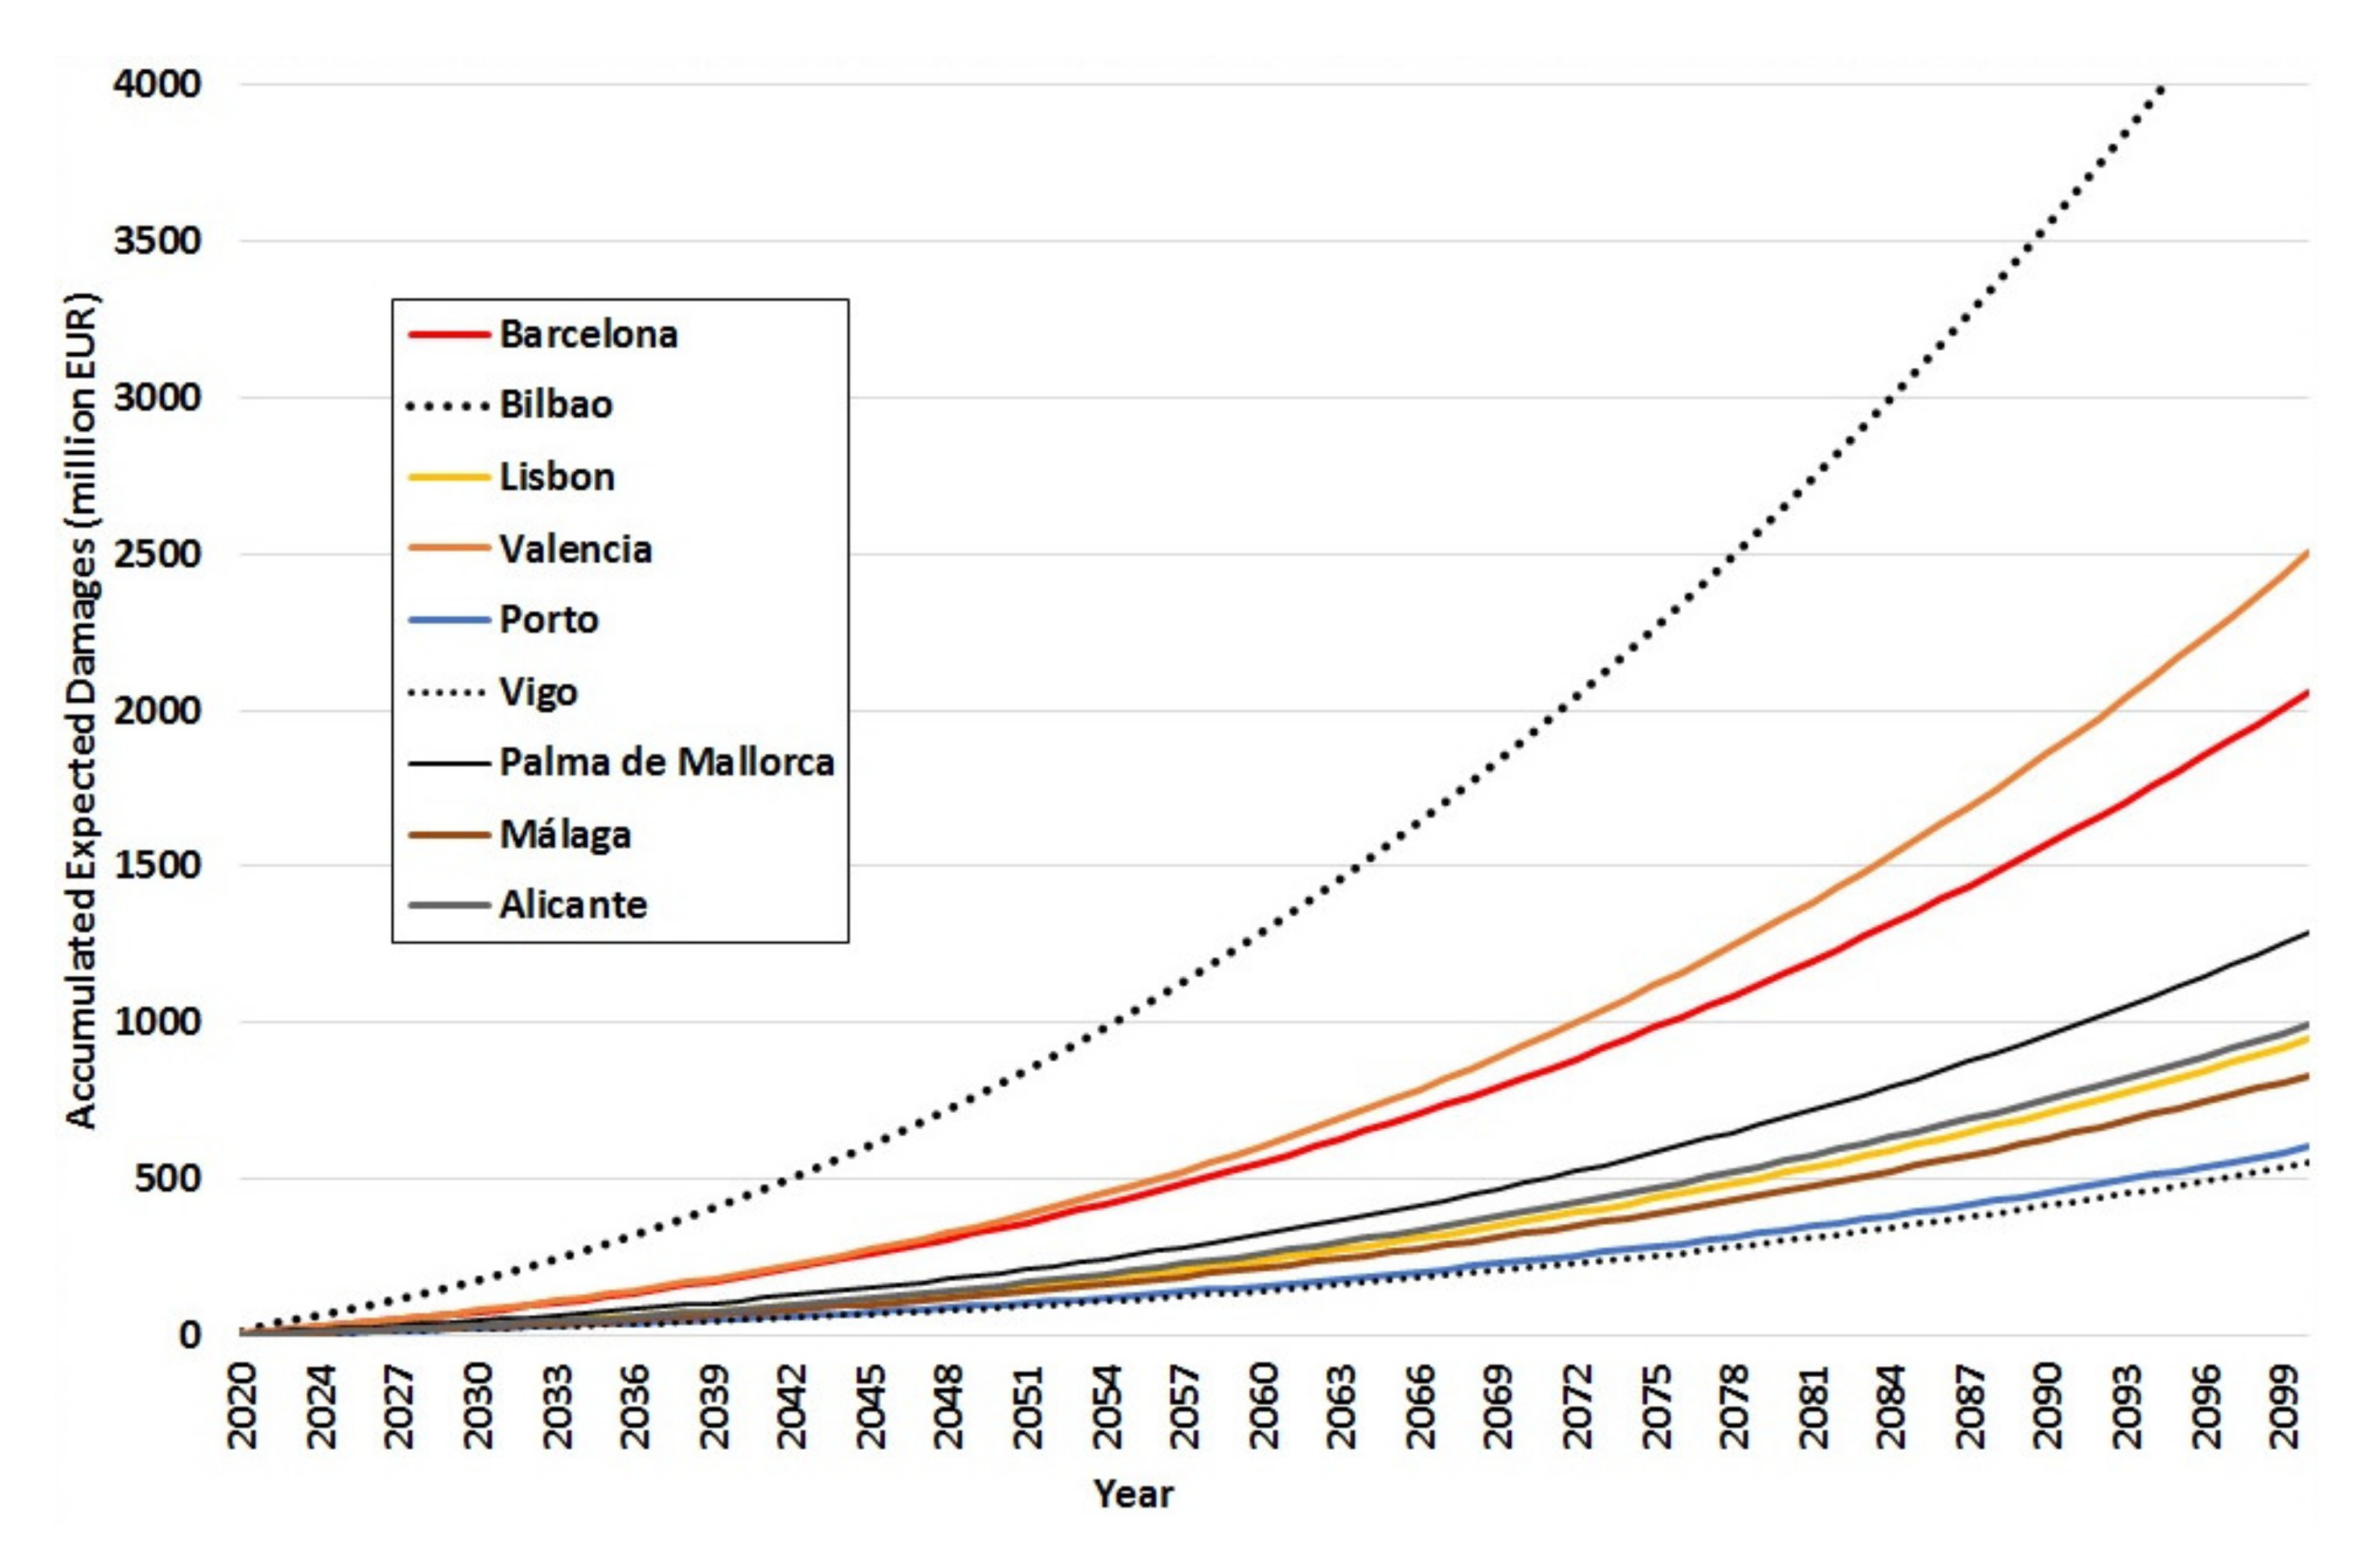
3.1. Estimating the Costs of Adaptation Inaction

The methodological approach followed in this study to assess the costs due to sea-level rise if adaptation is not implemented is summarised in Figure 1. The first step is to identify the cities for our assessment. A recent study estimated the economic damage due to coastal flood height for 600 European cities, as well as the adaptation costs, obtained as a function of defence height [19]. This is done in a deterministic way. Of all these cities, we focus on those located in the Iberian Peninsula, our target study zone. Our sample includes 62 main coastal cities in Portugal and Spain, as shown in Figure 2. The second step is estimating future sea-level rise in each city using a stochastic method and considering three scenarios (RCP 2.6, 4.5 and 8.5) as described next in Section 3.1.1. The third step is calculating, also with a stochastic approach, the annual and accumulated expected damage due to sea-level rise in each of our 62 cities. This is explained in Section 3.1.2.

3.1.1. Modelling Projected Sea-Level Rise in Each City

First, local sea-level rise data for each city is taken from a database that includes the probabilistic distribution of sea-level rise under three emission scenarios (RCP 2.6, 4.5 and 8.5) in 2030, 2050 and 2100, for more than a thousand tide gauges worldwide [9]. With regard to sea-level rise projections, RCP 8.5 represents the highest emission or the business-as-usual scenario where no climate mitigation policies are adopted; RCP 4.5 describes a middle of the road scenario, and RCP 2.6 is the deep-emission reduction scenario, compatible with a 2 °C warming. The database presents a number of sea-level rise percentiles to a large tide gauge dataset worldwide. For every city in our sample, the closest tide gauge is selected using the Haversine distance between the coastal city and the tide gauges [40]. From the dataset, a total of 27 sea-level rise percentiles with values of xx.0th and xx.5th were selected for each city, scenario and selected year, where xx is an integer between zero and 100. Note, however, that the percentiles are irregularly spaced, while regularly spaced percentiles are needed to apply the methodology proposed. For this reason we calculated an additional 174 percentiles using shape-preserving piecewise cubic interpolation. Thus, 201 percentiles of sea-level rise evenly distributed between 0 and 100 were estimated, spaced by 0.5 (see Figure 1).
As the objective is to estimate the expected (average) damage, the average sea-level rise is calculated using these 201 percentiles. The expected sea-level rise for city i at time j is denoted by E(SLRi,j). This average value is greater than the corresponding 50th percentile, which indicates that the tail of the distribution is long, and thus, it is possible that risks are underestimated if median values are used. This again confirms that knowing the full distribution, additionally to estimating average values, may be of great importance for adequate risk management. This process is followed for each city, each year (2030, 2050 and 2100) and the three aforementioned RCPs.
Note that these percentiles are chosen in order to find the best manner to represent the shape of all distributions. An alternative to this approximation is the so-called parametric approach that consists of calibrating a distribution with two or three parameters [40]. However, this method is not recommended in this case as it may cause important calibration errors that lead to differences between the value of the original percentiles and those obtained from the modelled distribution. Consequently, it will negatively impact the calculation of expected values. We thus argue, in this case, in favour of using the percentiles for calibration as explained above.
As an illustration, Figure 3 shows a standard cumulative distribution function for sea-level rise for nine representative Iberian coastal cities in the year 2100 considering the highest emission scenario, RCP 8.5. The ten cities were selected for being those with the largest population based on data from Eurostat (European Commission, Brussels, Belgium).
Figure 4 shows how cumulative distribution functions may evolve in time, illustrated by the case of Barcelona. One can see that the probabilities of sea-level rise being less than or equal to 50 cm in 2100 are 25% under RCP 8.5, 48.25% under RCP 4.5 and 61% in RCP 2.6.

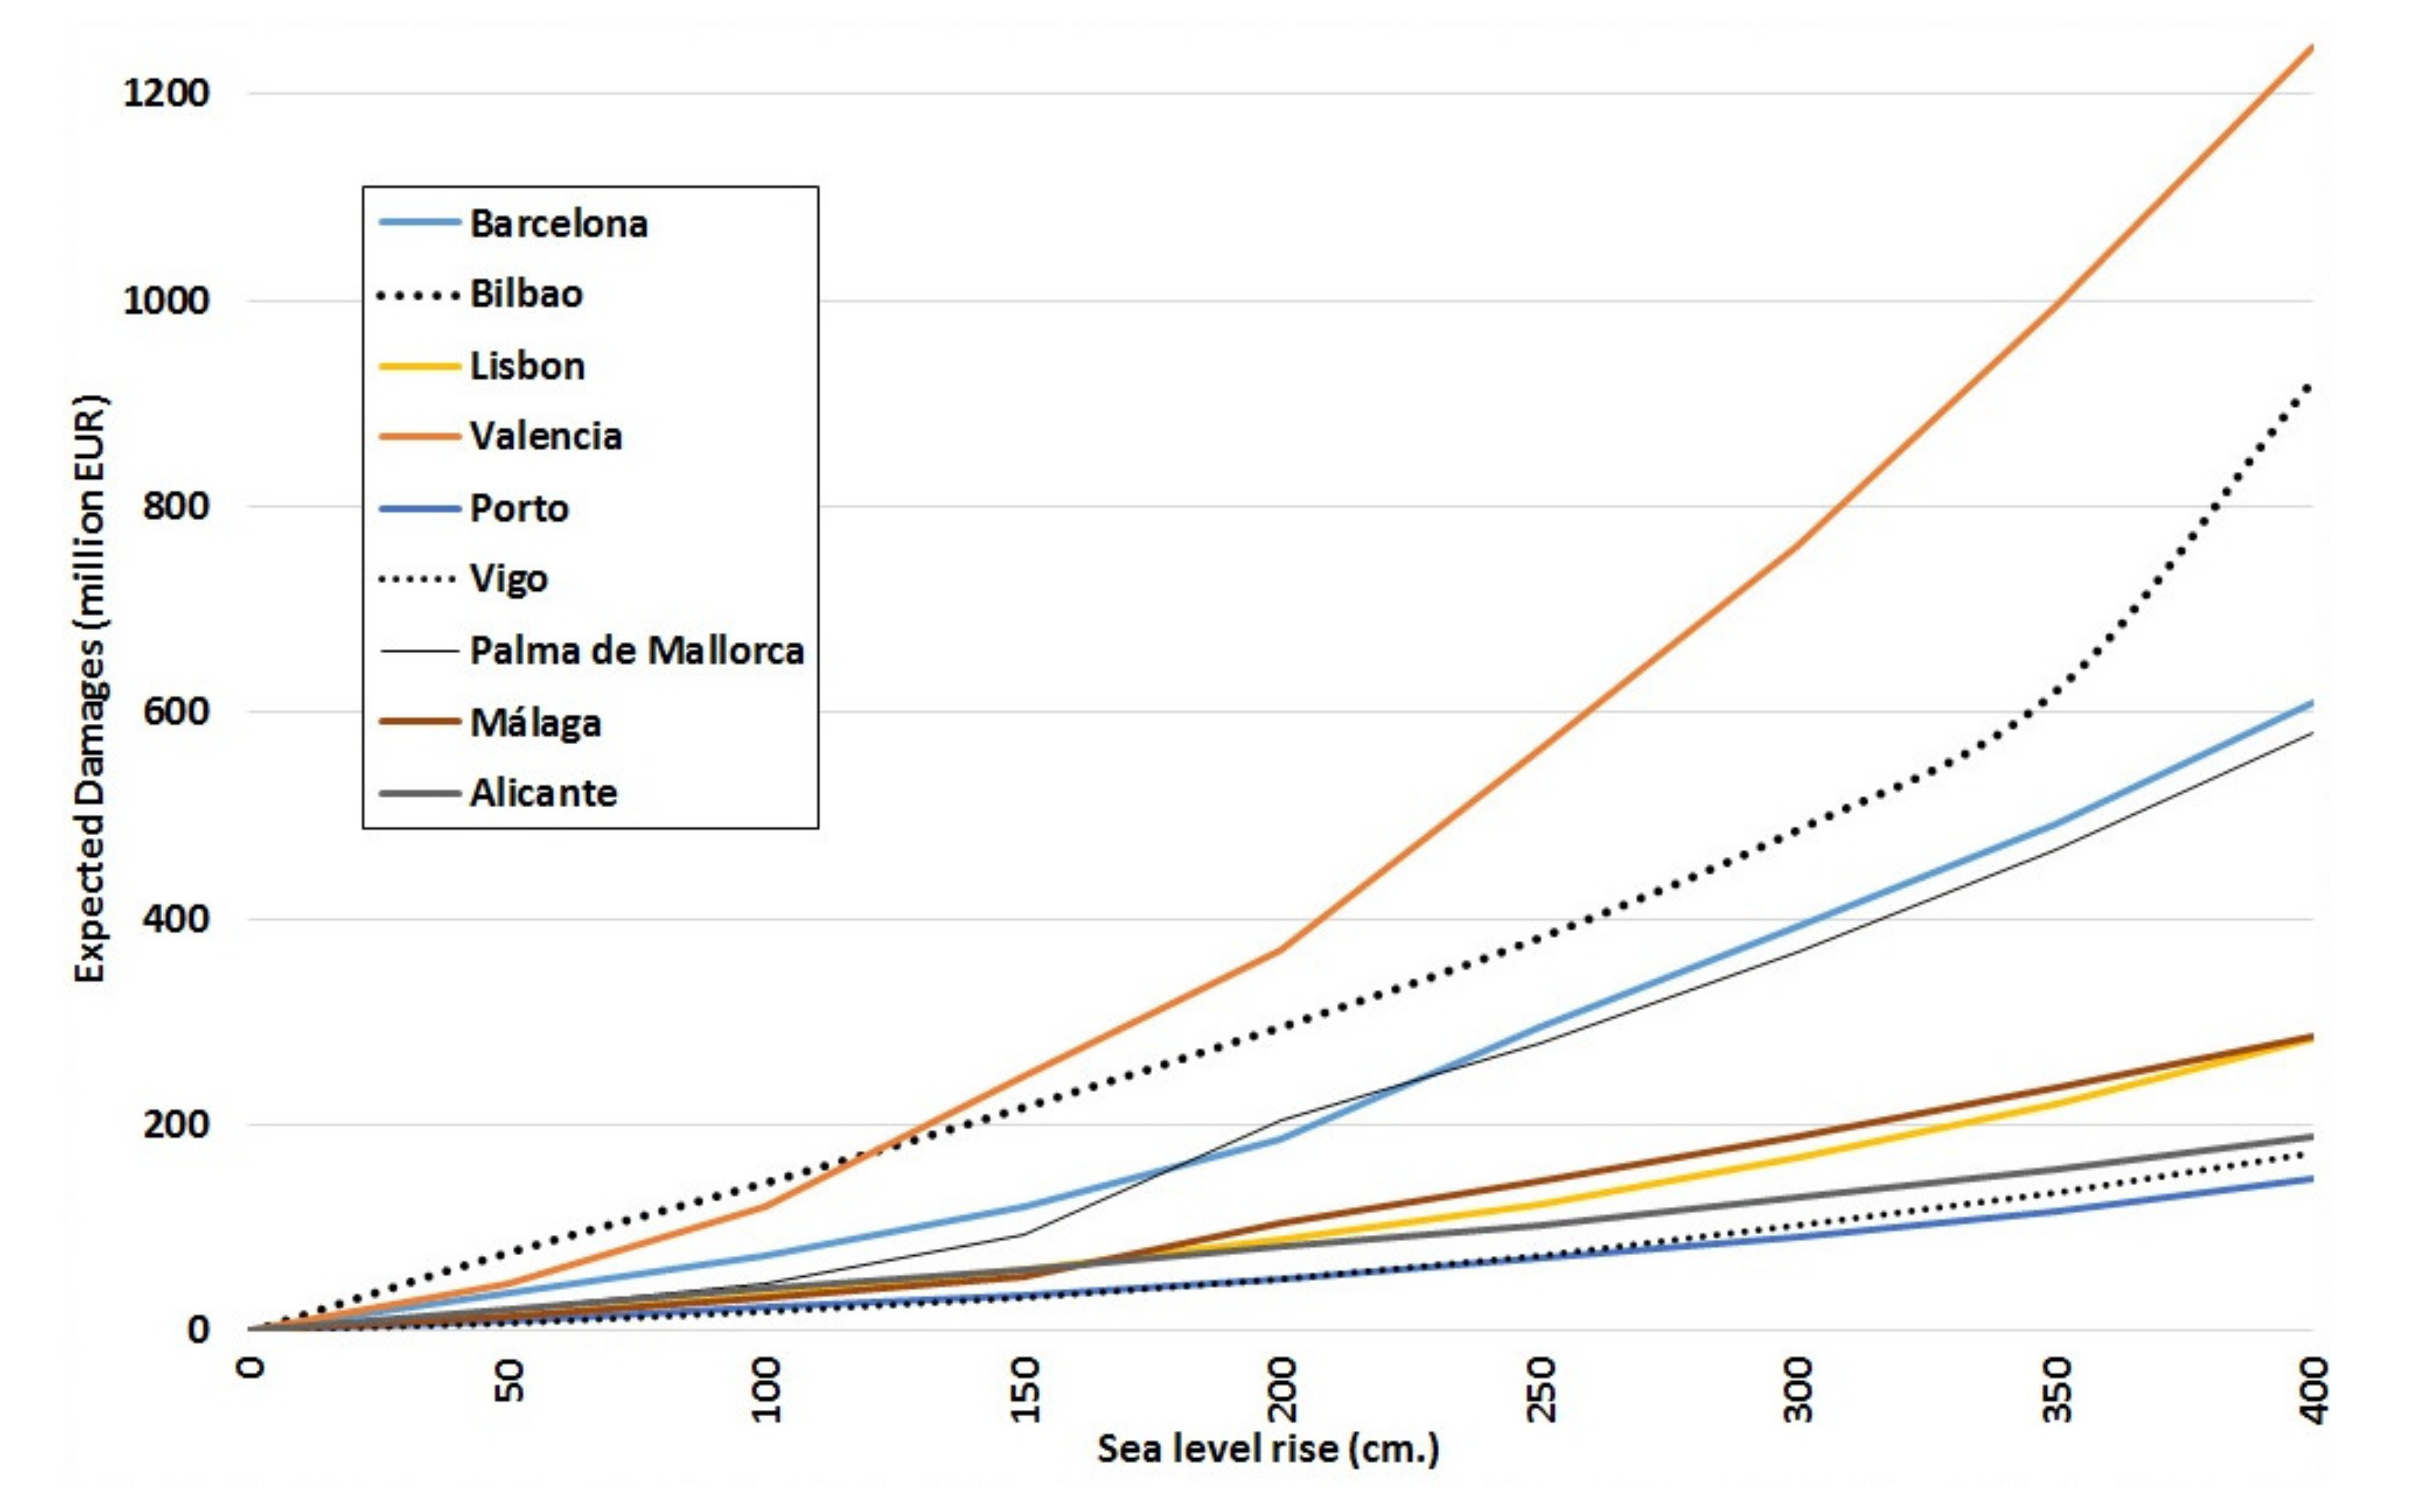
3.1.2. Estimation of Economic Damage

A recent study presented the economic damage and adaptation costs as a deterministic function of coastal flood height and height of the defences, respectively, for 600 European coastal cities [19]. The deterministic damage functions used in this work for each of the 62 coastal cities in our sample are taken from the aforementioned study [19]. These functions provide an estimation of damage as a function of sea-level height. The inundation model used to obtain the damage functions used a digital terrain model of 25 m resolution, and hydraulically connected areas were calculated for different coastal flood levels between 0 and 12 m at intervals of half a metre. The damage cost functions [19] were built based on the economic value of the assets exposed to coastal flooding. This exposure was measured considering the economic value of land use, which in turn is based on country level data from a previous study [41], and then adjusting the monetary estimates to 2016 prices by using inflation rates and consumer price index (see [19](p. 5) for further details).
The cost curves [19] are not linear, that is, at higher levels of sea-level rise (SLR), we might obtain, in some cases, higher than proportional costs (Figure 5). Accordingly, the damage distribution is not a linear transformation of the sea-level rise distribution. We denote using E(Di,j) the expected annual damage value for the city i at the time j. Using the sea-level rise percentiles, we calculate 201 damage values for each city at year j. As these values are equally likely, the expected value is calculated as their average value.
Figure 5 illustrates the annual damage depending on local sea-level rise in nine cities of our sample as taken from the damage function database [19]. Note that these deterministic functions are non-linear and not time-dependent, as damage depend only on flood depth. The time component will be incorporated when combined with the sea-level rise scenarios, which vary with time.
We define the annual costs of adaptation inaction as the expected damage under three sea-level rise scenarios, which we estimate for the years 2030, 2050 and 2100. Next, we estimate the expected costs for the rest of the years between 2020 and 2100 using shape-preserving piecewise cubic interpolation. Last, we accumulate the calculated damage from 2020 onwards to obtain the accumulated cost of inaction in 2030, 2050 and 2100 [42].

3.2. Measuring the Investment Costs of Adaptation

Adaptation costs for each city were obtained from the study that developed the damage function database [19], which includes the protection needs to be calculated for each city. Adaptation costs are defined based on a theoretical urban protection strategy which consists of a hypothetical defence (adaptation infrastructures, such as dikes or seawalls) that responds to the protection needs in each city. A country-specific dike-construction cost range is used as a proxy for the investment needed for such defences [19]. We acknowledge that this is a rather limited analysis of adaptation options as cities may identify a wide portfolio of both soft and hard adaptation options. However, this is a limitation of the available data but can well illustrate the use of the method proposed in this paper.
A range of adaptation investment costs needed (minimum and maximum cost estimates) are provided in [19]. The average value of this range is also calculated. Based on the available data and for illustrative purposes, two different strategies are assumed to assess adaptation investment needs:
  • The first strategy aims at reducing climate change risk, for example by building a defence that can only be overcome in a certain percentage of the cases by a given year under one of the RCP scenarios. In this case we have defined 5% and 0.5% of the cases by the year 2100 under RCP 8.5. In other words, this option requires building an infrastructure to protect from sea-level rise percentiles 95th and 99.5th. We have named this strategy as “risk tailoring”.
  • The second strategy consists of building defences of standard height (e.g., 2 m or 3 m) and comparing the protection level and costs with the “risk tailoring” strategy.
The costs of adaptation investment for each city and scenario are then compared to the accumulated costs of inaction estimated previously in Section 3.1.2, to determine in which cases the benefits of adaptation (in terms of avoided damage or costs) exceed its costs. Note that for simplicity it is assumed defences protect the city of coastal flood heights smaller or equal to their height, but we acknowledge that waves could act on adjacent areas or circumvent the defences in some cases.
A summary of the methodological steps followed in this section is described in Figure 6 below.
Discount rates can also be incorporated into the modelling. On this occasion, however, we have decided not to include them for two main reasons. First, setting the appropriate discount factor may become a rather difficult task, especially when such long terms are considered, as fat tails may exist and potential damage (even with very low probability) can be so high [43,44]. There is plenty of literature discussing this issue [45,46,47] and no clear consensus exists on how to address this (see [48] for a more detailed discussion). Small variations in how the discount rates are applied may have substantial effects on the economic damage and the investment results. Second, in this study we are interested in analysing the decision of inaction and investing in adaptation without the interference of other factors, so we chose to avoid their effect on the calculations. The higher the discount rate the lower the value of the benefit (or costs) will be in the future, but there are other factors that may also substantially affect the results that have not been considered, such as the growth rate in the value of the properties at risk. In fact, one could expect that damage will increase as the value of the properties increase, and therefore, it is the difference between the growth rate and the discount rate that really matters. The impact of discount rates on actual values of investments (or benefits) occurring over long periods of time is always very significant. In any case, with net discunt rates of 1% and 2%, investing in adaptation would still be a good decision in our study (see Table S10 in the Supplementary Materials).

4. Results

4.1. Local Sea-Level Rise and the Costs of Inaction

We calculate three sea-level rise percentiles for each city and the accumulated damage in 2030, 2050 and 2100. Table 1 shows the results in 2100 for the 10 coastal cities with the largest population, under RCP 8.5. The results for all cities and scenarios are provided in the supplementary information. We present the RCP 8.5 in Table 1 because of the greater influence of this RCP on the sea-level rise risk [49].
Note that Bilbao, Valencia and Barcelona are the coastal cities with the largest expected accumulated damage in the case of inaction. Both the sea-level rise percentiles and the damage grow rapidly over time, particularly in the second part of the century, in line with studies for other cities worldwide [49]. An illustration of accumulated expected damage for four cities in the top ranking of damage is shown in Figure 7.
To show that averages and median values may differ substantially we present the differences in damage for some cities and years in Table 2. Average damage have been calculated using the full distribution of sea-level rise probabilities, and the damage curves are shown in Figure 5. Damage in Table 2 correspond to the selected years, and they are not accumulated data. As expected, by 2100, differences in mean and average values are very important. This is mainly driven by two effects: (1) the shape of the sea-level rise distribution and (2) the shape of the damage curves. The main and very important conclusion here is that, in the long term, the use and estimation of median values (50th percentile) provide insufficient information and can lead to underestimating coastal risks and consequently to under protection. The methodology proposed in this paper should help overcome this limitation by offering complete information on the risk faced.
In more detail, it can be noted that the shape distribution effect is caused by skewness. Positive skewness is obtained when the distribution has an asymmetric tail extending toward more positive values. In these right-skewed distributions, the mean is greater than the median, and the former is affected by extreme sea-level rise values. The skewness found for Barcelona, Lisbon, Valencia, Porto and Bilbao has also been included in Table 2. Note that skewness increases with time, causing a growing impact of extreme values in the mean values of sea-level rise.
Table 3 shows the accumulated damage for a total of 62 Iberian cities and per country for the three scenarios. Damage for RCP 8.5 are very significant, but even in the most favourable scenario (RCP 2.6) important accumulated damage are expected due to sea-level rise.

4.2. Adaptation Strategies and Investment Costs

4.2.1. Adapting to the Risk of Sea-Level Rise or “Risk Tailoring”

In this case, we focus on the “risk tailoring” strategy of building protective defences of a height that would only be surpassed in 5% and 0.5% of the cases (under the scenario RCP 8.5 in 2100). These are the heights for the 95th and 99.5th percentiles. Results are shown in Table 4. One can see that inaction is costlier than implementing adaptation in all cases, as expected damage are much greater than the adaptation costs. If defences are to be exceeded only in 5% of the cases, this means that protection height in the top cities with the largest damage would need to be higher than 1 m, and between 1.61 m and 1.80 m to avoid damage in 99.5% of the cases. Table 4 shows an interval (minimum and maximum values) of infrastructure construction costs taken from [19] for each city, depending on its characteristics and defence height. The average is the mean of these two values.

4.2.2. Adapting by Fixing a Certain Height

If defence heights were to be decided exogenously, for instance, at 2 m and 3 m by 2100, the average adaptation costs for the top 10 cities of the ranking would range between 282 and 1225 million euros for a protection infrastructure of 2 m (Table 5). In the case of a 3 m defence, average costs could reach 400–2400 million euros, but even in this case, the investment can be well justified to avoid the accumulated damage. Note that if standard height defences of 2 m or 3 m are to be implemented, the probability of damage in the year 2100 is rather small.

5. Discussion

5.1. The Economic Damage of Sea-Level Rise

In this paper, we propose a model for the calculation of accumulated expected damage under uncertainty. The model uses an expanded version of the projected sea-level rise percentiles [9] and a deterministic function that depends on flood height (in our case, sea-level height) [19]. The combination of both provides a group of stochastic damage distributions that allow us to calculate annual expected damage and, consequently, also the expected accumulated damage. Accumulated average damage in all 62 cities of our sample exceed 1700 million euros in 2030, and the difference between the results under RCP 4.5 and RCP 8.5 is 45 million euros. However, by the end of the century, accumulated damage reach 41,200 million euros under RCP 4.5 and more than 50,400 million euros in the highest emission scenarios (RCP 8.5). Accumulated damage increase by more than 20 times by 2100 and the difference between RCP 4.5 and RCP 8.5 could reach 10 billion euros (Table S8 and Table S9).
Furthermore, our results show that limiting the assessments to median values (50th percentile) significantly underestimates the potential damage. While differences between median and average values might be small by 2030, they increase considerably by one order of magnitude by the end of the century. For example, in Barcelona the difference between median and average damage is 0.5 million euros in 2030, but increases to almost 4 million euros in 2100 (Table 2). This difference occurs because the shape of the sea-level rise distribution is positively skewed, i.e., the distribution is not symmetrical but has a heavier upper tail The shape of the distribution of the damage is also another cause of important underestimations in the medium term when calculating expected damage. These findings are consistent with previous studies that warned about the larger potential risk of climate-induced impacts.
Damage costs do not account for coastal erosion or ecosystem loss, impacts that are both expected to be relevant in the Iberian Peninsula. Additionally to their intrinsic value, ecosystems provide a number of services to people that can be monetised [50]. The value of services such as storm protection or erosion control provided by salt marshes and mangroves worldwide is estimated to be 194,000 $/ha/year [51], which has not been accounted for in this study. Of course, one should acknowledge that other important factors such as shoreline evolution have to be integrated into a cost-benefit analysis to account for the complexities of coastal defence solutions, as argued earlier by other authors [52]. In this case, we have simplified this part of the analysis to focus on the impact of uncertainty on the economic estimates but by no means do we neglect the need to integrate those factors.

5.2. Comparing the Costs of Inaction to Protection Investment Costs

Two different adaptation options have been explored in this study: the first is based on tailoring the level of risk cities might decide to protect themselves from. This is illustrated through the assumption that coastal or city managers decide to protect each city for 95% or 99.5% of the cases under RCP 8.5 by 2100. In the first case, with protection strategies to face 95% of the cases, investment needs in the largest coastal cities by population would range between 87 (Porto) and 1015 (Bilbao) million euros. Investment costs almost double if a higher protection threshold (99.5%) is considered, and these would vary between 164 (Porto) and 1015 (Bilbao) million euros. The second adaptation option explored the investment costs needed for certain protection heights (2 and 3 m). In the case of 3 m protection infrastructures, construction costs range between 404 and 2368 million euros.
An important finding of this analysis is that adaptation costs in the long term are much smaller than the increasingly expensive costs of inaction, and thus, investing in adaptation is a good decision when comparing costs and benefits of the actions, a finding in line with previous research carried out in this area of study [53].
Of course, one should acknowledge that many other adaptation options that have not been considered in this paper may exist, and that many other criteria other than economic costs and benefits may be worth being taken into account when making such decisions. Another clear finding is that adaptation investment needs will be smaller under more favourable scenarios (RCP 2.6 and RCP 4.5). However, even under the most optimistic scenario (RCP 2.6), expected damage will be very important in the second half of the century. In other words, despite strong emission reduction efforts being really effective, adaptation will be inevitable. This is to highlight the importance of the need to implement both mitigation and adaptation policies.
Our findings show that not adapting to climate change is not, by any means, a good strategy in the medium and long term. Note that, even if many types of adaptation options should be considered when protecting coasts from climate risks, the building of defence infrastructures that require strong investments would be justified based on the accumulated damage by 2100, which are much greater than the investment costs of protection. Moreover, the adaptation strategies considered in this paper are shown to be very cost-effective in every city studied and reduce considerably the probability of experiencing high economic damage by the end of the century.

5.3. Policy Implications

In this paper we propose a method to avoid the underestimation of climate risk and estimate what the size of it may be for the case of 62 cities in the Iberian peninsula. We have used two infrastructure-based adaptation options for illustrative purposes. This has been done because the data needed for the analysis is available in these cases, and not because we argue that these solutions should be the ones implemented. Results show that the underestimation of damage can be very important if we consider median values instead of the average (expected) damage. Therefore, we argue that strong efforts should be made to understand the full probability distributions of sea-level rise and the consequent economic damage, for each city, emission scenario and year. Not accounting for all these may lead to investment decisions (and even maladaptation) that underestimate future risks and cannot respond to them.
The method can also be applied to adequately assess the cost effectiveness of other adaptation options when data becomes available. The purpose of the paper has been to propose a methodology and illustrate the case for sea-level rise and hard adaptation measures for which good data was available. Other pieces of research should help us to better consider alternative adaptation options or even other impacts related to the adaptation options considered. Nonetheless, the main message of this paper remains, not accounting for the full distribution of sea level rise as well as damage costs is a clear and very significant underestimation of climate risks that may lead to inadequate policy decisions.

Supplementary Materials

A dataset with additional results for all 62 cities, scenarios and years is available online at https://www.mdpi.com/2073-4441/12/4/1220/s1.

Author Contributions

Conceptualization, L.M.A.; formal analysis, L.M.A. and E.S.d.M.; methodology, L.M.A.; writing—original draft, L.M.A., E.S.d.M. and I.G. All authors have read and agreed to the published version of the manuscript.

Funding

This research is supported by the Basque Government through the BERC 2018-2021 program and by the Spanish Ministry of Economy and Competitiveness MINECO through BC3 María de Maeztu excellence accreditation MDM-2017-0714. Additionally, Luis M. Abadie is grateful for financial support from The Spanish Ministry of Science and Innovation (ECO2015-68023). E. Sainz de Murieta acknowledges funding from the Basque Government (Postdoctoral Fellowship grant no. POS_2018_2_0027). Ibon Galarraga received financial support from the European Union’s Horizon 2020 research and innovation programme under grant agreement No 776479 for the project CO-designing the Assessment of Climate CHange costs.

Conflicts of Interest

The authors declare no conflicts of interest.

References

  1. IPCC. IPCC Climate Change 2013: The Physical Science Basis. Contribution of Working Group I to the Fifth Assessment Report of the Intergovernmental Panel on Climate Change; Stocker, T.F., Qin, D., Plattner, G.K., Tignor, M., Allen, S.K., Boschung, J., Nauels, A., Xia, Y., Bex, V., Midgley, P.M., Eds.; Cambridge University Press: Cambridge, UK, 2013. [Google Scholar]
  2. Church, J.A.; White, N.J.; Aarup, T.; Wilson, W.S.; Woodworth, P.L.; Domingues, C.M.; Hunter, J.R.; Lambeck, K. Understanding global sea levels: Past, present and future. Sustain. Sci. 2008, 3, 9–22. [Google Scholar] [CrossRef] [Green Version]
  3. Church, J.A.; White, N.J. A 20th century acceleration in global sea-level rise. Geophys. Res. Lett. 2006, 33. [Google Scholar] [CrossRef]
  4. Hay, C.C.; Morrow, E.; Kopp, R.E.; Mitrovica, J.X. Probabilistic reanalysis of twentieth-century sea-level rise. Nature 2015, 517, 481–484. [Google Scholar] [CrossRef] [PubMed]
  5. Yi, S.; Sun, W.; Heki, K.; Qian, A. An increase in the rate of global mean sea level rise since 2010. Geophys. Res. Lett. 2015, 42, 3998–4006. [Google Scholar] [CrossRef] [Green Version]
  6. Hardy, R.D.; Nuse, B.L. Global sea-level rise: Weighing country responsibility and risk. Clim. Change 2016, 137, 333–345. [Google Scholar] [CrossRef]
  7. Hamlington, B.D.; Fasullo, J.T.; Nerem, R.S.; Kim, K.-Y.; Landerer, F.W. Uncovering the Pattern of Forced Sea Level Rise in the Satellite Altimeter Record. Geophys. Res. Lett. 2019, 46, 4844–4853. [Google Scholar] [CrossRef]
  8. Slangen, A.B.A.; Carson, M.; Katsman, C.A.; Wal, R.S.W.; van de Köhl, A.; Vermeersen, L.L.A.; Stammer, D. Projecting twenty-first century regional sea-level changes. Clim. Chang. 2014, 124, 317–332. [Google Scholar] [CrossRef]
  9. Kopp, R.E.; Horton, R.M.; Little, C.M.; Mitrovica, J.X.; Oppenheimer, M.; Rasmussen, D.J.; Strauss, B.H.; Tebaldi, C. Probabilistic 21st and 22nd century sea-level projections at a global network of tide-gauge sites. Earths Future 2014, 2, 383–406. [Google Scholar] [CrossRef]
  10. Grinsted, A.; Jevrejeva, S.; Riva, R.; Dahl-Jensen, D. Sea level rise projections for northern Europe under RCP8.5. Clim. Res. 2015, 64, 15–23. [Google Scholar] [CrossRef] [Green Version]
  11. Jackson, L.P.; Jevrejeva, S. A probabilistic approach to 21st century regional sea-level projections using RCP and High-end scenarios. Glob. Planet. Chang. 2016, 146, 179–189. [Google Scholar] [CrossRef] [Green Version]
  12. Nauels, A.; Gütschow, J.; Mengel, M.; Meinshausen, M.; Clark, P.U.; Schleussner, C.-F. Attributing long-term sea-level rise to Paris Agreement emission pledges. Proc. Natl. Acad. Sci. USA 2019. [Google Scholar] [CrossRef] [PubMed] [Green Version]
  13. Bamber, J.L.; Oppenheimer, M.; Kopp, R.E.; Aspinall, W.P.; Cooke, R.M. Ice sheet contributions to future sea-level rise from structured expert judgment. Proc. Natl. Acad. Sci. USA 2019, 116, 11195–11200. [Google Scholar] [CrossRef] [PubMed] [Green Version]
  14. IPCC. IPCC Special Report on the Ocean and Cryosphere in a Changing Climate; Pörtner, H.O., Roberts, D.C., Masson-Delmotte, V., Zhai, P., Tignor, M., Mintenbeck, K., Nicolai, M., Okem, A., Petzold, J., Rama, B., et al., Eds.; IPCC: Geneva, Switzerland, 2019; In press. [Google Scholar]
  15. Ciscar, J.C.; Ibarreta, D.; Soria, A.; Dosio, A.; Toreti, A.; Ceglar, A.; Fumagalli, D.; Dentener, F.; Lecerf, R.; Zucchini, A.; et al. Climate Impacts in Europe: Final Report of the JRC PESETA III Project; European Commission: Luxenbourg, 2018; p. 95. [Google Scholar]
  16. Wong, P.P.; Losada, I.J.; Gattuso, J.P.; Hinkel, J.; Khattabi, A.; McInnes, K.L.; Saito, Y.; Sallenger, A. Coastal systems and low-lying areas. In Climate Change 2014: Impacts, Adaptation, and Vulnerability. Part A: Global and Sectoral Aspects. Contribution of Working Group II to the Fifth Assessment Report of the Intergovernmental Panel on Climate Change; Field, C.B., Barros, V.R., Dokken, D.J., Mach, K.J., Mastrandrea, M.D., Bilir, T.E., Chatterjee, M., Ebi, K.L., Estrada, Y.O., Genova, R.C., et al., Eds.; Cambridge University Press: Cambridge, UK, 2014; pp. 361–409. [Google Scholar]
  17. Vousdoukas, M.I.; Mentaschi, L.; Voukouvalas, E.; Bianchi, A.; Dottori, F.; Feyen, L. Climatic and socioeconomic controls of future coastal flood risk in Europe. Nat. Clim. Chang. 2018, 8, 776–780. [Google Scholar] [CrossRef]
  18. Sánchez-Arcilla, A.; García-León, M.; Gracia, V.; Devoy, R.; Stanica, A.; Gault, J. Managing coastal environments under climate change: Pathways to adaptation. Sci. Total Environ. 2016, 572, 1336–1352. [Google Scholar] [CrossRef] [PubMed] [Green Version]
  19. Prahl, B.F.; Boettle, M.; Costa, L.; Kropp, J.P.; Rybski, D. Damage and protection cost curves for coastal floods within the 600 largest European cities. Sci. Data 2018, 5, 180034. [Google Scholar] [CrossRef]
  20. Weitzman, M.L. A precautionary tale of uncertain tail fattening. Environ. Resour. Econ. 2013, 55, 159–173. [Google Scholar] [CrossRef] [Green Version]
  21. Hinkel, J.; Jaeger, C.; Nicholls, R.J.; Lowe, J.; Renn, O.; Peijun, S. Sea-level rise scenarios and coastal risk management. Nat. Clim. Chang. 2015, 5, 188–190. [Google Scholar] [CrossRef]
  22. Thiéblemont, R.; Le Cozannet, G.; Toimil, A.; Meyssignac, B.; Losada, I.J. Likely and High-End Impacts of Regional Sea-Level Rise on the Shoreline Change of European Sandy Coasts Under a High Greenhouse Gas Emissions Scenario. Water 2019, 11, 2607. [Google Scholar] [CrossRef] [Green Version]
  23. Abadie, L.M.; Galarraga, I.; Sainz de Murieta, E. Understanding risks in the light of uncertainty: Low-probability, high-impact coastal events in cities. Environ. Res. Lett. 2017, 12. [Google Scholar] [CrossRef]
  24. Abadie, L.M.; Sainz de Murieta, E.; Galarraga, I. Investing in adaptation: Flood risk and real option application to Bilbao. Environ. Model. Softw. 2017, 95, 76–89. [Google Scholar] [CrossRef] [Green Version]
  25. Galarraga, I.; Sainz de Murieta, E.; Markandya, A.; Abadie, L.M. Addendum to Understanding risks in the light of uncertainty: Low-probability, high-impact coastal events in cities. Environ. Res. Lett. 2018, 13, 029401. [Google Scholar] [CrossRef]
  26. Losada, I.J.; Toimil, A.; Muñoz, A.; Garcia-Fletcher, A.P.; Diaz-Simal, P. A planning strategy for the adaptation of coastal areas to climate change: The Spanish case. Ocean. Coast. Manag. 2019, 104983. [Google Scholar] [CrossRef]
  27. Galarraga, I.; Osés, N.; Markandya, A.; Chiabai, A.; Khatun, K. Aportaciones desde la economía de la adaptación a la toma de decisiones sobre Cambio Climático: Un ejemplo para la Comunidad Autónoma del País Vasco. Econ. Agrar. Recur. Nat. 2011, 11, 113–142. [Google Scholar] [CrossRef] [Green Version]
  28. Pérez-Morales, A.; Gil-Guirado, S.; Olcina-Cantos, J. Housing bubbles and the increase of flood exposure. Failures in flood risk management on the Spanish south-eastern coast (1975–2013): Housing bubbles and increase of flood risk in Spain. J. Flood Risk Manag. 2015, 11, S302–S313. [Google Scholar] [CrossRef]
  29. Satta, A.; Puddu, M.; Venturini, S.; Giupponi, C. Assessment of coastal risks to climate change related impacts at the regional scale: The case of the Mediterranean region. Int. J. Disaster Risk Reduct. 2017, 24, 284–296. [Google Scholar] [CrossRef]
  30. Losada, I.J.; Izaguirre, C.; Díaz, P. Cambio Climático en la Costa Española; Oficina Española de Cambio Climático, Ministerio de Agricultura, Alimentación y Medio Ambiente: Madrid, Spain, 2014; p. 133. [Google Scholar]
  31. Mendoza, E.T.; Jimenez, J.A.; Mateo, J. A coastal storms intensity scale for the Catalan sea (NW Mediterranean). Nat. Hazards Earth Syst. Sci. 2011, 11, 2453–2462. [Google Scholar] [CrossRef] [Green Version]
  32. Freitas, M.C.; Andrade, C.; Cachado, C.; Cardoso, A.C.; Monteiro, J.H.; Brito, P.; Rebelo, L. Coastal land-loss associated with sea-level rise assessed by aerial Videotape-Assisted Vulnerability Analysis—The case of mainland Portugal. J. Coast. Res. 2006, 1310–1315. [Google Scholar]
  33. Gornitz, V. Global coastal hazards from future sea level rise. Glob. Planet. Change 1991, 3, 379–398. [Google Scholar] [CrossRef]
  34. Pereira, C.; Coelho, C. Mapping erosion risk under different scenarios of climate change for Aveiro coast, Portugal. Nat. Hazards 2013, 69, 1033–1050. [Google Scholar] [CrossRef]
  35. Ferreira, O.; Viavattene, C.; Jiménez, J.; Bole, A.; Plomaritis, T.; Costas, S.; Smets, S. CRAF Phase 1, a framework to identify coastal hotspots to storm impacts. E3S Web Conf. 2016, 7, 11008. [Google Scholar] [CrossRef] [Green Version]
  36. Viavattene, C.; Jiménez, J.A.; Ferreira, O.; Priest, S.; Owen, D.; McCall, R. Selecting coastal hotspots to storm impacts at the regional scale: A Coastal Risk Assessment Framework. Coast. Eng. 2018, 134, 33–47. [Google Scholar] [CrossRef]
  37. Rocha, C.; Antunes, C.; Catita, C. Coastal Vulnerability Assessment Due to Sea Level Rise: The Case Study of the Atlantic Coast of Mainland Portugal. Water 2020, 12, 360. [Google Scholar] [CrossRef] [Green Version]
  38. Antunes, C. Assessment of Sea Level Rise at West Coast of Portugal Mainland and Its Projection for the 21st Century. J. Mar. Sci. Eng. 2019, 7, 61. [Google Scholar] [CrossRef] [Green Version]
  39. Semeoshenkova, V.; Newton, A. Overview of erosion and beach quality issues in three Southern European countries: Portugal, Spain and Italy. Ocean. Coast. Manag. 2015, 118, 12–21. [Google Scholar] [CrossRef]
  40. Abadie, L.M.; Galarraga, I.; Markandya, A.; Sainz de Murieta, E. Risk measures and the distribution of damage curves for 600 European coastal cities. Environ. Res. Lett. 2019, 14, 064021. [Google Scholar] [CrossRef]
  41. Huizinga, J.; De Moel, H.; Szewczyk, W. Global Flood Depth-Damage Functions. Methodology and the Database with Guidelines; European Commission: Luxembourg, 2017; p. 114. [Google Scholar]
  42. Abadie, L.M.; Chamorro, J.M. Income risk of EU coal-fired power plants after Kyoto. Energy Policy 2009, 37, 5304–5316. [Google Scholar] [CrossRef] [Green Version]
  43. Weitzman, M.L. On modeling and interpreting the economics of catastrophic climate change. Rev. Econ. Stat. 2009, 91, 1–19. [Google Scholar] [CrossRef]
  44. Stern, N. The Economics of Climate Change: The Stern Review; Cambridge University Press: Cambridge, UK, 2007. [Google Scholar]
  45. Gollier, C. Pricing the Planet’s Future: The Economics of Discounting in an Uncertain World; Princeton University Press: Princeton, NJ, USA, 2012. [Google Scholar]
  46. Groom, B. Discounting. In Routledge Handbook of the Economics of Climate Change Adaptation; Markandya, A., Galarraga, I., Sainz de Murieta, E., Eds.; Routledge International Handbooks: Oxon, UK; New York, NY, USA, 2014; pp. 138–168. ISBN 978-0-415-63311-6. [Google Scholar]
  47. Drupp, M.A.; Freeman, M.C.; Groom, B.; Nesje, F. Discounting Disentangled. Am. Econ. J. Econ. Policy 2018, 10, 109–134. [Google Scholar] [CrossRef] [Green Version]
  48. Markanday, A.; Galarraga, I.; Chiabai, A.; Sainz de Murieta, E.; Lliso, B.; Markandya, A. Determining discount rates for the evaluation of natural assets in land-use planning: An application of the Equivalency Principle. J. Clean. Prod. 2019, 230, 672–684. [Google Scholar] [CrossRef]
  49. Abadie, L.M. Sea level damage risk with probabilistic weighting of IPCC scenarios: An application to major coastal cities. J. Clean. Prod. 2018, 175, 582–598. [Google Scholar] [CrossRef]
  50. TEEB. The Economics of Ecosystems and Biodiversity: Ecological and Economic Foundations; Kumar, P., Ed.; Earthscan: London, UK, 2010; ISBN 978-1-84971-212-5. [Google Scholar]
  51. Costanza, R.; de Groot, R.; Sutton, P.; van der Ploeg, S.; Anderson, S.J.; Kubiszewski, I.; Farber, S.; Turner, R.K. Changes in the global value of ecosystem services. Glob. Environ. Chang. 2014, 26, 152–158. [Google Scholar] [CrossRef]
  52. Lima, M.; Coelho, C.; Veloso-Gomes, F.; Roebeling, P. An integrated physical and cost-benefit approach to assess groins as a coastal erosion mitigation strategy. Coast. Eng. 2020, 156, 103614. [Google Scholar] [CrossRef]
  53. Coelho, C.; Cruz, T.; Roebeling, P. Longitudinal revetments to mitigate overtopping and flooding: Effectiveness, costs and benefits. Ocean. Coast. Manag. 2016, 134, 93–102. [Google Scholar] [CrossRef]
Figure 1. Summary of the methodology followed, including input data and output products.
Water 12 01220 g001
Figure 2. Selected 62 Iberian coastal cities in Spain and Portugal. Source: own elaboration.
Water 12 01220 g002
Figure 3. Cumulative distribution function of sea-level rise in 2100 for the nine Iberian cities with largest population under emission scenario RCP 8.5.
Water 12 01220 g003
Figure 4. Evolution in time of the cumulative distribution function of sea-level rise in Barcelona under RCP 2.6, 4.5 and 8.5.
Water 12 01220 g004
Figure 5. Deterministic damage curves for nine cities based on data by [27].
Water 12 01220 g005
Figure 6. Summary of the methodological approach followed to estimate adaptation investment needs in each city under three sea-level rise scenarios. Investment costs are then compared to the accumulated costs of inaction to assess adaptation benefits.
Water 12 01220 g006
Figure 7. Accumulated expected damage in nine Iberian coastal cities with largest population under RCP 8.5.
Water 12 01220 g007
Table 1. Sea-level rise percentiles and accumulated damage costs in 2100 for those cities with the largest number of inhabitants under RCP 8.5.
CityYearP50 (cm)P95 (cm)P99.5 (cm)Damage
(million EUR)
Barcelona203011283975.8
Lisbon203013212634.5
Valencia203010182479.4
Porto203012202422.1
Bilbao2030142329177.0
Málaga203011202528.3
Palma de Mallorca203012304148.0
Alicante203010182432.3
Vigo203015232721.3
Gijón203014233035.4
Barcelona2050235271343.1
Lisbon2050264253150.0
Valencia2050213647365.8
Porto205024395198.8
Bilbao2050274557806.4
Málaga2050233850132.8
Palma de Mallorca2050255270201.1
Alicante2050213647159.2
Vigo205030455689.4
Gijón2050274558155.8
Barcelona2100661131712059.5
Lisbon210072119181946.3
Valencia2100581021612504.3
Porto210066112174601.7
Bilbao2100711201804592.3
Málaga210064111168831.9
Palma de Mallorca2100711191761288.4
Alicante210058102161991.2
Vigo210077123184550.9
Gijón210072122182944.9
Table 2. Differences in the six largest cities between expected annual damage and damage using the 50th percentile under RCP 8.5. The skewness of the sea-level rise distribution is also presented for each city.
CityValues203020502100
BarcelonaExpected damage (A)8.7618.0052.93
Damage using 50th percentile (B)8.2517.2449.00
Difference in damage (A−B)0.520.753.93
Skewness−0.030.003.67
LisbonExpected damage (A)3.847.8125.36
Damage using 50th percentile (B)3.797.5823.23
Difference in damage (A−B)0.050.232.13
Skewness−0.090.653.88
ValenciaExpected damage (A)9.0519.9470.54
Damage using 50th percentile (B)9.3319.5858.53
Difference in damage (A−B)−0.280.3612.01
Skewness−0.060.624.41
PortoExpected damage (A)2.535.1615.55
Damage using 50th percentile (B)2.545.0914.55
Difference in damage (A−B)−0.010.071.00
Skewness0.010.734.05
BilbaoExpected damage (A)20.7841.82110.93
Damage using 50th percentile (B)21.4141.28105.04
Difference in damage (A−B)−0.630.545.89
Skewness−0.180.383.47
Table 3. Accumulated damage costs (million EUR) for 64 Iberian coastal cities, aggregated by country.
CountryScenario203020502100
Total IberianRCP 8.51764810050,476
Spain1574726145,342
Portugal1898395133
Total IberianRCP 4.51718758841,261
Spain1536679637,044
Portugal1837924216
Total IberianRCP 2.61732747436,895
Spain1545668433,089
Portugal1887893806
Table 4. Expected accumulated damage and adaptation strategies linked to sea-level rise percentiles (in million EUR) in 2100 for the 10 Iberian coastal cities with the largest populations under the RCP 8.5 scenario.
CityAccumulated DamageSea-Level Rise (cm)Adaptation costs
MinimumMaximumAverage
P95P99.5P95P99.5P95P99.5P95P99.5
Barcelona2060113171318595459859388727
Lisbon946119181223425323614273520
Valencia2504102161326645472932399788
Porto60211217487164126236106200
Bilbao45921201804247026131,015518858
Málaga832111168127221184319155270
Palma de Mallorca1288119176240531347767293649
Alicante991102161164289237417200353
Vigo551123184154283223409189346
Gijón945122182211348305503258425
Table 5. Expected accumulated damage and adaptation strategies with standard height defences in 2100 (costs shown in million euros) for the 10 largest Iberian coastal cities, under RCP 8.5.
CityAccumulated DamageAdaptation costs
MinimumMaximumAverage
2 m3 m2 m3 m2 m3 m
Barcelona20607581434109620729271753
Lisbon94649194771013696011158
Valencia250487316381262236810672003
Porto602201404291584246494
Bilbao45927991343115619429781642
Málaga832279496404717341607
Palma de Mallorca12887121342102919408701641
Alicante991378644547931463787
Vigo551319614461888390751
Gijón945391660565955478808

