Article

Spatiotemporal Variation in Precipitation during Rainy Season in Beibu Gulf, South China, from 1961 to 2016

1
Research Center for Ecological Civilization Construction and Sustainable Development in Xijiang & Beijiang River Basin of Guangdong Province, Foshan University, Foshan 528000, China
2
Department of Geography and Environment Science, University of Reading, Reading RG6 6AB, UK
*
Author to whom correspondence should be addressed.
Water 2020, 12(4), 1170; https://doi.org/10.3390/w12041170
Submission received: 9 March 2020 / Revised: 1 April 2020 / Accepted: 15 April 2020 / Published: 19 April 2020

Abstract

:
The spatiotemporal variation in precipitation is an important part of water cycle change, which is directly associated with the atmospheric environment and climate change. The high-resolution spatiotemporal change of precipitation is still unknown in many areas despite its importance. This study analyzed the spatiotemporal variation in precipitation in Beibu Gulf, South China, during the rainy season (from April to September) in the period of 1961–2016. The precipitation data were collected from 12 national standard rain-gauge observation stations. The spatiotemporal variation in precipitation was evaluated with incidence rate and contribution rate of precipitation. The tendency of variations was analyzed using the Mann–Kendall method. The precipitation in the rainy season contributed 80% to the total annual precipitation. In general, there was an exponential decreasing tendency between the precipitation incidence rate and increased precipitation durations. The corresponding contribution rate showed a downward trend after an initial increase. The precipitation incidence rate decreased with the rising precipitation grades, with a gradual increase in contribution rate. The precipitation incidence rate and contribution rate of 7–9 d durations showed the significant downward trends that passed the 95% level of significance test. The results provide a new understanding of precipitation change in the last five decades, which is valuable for predicting future climate change and extreme weather prevention and mitigation.

1. Introduction

The Intergovernmental Panel on Climate Change (IPCC) reports emphasize the global warming [1]. The intensified human activities made serious effects on the regional and global water circulation systems, leading to frequent disasters, such as floods, droughts, and storm surges [2]. Consequently, the human society and natural ecosystems have been terribly impacted [2,3,4,5]. Precipitation is an important part of the water cycle, and scholars have focused on the evolution characteristics and patterns of precipitation in changing environment, from different time scales, such as inter-annual, annual, monthly, rainy season, non-rainy season, and various space scales, for example, global, continent, country, and river basin [6,7,8,9]. Most existing studies have focused on the total amount of rainfall, mean value, extreme value, structural change, and others [10,11,12]. The response characteristics of precipitation to the environmental factors have also been explored. The above studies have laid a foundation for regional water resources planning and management.
For demonstrating the responsiveness of precipitation to global warming, the structural variation is a better indicator than the total amount of precipitation variation [13,14]. In general, the variation in total amount of precipitation has been relatively insensitive and small due to the income and expenditure balance of water cycle in a large scale [13,14]. The precipitation distribution in the temporal scale made a large impact on regional water resources supply. For instance, enhanced heavy precipitation means the increased probability of floods or snowstorms [13,14,15,16,17], while a lack of precipitation leads to intensified drought [18,19,20,21].
The precipitation observation data in time series is important for demonstrating the variation characteristics of precipitation structure. With the advance of remote sensing (RS) technology, radar and satellite has been common in the acquisition of precipitation data. However, there are still some problems with these data [22,23,24]. For example, the data on different precipitation properties can be provided by rain-measuring radar, such as precipitation area and intensity [25,26,27,28]. However, there may be data deviation due to geographical location restriction and terrain occlusion [29,30]. In the late 1990s, Tropical Rainfall Measurement Mission (TRMM) was launched with the world’s first satellite-borne Precipitation Radar (PR), with which the precipitation data in the tropical and subtropical regions can be effectively collected [31,32,33]. Based on the data of TRMM-PR, scholars have performed some studies on the structural characteristics of precipitation [34,35,36,37,38,39,40]. However, due to the single band, PR showed limited capacity in detecting weak precipitation [41,42]. The operation of TRMM was disabled in April 2015 because of fuel depletion. As an alternative, Global Precipitation Mission (GPM) was launched on 28 February 2014, carrying the second generation of satellite-borne Dual-frequency Precipitation Radar (DPR). In recent years, the data that were collected with GPM-DPR have been applied in exploring the structural characteristics of precipitation [43,44,45,46]. Existing studies proved the efficiency of GPM-DPR in sensing weak precipitation, while it was poor in detecting heavy precipitation [47,48,49].
In the past decades, scholars have studied both the regional and global variation characteristics of precipitation structure. Statistical analysis showed that the long-duration (consecutive twenty hours or more) rainstorm intensity gradually increased in the United States from 1948 to 2004, with decreased frequency [50]. The duration of rainy season increased by approximately 15–20% in most parts of Europe in 1950–2008 [51]. In the west of 60° E of Europe, the variation trend of precipitation extremes varied in different seasons in the period of 1901–2000 [52]. The data from meteorological stations also showed the spatiotemporal variations in precipitation in the Yangtze river basin [53], northwest China [54], and Beijing area, China [55], for both precipitation incidence and contribution rate. Further statistical analyses suggest that the variation tendency was different for various precipitation grades, and the urbanization levels affect the change trend of regional precipitation structure [56]. The climate model simulation showed that the change of regional precipitation extreme value was closely related to the atmospheric circulation situation [57,58,59]. Satellite data revealed a specific relation between the precipitation extreme and rising temperature [60]. Climate models showed that the global precipitation structure would be interfered with both natural factors and human activities [61].
The previous studies have shown some variations in precipitation in different temporal scales, such as inter-annual, annual, seasonal, and various spatial scales, for example, country, region, and river basin. These may be caused by the distribution of land and sea, topography, and large-scale human activities in recent decades, such as urbanization and large hydropower construction, thus introducing changes of physical and chemical properties of land surface [62,63,64].
In South China (Guangdong, Guangxi, Fujian, and Hainan), southerly winds from the ocean prevail from April to September, with abundant rainfall, while northerly winds reign from October to March of the next year, with little precipitation. The words “rainy season” and “non-rainy season” are generally applied to describe the different precipitation situations [65]. The rainy season (usually from April to September) lasts for a long period, with highly intensive rainfall. Disasters, such as floods, landslides, and mud-rock flows, happen frequently, with the consequence of serious economic losses and casualties. Therefore, it is important to study the spatiotemporal evolution characteristics of precipitation in South China during the rainy season. In the past years, several researchers have studied the precipitation in South China. However, most of these studies have focused on the variation trend of total annual precipitation [66], with teleconnection analysis [67]. Few studies have been performed to explore the specific variation of precipitation structure in the rainy season.
In order to fill the knowledge gap, this study was performed based on the daily precipitation data from meteorological observation stations in the Beibu Gulf, Guangxi, South China. The spatiotemporal variation characteristics of the precipitation structure in rainy season were analyzed, from the aspects of rainfall duration and precipitation grade. The incidence rate and contribution rate of precipitation were applied as the evaluation indices. The results will lay the foundation for predicting and guiding regional agricultural and industrial production, engineering construction, as well as disaster prevention and mitigation.

2. Materials and Methods
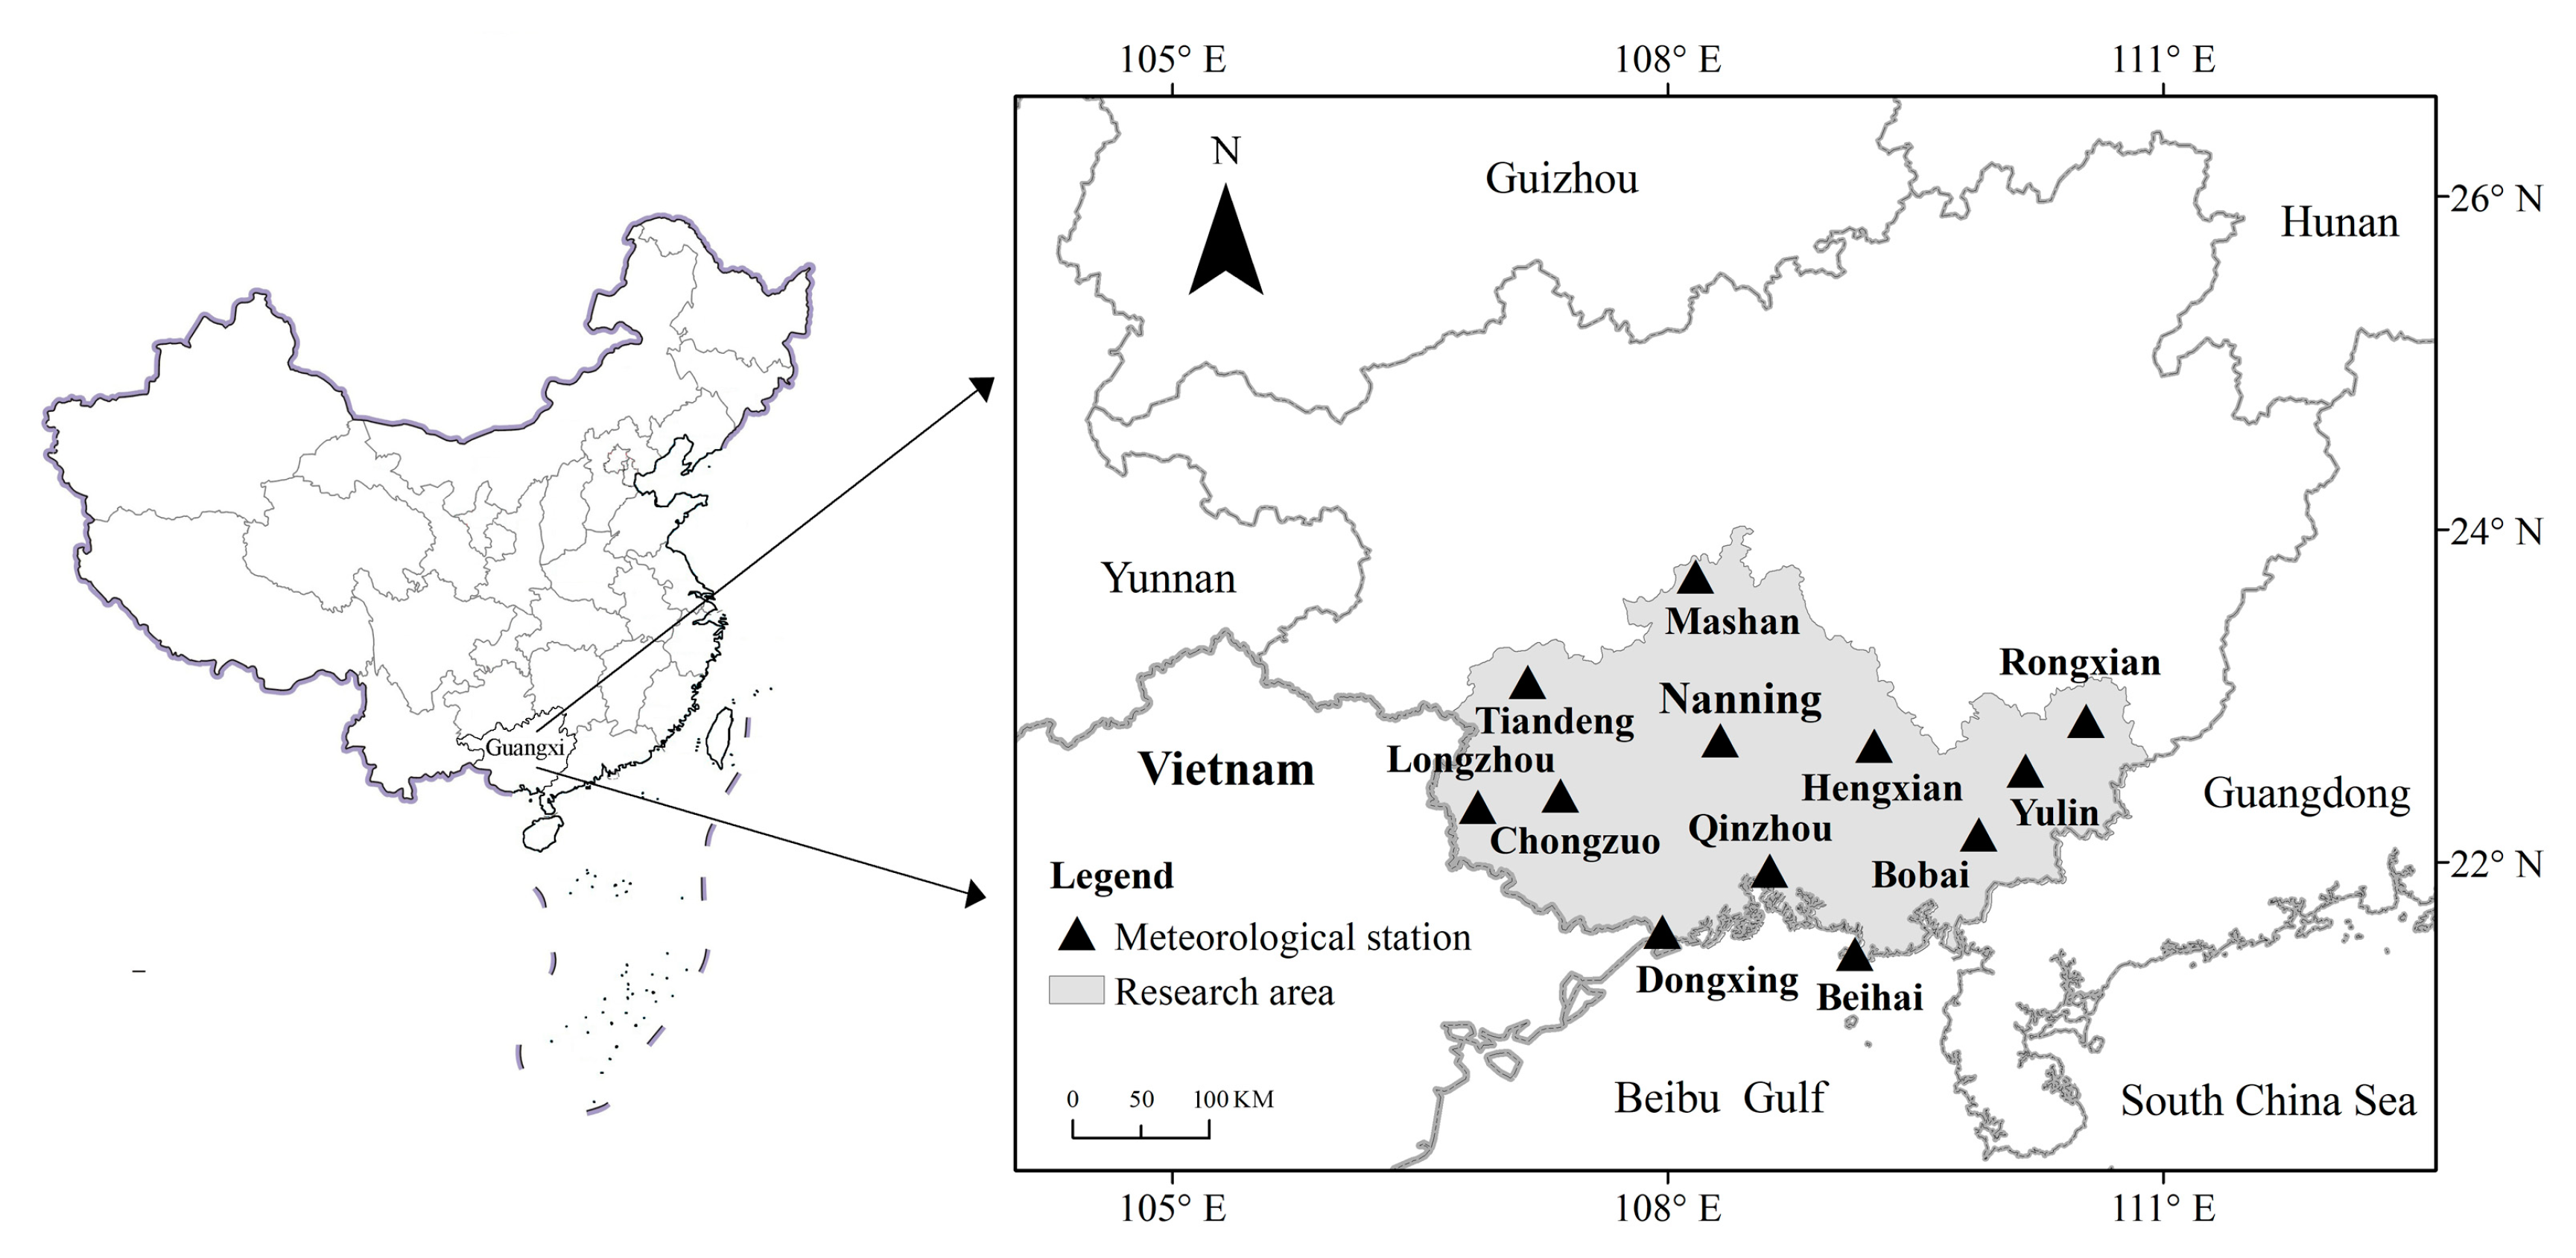
2.1. Study Area

The Beibu Gulf was in the southwest end of coastal area of China (Figure 1) with subtropical monsoon climate. In the northwest part of the region, there is the Xijiang River, a tributary of the Pearl River. In the southeast part, there are Nanliujiang River, Qinjiang River, and Beilun River, and they all flow into the ocean. The region is rich in precipitation, with uneven distribution, and drought and waterlogging occur frequently. Beibu Gulf consists of six prefecture-level cities in Guangxi province: Nanning, Beihai, Qinzhou, Fangcheng, Yulin and Chongzuo. The total area of Beibu Gulf is approximately 72,800 km2, with more than 23,000,000 permanent residents by the end of 2018. Beibu Gulf is in the connection area of South China, Southwest China, and Association of Southeast Asian Nations (ASEAN) economic circle. It is the only coastal area in the west China, which is also the existing ocean channel between China and ASEAN countries. Beibu Gulf shares borders with these ASEAN countries, thus enjoying obvious location superiority and the important strategic position [68]. In the last four decades, under the influence of China’s the Reform and Opening-Up Policy, rapid economic development has occurred in most parts of China’s coastal areas, except for Beibu Gulf. In the 1980s, the regional economic development almost stopped due to the Sino-Vietnam War. In the 1990s, border trade in the region began to develop as Sino-Vietnam diplomatic relations gradually normalized. In 2010, China and ASEAN formally established the China-ASEAN Free Trade Area. Afterwards, the development of the Beibu Gulf has become a national strategy. This region has been regarded as an important international economic cooperation zone, opening to ASEAN for potential cooperation. In recent years, the Beibu Gulf is embracing the new development opportunities under the support of Chinese government’s the Belt and Road Initiative [69].

2.2. Data

Daily precipitation data were collected from 12 national standard rain-gauge observation stations in the Beibu Gulf, including Longzhou (LZ), Tiandeng (TD), Chongzuo (CZ), Dongxing (DX), Mashan (MS), Nanning (NN), Qinzhou (QZ), Beihai (BH), Hengxian (HX), Bobai (BB), Yulin (YL), and Rongxian (RX) (Figure 1). All of the stations continuously collected daily precipitation data, covering the duration from 1961 to 2016. The precipitation data were obtained from the National Climate Center (NCC) of the China Meteorological Administration (CMA). There are two stations containing missing observation data. Both stations had less than 0.1% of missing values. The durations of continuous gaps were mainly one day. The missing data were replaced by the average values of neighbouring days. This gap filling method has little influence on the result [70]. The data were checked with strict quality control and three aspects inspection (reliability, consistency, representativeness) inspection, showing good integrity.

2.3. Index Definition

This study focused on the spatiotemporal variation characteristics of the precipitation structure in the rainy season. Based on previous studies and the World Meteorological Organization (WMO) recommendations [51,52,71,72], the comparison of different indices indicates the suitability of rainfall duration and precipitation grade for the current study. When the daily precipitation equals to or exceeds 0.1 mm, it means the effective precipitation, according to the relevant provisions of the meteorological department [72,73]. Similar to previous studies [51,52,71,72], the precipitation duration was defined as the number of consecutive days for the precipitation events (daily rainfall ≥ 0.1 mm) from the beginning to the end. The precipitation durations were divided into ten categories: 1 d, 2 d, 3 d, 4 d, 5 d, 6 d, 7 d, 8 d, 9 d, and ≥ 10 d. In addition, the precipitation events were classified according to the daily precipitation amount [74], e.g. light rain (0.1 mm ≤ daily rainfall < 10.0 mm), moderate rain (10.0 mm ≤ daily rainfall < 25.0 mm), heavy rain (25.0 mm ≤ daily rainfall < 50.0 mm), and torrential rain (daily rainfall ≥ 50.0 mm). The WMO and the World Climate Research Program (WCRP) have jointly established the Expert Team on Climate Change Detection and Indices (ETCCDI). ETCCDI defined 27 representative climate indices (including 16 temperature indices and 11 precipitation indices), among which the CWD (consecutive wet days) index was a description of such precipitation events. CWD has been widely used in the studies of climate events [51,52,71,72].
The variation characteristics of the precipitation in the rainy season of the Beibu Gulf were comprehensively evaluated with two indices defined in this study: the precipitation incidence rate and precipitation contribution rate [53,55].
The precipitation incidence rate (W) was defined as the ratio of occurrence frequency of a specific precipitation event to the total frequency of all precipitation events:
W = (n/N) × 100%
where n is frequency of a specific precipitation event and N is the total frequency of all precipitation events.
The precipitation contribution rate (M) was defined as the ratio of precipitation amount of a specific precipitation event to the total precipitation amount of all precipitation events:
M = (d/D) × 100%
where d is precipitation amount in a specific precipitation event and D is the total precipitation amount of all precipitation events.
The Mann–Kendall test (MK) was applied to evaluate the significance of the variation trends of the incidence rate and contribution rate of various precipitation events. Mann first proposed this method [75], and then modified and improved [76]. At present, it has been widely applied in the meteorological hydrology [77], which has also been recommended by the WMO [78].

2.4. Collection of Historical Precipitation Events

Combing with the index analyses, historical precipitation events causing heavy losses in the region were summarized (Table 1).

3. Results

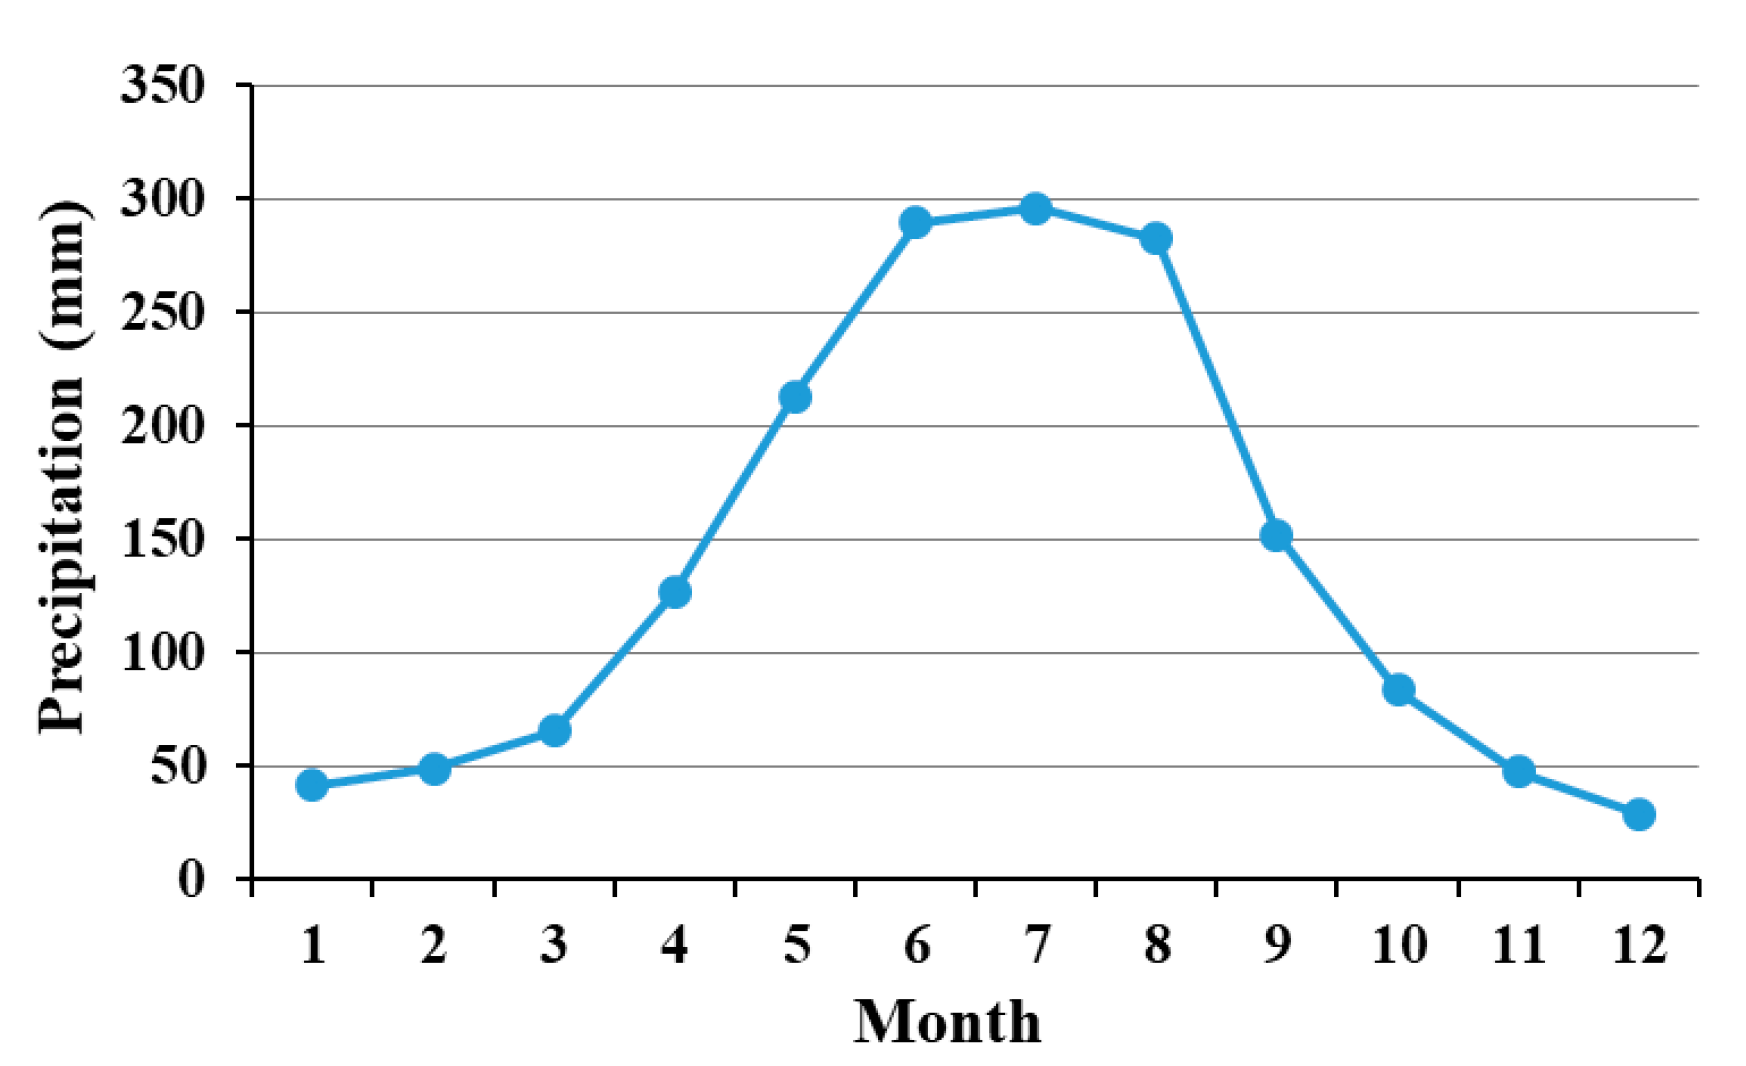
3.1. Statistics of Precipitation in Rainy Season

The average precipitation in the rainy season (from April to September) was about 1359.59 mm, accounting for 81.20% of the annual rainfall (about 1674.41 mm), according to the statistics of precipitation in the Beibu Gulf (Figure 2).

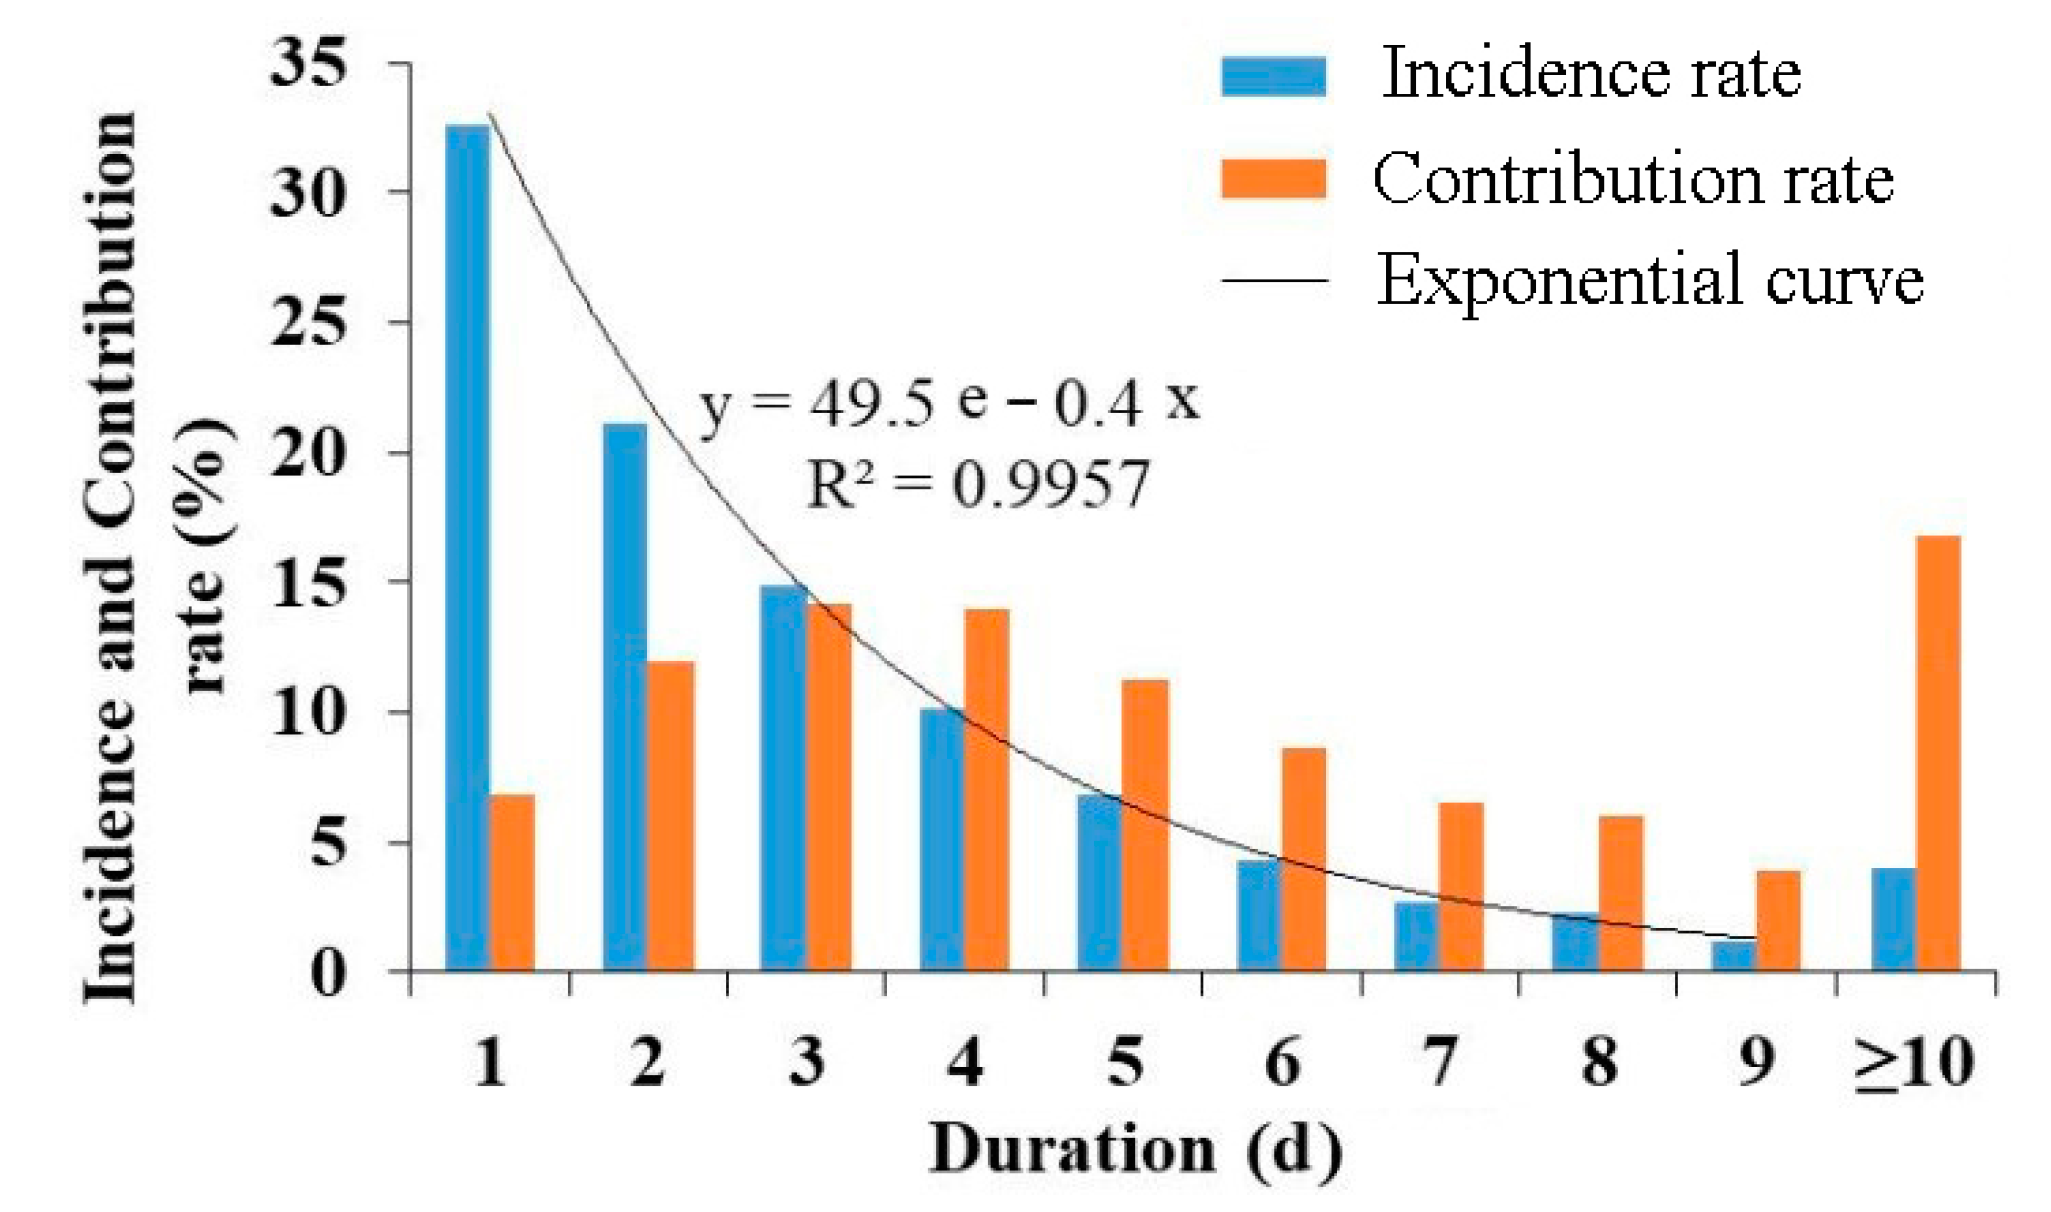
3.2. Statistical Analysis of Incidence Rate and Contribution Rate of Precipitation Durations

Figure 3 shows the incidence rates and contribution rates of precipitation events in different durations of rainy season in the Beibu Gulf. The precipitation incidence rate exponentially decreased (y = 49.5e−0.4x, R2 = 0.9957), along with the increased precipitation duration. The incidence rates of precipitation for 1 d, 2 d, 3 d, 4 d, 5 d, 6 d, 7 d, 8 d, 9 d, and ≥10 d were 32.57%, 21.12%, 14.88%, 10.14%, 6.85%, 4.33%, 2.68%, 2.24%, 1.17%, and 4.02%, respectively. However, for different durations, the variation in contribution rates was different from the variation in the incidence rates; instead, it increased firstly and decreased later along with the increased duration. When the duration ≥ 10 d, there was a significant rising tendency. For the duration of 1–9 d, the contribution rate at 3 d was the highest (14.13%), followed by 4 d (13.94%), 2 d (11.95%), and 5 d (11.26%). When the duration ≥ 10 d, the precipitation incidence rate was only 4.02%, while the contribution rate was up to 16.93%.
The incidence rates of most precipitation were distributed in the durations of 1–4 d, and the sum of incidence rate reached up to 78.71%. As for the contribution rates, the sum of precipitation for durations of 2–5 d was up to 51.28%, followed by ≥10 d (16.93%).
The probability of flood disasters caused by precipitation was analyzed. The precipitation contribution rate of duration of ≥10 d was up to 16.93%, when the time for forming runoff from rainfall was considered, the disaster probability caused by precipitation of 2–4 d obviously exceeded that of the precipitation of ≥10 d.

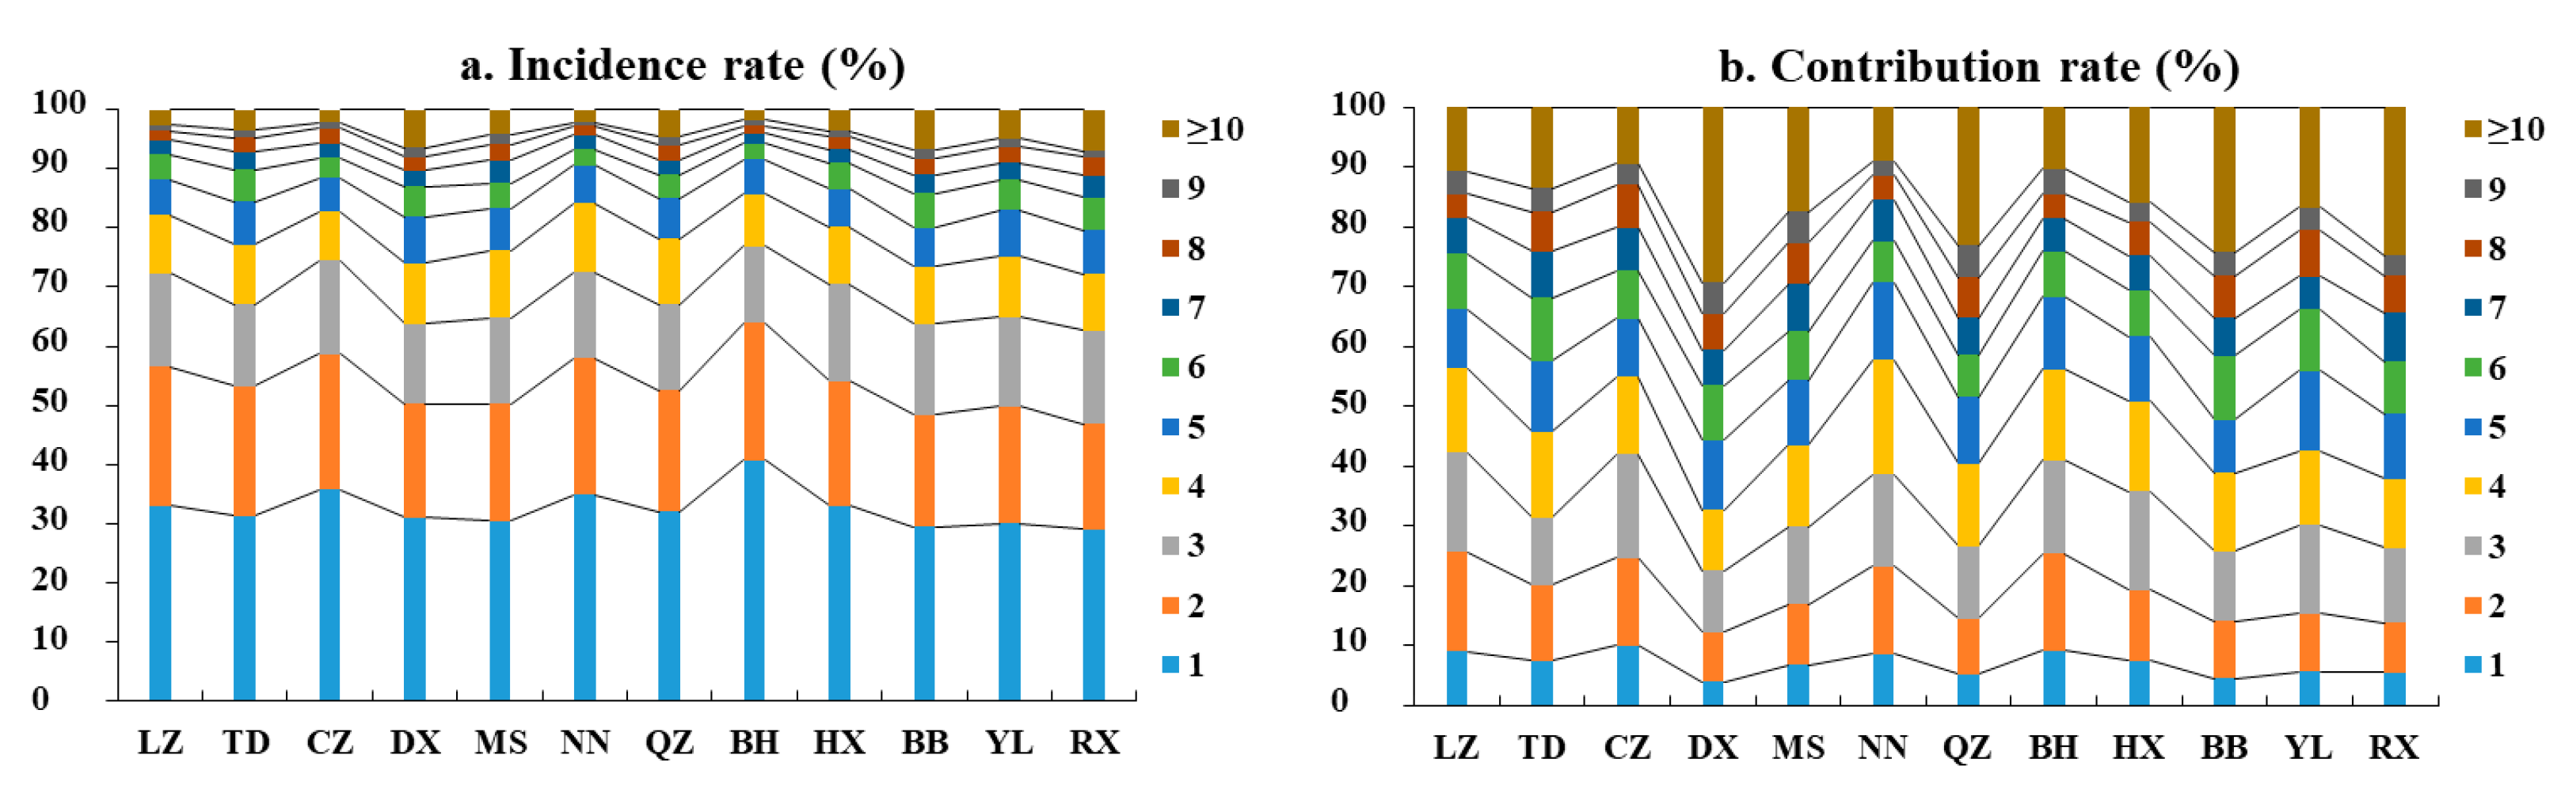
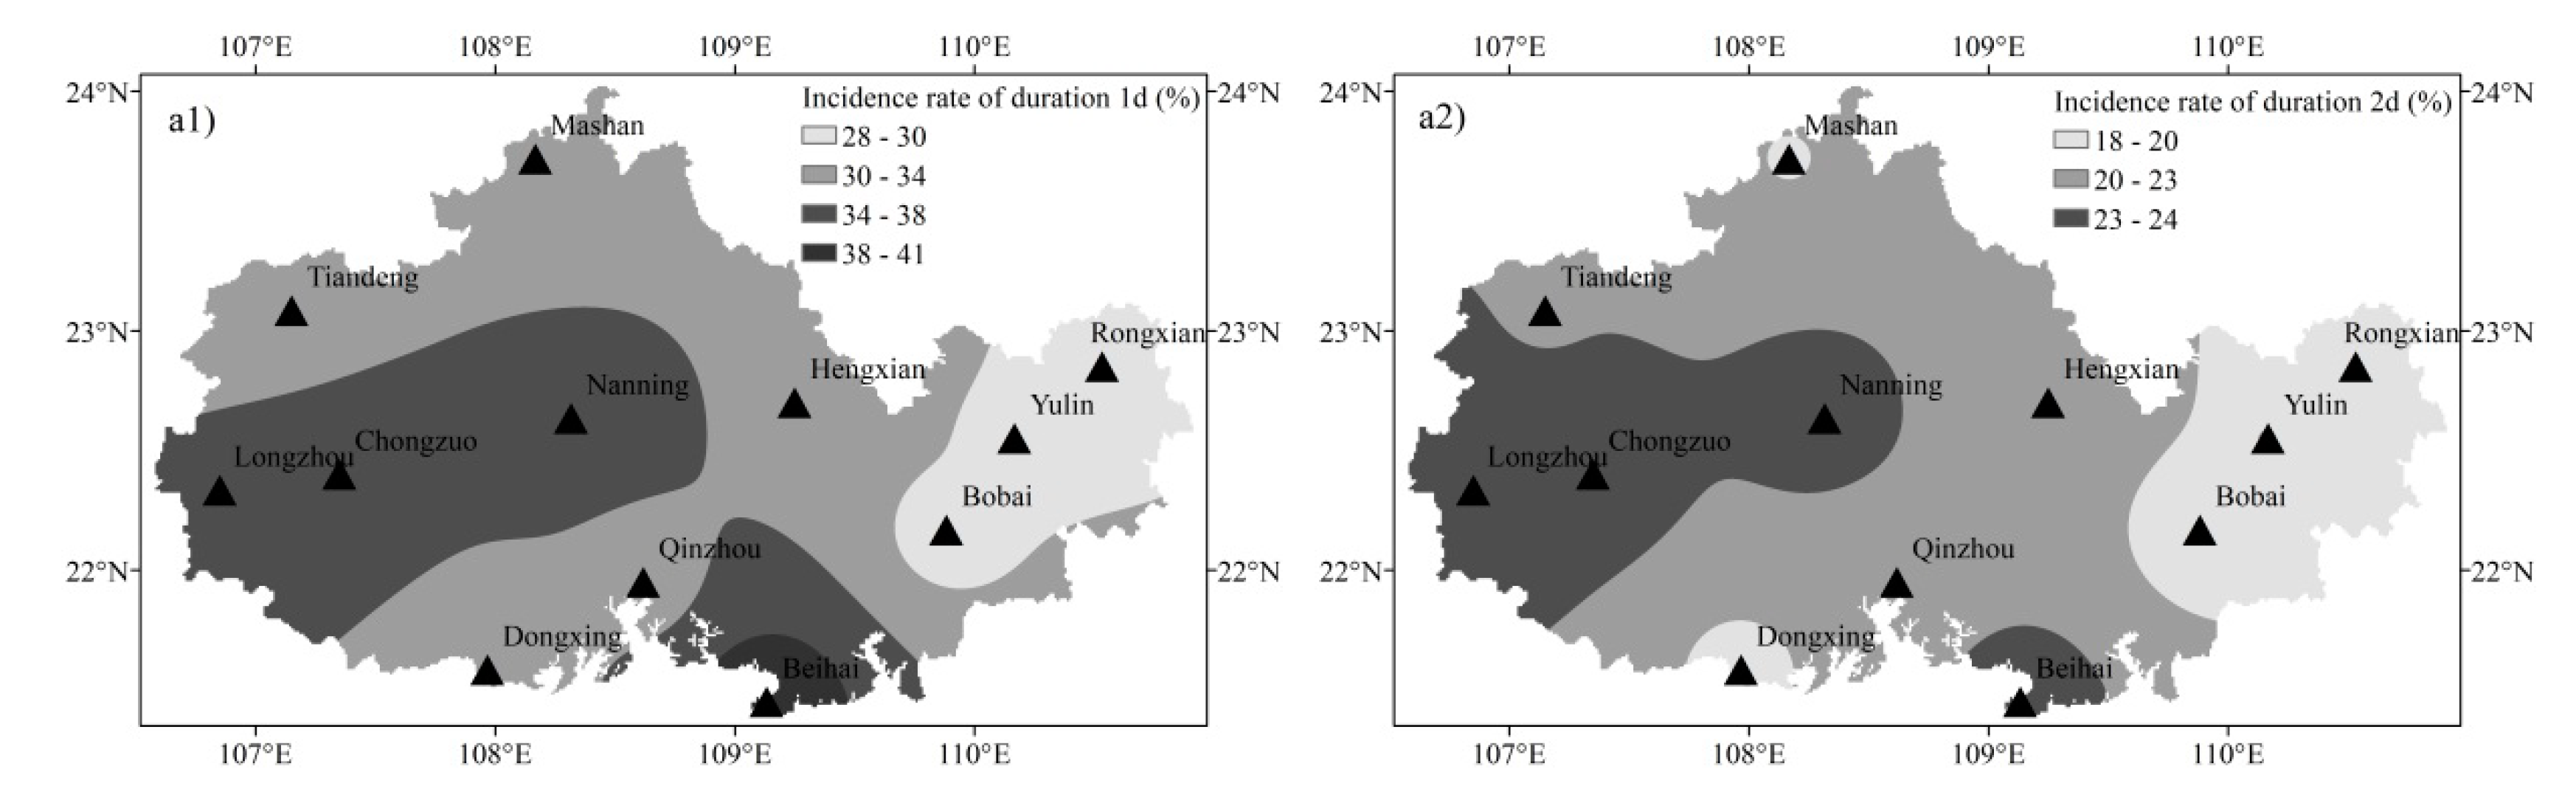
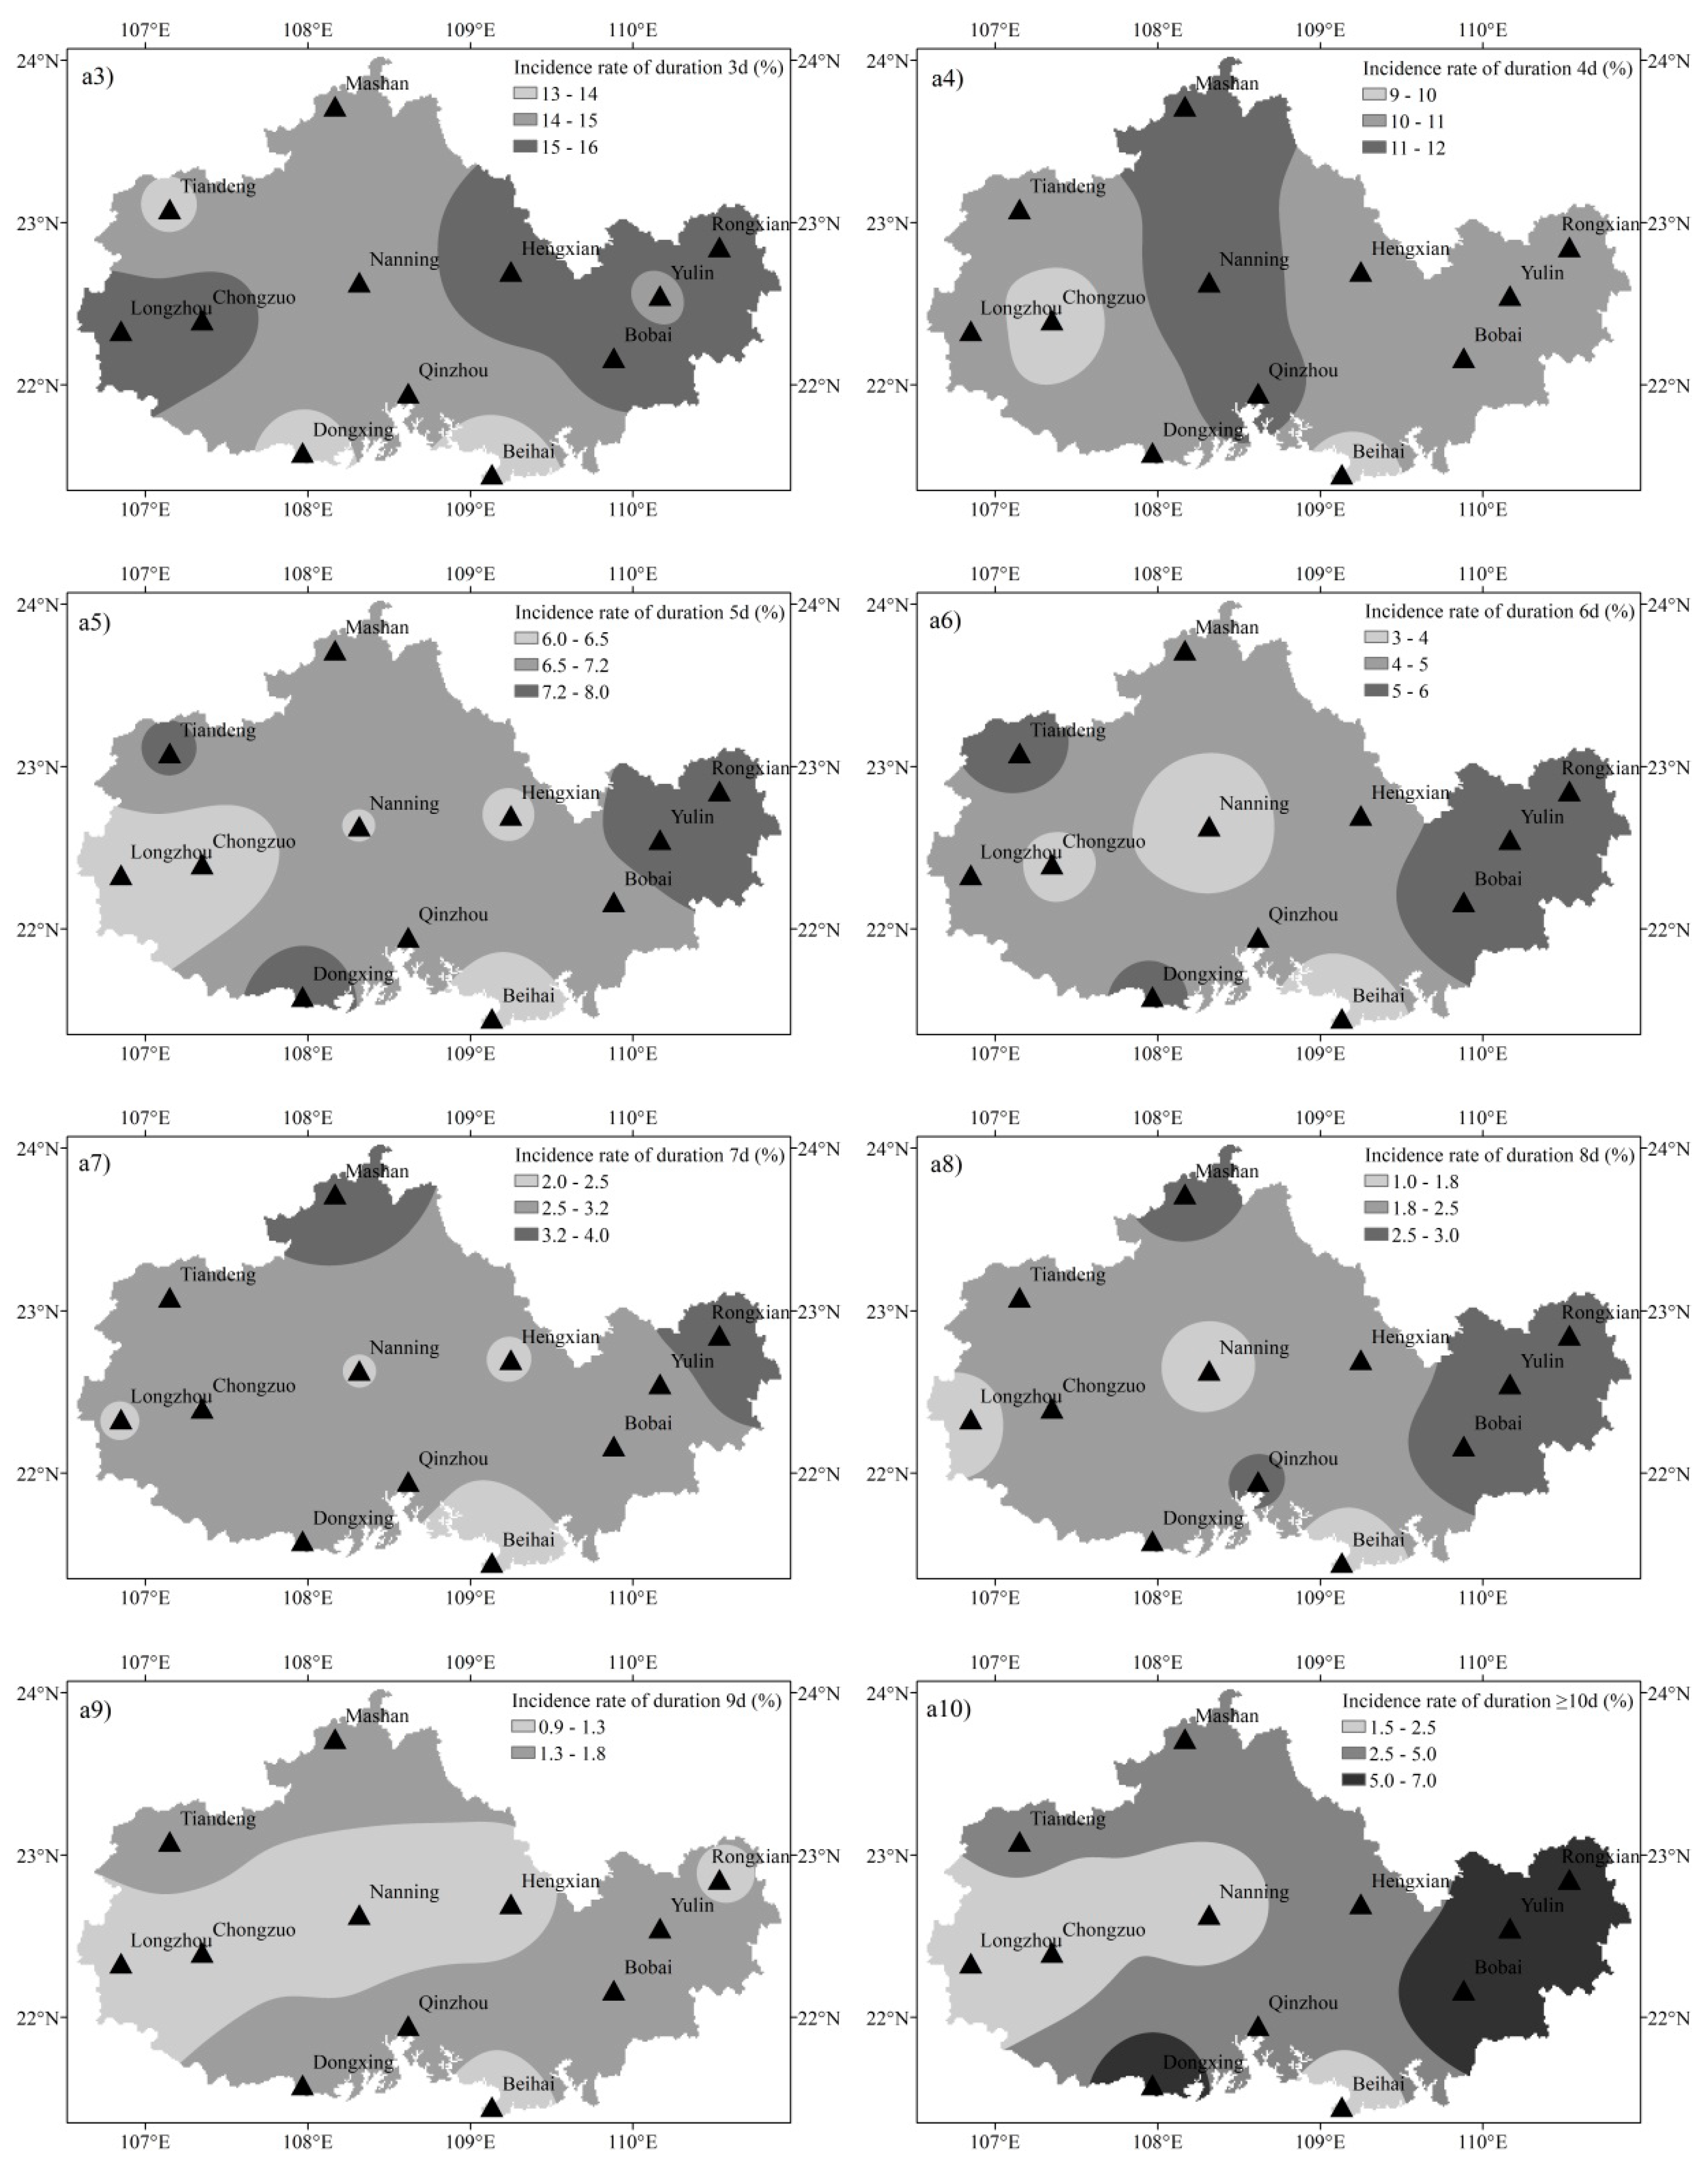
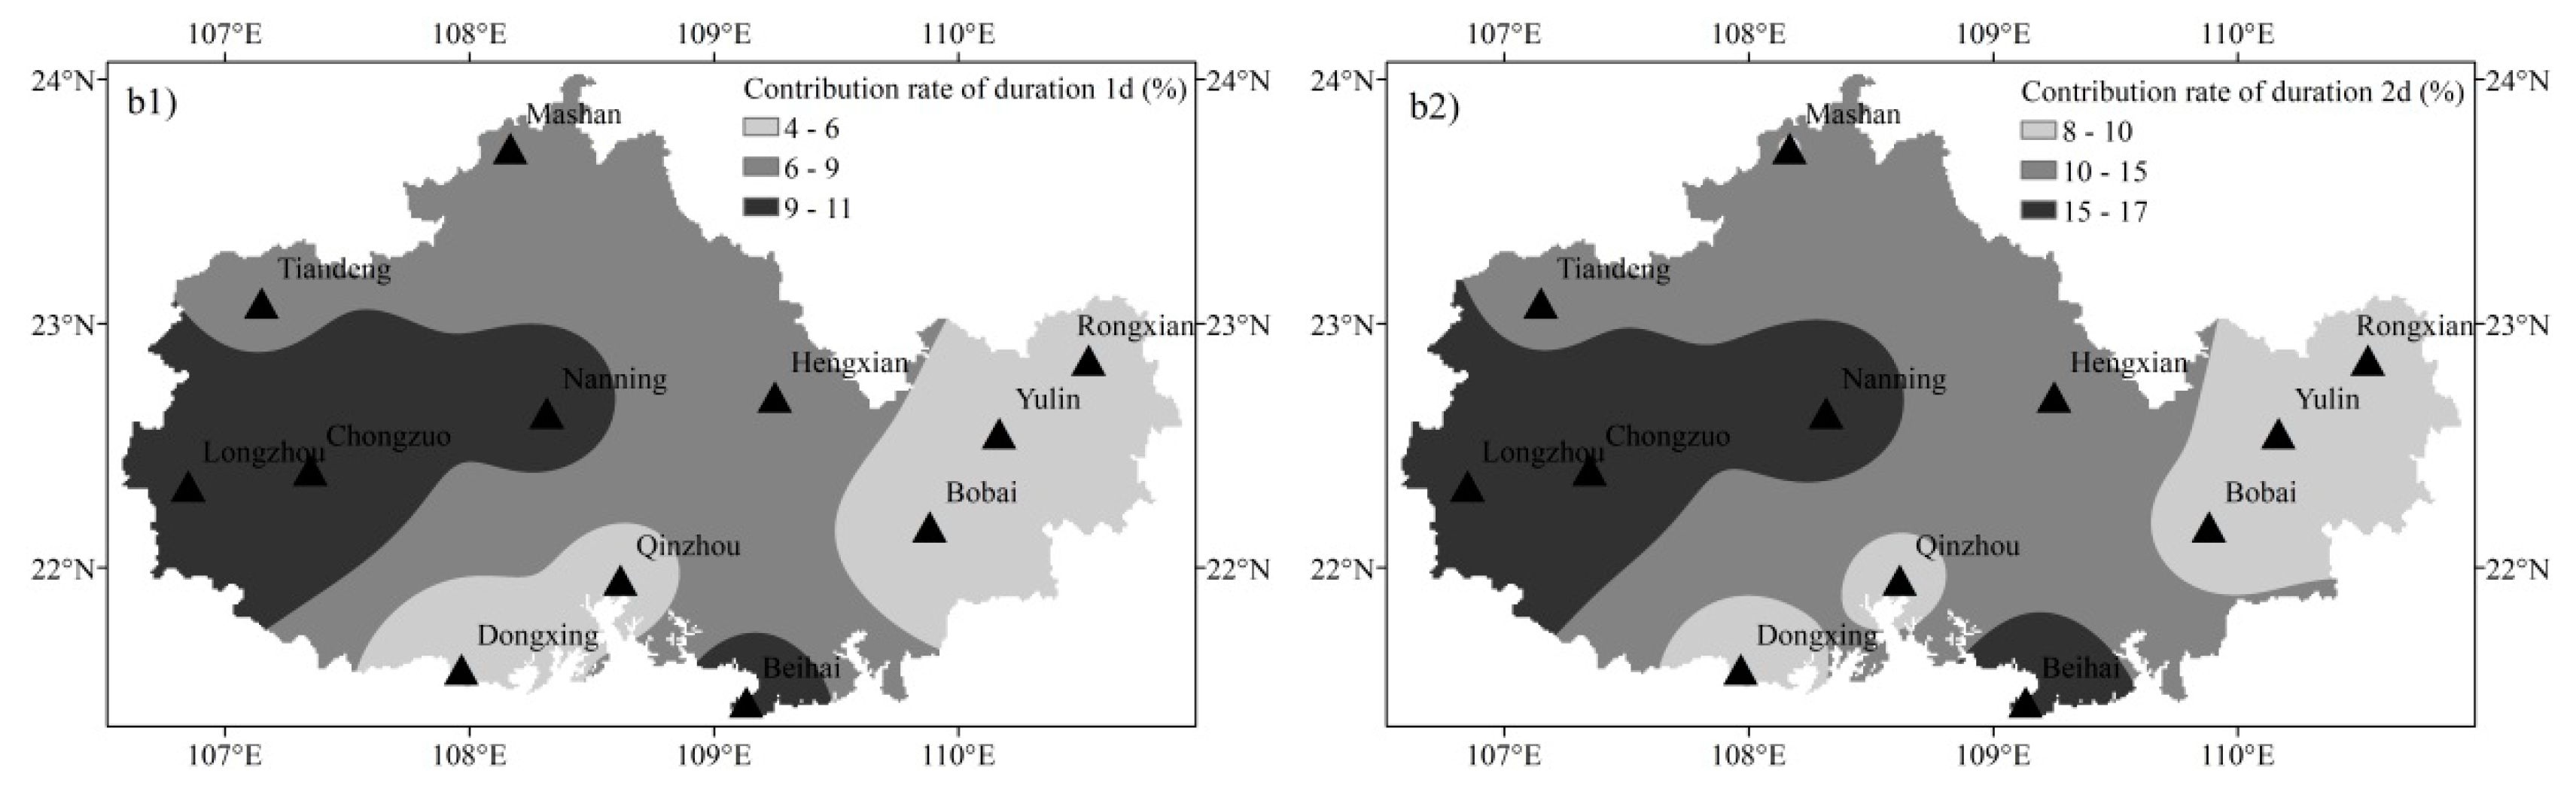
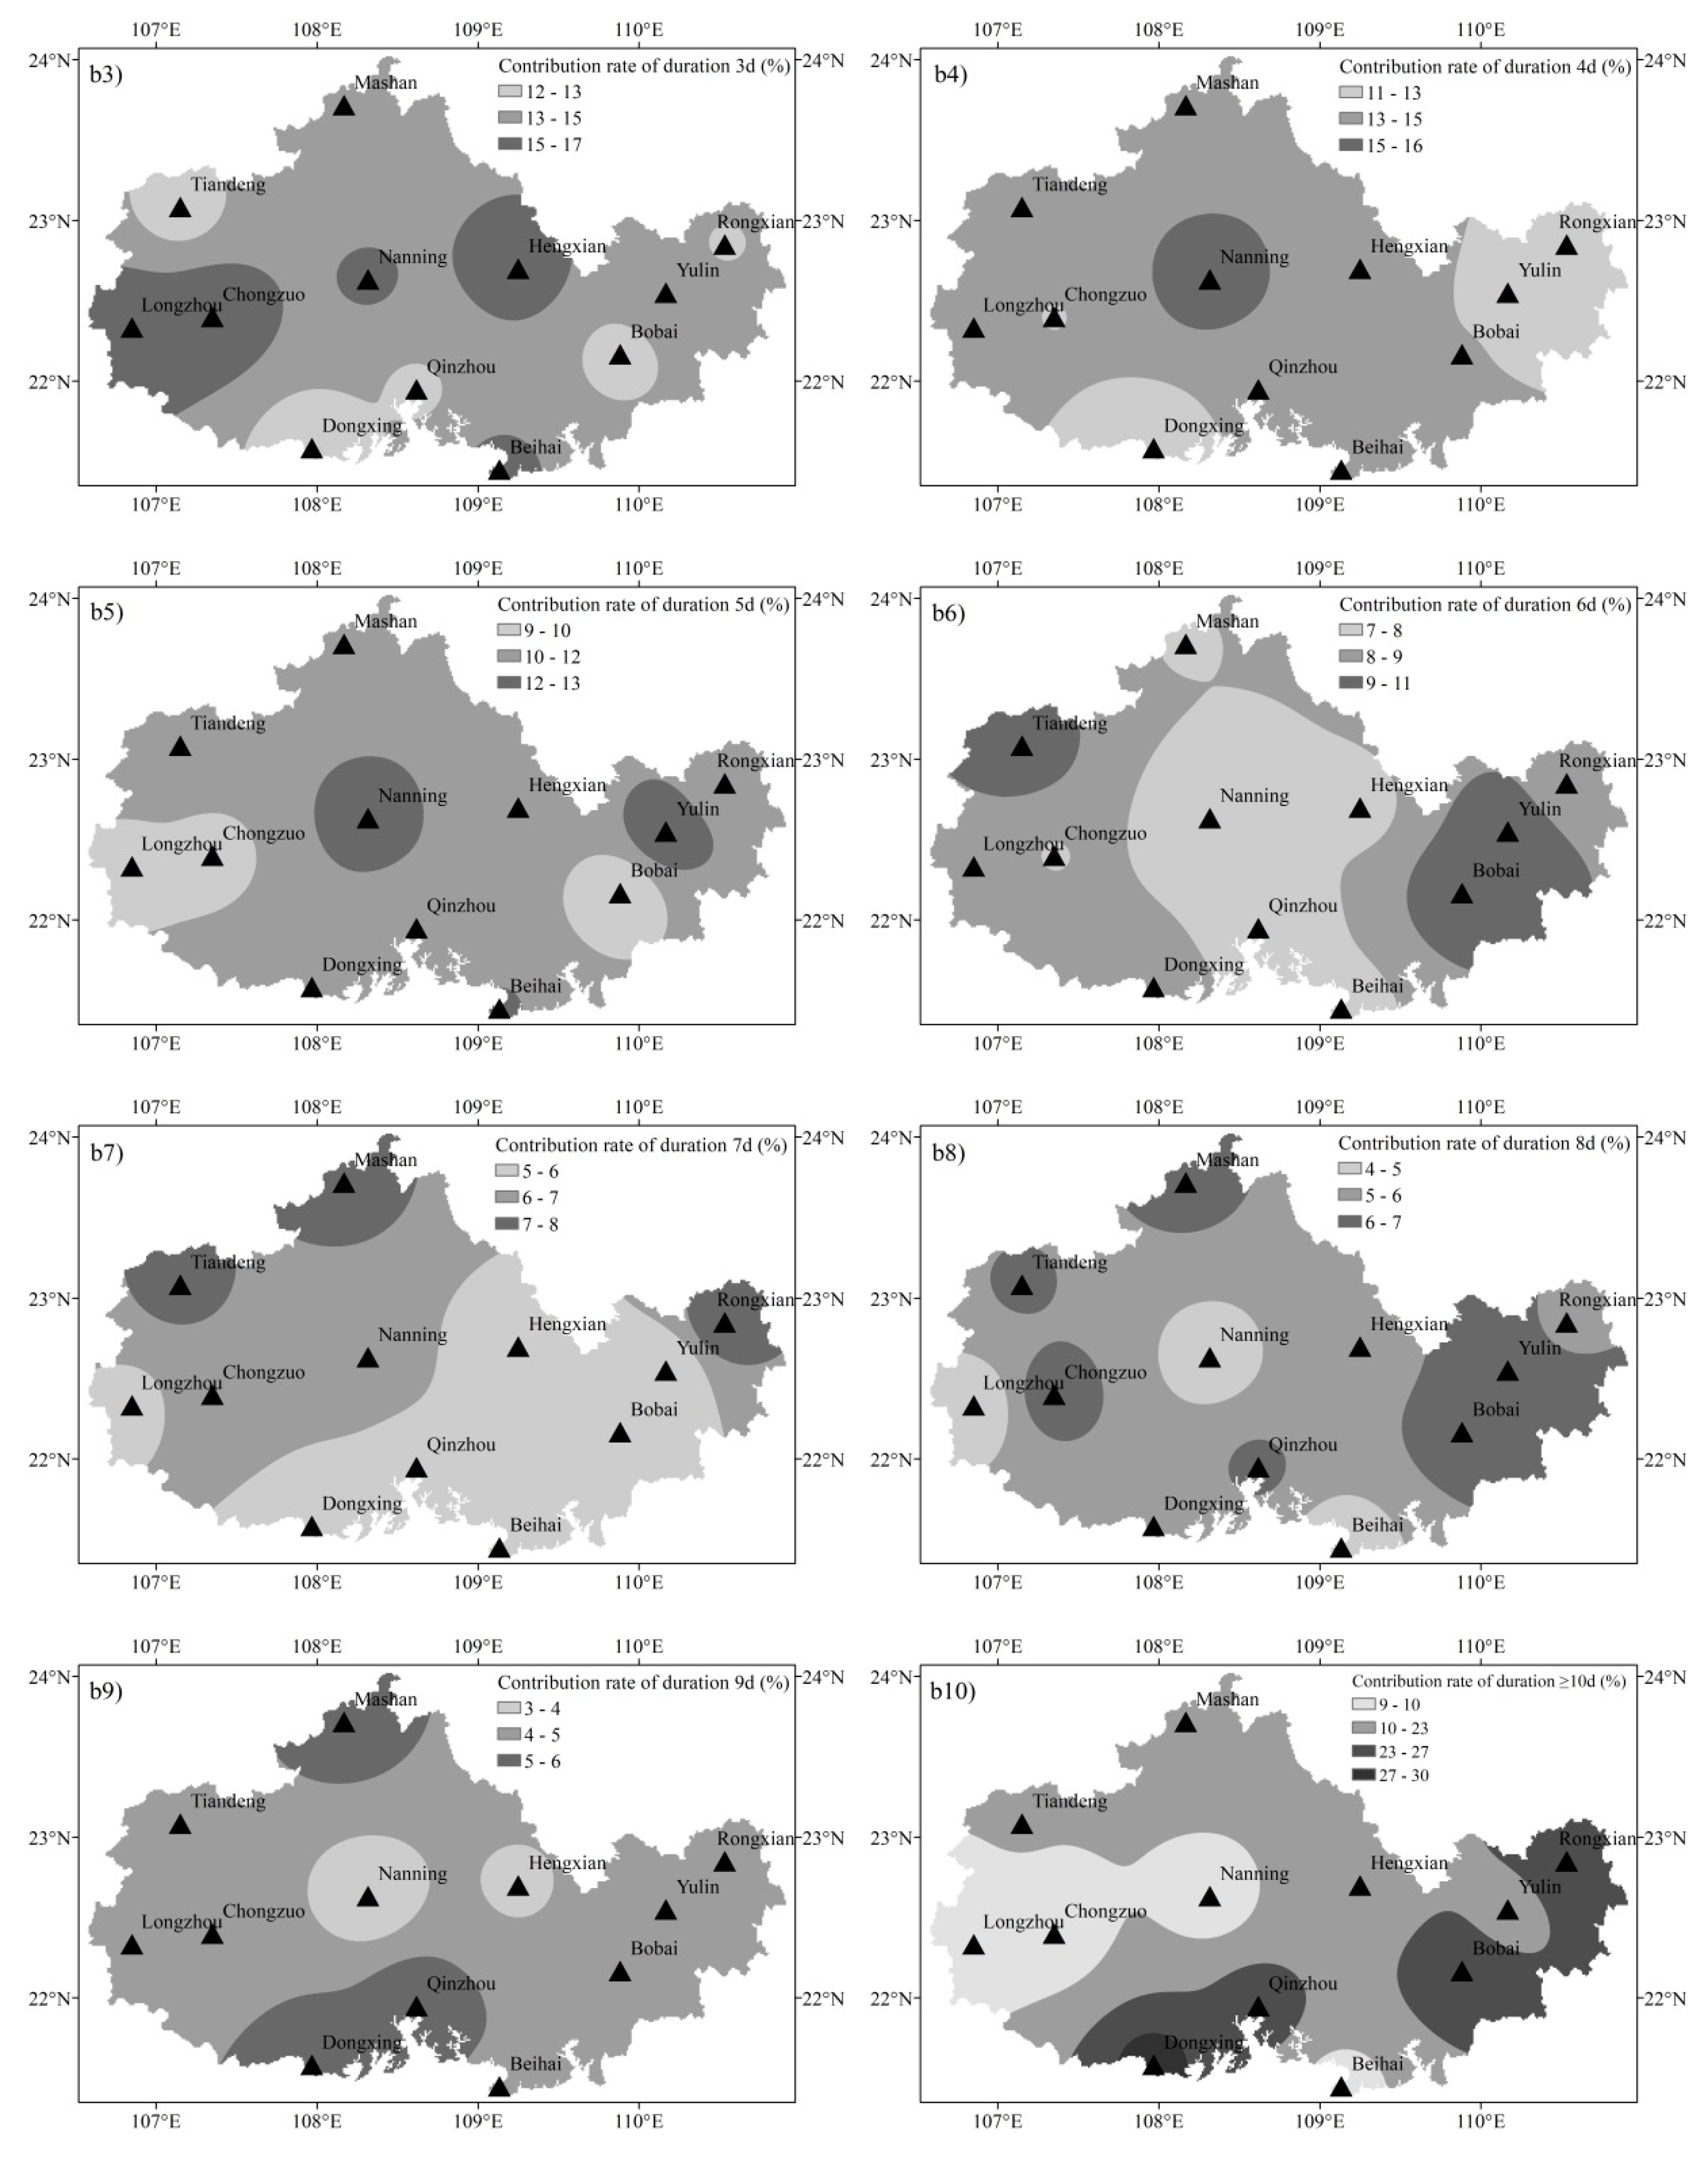
3.3. Spatial Differences of Precipitation Incidence Rates and Contribution Rates

Figure 4 shows the incidence rates and contribution rates of different precipitation duration in rainy season at 12 weather stations in the Beibu Gulf. The precipitation incidence rate of each station decreased, along with the increased precipitation duration. In terms of the incidence rates at the durations of 1 d, 2 d, and ≥10 d, there were relatively remarkable differences between regions. Little difference was observed at duration of 3–9 d, indicating no regional difference. For the 12 stations, the incidence rates of precipitation for 3–9 d ranged 13–16%, 9–12%, 6–8%, 3–6%, 2–4%, 1–3%, 1–2%, respectively. Further comparison showed that the precipitation incidence rates for 1 d and 2 d showed the basically consistent spatial variation trend (Appendix A). These results show that the precipitation incidence rates were high in Beihai (in the southern); Nanning, Chongzuo and Longzhou (in the middle and western region). The incidence rate of 1 d was over 34%, where Beihai was up to 40.71%; the precipitation incidence rate of 2 d was 23–24%. Nevertheless, the incidence rates were relatively low in Mashan (in the northern region), Dongxing (in the southern region), and Bobai, Yulin, and Rongxian (in the eastern region). The incidence rates of 1 d and 2 d were 28–30% and 18–20%, respectively. The precipitation incidence rate for ≥10 d had opposite spatial variation trend with those of 1 d and 2 d (Appendix A). The incidence rates at Dongxing, Bobai, Yulin, and Rongxian stations (in the eastern area) were relatively high (5–7%), while the incidence rates at Beihai, Longzhou, Chongzuo, and Nanning stations (in the middle and western region) were relatively low (1.5–2.5%).
At all the 12 stations, the precipitation contribution rates increased first and decreased later along with the increase in precipitation duration (Figure 4b). When the duration was ≥10 d, the precipitation contribution rate increased significantly again. Relative to the incidence rates of precipitation, the duration of each station varied largely in terms of the precipitation contribution rate. The contribution rates of all durations were compared, and they were different between 1 d, 2 d, and ≥10 d. The contribution rates for the 3–9 d durations were similar, which were 12–17%, 11–16%, 9–13%, 7–11%, 5–8%, 4–7%, and 3–6%, respectively. This result was basically consistent with the precipitation incidence rates in different durations. Further analysis showed that, for 1 d and 2 d, a similar variation tendency was observed in the precipitation incidence rate and spatial contribution rate. The contribution rate in Beihai (in the southern) and Longzhou, Chongzuo and Nanning (in middle and western) (the contribution rates for 1 d and 2 d were 9–11% and 15–17%) were markedly higher than those in Qinzhou, Dongxing, Bobai, Yulin, and Rongxian (the contribution rates of 1 d and 2 d durations were 4–6% and 8–10%). The precipitation contribution rate for the duration of ≥10 d showed opposite spatial variation tendency with those of 1 d and 2 d (Appendix B). The contribution rates of Qinzhou, Dongxing, Bobai, and Rongxian (in the eastern) were relatively higher (for example, more than 23% and the contribution rate of Dongxing was up to 29.45%), while they were relatively lower in Beihai and Longzhou, Chongzuo, and Nanning (in middle and western, 9–10%).
Longzhou, Chongzuo, and Nanning (in middle and western) and Beihai (in southern region) were more prone to short-term flood disaster, according to above spatial differences in precipitation incidence and contribution rates, especially the precipitation contribution rates. At the same time, the dry spell was longer than other regions, especially in the years with less total precipitation. In a two-day flood (29–30 August 1988), Nanning had a total precipitation of 158.1 mm, with the consequence of 400,000 people affected, eight death, more than 2000 houses damaged, 37,300 hectares of crops affected, and the direct economic loss of 130 million RMB Yuan [79]. In another two-day flood (20–21 July 1994), Beihai received 245.1 mm precipitation, causing six people dead, 325 livestock killed, 624 houses damaged, and the direct economic loss of about 350 million RMB Yuan [79]. In three seasons (spring, summer and autumn) during the period of 1961–2000, Nanning experienced the longest dry spell, followed by Chongzuo and Beihai [82].

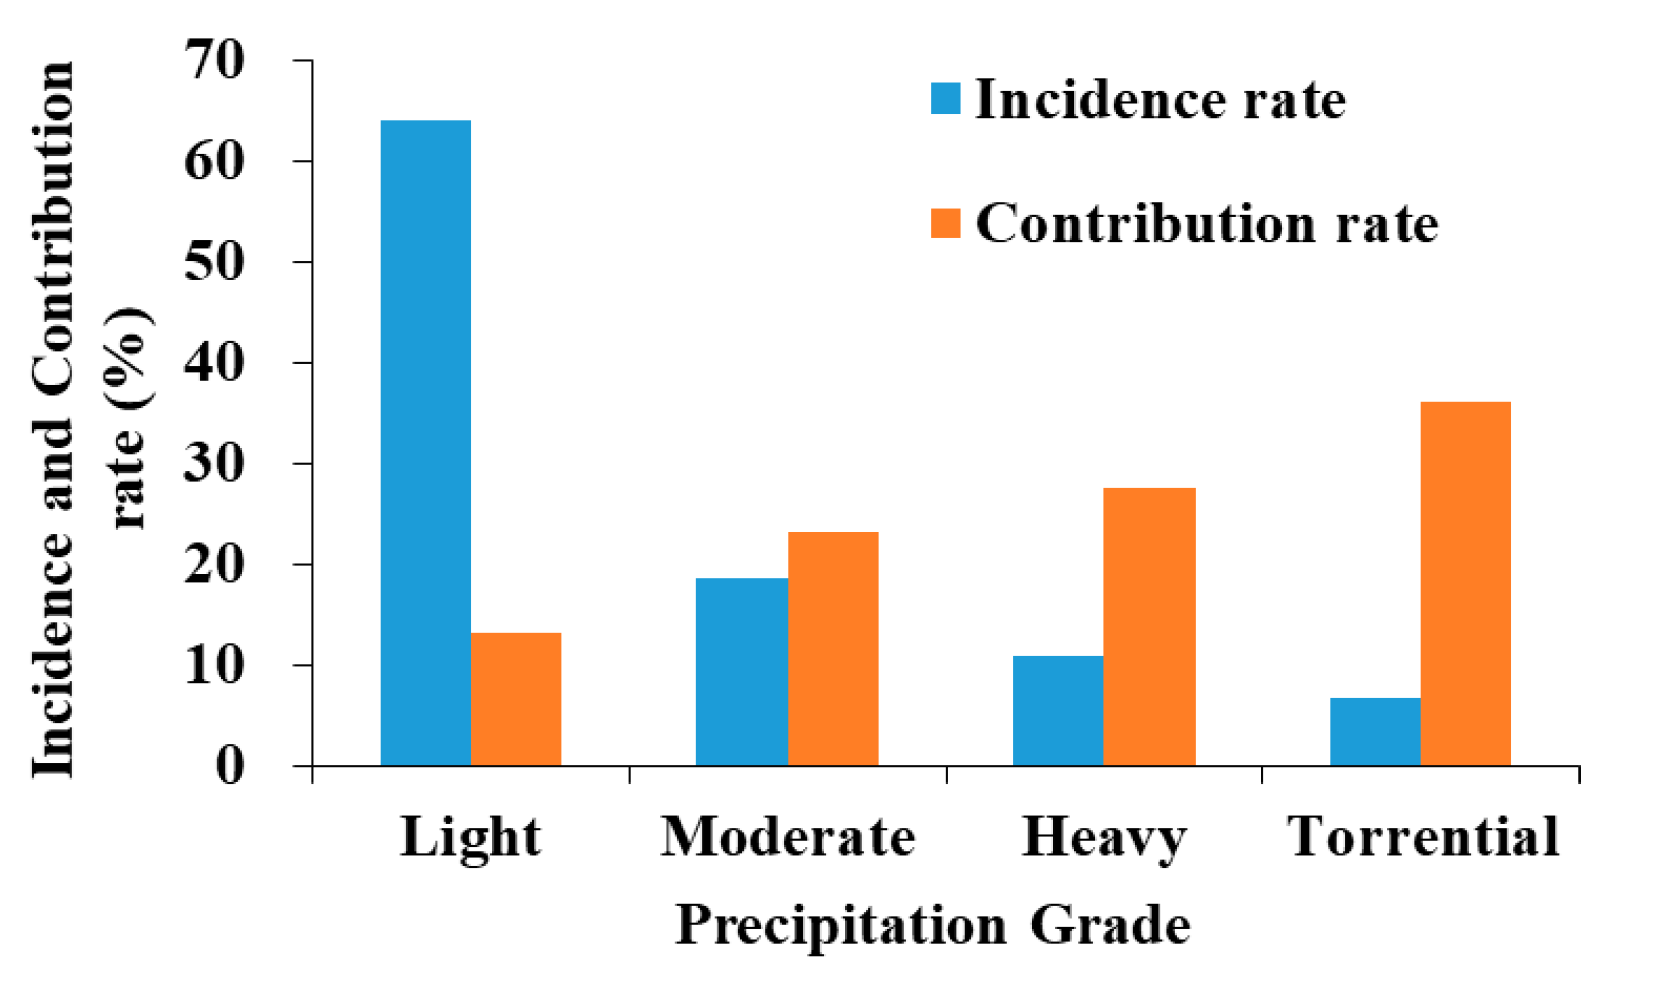
3.4. Statistic Analysis for Incidence Rate and Contribution Rate of Different Precipitation Grades

Figure 5 show the incidence rate and contribution rate of each precipitation grade during rainy season in the Beibu Gulf. With the increased precipitation grade, the incidence rate decreased while the contribution rate of precipitation increased. In terms of precipitation incidence rate, the light rain dominated, accounting for 64.03%, while the contributions of moderate rain, heavy rain, and torrential rain were only 18.55%, 10.76%, and 6.66%, respectively. In terms of the precipitation contribution rate, the light rain only accounted for 13.22%, and the contribution rates of moderate rain, heavy rain and torrential rain were 23.19%, 27.53% and 36.06%, respectively. Therefore, the dominated precipitation was light rain, and the sum of incidence rates of moderate, heavy, and torrential rain was less than 36%, but the contribution rate was up to about 87%. Precipitation in Beibu Gulf during rainy season was dominated by weak precipitation events, but the main contribution was dependent on strong precipitation events, indicating the large possibility of flood disaster and aggravated situation of regional flood.

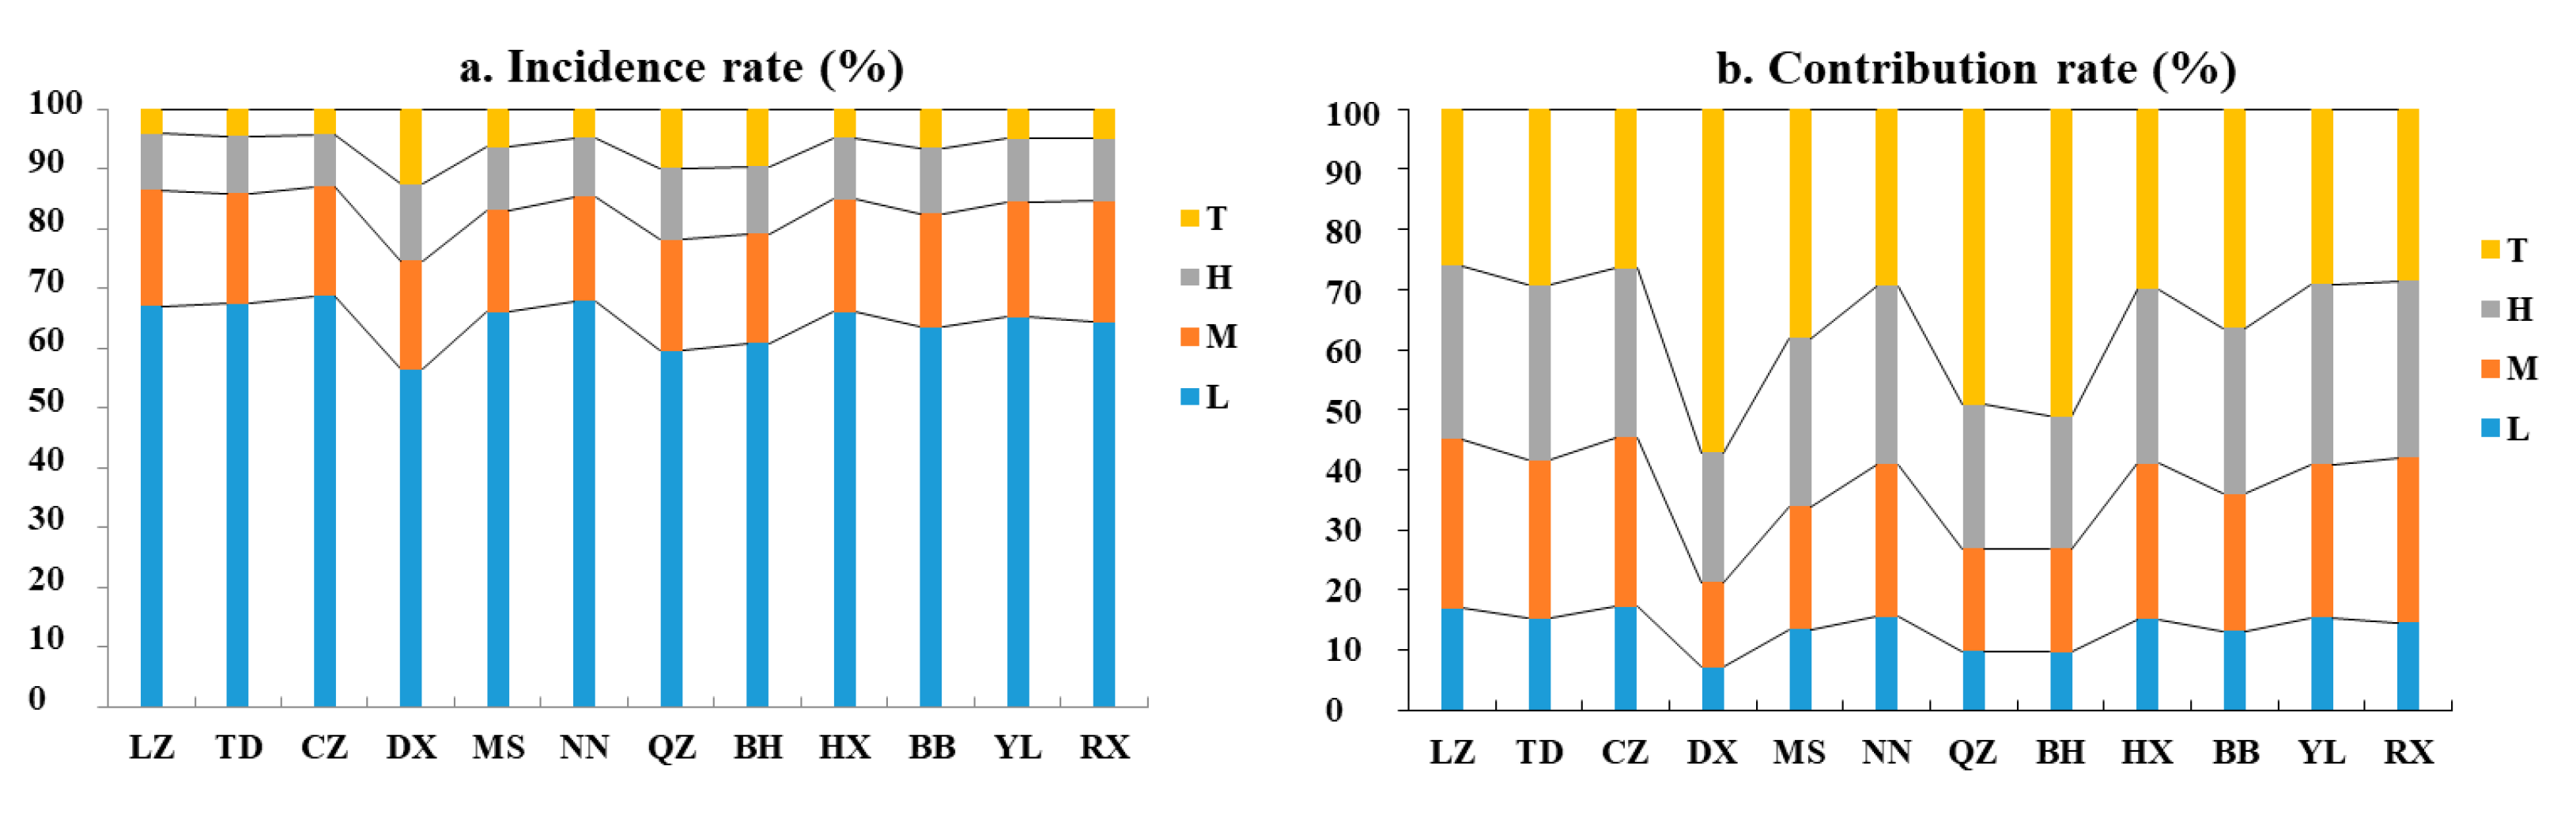
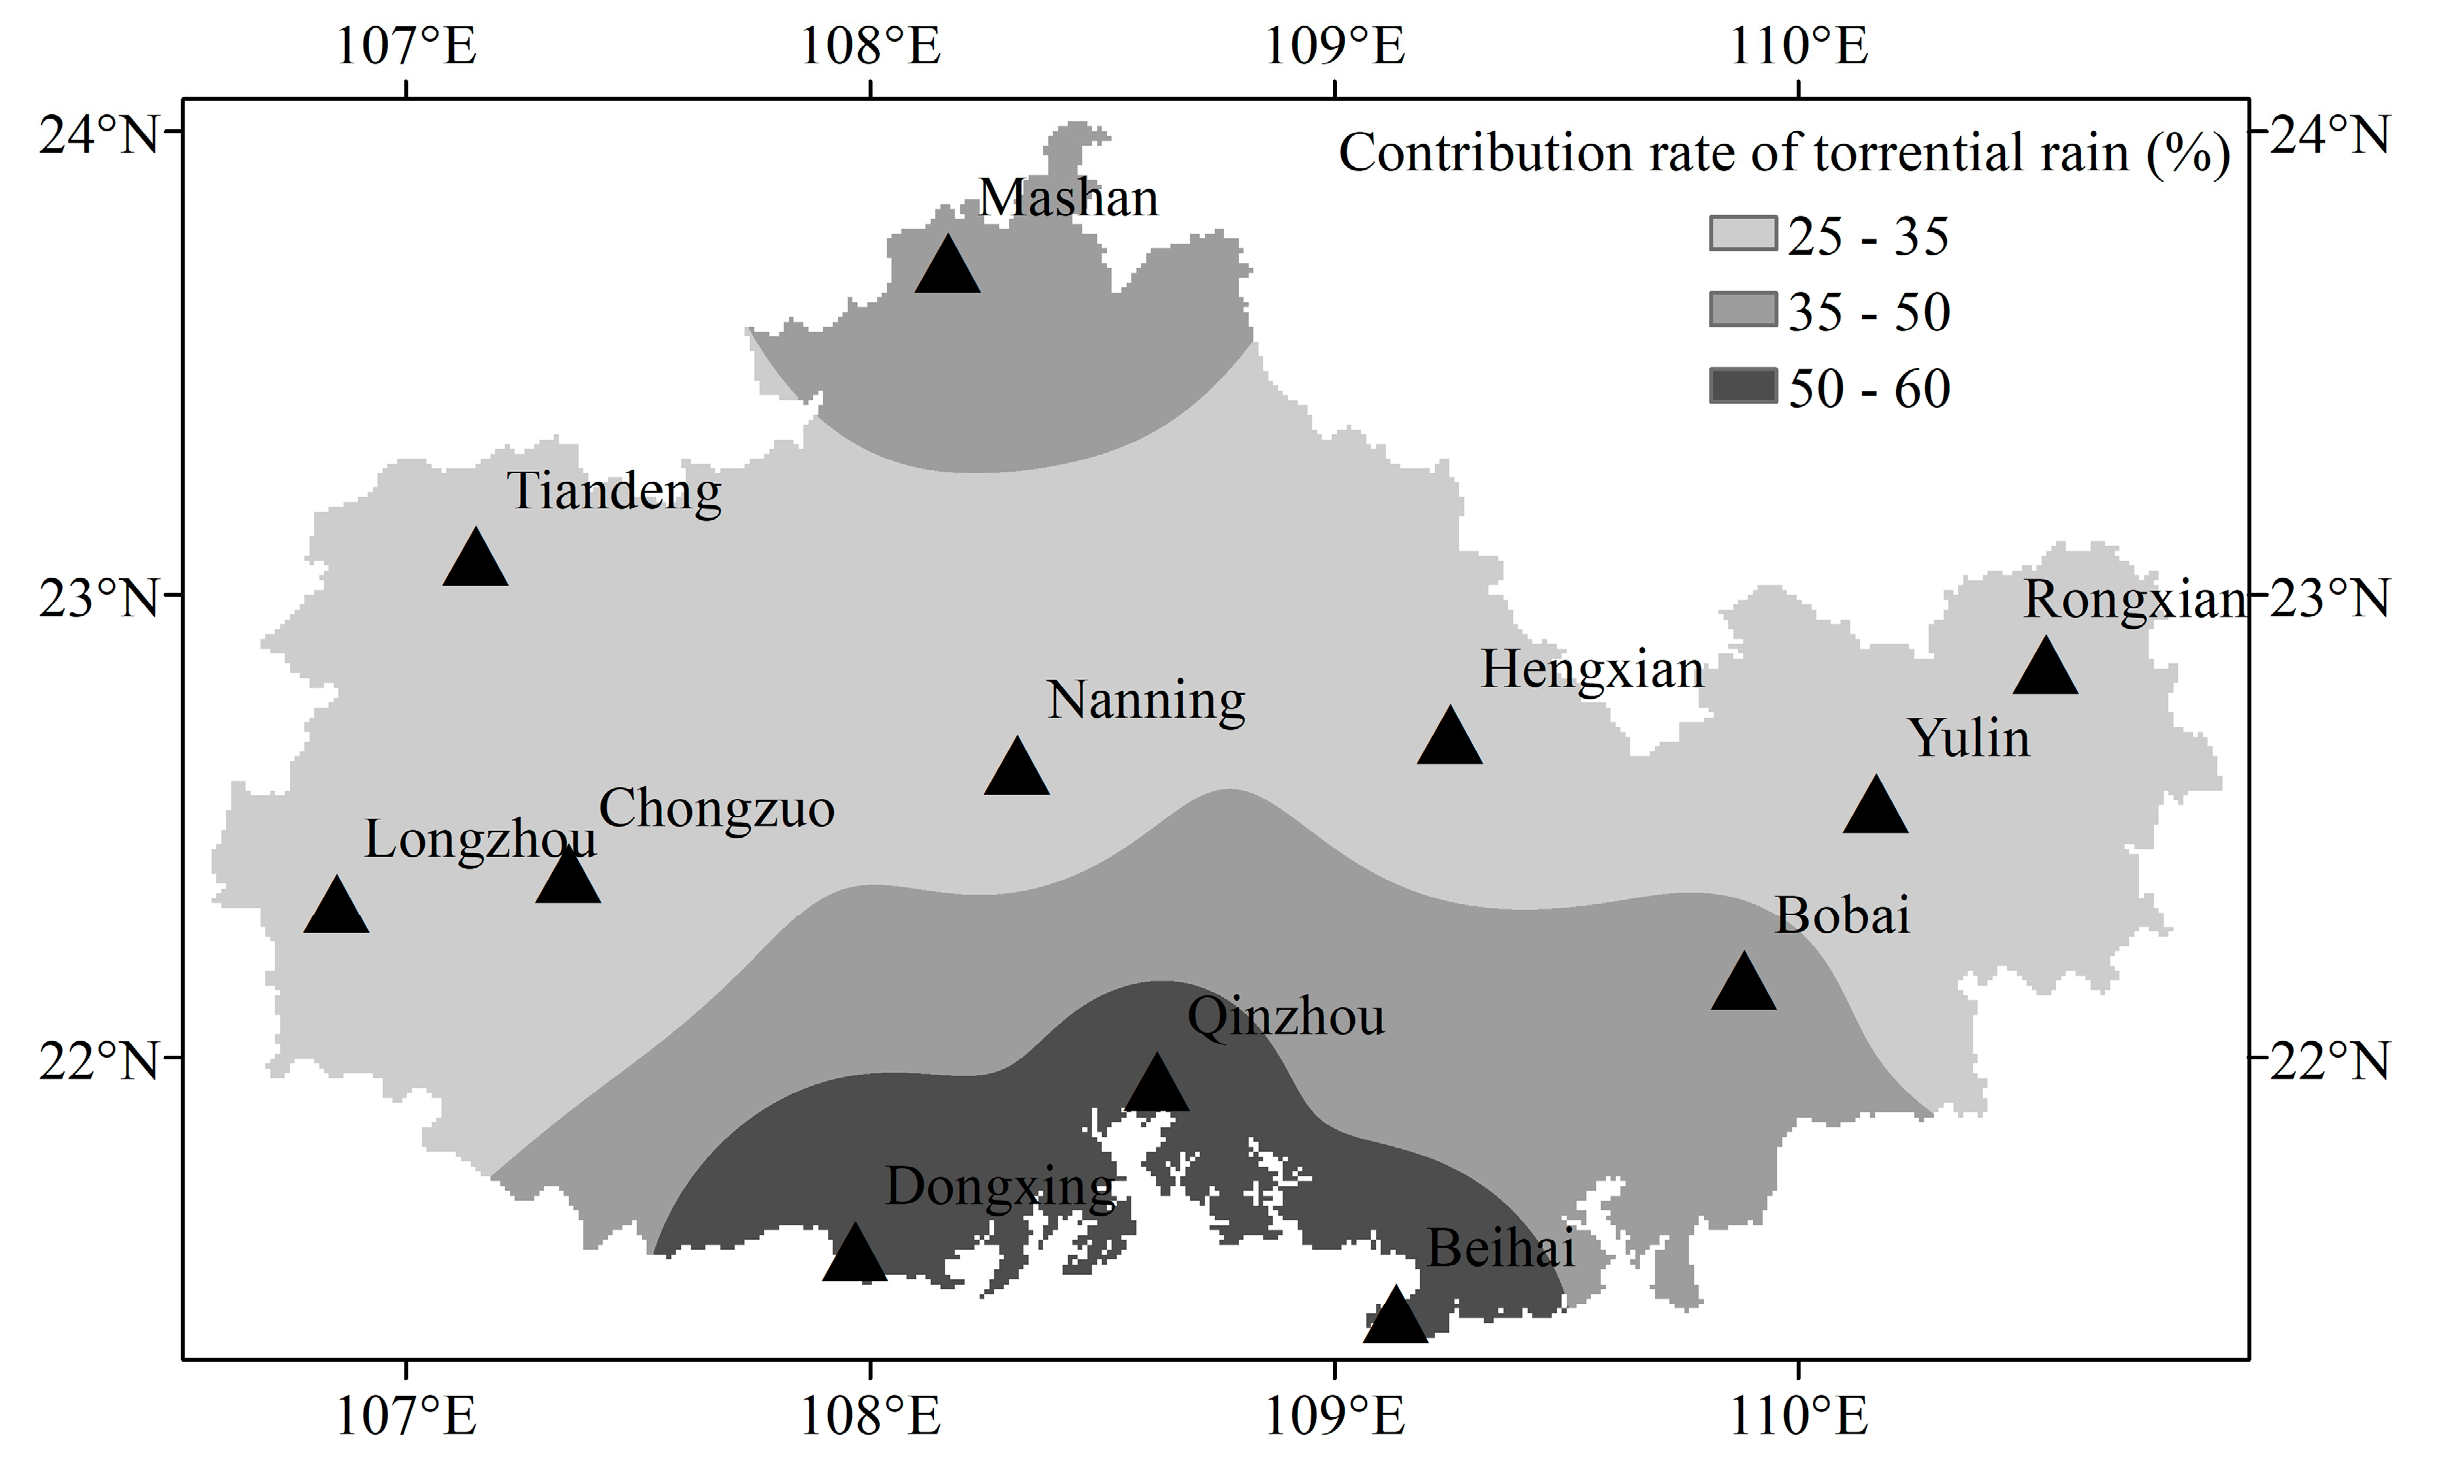
3.5. Spatial Differences of Incidence Rate and Contribution Rate of Different Precipitation Grades

Figure 6 show the incidence rate and the contribution rate of different precipitation grades at 12 stations during rainy season. All of the stations met the characteristics that the precipitation incidence rate decreased with the increased precipitation grade, and the light rain was the dominated precipitation. The incidence rates of light rain at Dongxing, Qinzhou and Beihai stations (in the southern coast area) were extremely low, whereas the incidence rates of torrential rain were relatively high. The incidence rate of precipitation at other stations were similar, with the fluctuations around the average value.
The letters along the x-axis denote names of the precipitation stations: Longzhou (LZ), Tiandeng (TD), Chongzuo (CZ), Dongxing (DX), Mashan (MS), Nanning (NN), Qinzhou (QZ), Beihai (BH), Hengxian (HX), Bobai (BB), Yulin (YL), and Rongxian (RX). The letters along the y-axis denote precipitation grades. L is Light rain, M is Moderate rain, H is Heavy rain, and T is Torrential rain.
The 12 stations showed that the contribution rates of light rain were the lowest (generally below 17%), according to the contribution rates of various precipitations grades (Figure 6b). The contribution rates of light precipitation ranged 7%–10% at Dongxing, Qinzhou, Beihai stations (in southern coastal region), being the lowest value in this region. The contribution rates of moderate rain, heavy rain, and torrential rain at Dongxing, Qinzhou, Beihai, Mashan, Bobai, and Hengxian stations showed an increasing tendency, especially at Dongxing, Qinzhou, Beihai stations, where all of the contribution rates of rainstorm were above 50%, being significantly higher than those at other stations (Figure 7). The region in the southern coast would be attacked by the strong convection weather systems, such as typhoon from the ocean, thus leading to frequent intense precipitation [83,84]. At the other six stations, the contribution rates of moderate rain and heavy rain were similar, and they all showed the characteristics that the contribution rates of moderate or heavy rain slightly exceeded that of torrential rain.

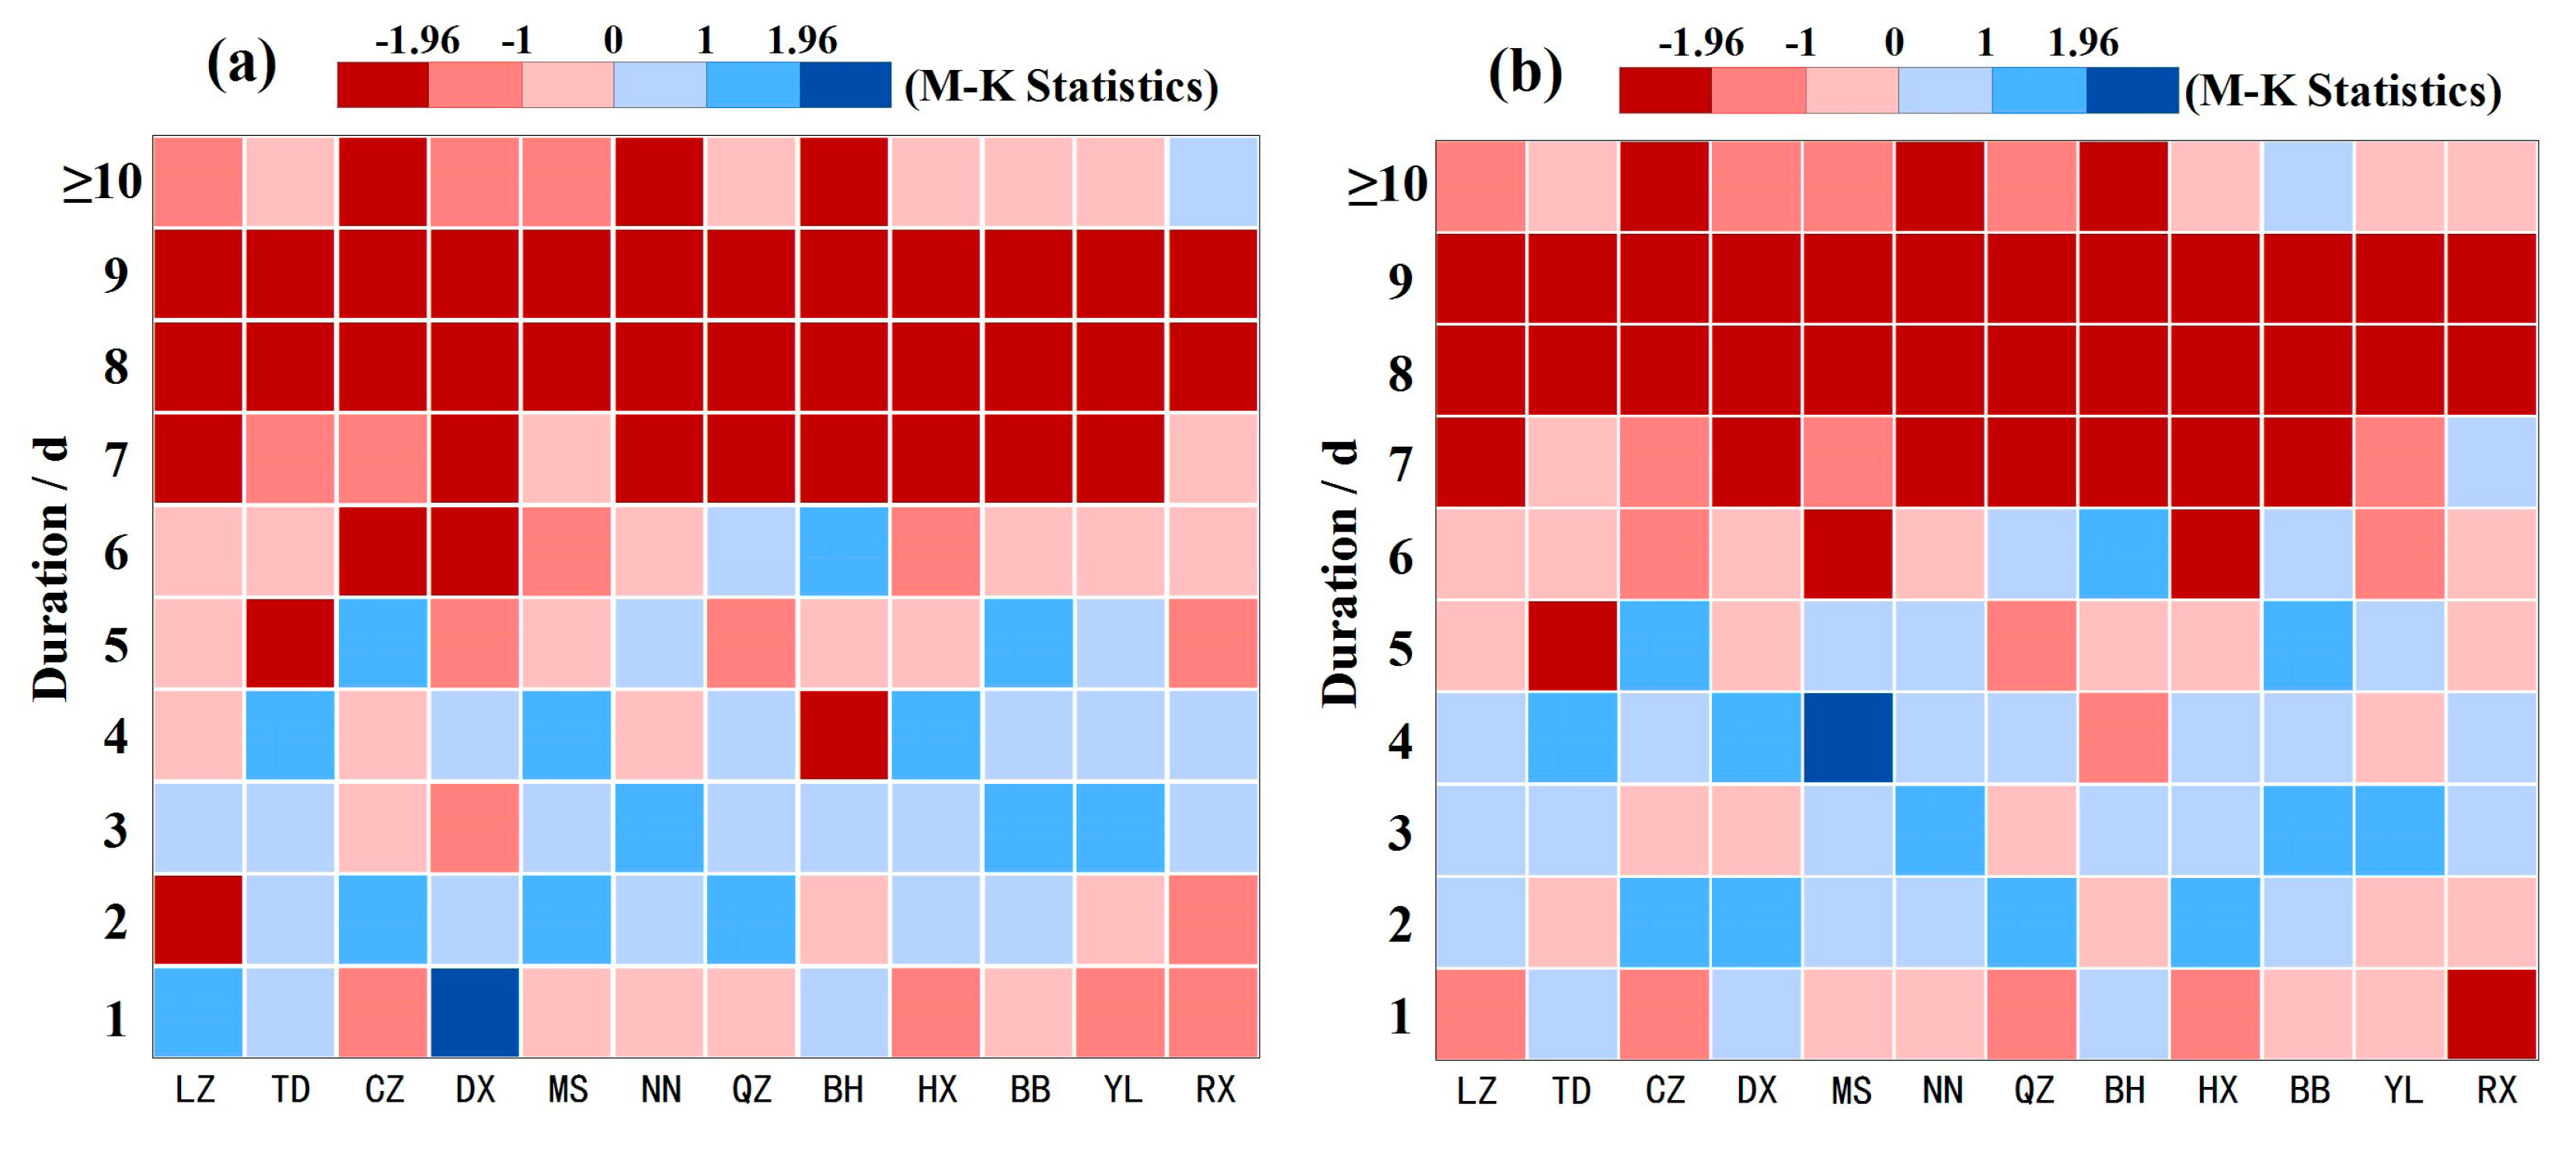
3.6. Variation Tendency of Incidence Rate and Contribution Rate of Different Precipitation Durations

Figure 8 shows the variation tendencies of precipitation incidence rate (Figure 8a) and contribution rate (Figure 8b) of different durations in the rainy season at all stations. The variation tendency was evaluated using Mann–Kendall test and only the variation trends that passed the 95% level of significance test (MK > 1.96 or MK < −1.96, Figure 8) were included.
For the durations of 8–9 d, all of the stations had the significant downward trend of precipitation incidence rate (Figure 8a). For the duration of 7 d, there were eight stations with the significant downward trend. For the durations of 10 d and 6 d, there were three stations (Nanning, Chongzuo, and Beihai) and two stations (Dongxing and Chongzuo) with the significant downward trend, respectively. For other durations, there was only one or no station with the significant change trend.
By contrast, the variation tendencies of precipitation contribution rate and incidence rate for ≥7 d (7–9 d and ≥10 d) durations were generally the same. For 6 d, there were two stations (Mashan and Hengxian) with the significant downward trend (Figure 8b). For other durations, there was only one or no station with the significant change trend.

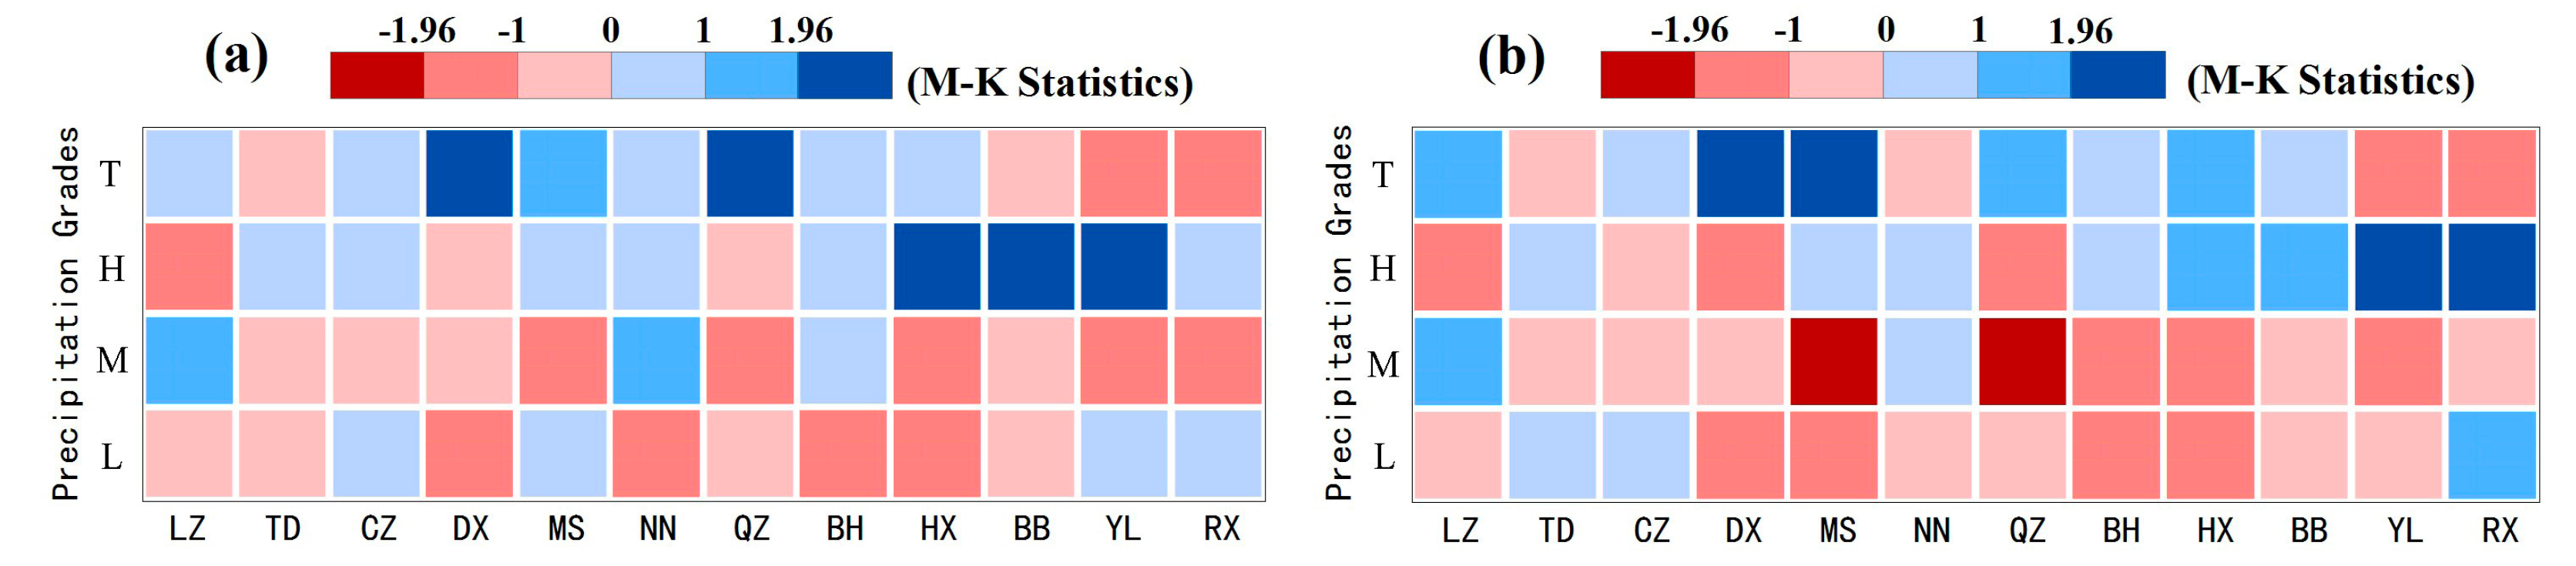
3.7. Variation Tendency for Incidence Rate and Contribution Rate of Different Precipitation Grades

Figure 9 shows the variation tendencies of precipitation incidence rate (Figure 9a) and contribution rate (Figure 9b) of different grades during rainy season at all stations. In terms of incidence rates of torrential rain and heavy rain, there were two stations (Dongxing and Qinzhou) and three stations (Hengxian, Bobai, and Yulin) showing the significant upward trend, respectively. For incidence rate of moderate rain and light rain, there was no station showing the significant variation tendency (e.g., failing to pass the 95% level of test, −1.96 < MK < 1.96, Figure 9).
For the contribution rate of torrential rain, the Dongxing and Mashan stations showed the significant upward trend (Figure 9b). For the contribution rate of heavy rain, Yulin and Rongxian stations showed the significant upward trend. For the contribution rate of moderate rain, the Mashan and Qinzhou stations showed the significant downward trend. For the contribution of light rain, there was no station with significant variation tendency.

4. Discussion

The link between China and the ASEAN countries will be more frequent under China’s the Belt and Road Initiative. The development of this area is promising and foreseeable due to the special geographical location of Beibu Gulf. The environmental research is necessary before large-scale infrastructure construction and economic development [85]. In this study, the response characteristics of precipitation to the environmental factors have been explored. Additionally, the structural variation in precipitation could effectively reflect the variation in water cycle. Thus, the spatiotemporal evolution characteristics of precipitation structure are helpful for analyzing the response of hydrological cycle to the changing environment, including global warming. This study has laid a foundation for regional water resources planning and management [86]. Additionally, the study can provide new information for predicting and guiding regional agricultural and industrial production, and disaster prevention and mitigation.

4.1. Spatiotemporal Variation in Precipitation

In this study, short-duration precipitation of 1–4 days dominated in the incidence rate and contribution rate of precipitation, and light rain dominated the incidence rate of precipitation of all precipitation grades. Despite the similarity with previous studies [53,54,87,88], there were some differences. In particular, the contribution rate of precipitation was quite different for the duration ≥ 10 d and torrential rain. For example, the contribution rate of precipitation for the duration ≥ 10 d in the upper reached the Yangtze River was only 10.6% [53], and that of torrential rain in most inland areas of Northwest China was less than 15% [89]. This might be due to the various conditions of water vapor supply in different regions, which was affected by the continuous actions of weather system conducive to precipitation [90,91].
The variation tendencies of precipitation incidence and contribution rate in short (1–3 d) and medium (4–6 d) durations were more complicated, and the conclusions were various in different regions. However, the incidence and contribution rates of precipitation with long duration (≥7 d) were generally the same in different regions, both with significant downward trends [53,87,92]. In recent years, the incidence rate and contribution rate of light rain have decreased, while the incidence rate and contribution rate of torrential rain have increased in many areas in China, including Hebei, Gansu, Qinghai, Chongqing, Guizhou, and Guangdong [54,89,93,94,95,96,97]. However, the variation trends of light rain were insignificant, while the incidence and contribution rates of torrential rain increased significantly only at two stations in our study area.

4.2. Implication of the Results

The precipitation contribution rate of durations 3 d was the highest in duration 1–9 d, followed by 4 d and 2 d, and the total contribution rate of duration 2–4 d reached up to 40%. Considering the large precipitation in the rainy season (1359.59 mm) and many flood and waterlogging disasters in the region, it is important to pay more attention to the disasters that are caused by 2–4 d precipitation. In Dongxing station, located in the south coast, the annual average contribution rate of torrential rain was as high as 57.16%. Worse, the incidence rate and contribution rate of torrential rain are still rising. Therefore, it was crucial to focus on the disaster that is caused by torrential rain in the region.
In recent years, under the background of the Belt and Road Initiative, the trade between China with the European Union, Africa, Central Asia, and ASEAN has increased gradually. In particular, Beibu Gulf is an important region for the trade development between China and ASEAN countries, and it is predicted for the population growth and rapid development of large infrastructure projects (large seaports, transportation lines, and others) in the coming decade. These changes will result in some environmental problems, for example, the increase in carbon emission, extensive surface hardening, accelerated surface runoff, urban waterlogging, and floods [98,99,100]. Proper measures are urgently needed in order to mitigate the damages [101,102]. The losses could be minimized by science-base planning, such as improving the design standards for drainage of built-up areas and enhancing flood control of rivers, as well as increasing vegetation coverage [103].

4.3. Limitation and Future Research

Similar to many studies, there are some limitation of this study. Only data from 12 meteorological stations in the area were collected and analyzed in the current study due to the relative lower economic development in the Beibu Gulf [104]. In recent years, more meteorological observation stations have been built in the region, providing more data with high-quality. With the development of remote sensing technology, observation data with high-resolution and wide observation range could be acquired from satellite, such as Tropical Rainfall Measuring Mission (TRMM), Climate Hazards group InfraRed Precipitation with Station data (CHIRPS), and Global Precipitation Mission (GPM). In addition, studies have shown that these data may be problematic in many areas and correction is required before application [22,23,24,105,106]. In the future, studies using the TRMM, CHIRPS and GPM data can expand our understanding of hydrological cycle in the area. However, in situ observations are generally more accurate and still indispensable. This study was performed from the perspective of statistical analysis, and the further study on the atmospheric circulation and other dynamics will increase knowledge regarding the impact mechanism of the hydrological cycle in South China.

5. Conclusions

This study analyzed the daily precipitation data of the Beibu Gulf in the period of 1961–2016, and explored the spatiotemporal variation characteristics of the precipitation structure in rainy season (from April to September), from the aspects of precipitation duration and grade, by introducing the indices of the precipitation incidence rate and the contribution rate. The following conclusions have been drawn from this study:
(1). The precipitation during rainy season accounted for more than 80% of the total annual precipitation. With the increase in precipitation durations, the precipitation incidence rates decreased exponentially and the precipitation contribution rates increased first and decreased later. For the duration of ≥ 10 d, the precipitation contribution rates showed a marked increase. The spatial differences for all the durations were almost the same for the precipitation incidence rate and the contribution rate of durations 3–9 d. However, the differences for durations 1–2 d and ≥ 10 d were quite distinct.
(2). With the increase in precipitation grades, the precipitation incidence rate decreased and the precipitation contribution rate increased gradually. For different precipitation grades, there were spatial differences of the precipitation incidence rates and the contribution rates for light rain and torrential rain at Beihai, Qinzhou, Dongxing stations (in the southern region). In these three stations, low precipitation incidence rates and contribution rates were observed for light rain, while they were larger for torrential rain. Especially, the contribution rates of torrential rain were all over 50% at these three stations.
(3). The precipitation incidence rate and contribution rate of 7–9 d durations at most (7 d) and all (8–9 d) stations showed a significant downward trend, while the variation trends of other durations at most stations were insignificant. In terms of grade precipitation, the variation trends of all grade precipitation at most stations were insignificant.

Author Contributions

Conceptualization, Z.L. and H.Y.; data curation, Z.L. and H.Y.; funding acquisition, Z.L., H.Y., X.W.; investigation, X.W.; methodology, Z.L.; software, Z.L.; validation, H.Y. and X.W.; formal analysis, Z.L.; project administration, X.W.; resources, X.W.; software, Z.L.; visualization, H.Y.; writing—original draft preparation, Z.L.; writing—review and editing, H.Y. All authors have read and agreed to the published version of the manuscript.

Funding

This study was financially supported by Natural Science Foundation of China (No. 41571091); Youth Fund of Humanistic and Social Sciences of the Ministry of Education of PRC in 2017 (No. 17YJCZH114); the “13th Five-year” Planning Item of Guangdong Philosophy and Social Sciences (No. GD16CGL10) and Opening fund of Key Laboratory of Environment Change and Resource Use in Beibu Gulf, Ministry of Education of PRC (Nanning Normal University) (2015BGERLKF03), Foshan University Interdisciplinary Program in Art and Science, and Foshan University Lingnan Visiting Professor scheme.

Acknowledgments

The authors thank the National Climate Central (NCC), China Meteorological Administration (CMA) for providing the data for this study.

Conflicts of Interest

No conflict of interest exits in the submission of this manuscript, and manuscript is approved by all authors for publication.

Appendix A

Figure A1. Spatial distribution of incidence rate of different precipitation durations in rainy season in the Beibu Gulf.
Water 12 01170 g0a1aWater 12 01170 g0a1b

Appendix B

Figure A2. Spatial distribution of contribution rate of different precipitation durations in rainy season in the Beibu Gulf.
Water 12 01170 g0a2aWater 12 01170 g0a2b

References

  1. IPCC. Climate Change 2013: The Physical Science Basis; Cambridge University Press: Cambridge, UK; New York, NY, USA, 2013. [Google Scholar]
  2. Tett, S.F.B.; Stott, P.A.; Allen, M.R.; Ingram, W.J.; Mitchell, J.F.B. Causes of twentieth century temperature change near the Earth’s surface. Nature 1999, 399, 569–572. [Google Scholar] [CrossRef]
  3. Stott, P.A.; Tett, S.F.B.; Jones, G.S.; Allen, M.R.; Mitchell1, J.F.B.; Jenkins, G.J. External control of 20th century temperature by natural and anthropogenic forcing. Science 2000, 290, 2133–2137. [Google Scholar] [CrossRef] [Green Version]
  4. Hu, M.; Zhang, X.; Li, Y.; Yang, H.; Tanaka, K. Flood mitigation performance of low impact development technologies under different storms for retrofitting an urbanized area. J. Clean. Prod. 2019, 222, 373–380. [Google Scholar] [CrossRef]
  5. Hu, M.; Zhang, X.; Siu, Y.; Li, Y.; Tanaka, K.; Yang, H.; Xu, Y. Flood mitigation by permeable pavements in Chinese sponge city construction. Water 2018, 10, 172. [Google Scholar] [CrossRef] [Green Version]
  6. Huntington, T.G. Evidence for intensification of the global water cycle: Review and synthesis. J. Hydrol. 2006, 319, 83–95. [Google Scholar] [CrossRef]
  7. Wu, L.; Zhang, Q.; Jiang, Z. Three Gorges Dam affects regional precipitation. Geophys. Res. Lett. 2006, 33, L13806. [Google Scholar] [CrossRef] [Green Version]
  8. New, M.; Todd, M.; Hulme, M.; Jones, P. Precipitation measurements and trends in the twentieth century. Int. J. Climatol. 2001, 21, 1899–1922. [Google Scholar] [CrossRef]
  9. Lin, R.; Zhou, T.; Qian, Y. Evaluation of global monsoon precipitation changes based on five reanalysis datasets. J. Clim. 2014, 27, 1271–1289. [Google Scholar] [CrossRef]
  10. Meehl, G.A.; Zwiers, F.; Evans, J.; Knutson, T.; Mearns, L.; Whetton, P. Trends in extreme weather and climate events: Issues related to modeling extremes in projections of future climate change. Bull. Am. Meteorol. Soc. 2000, 81, 427–436. [Google Scholar] [CrossRef] [Green Version]
  11. Wielicki, B.A.; Wong, T.; Allan, R.P.; Slingo, A.; Kiehl, J.T.; Soden, B.J.; Gordon, C.T.; Miller, A.J.; Yang, S.; Randall, D.A.; et al. Evidence for large decadal variability in the tropical mean radiative energy budget. Science 2002, 295, 841–844. [Google Scholar] [CrossRef] [Green Version]
  12. Liu, S.; Fu, C.; Shi, C.; Chen, J.; Wu, F. Temperature dependence of global precipitation extremes. Geophys. Res. Lett. 2009, 36, L17702. [Google Scholar] [CrossRef] [Green Version]
  13. Lau, K.M.; Wu, H.T. Detecting trends in tropical rainfall characteristics, 1979–2003. Int. J. Climatol. 2007, 27, 979–988. [Google Scholar] [CrossRef] [Green Version]
  14. Lenderink, G.; van Meijgaard, E. Increase in hourly precipitation extremes beyond expectations from temperature changes. Nat. Geosci. 2008, 1, 511–514. [Google Scholar] [CrossRef]
  15. Dong, X.; Zhou, S.; Hu, Z. Characteristics of spatial and temporal variation of heavy snowfall in Northeast China in recent 50 years. Meteorol. Mon. 2010, 36, 74–79. (In Chinese) [Google Scholar]
  16. Chou, C.; Lan, C.W. Changes in the annual range of precipitation under global warming. J. Clim. 2012, 25, 222–235. [Google Scholar] [CrossRef] [Green Version]
  17. Hu, M.; Sayama, T.; Zhang, X.; Tanaka, K.; Takara, K.; Yang, H. Evaluation of low impact development approach for mitigating flood inundation at a watershed scale in China. J. Environ. Manag. 2017, 193, 430–438. [Google Scholar] [CrossRef]
  18. Allen, M.R.; Ingram, W.J. Constraints on future changes in climate and the hydrologic cycle. Nature 2002, 419, 224–232. [Google Scholar] [CrossRef]
  19. Meehl, G.A.; Stocker, T.F.; Collins, W.D.; Friedlingstein, P.; Gaye, A.; Gregory, J.M.; Kitoh, A.; Knutti, R.; Murphy, J.M.; Noda, A.; et al. Global climate projections. In Climate Change 2007: The Physical Science Basis; Cambridge University Press: Cambridge, UK, 2007; pp. 747–845. [Google Scholar]
  20. Trenberth, K.E.; Jones, P.D.; Ambenje, P.; Bojariu, R.; Easterling, D.R.; Tank, A.M.G.K.; Parker, D.E.; Renwick, J.A.; Rahimzadeh, F.; Rusticucci, M.M.; et al. Observations: Surface and atmospheric climate change. In Climate Change 2007: The Physical Science Basis; Solomon, S., Qin, D., Manning, M., Eds.; Cambridge University Press: Cambridge, UK; New York, NY, USA, 2007; pp. 236–336. [Google Scholar]
  21. Zhao, S.; Cong, D.; He, K.; Yang, H.; Qin, Z. Spatial-temporal variation of drought in china from 1982 to 2010 based on a modified temperature vegetation drought index (MTVDI). Sci. Rep. 2017, 7, 17473. [Google Scholar] [CrossRef]
  22. Alijanian, M.; Rakhshandehroo, G.R.; Mishra, A.K.; Dehghani, M. Evaluation of satellite rainfall climatology using CMORPH, PERSIANNCDR, PERSIANN, TRMM, MSWEP over Iran. Int. J. Climatol. 2017, 37, 4896–4914. [Google Scholar] [CrossRef]
  23. Siuki, S.K.; Saghafian, B.; Moazami, S. Comprehensive evaluation of 3-hourly TRMM and half-hourly GPM-IMERG satellite precipitation products. Int. J. Remote Sens. 2017, 38, 558–571. [Google Scholar] [CrossRef]
  24. Darand, M.; Amanollahi, J.; Zandkarimi, S. Evaluation of the performance of TRMM Multi-satellite Precipitation Analysis (TMPA) estimation over Iran. Atmos. Res. 2017, 190, 121–127. [Google Scholar] [CrossRef]
  25. Inoue, T.; Aonashi, K. A comparison of cloud and rainfall information from instantaneous visible and infrared scanner and precipitation radar observations over a frontal zone in East Asia during June 1998. J. Appl. Meteorol. 2000, 39, 2292–2301. [Google Scholar] [CrossRef]
  26. Fu, Y.; Lin, Y.; Liu, G.; Qiang, W. Seasonal characteristics of precipitation in 1998 over East Asia as derived from TRMM PR. Adv. Atmos. Sci. 2003, 20, 511–529. [Google Scholar] [CrossRef]
  27. Fisher, B.L. Climatological validation of TRMM TMI and PR monthly rain products over Oklahoma. J. Appl. Meteorol. 2004, 43, 519–535. [Google Scholar] [CrossRef]
  28. Chen, F.; Fu, Y.; Liu, P.; Yang, Y. Seasonal variability of storm top altitudes in the tropics and subtropics observed by TRMM PR. Atmos. Res. 2016, 169, 113–126. [Google Scholar] [CrossRef]
  29. Fu, Y.; Liu, G.; Wu, G.; Yu, R.; Xu, Y.; Wang, Y.; Li, R.; Liu, Q. Tower mast of precipitation over the central Tibetan Plateau summer. Geophys. Res. Lett. 2006, 33, L058025. [Google Scholar] [CrossRef] [Green Version]
  30. Hou, A.; Kakar, R.K.; Neeck, S.; Azarbarzin, A.A.; Kummerow, C.D.; Kojima, M.; Oki, R.; Nakamura, K.; Iguchi, T. The global precipitation measurement mission. Bull. Am. Meteorol. Soc. 2014, 95, 701–722. [Google Scholar] [CrossRef]
  31. Iguchi, T.; Kozu, T.; Meneghini, R. Rain-profiling algorithm for the TRMM precipitation radar. J. Appl. Meteorol. 2000, 39, 2038–2052. [Google Scholar] [CrossRef]
  32. Liu, G.; Fu, Y. The characteristics of tropical precipitation profiles as inferred from satellite radar measurements. J. Meteorol. Soc. Jpn. 2001, 79, 131–143. [Google Scholar] [CrossRef] [Green Version]
  33. Schumacher, C.; Houze, R.A., Jr. Stratiform rain in the tropics as seen by the TRMM precipitation radar. J. Clim. 2003, 16, 1739–1756. [Google Scholar] [CrossRef]
  34. Barros, A.P.; Joshi, M.; Putkonen, J.; Burbank, D.W. A study of the 1999 monsoon rainfall in a mountainous region in central Nepal using TRMM products and rain gauge observations. Geophys. Res. Lett. 2000, 27, 3683–3686. [Google Scholar] [CrossRef]
  35. Berg, W.; Kummerow, C.; Morales, C.A. Differences between East and West Pacific rainfall systems. J. Clim. 2002, 15, 3659–3672. [Google Scholar] [CrossRef] [Green Version]
  36. Fu, Y.; Liu, G. Possible misidentification of rain type by TRMM PR over Tibetan Plateau. J. Appl. Meteorol. Climatol. 2007, 46, 667–672. [Google Scholar] [CrossRef]
  37. Liu, Q.; Fu, Y. Comparison of radiative signals between precipitating and non-precipitating clouds in frontal and typhoon domains over East Asia. Atmos. Res. 2010, 96, 436–446. [Google Scholar] [CrossRef]
  38. Li, R.; Min, Q.; Fu, Y. 1997/98 El Niño-induced changes in rainfall vertical structure in the East Pacific. J. Clim. 2011, 24, 6373–6391. [Google Scholar] [CrossRef]
  39. Liu, P.; Li, C.; Wang, Y.; Fu, Y. Climatic characteristics of convective and stratiform precipitation over the tropical and subtropical areas as derived from TRMM PR. Sci. Chin. Earth Sci. 2013, 56, 375–385. [Google Scholar] [CrossRef]
  40. Fu, Y.; Qin, F. Summer daytime precipitation in ice, mixed, and water phase as viewed by PR and VIRS in tropics and subtropics. In SPIE Asia–Pacific Remote Sensing; SPIE: Beijing, China, 2014; p. 925906. [Google Scholar] [CrossRef]
  41. Kozu, T.; Kawanishi, T.; Kuroiwa, H.; Kojima, M.; Oikawa, K.; Kumagai, H.; Okamoto, K.; Okumura, M.; Nakatsuka, H.; Nishikawa, K. Development of precipitation radar onboard the Tropical Rainfall Measuring Mission (TRMM) satellite. IEEE Trans. Geosci. Remote Sens. 2001, 39, 102–116. [Google Scholar] [CrossRef]
  42. Hamada, A.; Takayabu, Y. Improvements in detection of light precipitation with the global precipitation measurement dual-frequency precipitation radar (GPM DPR). J. Atmos. Ocean. Technol. 2016, 33, 653–667. [Google Scholar] [CrossRef]
  43. Chandrasekar, V.; Le, M. Evaluation of profile classification module of GPM-DPR algorithm after launch. In Proceedings of the 2015 IEEE International Geoscience and Remote Sensing Symposium (IGARSS), Milan, Italy, 26–31 July 2015; pp. 5174–5177. [Google Scholar] [CrossRef]
  44. Toyoshima, K.; Masunaga, H.; Furuzawa, F.A. Early evaluation of Kuand Ka-band sensitivities for the Global Precipitation Measurement (GPM) Dual-frequency Precipitation Radar (DPR). SOLA 2015, 11, 14–17. [Google Scholar] [CrossRef] [Green Version]
  45. Liu, C.; Zipser, E.J. The global distribution of largest, deepest, and most intense precipitation systems. Geophys. Res. Lett. 2015, 42, 3591–3595. [Google Scholar] [CrossRef] [Green Version]
  46. Tang, G.; Wan, W.; Zeng, Z.; Xiaolin, G.; Na, L.; Di, L.; Yang, H. An overview of the Global Precipitation Measurement (GPM) mission and its latest development. Remote Sens. Technol. Appl. 2015, 30, 607–615. (In Chinese) [Google Scholar] [CrossRef]
  47. Shimozuma, T.; Seto, S. Evaluation of KUPR algorithm in matchup cases of GPM and TRMM. In Proceedings of the 2015 IEEE International Geoscience and Remote Sensing Symposium (IGARSS), Milan, Italy, 26–31 July 2015; pp. 5134–5137. [Google Scholar] [CrossRef]
  48. Tang, G.; Ma, Y.; Long, D.; Zhong, L.; Hong, Y. Evaluation of GPM Day-1 IMERG and TMPA Version-7 legacy products over Mainland China at multiple spatiotemporal scales. J. Hydrol. 2016, 533, 152–167. [Google Scholar] [CrossRef]
  49. Zhang, A.; Fu, Y. The structural characteristics of precipitation cases detected by dual-frequency radar of GPM satellite. Chin. J. Atmos. Sci. 2018, 42. (In Chinese) [Google Scholar] [CrossRef]
  50. Brommer, D.M.; Cerveny, R.S.; Balling, R.C. Characteristics of long-duration precipitation events across the United States. Geophys. Res. Lett. 2007, 34, 2–6. [Google Scholar] [CrossRef]
  51. Zolina, O.; Simmer, C.; Gulev, S.K. Changing structure of European precipitation: Longer wet periods leading to more abundant rainfalls. Geophys. Res. Lett. 2010, 37, L06704. [Google Scholar] [CrossRef]
  52. Moberg, A.; Jones, P.D.; Lister, D.; Walther, A.; Brunet, M.; Jacobeit, J.; Alexander, L.V.; Della-Marta, P.M.; Luterbacher, J.; Yiou, P.; et al. Indices for daily temperature and precipitation extremes in Europe analyzed for the period 1901–2000. J. Geophys. Res. Atmos. 2006, 111, 1–25. [Google Scholar] [CrossRef] [Green Version]
  53. Ye, Y.; Liang, L.; Gong, J.; Jiang, Y.; Wang, H. Spatiotemporal variability characteristics of precipitation structure across the upper Yangtze River basin, China. Ad. Water Sci. 2014, 25, 164–171. (In Chinese) [Google Scholar] [CrossRef]
  54. Song, Y.; Zhou, S.; Wang, C.; Li, Y.; Huang, Y. Temporal Evolution Characteristics of Summer Graded Precipitation over the East of Northwest China during 1965–2014. J. Desert Res. 2018, 38, 182–191. (In Chinese) [Google Scholar] [CrossRef]
  55. Song, X.; Zhang, J.; Liu, J. Spatiotemporal variation characteristics of precipitation pattern in Beijing. Shuili Xuebao 2015, 46, 525–535. (In Chinese) [Google Scholar] [CrossRef]
  56. Han, J.Y.; Baik, J.J.; Lee, H. Urban impacts on precipitation. Asia-Pac. J. Atmos. Sci. 2014, 50, 17–30. [Google Scholar] [CrossRef]
  57. Yao, C.; Yang, S.; Qian, W.; Lin, Z.; Wen, M. Regional summer precipitation events in Asia and their changes in the past decades. J. Geophys.Res. 2008, 113, D17107. [Google Scholar] [CrossRef] [Green Version]
  58. Li, J.; Zhang, Q.; Chen, Y. Changing spatiotemporal patterns of precipitation extremes in China during 2071–2100 based on Earth System Models. J. Geophys. Res. Atmos. 2013, 118, 12537–12555. [Google Scholar] [CrossRef]
  59. Zhang, Q.; Xu, C.; Chen, X.; Zhang, Z. Statistical behaviors of precipitation regimes in China and their links with atmospheric circulation 1960–2005. Int. J. Climatol. 2011, 31, 1665–1678. [Google Scholar] [CrossRef]
  60. Allan, R.P.; Soden, B.J. Atmospheric warming and the amplification of precipitation extremes. Science 2008, 321, 1481–1484. [Google Scholar] [CrossRef] [PubMed] [Green Version]
  61. Liu, J.; Wang, B.; Cane, M.A. Divergent global precipitation changes induced by natural versus anthropogenic forcing. Nature 2013, 493, 656–659. [Google Scholar] [CrossRef] [PubMed]
  62. Wang, H.; Long, A.; Yu, F. Study on theoretical method of social water cycle Ι: Definition and dynamical mechanism. Shuili Xuebao 2011, 42, 379–387. (In Chinese) [Google Scholar] [CrossRef]
  63. Dong, X.; Xue, F.; Zhang, H.; Zeng, Q. Evaluation of surface air temperature change over China and the globe during the twentieth century in IAP AGCM4.0. Atmos. Ocean. Sci. Lett. 2012, 5, 435–438. [Google Scholar] [CrossRef] [Green Version]
  64. Zhang, J.; Song, X.; Wang, G. Development and challenges of urban hydrology in a changing environment I: Hydrological response to urbanization. Ad. Water Sci. 2014, 25, 594–605. (In Chinese) [Google Scholar] [CrossRef]
  65. Wu, S.; Liang, J. Spatiotemporal Characteristics of the Drought and Flood during the Rainy Season in South China. J. Trop. Meteorol. 1992, 8, 87–92. [Google Scholar] [CrossRef]
  66. Zhou, S.; Xu, S.; Huang, F. Secular Variation Features of Agricultural Climate Resources in Guangxi. Chin. Agric. Sci. Bull. 2011, 27, 168–173. (In Chinese) [Google Scholar]
  67. Qin, W.; Li, Y.; Liao, X. Impact of the Madden-Julian Oscillation activity on the phase precipitation in Guangxi. J. Meteorol. Res. Appl. 2015, 36, 25–30. (In Chinese) [Google Scholar] [CrossRef]
  68. Huang, G.; Wang, W.; Li, Q. Opening and Development of the Beibu Gulf Economic Zone. Res. Sci. 2009, 31, 164–170. (In Chinese) [Google Scholar]
  69. Wang, Y. “The Belt and Road Initiative” Promotes Inclusive Growth. The People’s Daily, 7 September 2016. (In Chinese) [Google Scholar]
  70. Zhang, Q.; Zhou, Y.; Vijay, P.; Li, J. Scaling and clustering effects of extreme precipitation distributions. J. Hydrol. 2012, 454–455, 187–194. [Google Scholar] [CrossRef]
  71. Yang, P.; Ren, G.; Hou, W.; Liu, W. Spatial and diurnal characteristics of summer rainfall over Beijing Municipality based on a high-density AWS dataset. Int. J. Climatol. 2013, 33, 2769–2780. [Google Scholar] [CrossRef]
  72. Yin, S.; Gao, G.; Li, W.; Chen, D.; Hao, L. Long-term precipitation change by hourly data in Haihe River Basin during 1961–2004. Sci. Chin. Earth Sci. 2012, 42, 256–266. [Google Scholar] [CrossRef]
  73. Liu, B.; Chen, C.; Lian, Y. Long-term change of wet and dry climatic conditions in the southwest karst area of China. Glob. Planet. Chang. 2015, 127, 1–11. [Google Scholar] [CrossRef]
  74. Qiao, L.; Li, Y.; Fu, J.; Tian, C.; Bi, B.; Zhou, Q. The China National Standardization Management Committee; Grade of precipitation (GB/T28592-2012); Standards Press: Beijing, China, 2012. (In Chinese) [Google Scholar]
  75. Mann, H.B. Non-parametric tests against trend. Econometrica 1945, 13, 245–259. [Google Scholar] [CrossRef]
  76. Hamed, K.H. Trend detection in hydrologic data: The Mann-Kendall trend test under the scaling hypothesis. J. Hydrol. 2008, 349, 350–363. [Google Scholar] [CrossRef]
  77. Song, X.; Zhang, J.; AghaKouchak, A.; Roy, S.S.; Xuan, Y.; Wang, G.; He, R.; Wang, X.; Liu, C. Rapid urbanization and changes in trends and spatiotemporal characteristics of precipitation in the Beijing metropolitan area. J. Geophys. Res. Atmos. 2014, 119, 11250–11271. [Google Scholar] [CrossRef] [Green Version]
  78. Mitchell, J.M.; Dzerdzeevskii, B.; Flohn, H. Climate Change, WHO Technical Note 79; World Meteorological Organization: Geneva, The Switzerland, 1966; p. 79. [Google Scholar]
  79. Wen, K.; Yang, N. The Meteorology Disaster Almanac over China (Guangxi); Wen, K., Yang, N., Eds.; China Meteorological Press: Beijing, China, 2007; Chapter 1; pp. 14–119. (In Chinese) [Google Scholar]
  80. He, J.; Xie, M.; Huang, Z.; Li, L.; Huang, X.; Zhou, M. Material statistics of Climate Change in Guangxi. J. Meteorol. Res. Appl. 2016, 37, 11–15. (In Chinese) [Google Scholar]
  81. Zhou, L. Information construction on flood disasters statistics in Guangxi Province. Chin. Flood Drought Manag. 2017, 27, 92–97. (In Chinese) [Google Scholar] [CrossRef]
  82. Wen, K.; Yang, N. The Meteorology Disaster Almanac over China (Guangxi); Wen, K., Yang, N., Eds.; China Meteorological Press: Beijing, China, 2007; Chapter 2; pp. 120–198. (In Chinese) [Google Scholar]
  83. Zhang, Q.; Zhang, W.; Chen, D.; Jiang, T. Flood, drought and typhoon disasters during the last half-century in the Guangdong province, China. Nat. Hazards 2011, 57, 267–278. [Google Scholar] [CrossRef]
  84. Yu, L.; Zhai, R.; Lu, Y.; Guo, S.; Qu, L.; Cen, X.; Zhang, K.; Huang, P.; Shang, X.; Zhou, S. Effects of typhoon and the mesoscale warm eddy on the near-inertial oscillations in the northern of the South China Sea. Haiyang Xuebao 2020, 42, 1–11. (In Chinese) [Google Scholar] [CrossRef]
  85. Yang, H. China must continue the momentum of green law. Nature 2014, 509, 535. [Google Scholar] [CrossRef] [PubMed] [Green Version]
  86. Li, N.; Yang, H.; Wang, L.; Huang, X.; Zeng, C.; Wu, H.; Ma, X.; Song, X.; Wei, Y. Optimization of industry structure based on water environmental carrying capacity under uncertainty of the huai river basin within shandong province, china. J. Clean. Prod. 2016, 112, 4594–4604. [Google Scholar] [CrossRef]
  87. Chen, Y.; Zhai, P. Changing structure of wet periods across southwest China during 1961–2012. Clim. Res. 2014, 61, 123–131. [Google Scholar] [CrossRef]
  88. Zheng, Y.; Zhang, Q.; Chen, X. Changing Properties of Precipitation Structure during 1961–2005 across the Huaihe Basin. J. Wuhan Univ. (Nat. Sci. Ed.) 2015, 61, 247–254. (In Chinese) [Google Scholar] [CrossRef]
  89. Chen, X.; Shang, K.; Wang, S.; Yang, D. Analysis on the Spatiotemporal Characteristics of Precipitation under Different Intensities in China in Recent 50 Years. Arid Zone Res. 2010, 27, 766–772. (In Chinese) [Google Scholar] [CrossRef]
  90. You, Q.; Kang, S.; Aguilar, E.; Pepin, N.; Flügel, W.; Yan, Y.; Xu, Y.; Zhang, Y.; Huang, J. Changes in daily climate extremes in China and their connection to the large scale atmospheric circulation during 1961–2003. Clim. Dyn. 2011, 36, 2399–2417. [Google Scholar] [CrossRef]
  91. Yang, L.; Zhao, J.; Feng, G. Characteristics and differences of summertime moisture transport associated with four rainfall patterns over eastern China monsoon region. Chin. J. Atmos. Sci. 2018, 42, 81–95. (In Chinese) [Google Scholar] [CrossRef]
  92. Zhao, H.; Yao, Y.; Jin, X.; Wang, C. Structure Characteristics of Precipitation in Guangxi Region during 1960–2017. Water Res. Power 2018, 36, 1–4. (In Chinese) [Google Scholar]
  93. Yan, Z.; Yang, C. GeograPhic Patterns of Extreme Climate Changes in China during 1951–1997. Clim. Environ. Res. 2000, 5, 265–272. (In Chinese) [Google Scholar] [CrossRef]
  94. Zhai, P.; Liao, Z.; Chen, Y.; Yu, R.; Yuan, Y.; Lu, H. A review on changes in precipitation persistence and phase under the background of global warming. Acta Meteorol. Sin. 2017, 75, 527–538. (In Chinese) [Google Scholar] [CrossRef]
  95. Bai, A.; Zhai, P.; Liu, X. Climatology and trends of wet spells in China. Theor. Appl. Climatol. 2007, 88, 139–148. [Google Scholar] [CrossRef]
  96. Lu, H.; Chen, S.; Guo, Y.; He, H.; Xu, S. Spatiotemporal Variation Characteristics of Extremely Heavy Precipitation Frequency over South China in the Last 50 Years. J. Trop. Meteorol. 2012, 28, 219–227. (In Chinese) [Google Scholar] [CrossRef]
  97. He, B.; Zhai, P. Characteristics of the persistent and non-persistent extreme precipitation in China from 1961 to 2016. Clim. Chang. Res. 2018, 14, 437–444. (In Chinese) [Google Scholar] [CrossRef]
  98. Lai, L.; Huang, X.; Yang, H.; Chuai, X.; Zhang, M.; Zhong, T.; Chen, Z.; Chen, Y.; Wang, X.; Thompson, J.R. Carbon emissions from land-use change and management in China between 1990 and 2010. Sci. Adv. 2016, 2, e1601063. [Google Scholar] [CrossRef] [Green Version]
  99. Zhang, M.; Huang, X.; Chuai, X.; Yang, H.; Lai, L.; Tan, J. Impact of land use type conversion on carbon storage in terrestrial ecosystems of China: A spatial-temporal perspective. Sci. Rep. 2015, 5, 10233. [Google Scholar] [CrossRef]
  100. Yang, H.; Xia, J.; Thompson, J.R.; Flower, R.J. Urban construction and demolition waste and landfill failure in Shenzhen, China. Waste Manag. 2017, 63, 393–396. [Google Scholar] [CrossRef]
  101. Yang, H.; Flower, R.J.; Thompson, J.R. Sustaining China’s water resources. Science 2013, 339, 141. [Google Scholar] [CrossRef]
  102. Yang, H.; Huang, X.; Thompson, J.R.; Flower, R.J. Enforcement key to China’s environment. Science 2015, 347, 834–835. [Google Scholar] [CrossRef] [PubMed]
  103. Liu, Y.; Huang, X.; Yang, H.; Zhong, T. Environmental effects of land-use/cover change caused by urbanization and policies in southwest china karst area–a case study of Guiyang. Habitat Int. 2014, 44, 339–348. [Google Scholar] [CrossRef]
  104. Yang, H.; Wright, J.A.; Gundry, S.W. Boost water safety in rural China. Nature 2012, 484, 318. [Google Scholar] [CrossRef] [PubMed]
  105. Luo, X.; Wu, W.; He, D.; Li, Y.; Ji, X. Hydrological Simulation Using TRMM and CHIRPS Precipitation Estimates in the Lower Lancang-Mekong River Basin. Chin. Geogr. Sci. 2019, 29, 13–25. [Google Scholar] [CrossRef] [Green Version]
  106. Ren, L.; Wei, L.; Jiang, S.; Shi, J.; Yuan, F.; Zhang, L.; Liu, R. Drought monitoring utility assessment of CHIRPS and GLEAM satellite products in China. Trans. Chin. Soc. Agric. Eng. 2019, 35, 146–154. [Google Scholar] [CrossRef]
Figure 1. The location of the Beibu Gulf and 12 rain-gauge stations in this area.
Water 12 01170 g001
Figure 2. Average monthly precipitation in 1961–2016 in the Beibu Gulf.
Water 12 01170 g002
Figure 3. Incidence rate and contribution rate of different precipitation durations in the rainy season in the Beibu Gulf.
Water 12 01170 g003
Figure 4. Incidence rates (a) and contribution rates (b) of different precipitation duration in rainy season at 12 stations in the Beibu Gulf. The letters along the x-axis denote names of the weather stations: Longzhou (LZ), Tiandeng (TD), Chongzuo (CZ), Dongxing (DX), Mashan (MS), Nanning (NN), Qinzhou (QZ), Beihai (BH), Hengxian (HX), Bobai (BB), Yulin (YL) and Rongxian (RX).
Water 12 01170 g004
Figure 5. Incidence rate and contribution rate of different precipitation grades during rainy season in the Beibu Gulf.
Water 12 01170 g005
Figure 6. Incidence rate (a) and contribution rate (b) of different precipitation grades in rainy season at 12 stations in the Beibu Gulf.
Water 12 01170 g006
Figure 7. Spatial distribution pattern of contribution rates of torrential rain in the Beibu Gulf.
Water 12 01170 g007
Figure 8. Variation tendency of incidence rate (a) and contribution rate of different durations (b) in rainy season at 12 stations in the Beibu Gulf. The letters along the x-axis denoted names of the precipitation stations: Longzhou (LZ), Tiandeng (TD), Chongzuo (CZ), Dongxing (DX), Mashan (MS), Nanning (NN), Qinzhou (QZ), Beihai (BH), Hengxian (HX), Bobai (BB), Yulin (YL), and Rongxian (RX).
Water 12 01170 g008
Figure 9. Variation tendency of incidence rate (a) and contribution rate of different grades (b) in rainy season at 12 stations in the Beibu Gulf. The letters along the y-axis denoted precipitation grades. L is Light rain, M is Moderate rain, H is Heavy rain and T is Torrential rain. The letters along the x-axis denoted names of the precipitation stations: Longzhou (LZ), Tiandeng (TD), Chongzuo (CZ), Dongxing (DX), Mashan (MS), Nanning (NN), Qinzhou (QZ), Beihai (BH), Hengxian (HX), Bobai (BB), Yulin (YL), and Rongxian (RX).
Water 12 01170 g009
Table 1. The historical precipitation events and its economic losses.
StationsTimePrecipitation (mm)Duration (d)Death TollsCrop Areas Affected (km2)Roads Affected (km)Losses *
(Million RMB Yuan)
References
Longzhou23–24 July 1986166.52412019110[79]
Tiandeng3 June 1973192.31525>20025[79]
Chongzuo16 September 198480.31027>10035[79]
Dongxing4–8 August 1995601.95589>400430[79]
Mashan5 July 2014358.014\45384[80]
Nanning29–30 August 1988158.12837376130[79]
Qinzhou17–19 August 1996183.936305157130[79]
Beihai20–21 July 1994245.126\>200350[79]
Hengxian17–27 August 1979263.1≥100367\30[79]
Bobai19–24 July 1994506.3636400>3001630[79]
Yulin9–11 May 2014273.432\\370[81]
Rongxian18–19 April 1996128.72130.730050[79]
* Direct economic losses were calculated based on the price level in the year of the disaster. “\” means no available record.

