Article

Spatiotemporal Analysis of Water Quality Using Multivariate Statistical Techniques and the Water Quality Identification Index for the Qinhuai River Basin, East China

1
College of Urban Resources and Environment, Jiangsu Second Normal University, Nanjing 210013, China
2
Signal Processing in Earth Observation (SiPEO), Technical University of Munich (TUM), 80333 Munich, Germany
3
School of Geographic and Oceanographic Sciences, Nanjing University, Nanjing 210093, China
4
Collaborative Innovation Center of Atmospheric Environment and Equipment Technology, Jiangsu Key Laboratory of Atmospheric Environment Monitoring and Pollution Control (AEMPC), School of Environmental Science and Engineering, Nanjing University of Information Science and Technology, Nanjing 210044, China
5
Department of Geography and Environmental Science, University of Reading, Whiteknights, Reading RG6 6 AB, UK
6
School of Environmental Science and Engineering, Yancheng Institute of Technology, Yancheng 224051, China
7
Suqian Hydrological and Water Resources Management Bureau of Jiangsu Province, Suqian 223800, China
*
Authors to whom correspondence should be addressed.
Water 2020, 12(10), 2764; https://doi.org/10.3390/w12102764
Submission received: 11 September 2020 / Revised: 29 September 2020 / Accepted: 1 October 2020 / Published: 4 October 2020

Abstract

:
Monitoring water quality is indispensable for the identification of threats to water environment and later management of water resources. Accurate monitoring and assessment of water quality have been long-term challenges. In this study, multivariate statistical techniques (MST) and water quality identification index (WQII) were applied to analyze spatiotemporal variation in water quality and determine the major pollution sources in the Qinhuai River, East China. A rotated principal component analysis (PCA) identified three potential pollution sources during the wet season (mixed pollution, physicochemical, and nonpoint sources of nutrients) and the dry season (nutrient, primary environmental, and organic sources) and they explained 81.14% of the total variances in the wet season and 78.42% of total variances in the dry season. The result of redundancy analysis (RDA) showed that population density, urbanization, and wastewater discharge are the main sources of organic pollution, while agricultural fertilizer consumption and industrial wastewater discharge are the main sources of nutrients such as nitrogen and phosphorus. The water quality of the Qinhuai River basin was determined to be mainly Class III (slightly polluted) and Class IV (moderately polluted) based on WQII. Temporally, the change trend of WQII showed that water quality gradually deteriorated between 1990 and 2005, improved between 2006 and 2010, and then deteriorated again. Spatially, the WQII distribution map showed that areas with more developed urbanization were relatively more polluted. Our results show that MST and WQII are useful tools to help the public and decision makers to evaluate the water quality of aquatic environment.

1. Introduction

Water is a very important resource, playing a crucial role for domestic use, agricultural and industrial development, recreation, or other purposes. However, water quality degradation threatens the aquatic ecosystem, endangering the health of human beings as well as hindering social and economic development. It is imperative to collect reliable information on water quality to prevent further water contamination, particularly in developing countries [1]. Water ecosystems are affected by both natural and anthropogenic processes. Natural processes mainly include climate change [2], rock mineral oxidation [2,3], soil weathering and erosion [2], seawater intrusion [4], and others. Anthropogenic activities are primarily comprised of domestic and municipal wastewater [4], industrial and agricultural effluents [4,5], water diversion projects [6], and others. Therefore, regular monitoring campaigns and evaluations of water quality are helpful in preventing water pollution and applying remedial measures [7,8]. These sampling networks provide a large volume of physical, chemical, and biological water quality parameters, which has increased over time [9]. Up to now, there has been no very clear standard for the number and type of parameters in water quality assessment that have unavoidably yielded variation in results. In general, dissolved oxygen (DO), pH, turbidity, total dissolved solids, nitrates, phosphates, and metals are widely used [10]. However, all indices have their limitations, and the number of variables differs between methods and varies from study to study [11]. For example, 4, 18, and 20 parameters were utilized to evaluate water quality in the Chillán River (central Chile) [11], Bagmati River (Nepal) [12], and Suquía River (Argentina) [13], respectively. To assist in selecting and analyzing these water quality data, corresponding processing methods are needed.
Multivariate statistical techniques (MST), such as principal component analysis (PCA), analysis of variance (ANOVA), cluster analysis (CA), redundancy analysis (RDA), and discriminant analysis (DA), have been introduced to assess spatiotemporal variations and trends in water quality and possible sources of pollutants in rivers [14,15,16]. The combined use of different multivariate statistical techniques has been increasingly used in the assessment of water quality [17]. For example, Alves et al. [17], Mir and Gani [2], Rakotondrabe et al. [18], and Singh et al. [8] employed at least two statistical techniques to assess water quality. Although these methods do not indicate clear cause-and-effect relationships, they provide information from which such relationships can be inferred [18]. Ravanbakhsh et al. [19], Pinto et al. [20], and Sun et al. [4] employed MST to determine the possible factors or sources which affect water ecosystems. Although these approaches have been proven as powerful tools for the assessment of water pollution in urban river networks [9], groundwater [21], river networks on plains [22], and lakes [23], as well as studies on source tracing, they cannot determine the general water quality status of a water body.
Water quality index (WQI) is a mathematical instrument used to transform large quantities of water characterization data into a single number which represents the water quality status [24,25,26]. The use of a WQI was initially proposed by Horton [27] and Brown et al. [28]. Subsequently, the United States National Sanitation Foundation Water Quality Index (NSFWQI), the Florida Stream Water Quality Index (FWQI), the British Columbia Water Quality Index (BCWQI), the Canadian Water Quality Index (CWQI), and the Oregon Water Quality Index (OWQI) were further proposed [29,30]. The major differences among various WQIs are the manner of statistical integration and interpretation of parameter values [10]. One of the modified approaches, which was adopted as the China Water Quality Index, is the water quality identification index (WQII) [22]. Unlike other WQIs, the WQII uses the integer part to identify pollution categories and uses decimal fractions to emphasize pollution degree in the same category. The strength of this method is the comprehensive evaluation that combines both qualitative and quantitative assessments [22]. A WQI in conjunction with MST can identify the most important water quality variables [31,32]. Neither a WQI nor MST can visualize the results. However, a WQI in conjunction with a geographical information system (GIS) can specify the status of water quality and strengthen the assessment process [33,34]. However, these tools have not been used at the same time; therefore, this study made some efforts to combine these tools together to evaluate water quality.
The study selected the Qinhuai River as a representative urban river, in the lower reaches of the Yangtze River, East China. The deterioration of water quality in the Qinhuai River has been reported [35,36,37]. However, to the best of our knowledge, the published results are largely limited by a lack of in-depth analyses of the spatiotemporal variation in water quality. On the spatial scale, the previous studies focused primarily on water pollution in the lower reaches of the river, which are the most urbanized. For example, Zhao et al. [34] measured water quality in the lower reaches of the river in October 2010 and January 2011. Gao et al. [35] applied the normal cloud-fuzzy variable set evaluation model to assess water quality in the lower reaches of the river in 2016. Yang et al. [6] investigated the impacts of water diversion projects on the spatiotemporal distribution of pharmaceutical and personal care products (PPCPs) in the lower reaches of the river. On the temporal scale, the previous studies were constrained by short-term observation results, with only 1–2 years of measurement [34,35,36]. Thus, different from previous results, this study analyzed the spatiotemporal changes of water quality in the whole basin of the Qinhuai River from 1990 to 2014.
A combination of multiple multivariate statistical techniques (PCA and RDA), WQII, and GIS was conducted in this research. The main aims of this study are: (1) to determine the spatiotemporal variation in water quality in the whole river basin; (2) to identify the main pollution sources of different subregions in the river basin between seasons; and (3) to analyze the influence of natural and anthropogenic factors on water quality in the river.

2. Material and Methods
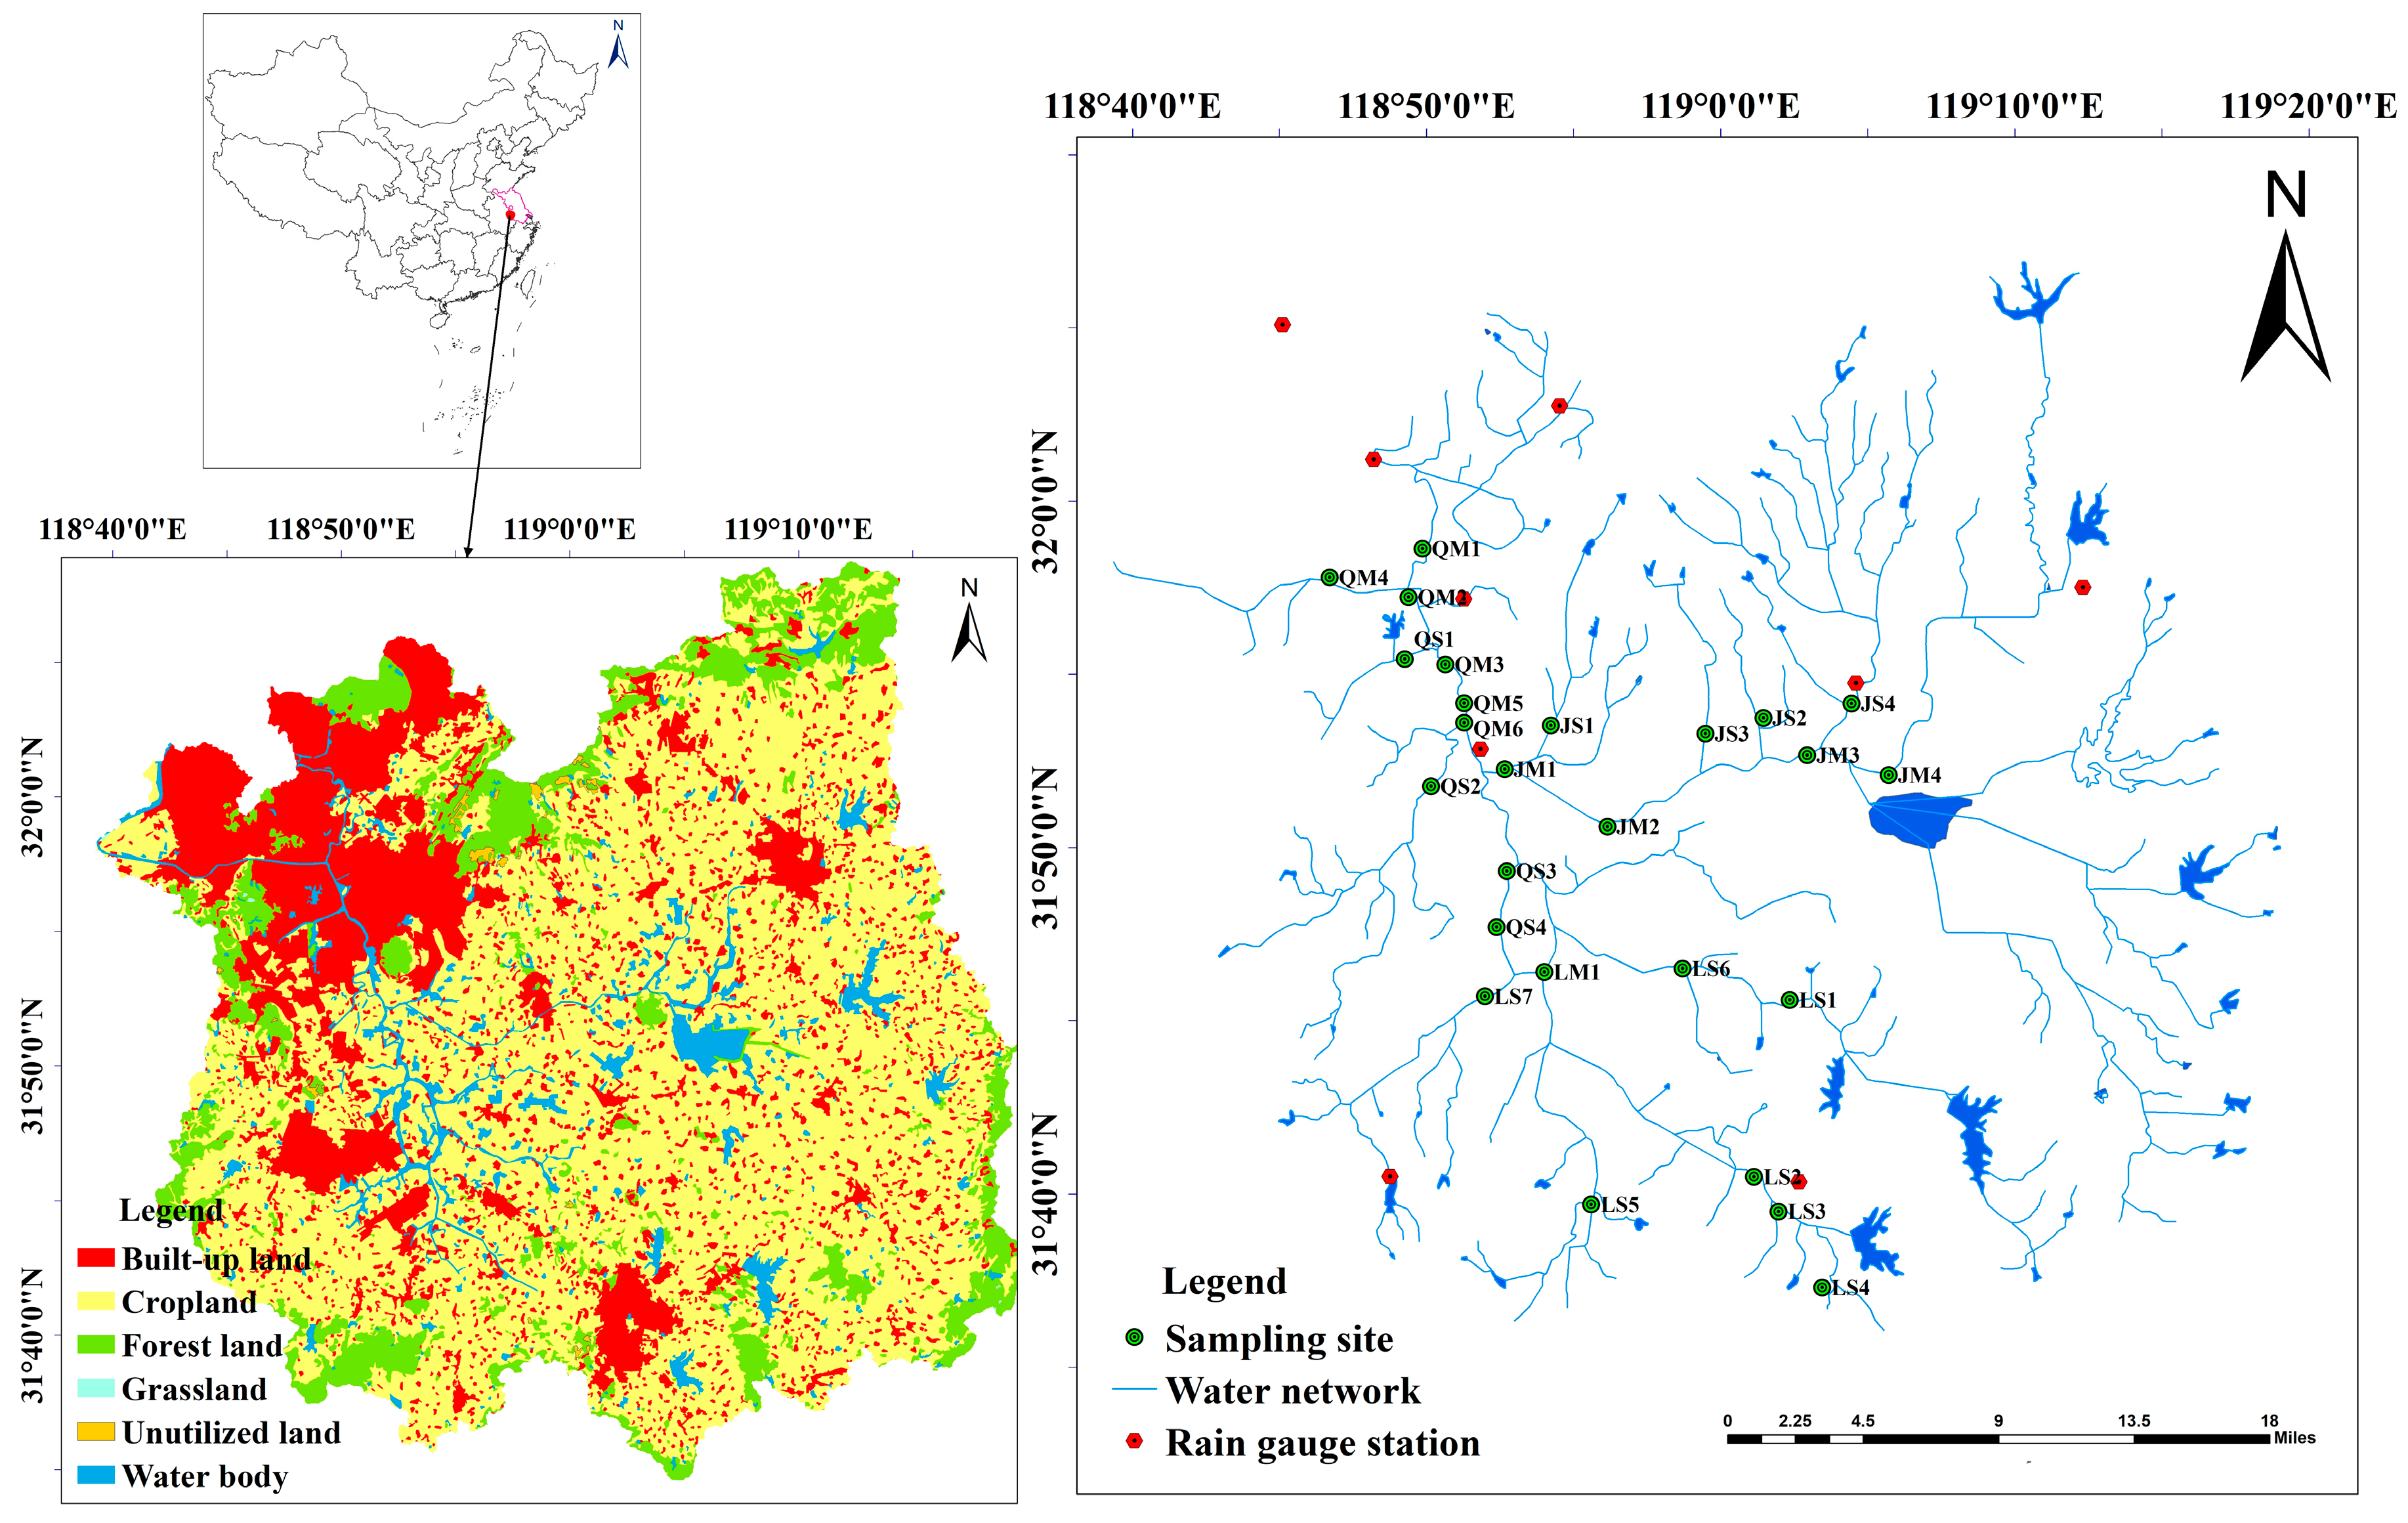
2.1. Study Area

The Qinhuai River, an important tributary on the south bank of the Yangtze River’s lower reaches, is located at the southwestern region of Jiangsu Province, East China (Figure 1). The total area of the Qinhuai River basin is 2635 km2. There are two sources at the basin’s upper reaches: the northern source, the Jurong River that originates in the Mao and Baohua Mountains, and the southern source, the Lishui River that originates in the Donglu Mountain. The two sources meet in the vicinity of the Xibei Village in the Jiangning District before flowing northward in a winding channel. The river divides into two tributaries near the Heding Bridge, both of which merge into the Yangtze River. The Qinhuai River basin is an important intake area for the Nanjing section of the Yangtze River. The basin was dominated by cropland (59.97%), built-up area (23.08%), forest (11.74%), water (4.93%), grassland (0.02%) and unutilized land (0.26%) in 2010 (Figure 1). The analysis of remote sensing images (Landsat 7 ETM+ and Landsat 8OLI/TRIS) between 2000 and 2019 showed some changes of different land use types in the basin. Specifically, built-up area experienced the largest increase (15.1%), while cropland area showed the greatest decrease (14.88%). The areas of forest, unutilized land, and water only changed slightly. The water quality of Qinhuai River directly relates to the security of the water supply in the surrounding areas. In addition, the Qinhuai River is an important waterway and tourism site in Nanjing.

2.2. Data Sources

The water quality data used in this study, spanning 15 years (specifically, 1990, 1995, 2000, 2005, 2008, and 2010–2014), were collected from the Nanjing Hydrological and Water Resources Management Bureau of Jiangsu Province, China. There were three monitoring stations in the Qinhuai River basin before 2000 (Ge Bridge, Zhenzhu Bridge, and Shahe Bridge). The number of monitoring stations grew to 26 in 2010. The monitoring sites are mainly distributed along the main and secondary channels of the Qinhuai River, Lishui River, and Jurong River. The main streams of the Qinhuai River, Lishui River, and Jurong River are named as QM, LM, and JM, respectively, while their secondary channels are named as QS, LS, and JS, respectively. Detailed information can be found in Table 1 and Figure 1.
The water quality data were treated according to the following steps. First, values that were below the detection limit were removed. Second, monitoring indicators were selected when they were measured at as many stations as possible. Finally, 12 water quality indicators were selected in the current study: water temperature (T; °C), dissolved oxygen (DO; mg/L), potassium permanganate index (CODMn; mg/L), pH, chemical oxygen demand (CODcr; mg/L), biochemical oxygen demand (BOD5; mg/L), NH4+−N (mg/L), Zn (mg/L), fluorides (F; mg/L), transparency (TS; m), total nitrogen (TN; mg/L), and total phosphorous (TP; mg/L). According to the Environmental Quality Standards for Surface Water (GB3838-2002) of the Ministry of Ecology and Environment of the People’s Republic of China (Table 2), the main factors that exceeded the standards were CODMn (Class Ⅳ), CODcr (Class IV), NH4+−N (Class V), TN (inferior V Class), and TP (V Class).

2.3. Water Quality Identification Index (WQII)

The WQII is a tool for assessing the general water quality of surface water, including a whole number (X) and decimal fraction (YN) [22]. X is the comprehensive water quality classification. Y is the position of the water quality interval (grades (I)~(V), Table 3). N is the number of water quality indicators that are inferior to the standards which were designed for the area. Pollution categories were calculated by the whole numbers (X), and the differences between pollution degrees in the same category, which were determined by a decimal fraction (YN) (Table 3).
The WQII can be calculated as follows:
(i)
X . Y = 1 m m 1 ( X i · Y i )
where m is the number of the indices. If the water quality grade of the ith water quality parameter is between I and V, Xi = 1, 2, 3, 4, 5 and it is determined by comparing the ith water quality index against national standards (GB3838-2002). If the ith water quality parameter is worse than Class V or equal to Class V, Xi = 6.
(ii) Yi calculation in different ways:
If the water quality grade of the ith water quality parameter is between I and V, Yi can be calculated using the following formulas:
Y i = C i C i o C i u C i o   ×   10   general   indicators
Y i = ( 1 C i C i o C i u C i o )   ×   10   dissolved   oxygen
where Ci is the measured concentration of the ith water quality index; Ciu and Cio are the upper limit value and lower limit value of the Type Xi water quality standard for the ith water quality index, respectively.
If the water quality grade of the ith water quality parameter is equal to or larger than Type V, Yi can be calculated using the following formulas:
X i . Y i = X i + C i C i u C i u   general   indicators  
X i . Y i = X i + C i o C i C i o   ×   s   dissolved   oxygen
where Ciu and Cio are the upper limit value and lower limit value of the Type V water quality standard for the ith water quality index, respectively; m is the correction coefficient. In this study, s = 4.

2.4. Multivariate Statistical Techiniques (MST)

Different MSTs have been used for analyzing water quality data because they are capable of treating numerous data from a variety of monitoring sites. In this study, PCA and redundancy analysis (RDA) were applied.
(i) PCA uses the idea of dimensionality reduction and several comprehensive variables to obtain major information based on the original variables without any overlap [8,18,36]. In this study, PCA was used to identify the main components and sources in different seasons, which comprehensively reflect a water body’s level of pollution [37]. Statistical analyses were conducted using the software SPSS 22.0 (IBM Corp, Armonk, NY, USA).
(ii) Redundancy analysis (RDA) or canonical correlation analysis (CCA) is used to reflect the relationship between response variables and explanatory variables and to explain the changes of response variables by potential or indirect explanatory variables [37,38]. RDA and CCA were performed using the software Canoco 5.0 (Houston, TX, USA) to analyze the water quality indices in different years. It was found that the gradient value of water quality index was 0.6 (less than 3), so RDA was selected [38]. The result graph of RDA can express the water quality index and explanatory variables in the same coordinate plane. The length of the arrowhead of the explanatory variable indicates the influence degree of the explanatory variable on the water quality, and a longer arrowhead indicates a larger influence. The angle between the explanatory variable arrow and the water quality indicator arrow indicates the correlation between them [39]. When the angle is acute, they are positively correlated; when it is equal to 90 degrees, there is no correlation; when it is an obtuse angle, it is largely excluded in this study.

3. Results

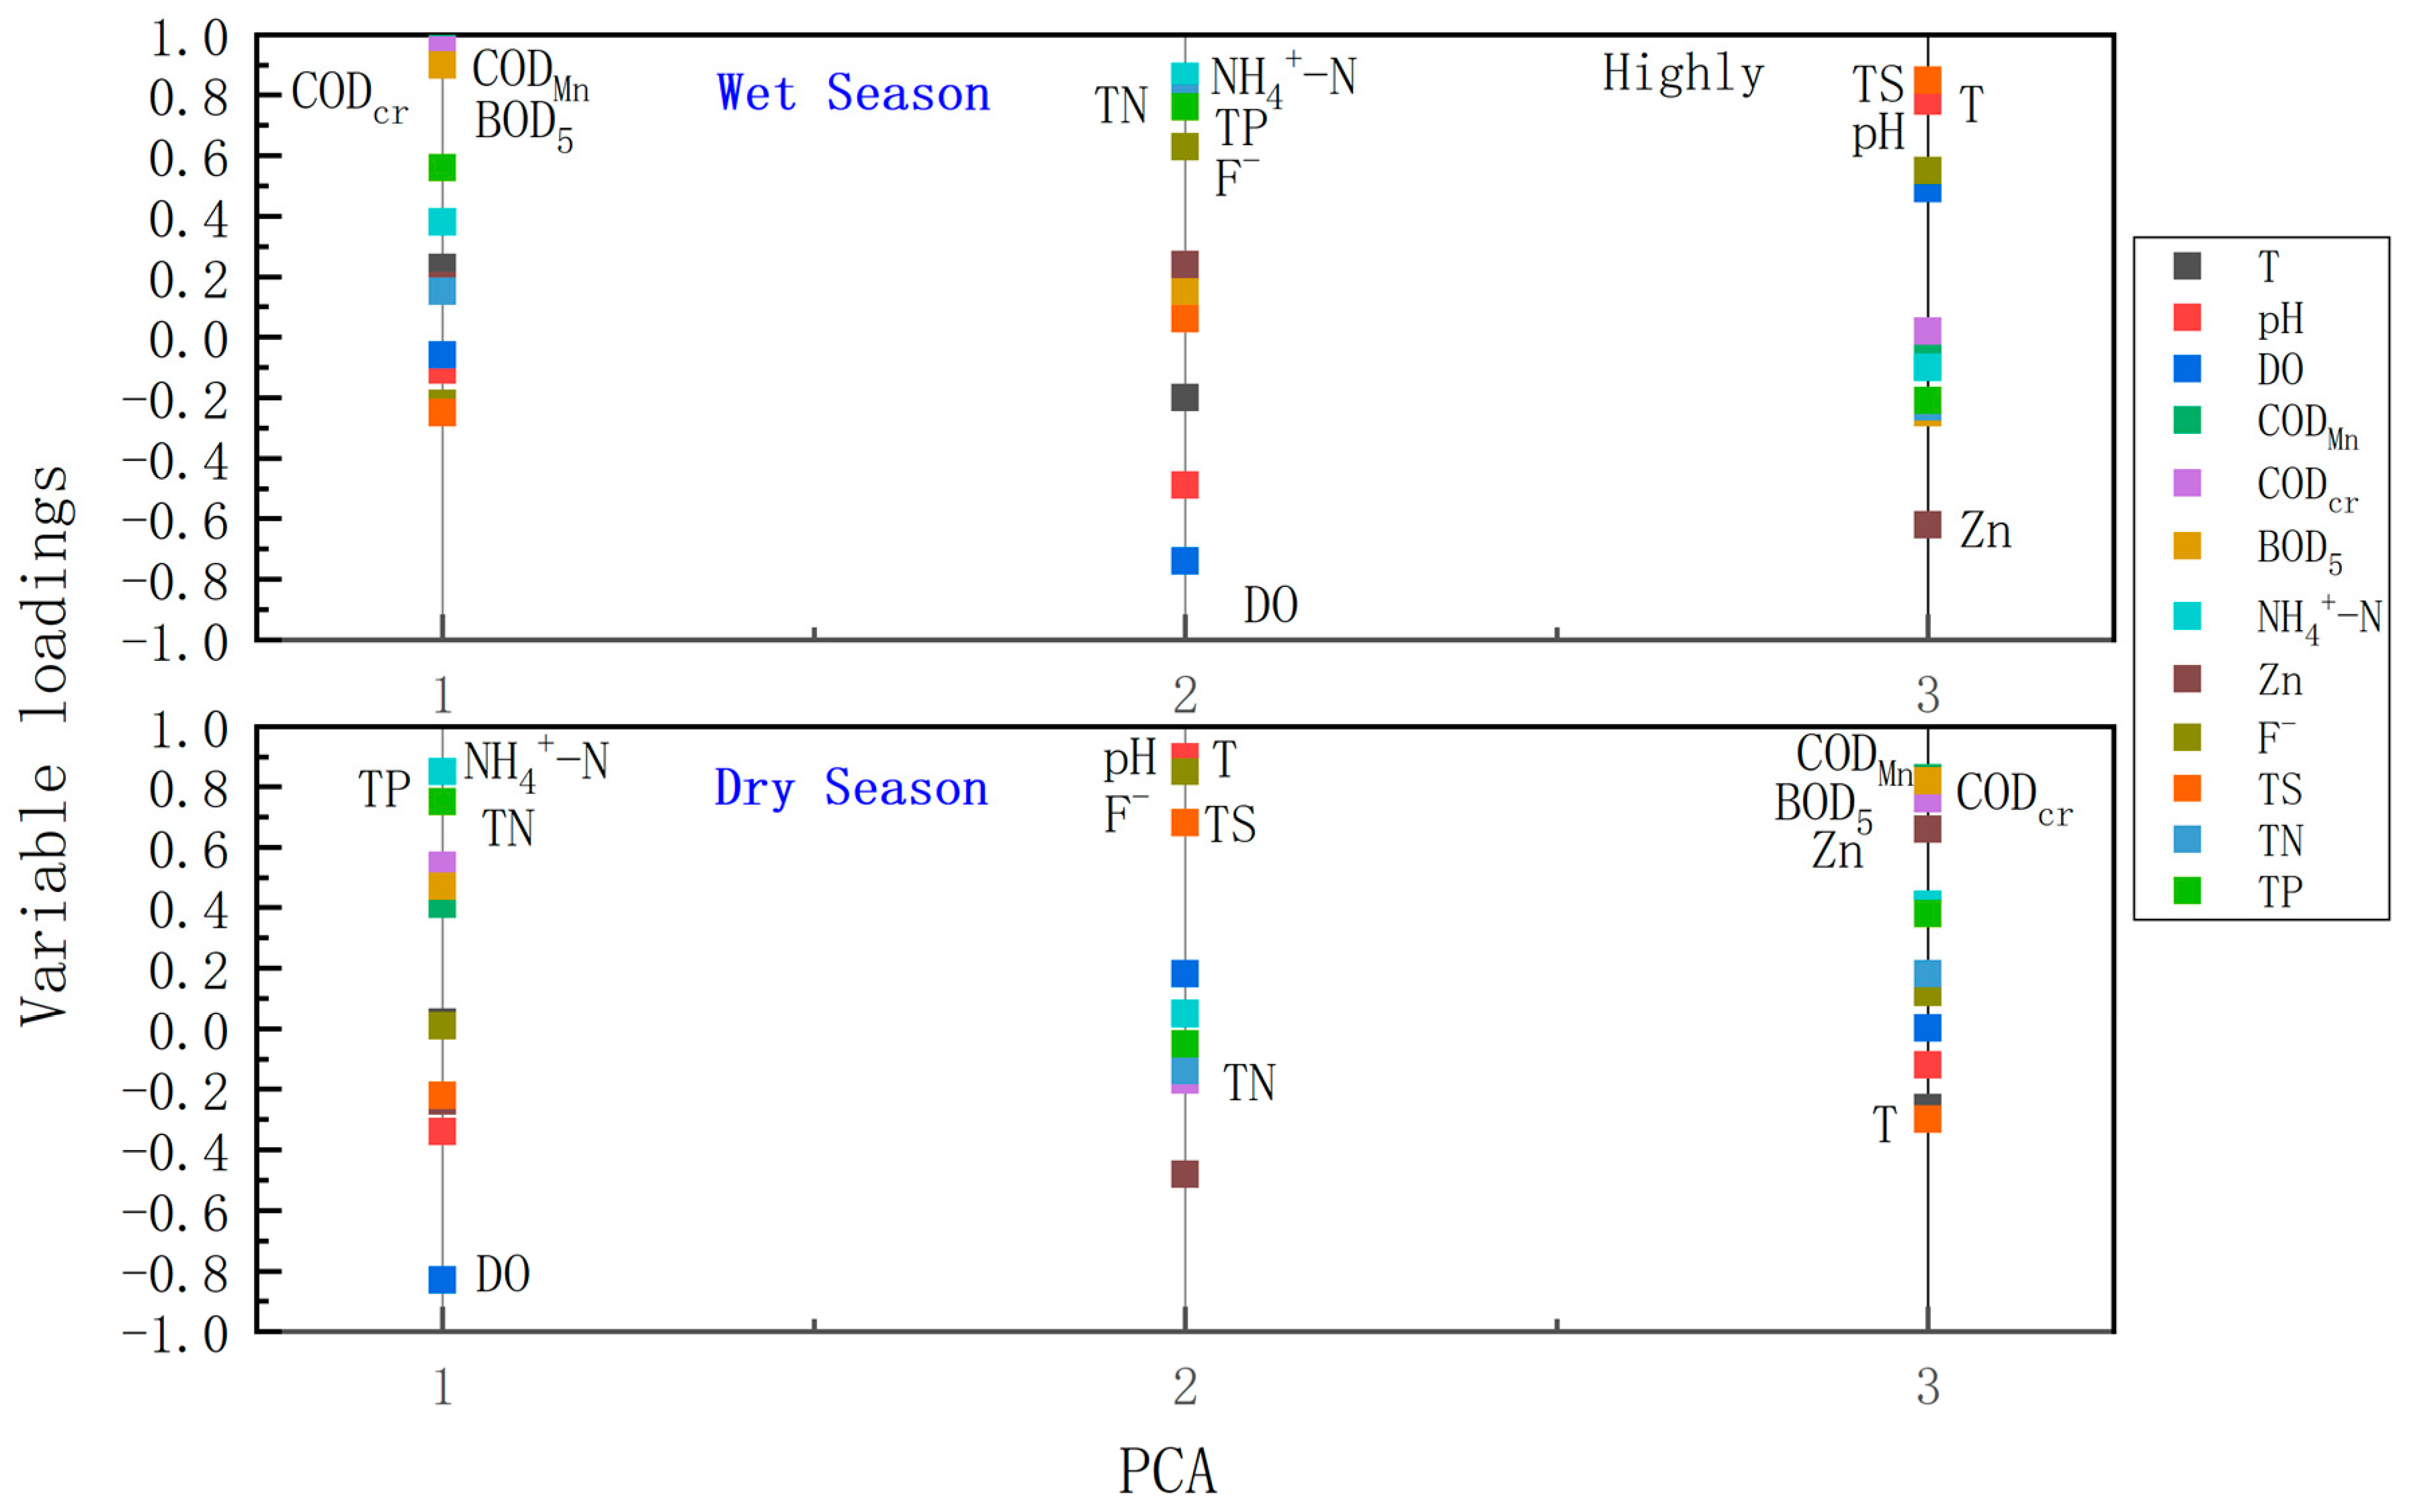
3.1. Identification of Potential Pollution Sources in Wet and Dry Seasons

3.1.1. Wet and Dry Seasons

The precipitation data were gathered from nine rain gauge stations in the Qinhuai River basin. There were three distinct rainy periods in this region each year, accounting for 70.6% of the total annual precipitation. The spring rainy season occurs in April and May; the East Asian monsoon rainy season (commonly called the plum rain) occurs in June and July; the typhoon season occurs in August and September. The multi-year averages of precipitation for these three periods are 189.7, 347.7, and 205.4 mm, respectively. Precipitation is lowest in December and January, accounting for only 6.3% of total annual precipitation. Therefore, the study period was divided into a wet season (April to September) and a dry season (October to the following March).

3.1.2. Identification of Potential Pollution Sources in the Wet Season

PCA was used to analyze the basin’s pollution sources at different periods (Table 4). The first varifactor (PC1) explained 44.81% of the variations in water quality and contained the most information. PC1 exhibited obviously positive correlations with CODcr, CODMn, and BOD5 (Figure 2). This factor represented organic pollution, which is mainly from anthropogenic activities, and can be interpreted as the influences from point sources, such as the discharge of domestic sewage and industrial wastewater. Temporally, the impact of CODcr, CODMn, and BOD5 during the wet season was larger than that during the dry season (Table 4). Furthermore, PC1 had a moderate correlation with TP. This could owe to precipitation from suburban and urban areas exacerbating organic pollution. Thus, PC1 should mainly be interpreted as one kind of mixed pollution influenced by a point source and a non-point source.
PC2, accounting for 20.13% of the total variance, was positively correlated with NH4+−N, TN, F, and TP, and negatively correlated with DO (Figure 2). This mainly represented non-point source pollution, such as runoff from agricultural land and urban areas [37,39,40]. Fluoride ion concentrations at all monitoring stations in this region were lower than 1 mg/mL, indicating either an absence or an extremely low level of pollution. The implication was that fluoride ion concentration most likely resulted from local soils and entered the rivers with rainfall runoff [37]. Therefore, PC2 could be interpreted as non-point source pollution.
PC3 was weighted on T, pH, TS, and F and represented the physicochemical source of variability (Figure 2). The correlation matrix for the wet season dataset indicated that pH had correlations with DO and T. Therefore, PC3 represents a natural source of physicochemical pollution that mostly reflects the ionic properties of the water body, natural changes in the water environment, and the growth status of water plankton [41].

3.1.3. Identification of Potential Pollution Sources in the Dry Season

PC1 had strong positive loadings on TP, NH4+−N, TN, and CODcr and a negative loading on DO, explaining 47.05% of the total variance. The presence of nitrogen could be either from the use of fertilizers or from the natural decomposition of organic matter and the leaching of geological deposits. Ammonium-nitrogen in the city is mainly produced in wastewater from chemical, petroleum, and synthetic fiber manufacturing industries, domestic sewage, and agricultural activities [42]. Phosphorus could be either from point or non-point sources. Since agricultural non-point source pollution was low during the dry season, phosphorus detected during this period was mainly from point source pollution, with only a small amount from non-point source pollution. In addition, PC1 had both a strongly positive loading on CODcr and a negative loading on DO. It was a group of organic factors from point sources, such as uncontrolled domestic discharges. Based on the above analysis, PC1 represented nutrient pollution from a point source, such as industrial wastewater [8,37].
PC2, accounting for 21.02% of the total variance, had positive loadings on T, pH, TS, and F. F could be derived from the weathering of minerals at the upper reaches of the river [43]. PC2 may be represented as a physicochemical source owing to the natural changes in the water environment and the ionic properties of the water body.
PC3, with an apportionment of 10.35%, was strongly and positively correlated with CODcr, CODMn, Zn, and BOD5. Therefore, PC3 could be interpreted as organic pollution from domestic sewage.
The above results indicate that the major pollution sources threatening the Qinhuai River are point pollution from industrial and domestic wastewater and non-point pollution from suburban and urban areas.

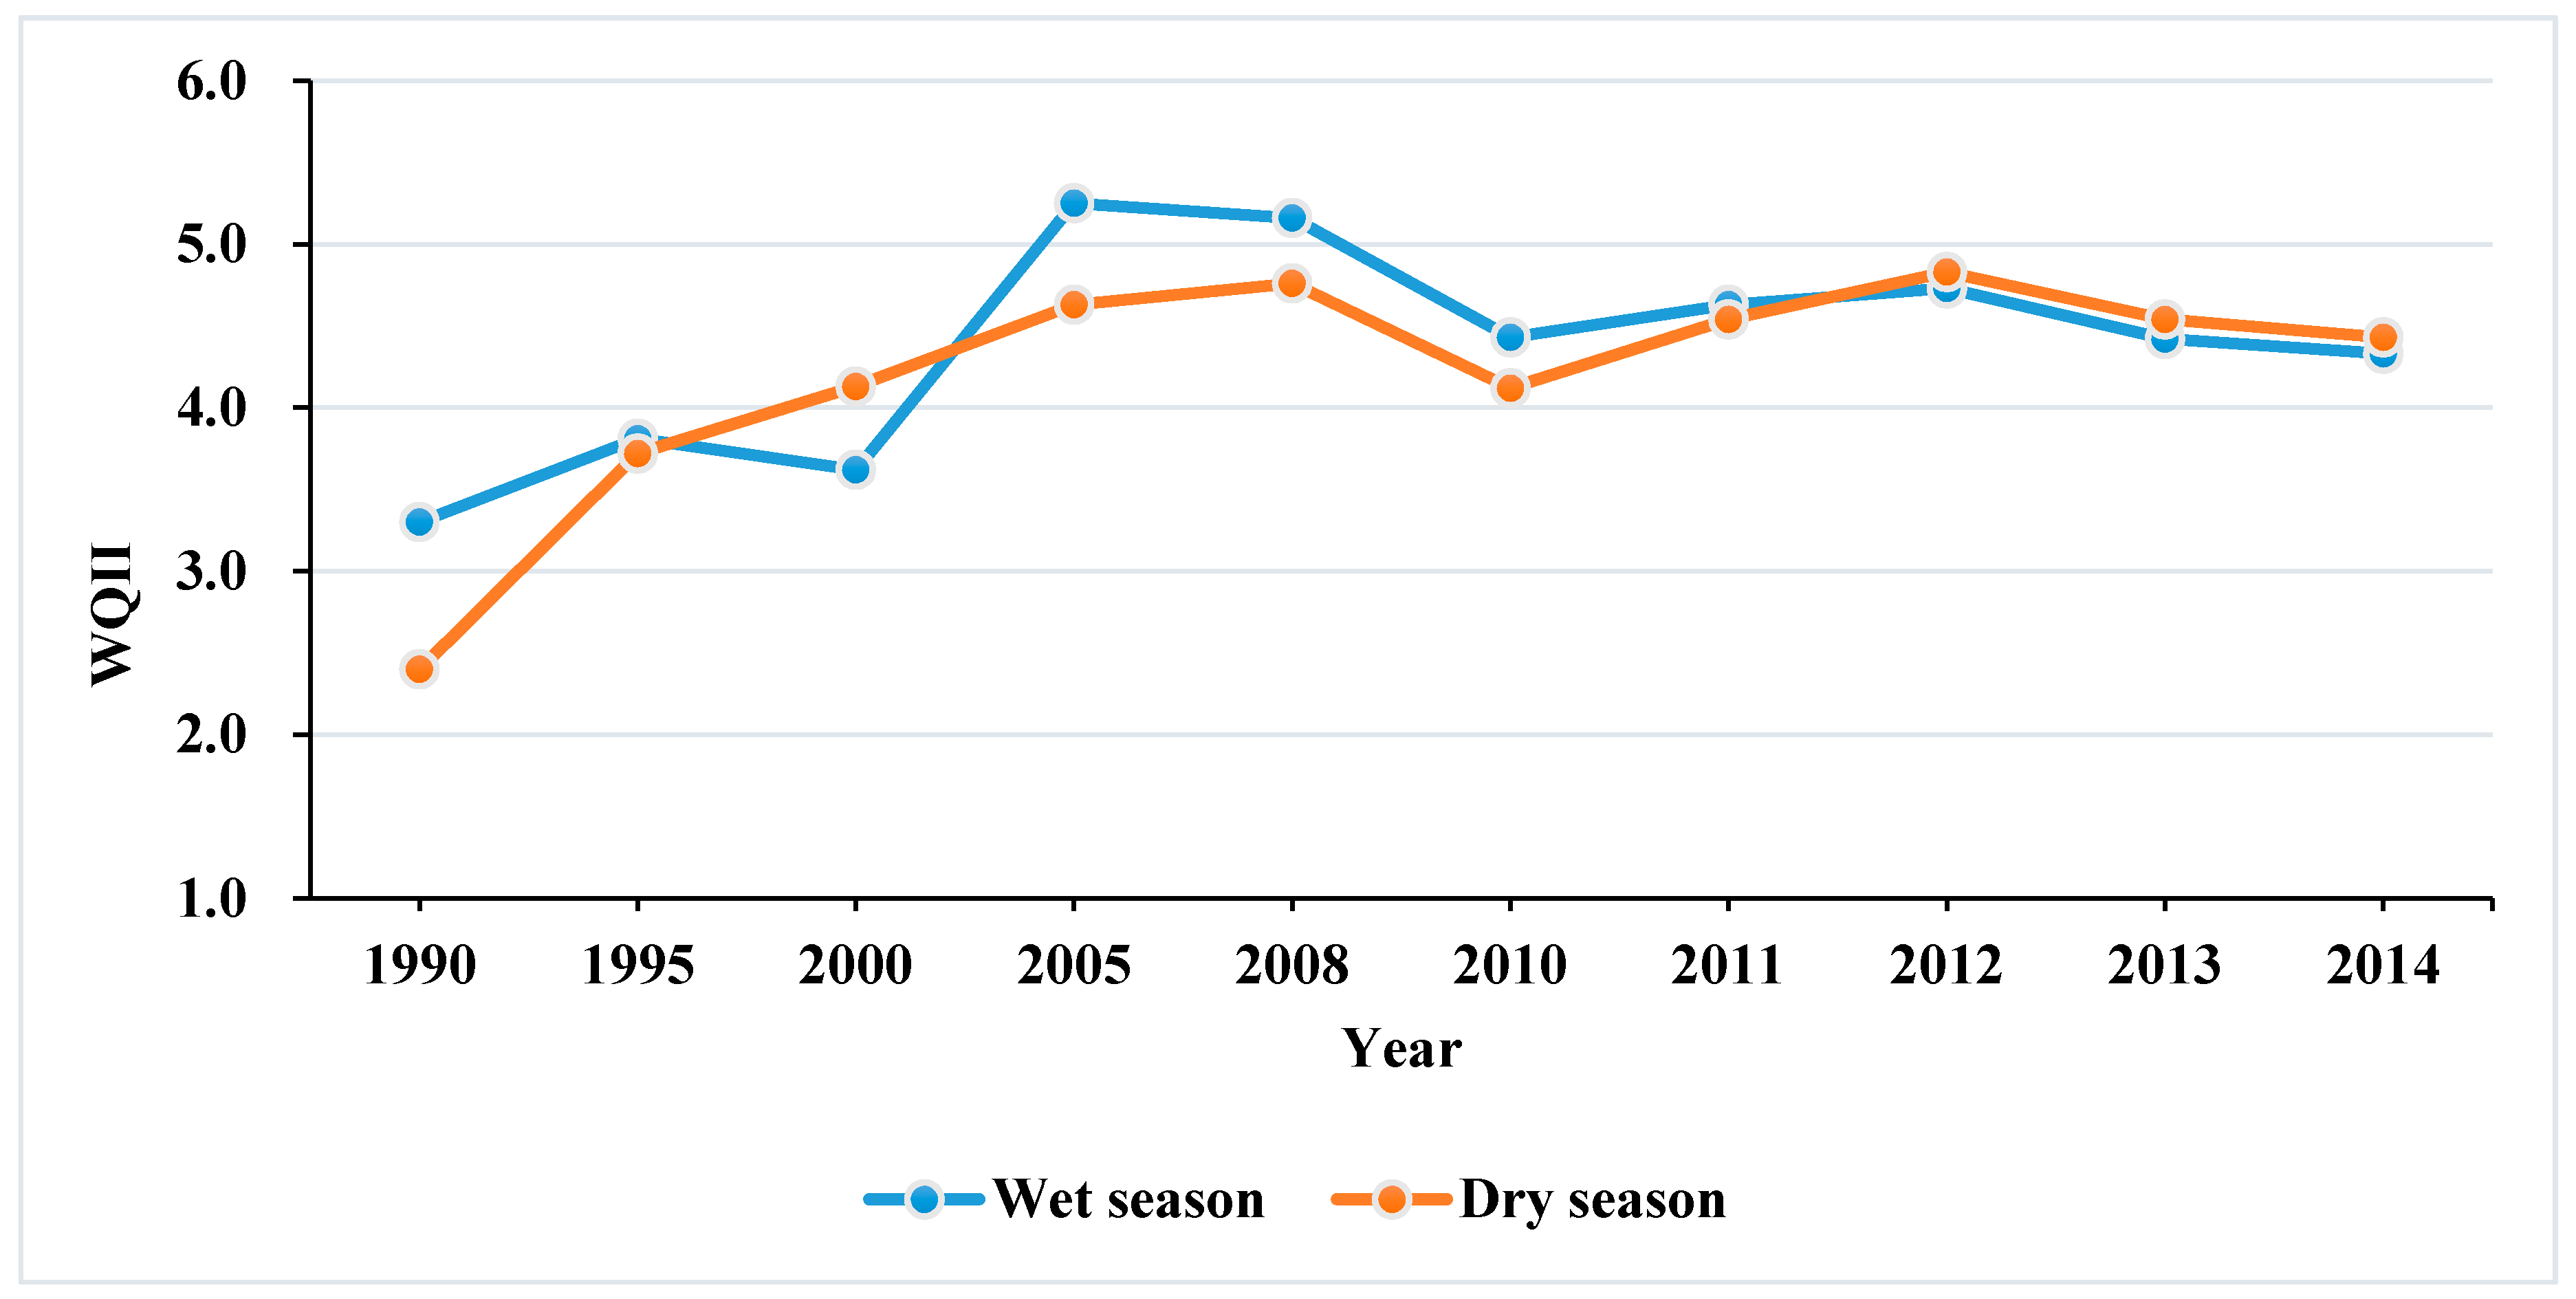
3.2. Spatiotemporal Trends of Water Quality Based on the WQII

Considering the PCA results, TN, TP, NH4+−N, DO, CODcr, CODMn, and BOD5 were taken into account in the calculation of the WQII at all water quality-monitoring sites from 1990 to 2014. Overall, the water quality of the Qinhuai River basin was determined to be mainly Class III (slightly polluted) and Class IV (moderately polluted) (Table 2). In the 1990s, the WQII of the whole basin was determined to be within the range of 3.11~3.61. During this period, water quality at all monitoring stations was determined to be Class III. In the 2000s, the WQII of the basin was in the range of 3.21~5.45. The WQII at approximately 50% of the monitoring stations was between 3.12 and 3.83; another 23.1% of the stations were in the range of 4.04–4.84; the remaining 26.9% of the stations exceeded 5. In the 2010s, the WQII of the basin varied between 3.12 and 5.15. The WQII at approximately 50% of the monitoring stations was between 3.12 and 3.94; another 42.3% of the stations were in the range of 4.03–4.75; the remaining 26.9% of the stations exceeded 5.

3.2.1. Temporal Trend of Water Quality Based on the WQII

The WQII was used to evaluate the levels of pollution of the Qinhuai River basin in both wet and dry seasons between 1990 and 2014. To keep continuity in measurements in all selected years and make data comparable, only the Dongshan Bridge, Zhenzhu Bridge, and Shangfangmen Bridge stations were selected. The change process can be divided into three stages: the first stage (1990–2005), the second stage (2006–2010), and the third stage (2011–2014) (Figure 3). In the first stage (1990–2005), the water quality deteriorated from clean to highly polluted. In the second stage (2006–2010), the water quality improved gradually from high pollution to moderate pollution. In the third stage (2011–2014), water quality deteriorated gradually between 2010 and 2012, and then improved from 2012 to 2014. However, the water quality in the Qinhuai River basin is still moderately polluted. Notably, after 2005, the water quality in 2010 was better than in other years.

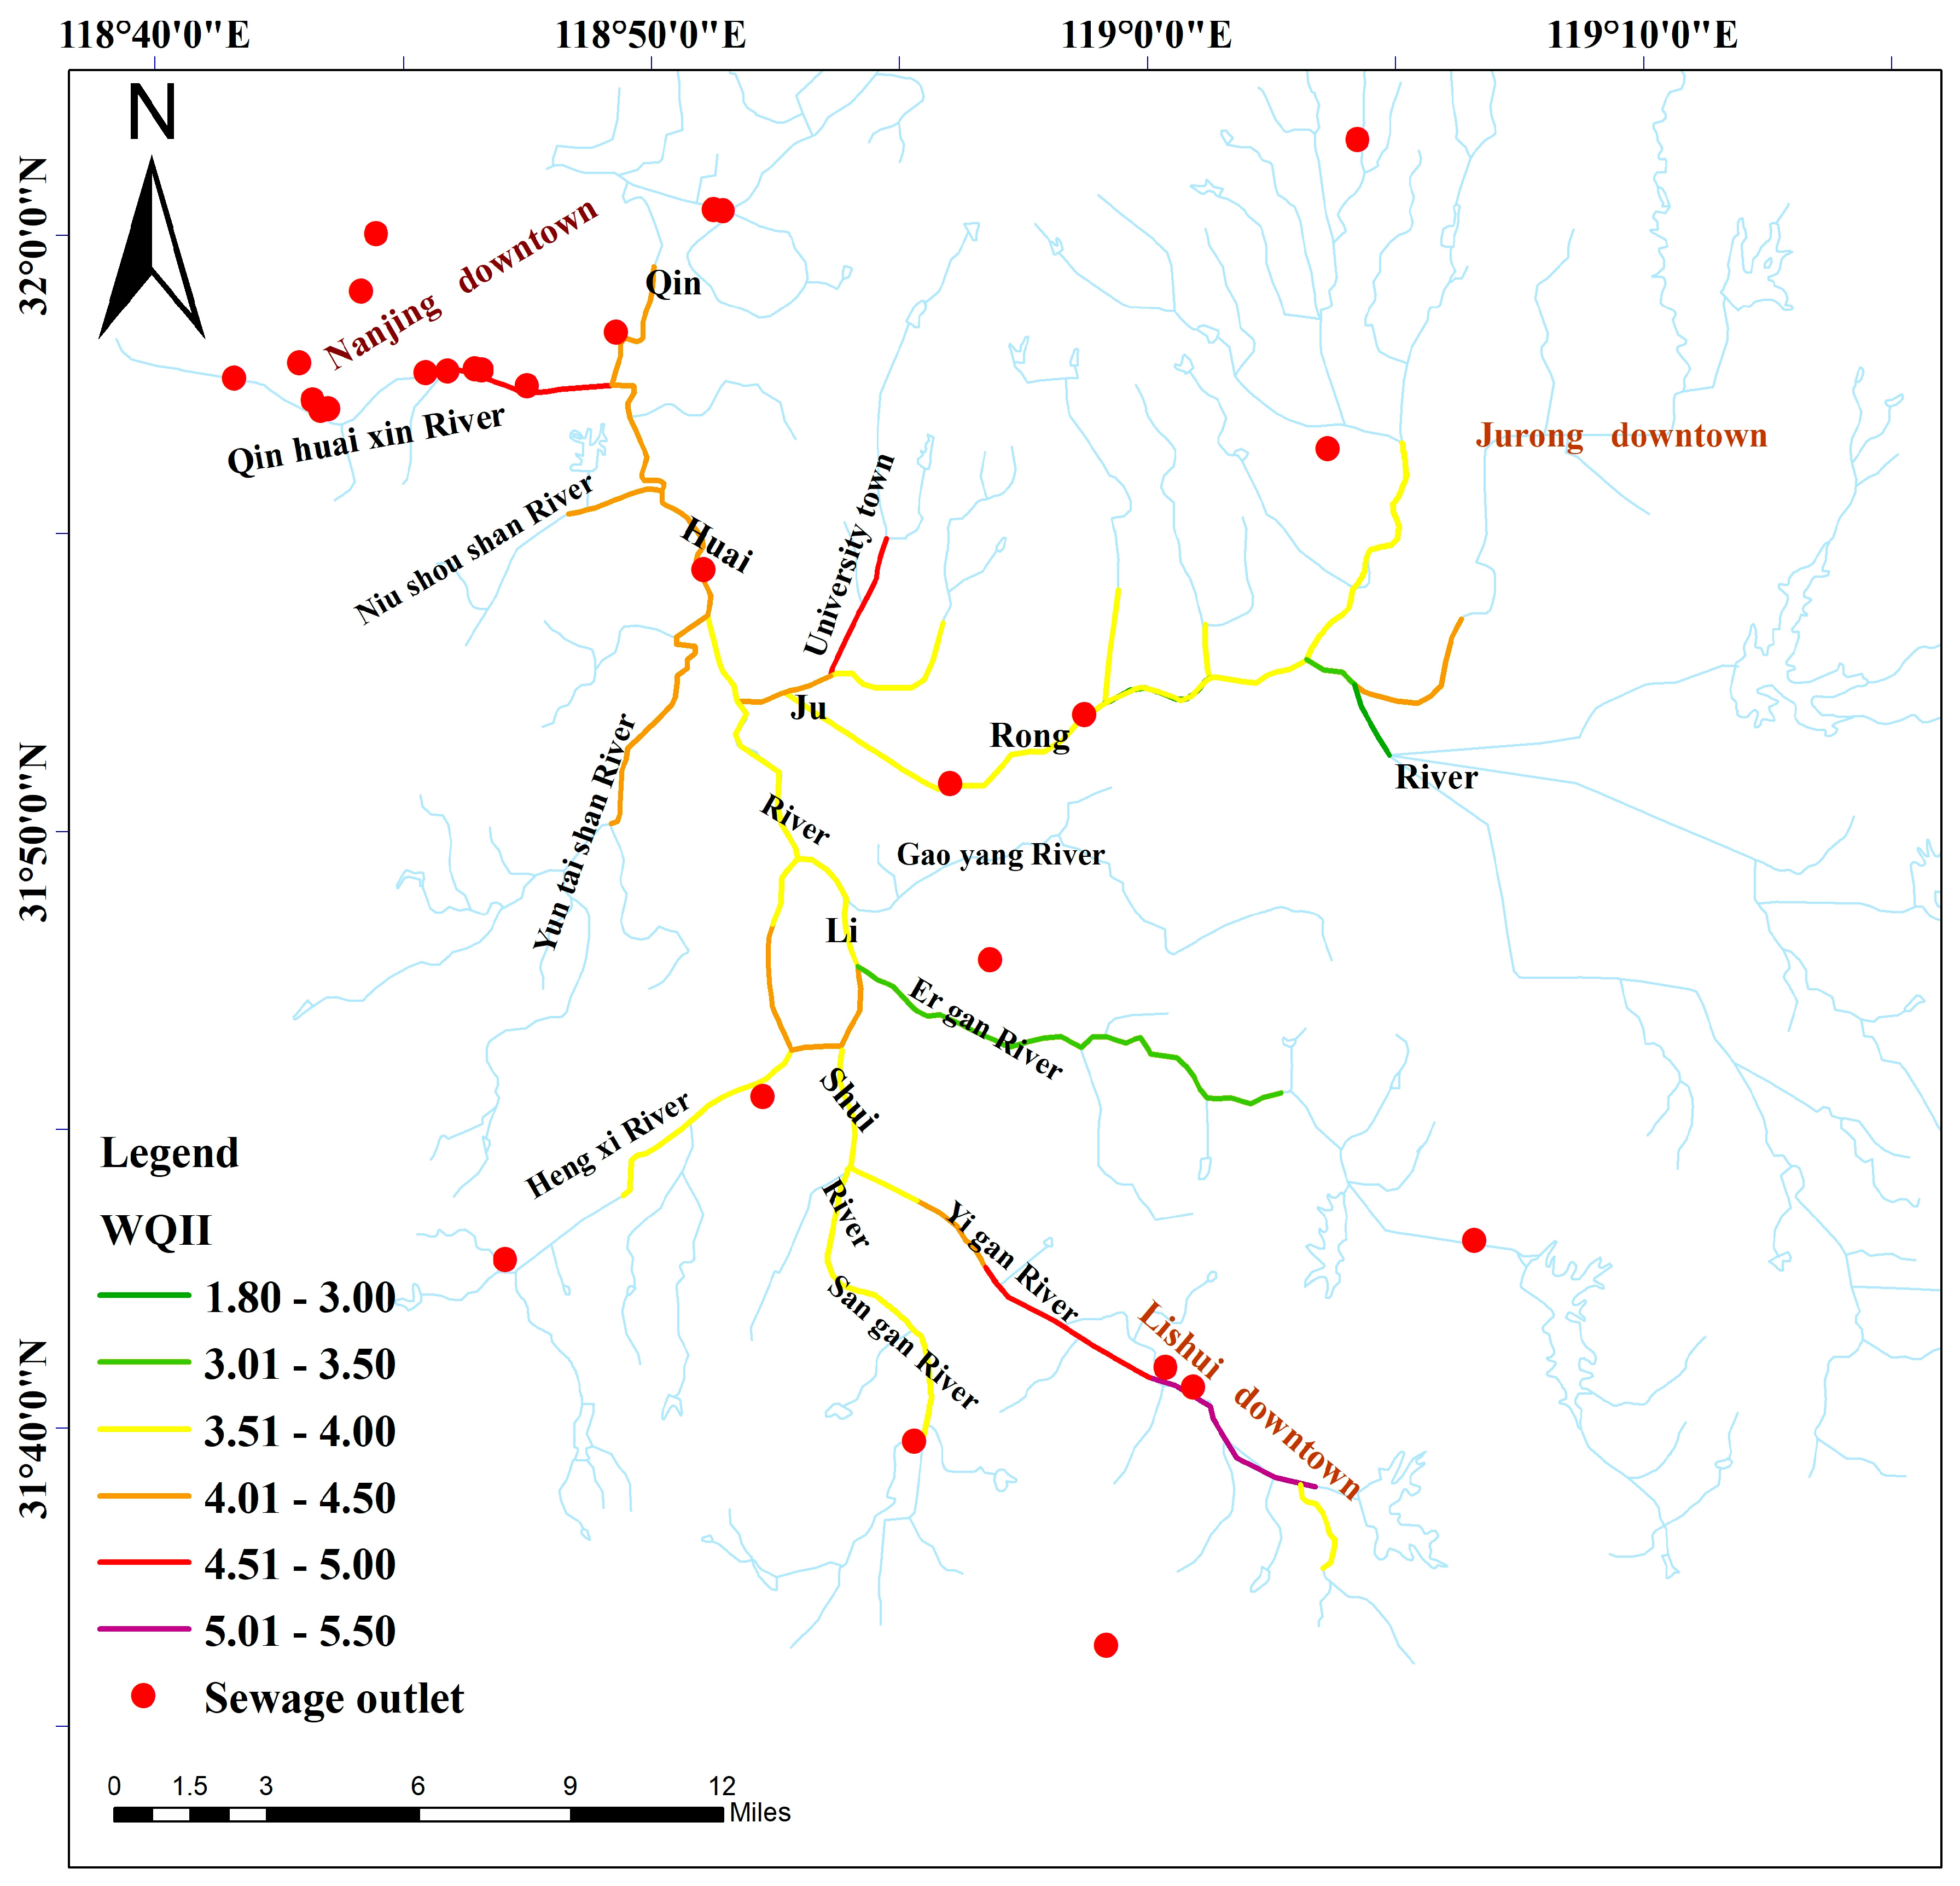
3.2.2. Spatial Pattern of Water Quality Based on the WQII

Spatially, the water quality in the lower reaches of the Qinhuai River was worse than that in the middle reaches, and some tributaries in the upper reaches were also seriously polluted. The WQIIs were high for the Shahe Bridge and Zhenzhu Bridge stations along the Yigan River (Lishui tributary), both of which were highly polluted (Figure 4). The average concentrations of CODcr (29.68 mg/mL–31.45 mg/mL) and BOD5 (4.65 mg/mL–5.1 mg/mL) were high, falling under the IV–V Class water standards (Table 1). Nitrogen and phosphorus concentrations were also more than twice that of the Class V water standard. The TN concentration in the Yigan River even exceeded five times that of the Class V water standard, indicating the seriousness of nitrogen and phosphorus pollution in the area. The water quality in the Jurong River and its tributaries was found to be moderately polluted. Among this sub-basin, the Jiexi River flows through the university town of Jiangning, which is densely populated. The pollution levels from domestic sewage and organic pollutant were high. The water quality in the lower reaches of the Qinhuai River, located in the urban areas of Nanjing, was quite poor. The average concentrations of CODcr (21.92 mg/mL~22.89 mg/mL) and BOD5 (3.35 mg/mL~3.58 mg/mL) in these areas were relatively lower than those in Yigan River.

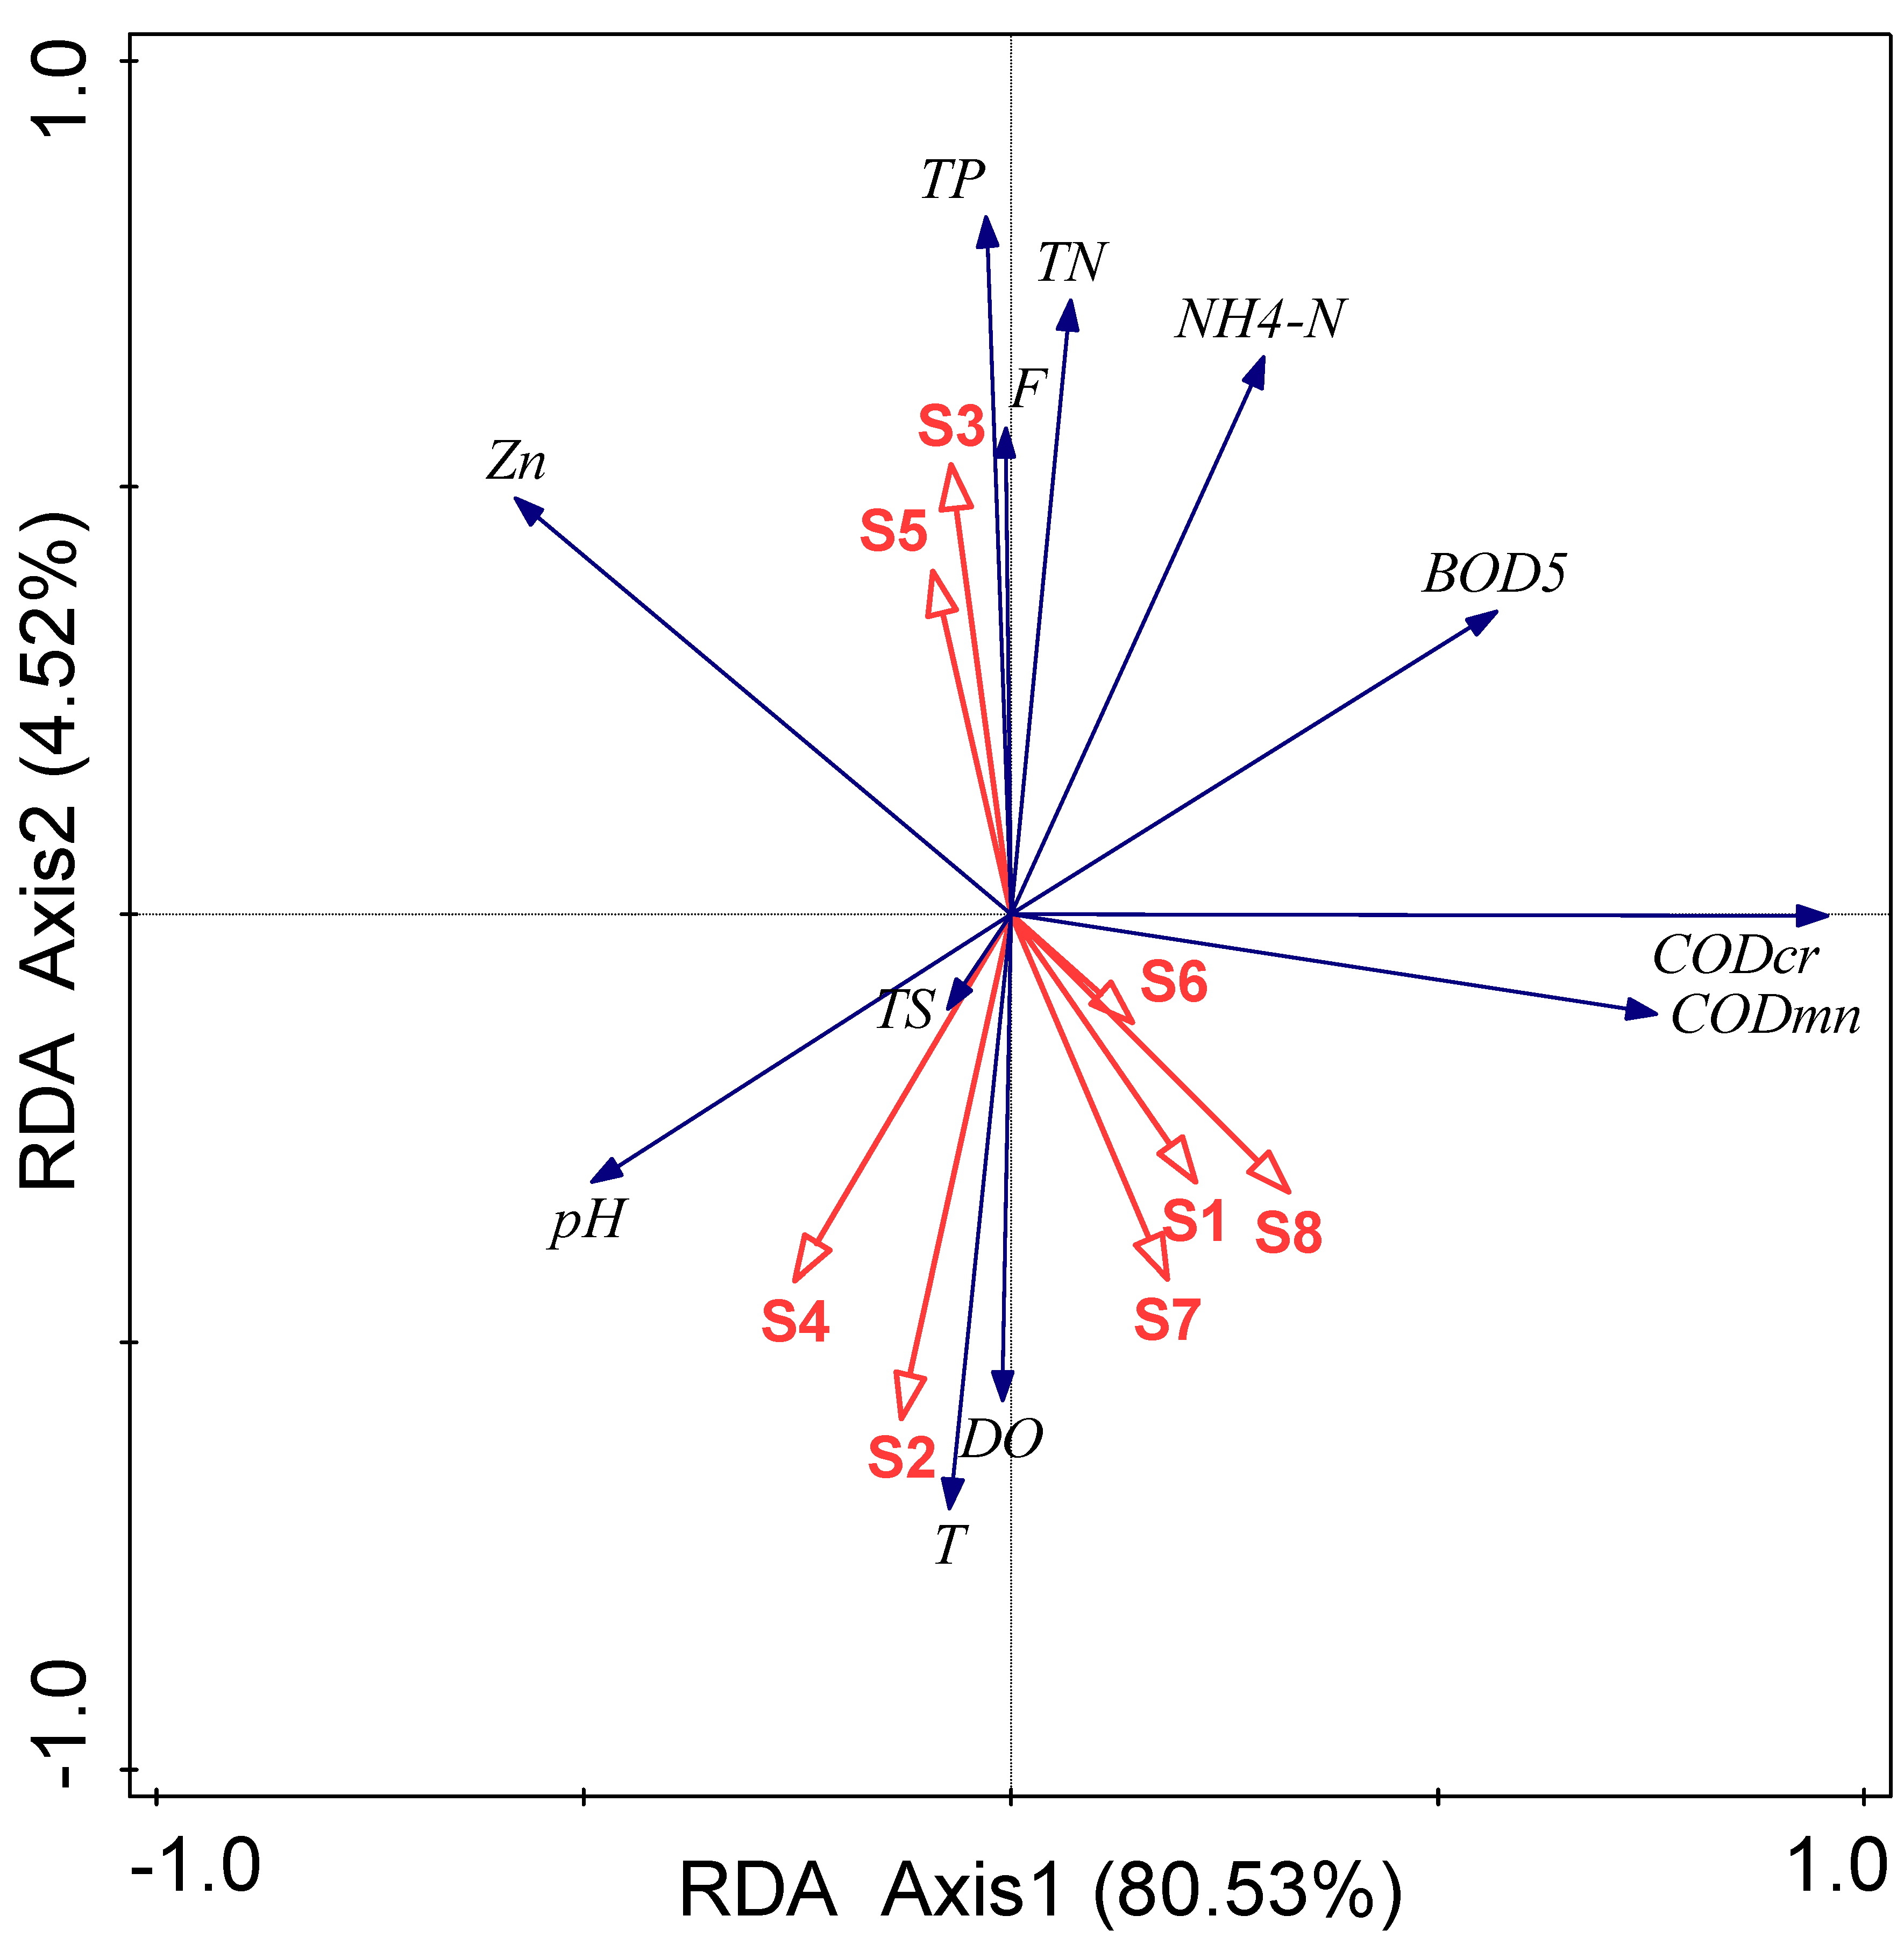
3.3. Analying Influence Factors of Water Quality Using RDA Models

In order to further analyze the factors influencing water quality, this study selected S1—population density (person/km2), S2—Per capita GDP (Yuan), S3—agricultural fertilizer consumption (tons), S4—drainage pipeline density (km/km2), S5—industrial wastewater discharge (tons), S6—sewage discharge (tons), S7—built-up area (km2), and S8—urbanization rate (%). The data were collected from the Nanjing Statistical Yearbooks [44]. In total, 12 water quality indicators were taken as response variables, while the influencing factors were taken as explanatory variables. It was found that the gradient length of water quality data was 0.6 (less than 3), so the linear model RDA was selected for the correlation analysis of social economic factors and water quality (Figure 5). Agricultural fertilizer consumption (S3) and industrial wastewater discharge (S5) had a strong positive correlation with TN, TP, NH4+−N, F, followed by BOD5 and Zn. Sewage discharge (S6), urbanization rate (S8), population density (S1), and built-up area (S7) have positive correlations with organic pollution, such as CODCr, CODMn, and DO. Sewage discharge (S6) and urbanization rate (S8) had a positive impact on BOD5; per capita GDP (S2) and drainage pipeline density (S4) have a greater positive impact on pH, DO, and T. In general, agricultural fertilizer consumption and industrial wastewater discharge were the main pollution sources of nutrients such as nitrogen and phosphorus. Population density, urbanization, and wastewater discharge were related to organic pollution. The density of drainage pipeline was related to the physical parameters of the water body.

4. Discussion

4.1. Temporal Variation in Water Quality

In this study, the combination of MST, WQII, and GIS produced some new and valuable findings. Long period observation (1990–2014) indicates both the positive and negative effects of anthropogenic activities on water quality. In the Qinhuai River, agricultural runoff and domestic and industrial waste discharge contributed to the deterioration of water quality during the research period. Similarly, these factors also caused water pollution in the Sinos River (southern Brazil) [17], Nag River (India) [5], Kinta River (Malaysia) [3], Jhelum River (Pakistan) [2], and Akaki River (Ethiopia) [45]. However, considering the longer term change of water quality, national and regional policies for water resource management have played an important role in improving water quality in China. Then, these national and regional policies will influence the impacts of anthropogenic and natural processes on water quality. The water quality of the Qinhuai River tended to improve in the wet season of 2005. From 2005 to 2014,the WQII reached a low value in 2010 (Figure 3). There are two possible reasons for the low value in 2010. The first one is a national policy. The “Outline of the 11th Five-Year Plan (FYP) for National Economic and Social Development (2006–2010)”clearly put forward that urban sewage treatment rate should not be less than 70% and the total discharge of major pollutants should be reduced by 10% in 2010 compared with 2005 [46]. In fact, the discharges of industrial wastewater, COD, and NH3−N reduced by 2.3% 21.6%, and 48%, respectively, in 2010. The second reason is a local policy. After the “2007 Oxygenation Crisis of Taihu Lake”, the Jiangsu provincial government significantly increased investment in managing water pollution and implemented an industrial restructuring program [47]. As a result, the compliance rate of industrial wastewater discharge reached a high value in 2010, 98.3%. However, the compliance rate started to decline after 2010 [48].
In the Qinhuai River, water protection engineering projects also have a certain regulating effect on water quality. The New Qinhuai River Gate is mainly for flood discharge during the rainy season and water diversion from the Yangtze River to improve the water environment, although its operation varied between years. Thus, open period of the New Qinhuai River Gate can be of great significance for water quality. Precipitation and total discharge in 2009 and 2010 were larger than in other years (Table 5). Rainwater can alleviate water quality deterioration by diluting pollutant concentration. The floodgate was open for a longer period in 2010 than in any other year (Table 5). Flood discharge from the Qinhuai River to the Yangtze River accelerated the water cycle of the Qinhuai River. Moreover, the time of water diversion from the Yangtze River to the Qinhuai River was 42 days in 2010 and 43 days in 2012 (Table 5). It can be inferred that the New Qinhuai River Gate was mainly used for flood discharge in 2009 and improved water quality in 2012, whereas it was used for discharge and water diversion in 2010. Therefore, owing to precipitation, water transfer, and policy, the water quality in 2010 was better than in other years.

4.2. Spatial Variation in Water Quality

Compared with agricultural areas, water pollution is more serious in urbanized areas. Notably, there are three urban areas with heavily pollution in Qinhuai River basin. The first area is Lishui County. Two sampling sites (LS2 and LS3) in the Yigan River are located in Lishui County with relatively concentrated populations and a limited capacity for sewage treatment. With insufficient treatment, domestic sewage and industrial wastewater are largely discharged directly into the river. The second area is the university town of Jiangning. The Jiexi River flows through the university town of Jiangning, which is densely populated. The water is heavily polluted by domestic sewage and organic pollutants. The third area is Nanjing Main City and the Jiangning urban area, in the lower reaches of the Qinhuai River. The water in the urban area is seriously polluted. The concentrations of CODcr and BOD5 are relatively low, indicating lower pollutants from domestic sewage. Nitrogen and phosphorus pollution is owed mainly to point pollution sources, such as sewage treatment plants and industrial wastewater, and non-point source pollution caused by rainfall runoff from lawns, gardens, and land surfaces.
The Yuntaishan River (QS2), Hengxi River and its downstream basin area (LS7, QS3, QS4, LM1), and the upper reaches of the Jurong River (JM4) are surrounded by large areas of farmland and built-up area. In the Jurong River sub-basin, the JM4 monitoring point is mainly impacted by the Jurong urban area, villages, and agricultural land along the river. Regarding other rivers (JS1–JS4), farmland and villages are alternately distributed along these rivers. Waste or landfill leachate from garbage collection stations (points) along the river flows into the river under the action of external forces, such as wind and runoff, polluting the water source [47,49]. Moreover, rural domestic sewage and wastewater produced from livestock and poultry farming are discharged into the river directly, causing serious organic pollution in the Jurong River tributary [50,51]. Furthermore, non-point source pollution, such as pesticides, fertilizers, and aquaculture wastewater, will also be discharged into the river through pumping stations with rainfall runoff, which will have an impact on water quality [52,53]. In the Lishui River sub-basin, most of the other Lishui River tributaries are surrounded by large areas of farmland where rainfall causes agricultural non-point source pollution. Thus, spatial analysis results showed that the Jurong River (the secondary channel) and the Yigan River should receive equal attention to the lower reaches of the Qinhuai River due to their similar pollution situations.

4.3. Control the Pollution Sources in Wet Season

In the Qinhuai River, the mixed pollution influence by both point and non-point sources became the main cause for water pollution in the basin in the wet season. After 2005, the water quality in the dry season has become better than that in wet season. Other studies have also found that non-point source pollution caused by runoff from agricultural land and urban areas was the main source of pollution in the wet season [37,39,40]. This study also found that non-point source pollution has become the main pollution source in the basin after point source pollution was gradually controlled in the last decade. However, the PCA results suggested that mixed-pollution control was the primary task in the wet season. Point source pollution mainly comes from factories and sewage pumping stations. In the rainy season, some factories take the opportunity to illegally discharge large amounts of sewage, particularly in rural areas [54]. During the period of heavy rainfall, to mitigate the risk of floods, the floodgates of sewage pumping stations along the rivers are opened, allowing the rainwater–sewage mixture to flow into the river. Therefore, it is important to improve the management of sewage discharge during the rainy season to balance the flood control and water quality protection [55]. Thus, point source pollution in the rainy season should receive more attention.
Additionally, more pollution control should be implemented in the Jurong River, the Yigan River, and the lower Qinhuai River areas. Pollution control measures should be supplemented by ecological measures, such as soil and water conservation and the remediation of forests and grasslands [56,57]. In the lower reaches of the Qinhuai River, measures for improving water quality include reducing the amount of pollutants discharged and controlling the total discharge volume [58].

4.4. Limitation and Future Research

Similar to many studies, this study has several limitations, and corresponding future studies warrant further exploration. First, only three sites (Dongshan Bridge, Zhenzhu Bridge, and Shangfangmen Bridge) were monitored every three months from 1990 to 1995. With the development of technology and more investment from government, the number of water quality monitoring sites grew to five in 2000, 15 in 2005, and then 26 in 2008. After 2005, the frequency of water quality monitoring mainly depended on the importance of the sites. Water quality monitoring sites were classified into provincial key monitoring sites (measurement frequency: once a month), provincial general monitoring sites (measurement frequency: once every two months), and precinct (municipal) monitoring sites (measurement frequency: once every two months). Owing to the fact that that TN, TP, and BOD5 were not monitored before 2000, NH4+−N, DO, CODcr, CODMn were considered when calculating WQII. Considering the continuity of data measured at all selected sites, only 12 parameters at three sites are subjected to WQII to analyze the temporal differences in river water quality. To weaken the impact of inconsistent sampling frequency, it is, therefore, reasonable to select a seasonal scale for the study of water quality using PCA. Second, this research focused on providing a reference for understanding the seasonal and interannual variations in water quality, as well as source identification. In future work, quantitative information on the illegal discharge of sewage from factories and sewage pumping stations in the wet season and the impact of anthropogenic activities (water transfer and urbanization) will further improve our understanding of the impacts of these processes on water quality in the Qinhuai River and other rivers undergoing a rapid urbanization. Third, multivariate statistic techniques (PCA, RDA) were performed in the current study. PCA can identify potential pollution sources with a large contribution to water pollution, although this alone cannot determine the quantitative contributions of the identified pollution sources to each variable [41], nor can it describe the complexity of the process of migration and transformation of pollution sources. In future studies, new models, such as positive matrix factorization (PMF), machine learning, the Soil Water and Assessment Tool (SWAT), and others, can be applied to apportion contributions of potential pollution sources to each water quality parameter, analyze the pollutant load characteristics in different sub-basins, and quantify the relationship between land management and water quality [59,60,61].

5. Conclusions

Accurate monitoring and assessment of water quality has been very important for water resource management. In the current study, multivariate statistical techniques and WQII were applied in water quality assessment in the Qinhuai River, East China. The technique of PCA has successfully extracted TN, TP, NH4+−N, DO, CODcr, CODMn, and BOD5 as the most important parameters used for water quality assessment. According to the PCA results, in the wet season, 81.14% of the total variance was ascribed to three factors that can be attributed to mixed pollution, non-point pollution, and physicochemical sources; in the dry season, 78.42% of the total variance can be explained by three factors that were attributed to organic pollution, nutrition pollution, and physicochemical sources. This research also found that the mixed pollution influenced by both point source and non-point sources became the main cause for water pollution in the basin in the wet season. RDA results showed that agricultural fertilizer consumption and industrial wastewater discharge were the main pollution sources for nutrients such as nitrogen and phosphorus, while population density, urbanization, and wastewater discharge were related to organic pollution.
According to WQII results, the water qualities in the different sections of the Qinhuai River were determined to be mainly in Class III (slightly polluted) or Class IV (moderately polluted). Different from previous short-term studies, this research found that water quality gradually deteriorated between 1990 and 2005, improved between 2006 and 2010, and then deteriorated again afterwards. National and regional policies influenced the impacts of anthropogenic and natural processes on water quality. The WQII map showed that the Jurong River (the secondary channel) and its tributary, the Yigan River, and the lower reaches of the Qinhuai River were relatively heavily polluted. Thus, the Jurong River (the secondary channel) and its tributary, the Yigan River, and the lower reaches of the Qinhuai River should receive equal attention due to their similar pollution situations. Our results confirm the validity of multivariate statistical techniques and WQII for assessing water quality. Different contributions from point and non-point pollution sources in subregions of the river basin between the dry and wet seasons also highlight the need for tailored water management policies, considering the spatiotemporal variation.

Author Contributions

Conceptualization, X.M., L.W., and H.Y.; investigation, X.M., N.L., and C.G.; validation, L.W. and H.Y.; project administration, L.W.; resources, C.G.; writing—original draft preparation, X.M.; writing—review and editing, H.Y.; funding acquisition, X.M., L.W., H.Y. All authors have read and agreed to the published version of the manuscript.

Funding

This work was supported by the Natural Science Research Projects of the Jiangsu Higher Education Institution (Grant No. 19KJB170002), the Research Foundation for Advanced Talents (Grant No. 921001), the Major Science and Technology Program for Water Pollution Control and Treatment (Grant No. 2017ZX07203002-02-01), the Nanjing Water Science and Technology Project (201806), and the Open Research Fund Program of Jiangsu Key Laboratory of Atmospheric Environment Monitoring and Pollution Control (KHK1806), a project funded by the Priority Academic Program Development of Jiangsu Higher Education Institutions (PAPD).

Acknowledgments

The authors sincerely thank the anonymous reviewers and members of the editorial team for their helpful comments and contributions.

Conflicts of Interest

No conflict of interest exists in the submission of this manuscript, and the manuscript was approved by all authors for publication.

References

  1. Yang, H.; Flower, R.J.; Thompson, J.R. Sustaining China’s water resources. Science 2013, 339, 141. [Google Scholar] [CrossRef] [PubMed]
  2. Mir, R.A.; Gani, K.M. Water quality evaluation of the upper stretch of the river Jhelum using multivariate statistical techniques. Arab. J. Geosci. 2019, 12, 445. [Google Scholar] [CrossRef]
  3. Isiyaka, H.A.; Mustapha, A.; Juahir, H.; Phil-Eze, P. Water quality modelling using artificial neural network and multivariate statistical techniques. Model. Earth Syst. Environ. 2018, 5, 583–593. [Google Scholar] [CrossRef]
  4. Sun, X.; Zhang, H.; Zhong, M.; Wang, Z.; Liang, X.; Huang, T.; Huang, H. Analyses on the temporal and spatial characteristics of water quality in a seagoing river using multivariate statistical techniques: A case study in the Duliujian River, China. Int. J. Environ. Res. Public Health 2019, 16, 1020. [Google Scholar] [CrossRef] [PubMed] [Green Version]
  5. Dutta, S.; Dwivedi, A.; Kumar, M.S. Use of water quality index and multivariate statistical techniques for the assessment of spatial variations in water quality of a small river. Environ. Monit. Assess. 2018, 190, 718. [Google Scholar] [CrossRef]
  6. Yang, H.; Lu, G.H.; Yan, Z.H.; Liu, J.C.; Dong, H.K.; Jiang, R.R.; Zhou, R.R.; Zhang, P.; Sun, Y.; Nkooma, M. Occurrence, spatial-temporal distribution and ecological risks of pharmaceuticals and personal care products response to water diversion across the rivers in Nanjing, China. Environ. Pollut. 2019, 255, 113132. [Google Scholar] [CrossRef]
  7. Varol, M.; Gökot, B.; Bekleyen, A.; Şen, B. Spatial and temporal variations in surface water quality of the dam reservoirs in the Tigris River Basin, Turkey. Catena 2012, 92, 11–21. [Google Scholar] [CrossRef]
  8. Singh, K.P.; Malik, A.; Sinha, S. Water quality assessment and apportionment of pollution sources of gomti river (India) using multivariate statistical techniques—A case study. Anal. Chim. Acta 2005, 538, 355–374. [Google Scholar] [CrossRef]
  9. Gorgoglione, A.; Bombardelli, F.A.; Pitton, B.J.L.; Oki, L.R.; Haver, D.L.; Young, T.M. Uncertainty in the parameterization of sediment build-up and wash-off processes in the simulation of water quality in urban areas. Environ. Model. Softw. 2019, 111, 170–181. [Google Scholar] [CrossRef]
  10. Lumb, A.; Sharma, T.C.; Bibeault, J.F. A review of genesis and evolution of water quality index (wqi) and some future directions. Water Qual. Expo. Health 2011, 3, 11–24. [Google Scholar] [CrossRef]
  11. Debels, P.; Figueroa, R.; Urrutia, R.; Barra, R.; Niell, X. Evaluation of water quality in the Chillán River (Central Chile) using physicochemicalparameters. Environ. Monit. Assess. 2005, 110, 301–322. [Google Scholar] [CrossRef] [PubMed]
  12. Kannel, P.; Lee, S.; Lee, Y.-S.; Kanel, S.; Khan, S. Application of water quality indices and dissolved oxygen as indicators for river water classification and urban impact assessment. Environ. Monit. Assess. 2007, 132, 93–110. [Google Scholar] [CrossRef] [PubMed]
  13. Pesce, S.F.; Wunderlin, D.A. Use of water quality indices to verify the impact of Córdoba City (Argentina) on Suquía River. Water Res. 2000, 34, 2915–2926. [Google Scholar] [CrossRef]
  14. Sheik, C.S.; Mitchell, T.W.; Rizvi, F.Z.; Rehman, Y.; Faisal, M.; Hasnain, S.; McInerney, M.J.; Krumholz, L.R. Exposure of soil microbial communities to chromium and arsenic alters their diversity and structure. PLoS ONE 2012, 7, e40059. [Google Scholar] [CrossRef]
  15. Wang, Q.; Wu, X.; Zhao, B.; Qin, J.; Peng, T. Combined multivariate statistical techniques, water pollution index (WPI) and daniel trend test methods to evaluate temporal and spatial variations and trends of water quality at Shanchong River in the Northwest Basin of Lake Fuxian, China. PLoS ONE 2015, 10, e0118590. [Google Scholar] [CrossRef] [PubMed] [Green Version]
  16. Shrestha, S.; Kazama, F. Assessment of surface water quality using multivariate statistical techniques: A case study of the Fuji river basin, Japan. Environ. Model. Softw. 2007, 22, 464–475. [Google Scholar] [CrossRef]
  17. Alves, D.D.; Riegel, R.P.; de Quevedo, D.M.; Osório, D.M.M.; da Costa, G.M.; do Nascimento, C.A.; Telöken, F. Seasonal assessment and apportionment of surface water pollution using multivariate stati stical methods: Sinos River, southern Brazil. Environ. Monit. Assess. 2018, 190, 384. [Google Scholar] [CrossRef]
  18. Rakotondrabe, F.; Ngoupayou, J.R.N.; Mfonka, Z.; Rasolomanana, E.H.; Nyangono, A.J.A.; Ako, A.A. Water quality assessment in the Betare-Oya gold mining area (East-Cameroon): Multivariate statistical analysis approach. Sci. Total Environ. 2018, 610, 831–844. [Google Scholar] [CrossRef]
  19. Ravanbakhsh, M.; Birgani, Y.T.; Dastoorpoor, M.; Angali, K.A. Evaluation of Zohreh River water quality, impacted by natural and anthropogenic pollution sources, using multivariate statistical techniques. Int. J. Environ. Sci. Nat. Resour. 2019, 16, 64–73. [Google Scholar]
  20. Pinto, C.C.; Calazans, G.M.; Oliveira, S.C. Assessment of spatial variations in the surface water quality of the Velhas River Basin, Brazil, using multivariate statistical analysis and nonparametric statistics. Environ. Monit. Assess. 2019, 191, 164. [Google Scholar] [CrossRef]
  21. Islam, M.A.; Rahman, M.M.; Bodrud-Doza, M.; Muhib, M.I.; Shammi, M.; Zahid, A.; Akter, Y.; Kurasaki, M. A study of groundwater irrigation water quality in south-central Bangladesh: A geo-statistical model approach using GIS and multivariate statistics. Acta Geochim. 2017, 37, 193–214. [Google Scholar] [CrossRef]
  22. Ma, X.X.; Wang, L.C.; Wu, H.; Li, N.; Ma, L.; Zeng, C.F.; Yang, J. Impact of Yangtze River water transfer on the water quality of the Lixia River watershed, China. PLoS ONE 2014, 10, e0119720. [Google Scholar] [CrossRef] [PubMed]
  23. Wu, Z.S.; Zhang, D.; Cai, Y.J.; Wang, X.L.; Zhang, L.; Chen, Y.W. Water quality assessment based on the water quality index method in Lake Poyang: The largest freshwater lake in China. Sci. Rep. 2017, 7, 17999. [Google Scholar] [CrossRef] [PubMed]
  24. Sánchez, E.; Colmenarejo, M.F.; Vicente, J.; Rubio, A.; García, M.G.; Travieso, L.; Borja, R. Use of the water quality index and dissolved oxygen deficit as simple indicators of basins pollution. Ecol. Indic. 2017, 7, 315–328. [Google Scholar] [CrossRef]
  25. Sener, S.; Sener, E.; Davraz, A. Evaluation of water quality using water quality index (WQI) method and GIS in Aksu River (SW-Turkey). Sci. Total Environ. 2017, 584, 131–144. [Google Scholar] [CrossRef]
  26. Sankari, S.G.; Prasanna, S.M.; Madhurambal, G. Evaluation of water quality suitability for drinking using drinking water quality index in Nagapattinam district, Tamil Nadu in Southern India. Groundw. Sustain. Dev. 2018, 6, 43–49. [Google Scholar]
  27. Horton, R.K. An index number system for rating water quality. J. Water Pollut. Control Fed. 1965, 37, 300–306. [Google Scholar]
  28. Brown, R.M.; McClelland, N.I.; Deininger, R.A.; Tozer, R.G. A water quality index: Do we dare? Water Sew. Work. 1970, 117, 339–343. [Google Scholar]
  29. Cude, C.G. Oregon water quality index: A tool for evaluating water quality management effectiveness. JAWRA J. Am. Water Resour. Assoc. 2010, 37, 125–137. [Google Scholar] [CrossRef]
  30. Misaghi, F.; Delgosha, F.; Razzaghmanesh, M.; Myersb, B. Introducing a water quality index for assessing water for irrigation purposes: A case study of the Ghezel Ozan River. Sci. Total Environ. 2017, 589, 107–116. [Google Scholar] [CrossRef]
  31. Howladar, M.F.; Al Numanbakth, M.A.; Faruque, M.O. An application of water quality index (wqi) and multivariate statistics to evaluate the water quality around Maddhapara granite mining industrial area, Dinajpur, Bangladesh. Environ. Syst. Res. 2017, 6, 13. [Google Scholar] [CrossRef] [Green Version]
  32. Nouayti, A.; Khattacha, D.; Hilalib, M.; Nouaytiac, N.; Arabid, M. Assessment of groundwater quality using statistical techniques in high Basin of Guir (Eastern High Atlas, Morocco). Mater. Today Proc. 2019, 13, 1084–1091. [Google Scholar] [CrossRef]
  33. Chabuk, A.; Al-Madhlom, Q.; Al-Maliki, A.; Al-Ansari, N.; Hussain, H.M.; Laue, J. Water quality assessment along Tigris river (Iraq) using water quality index (wqi) and gis software. Arab. J. Geoences 2020, 13, 1–23. [Google Scholar] [CrossRef]
  34. Zhao, Z.; Mi, T.; Xia, L.; Yan, W.; Jiang, Y.; Gao, Y. Understanding the patterns and mechanisms of urban water ecosystem degradation: Phytoplankton community structure and water quality in the Qinhuai river, Nanjing city, China. Environ. Sci. Pollut. Res. 2013, 20, 5003–5012. [Google Scholar] [CrossRef]
  35. Gao, Y.Q.; Lai, L.J.; Yao, M.; Ma, Z.Z. Water environment quality assessment based on normal cloud-fuzzy variable set evaluation model. J. Coast. Res. 2019, 93, 39–46. [Google Scholar] [CrossRef]
  36. Singh, H.; Singh, D.; Singh, S.K.; Shukla, D.N. Assessment of river water quality and ecological diversity through multivariate statistical techniques, and earth observation dataset of rivers Ghaghara and Gandak, India. Int. J. River Basin Manag. 2017, 15, 1–14. [Google Scholar] [CrossRef]
  37. Huang, F.; Wang, X.; Lou, L.; Zhou, Z.; Wu, J. Spatial variation and source apportionment of water pollution in Qiantang River (China) using statistical techniques. Water Res. 2010, 44, 1562–1572. [Google Scholar] [CrossRef]
  38. Lep, J.; Milauer, P. Multivariate Analysis of Ecological Data Using CANOCO; Cambridge University Press: Cambridge, UK, 2003. [Google Scholar]
  39. Hülya, B.; Hayal, B. Water pollution sources assessment by multivariate statistical methods in the Tahtali Basin, Turkey. Environ. Geol. 2008, 54, 275–282. [Google Scholar]
  40. Simeonov, V.; Stratis, J.A.; Samara, C.; Zachariadis, G.; Voutsa, D.; Anthemidis, A.; Sofoniou, M.; Kouimtzis, T. Assessment of the surface water quality in northern Greece. Water Res. 2003, 37, 4124. [Google Scholar] [CrossRef]
  41. Haji, G.M.; Melesse, A.M.; Reddi, L. Water quality assessment and apportionment of pollution sources using APCS-MLR and PMF receptor modeling techniques in three major rivers of South Florida. Sci. Total Environ. 2016, 566, 1552–1567. [Google Scholar] [CrossRef]
  42. Ma, X.X. Impact of Environmental Change on Water Environmental and Hydrological-Case Study of Qinhuai River Watershed; Nanjing University: Nanjing, China, 2016. (In Chinese) [Google Scholar]
  43. Su, S.; Zhi, J.; Lou, L.; Huang, F.; Chen, X.; Wu, J. Spatio-temporal patterns and source apportionment of pollution in Qiantang River (China) using neural-based modeling and multivariate statistical techniques. Phys. Chem. Earth 2011, 36, 379–386. [Google Scholar] [CrossRef]
  44. Nanjing Statistics Bureau (NSB). Statistical Yearbook of Nanjing (1990–2014). Available online: http://221.226.86.104/file/index.htm (accessed on 1 August 2015).
  45. Yilma, M.; Kiflie, Z.; Windsperger, A.; Gessese, N. Assessment and interpretation of river water quality in Little Akaki River using multivariate statistical techniques. Int. J. Environ. Sci. Technol. 2018, 16, 3707–3720. [Google Scholar] [CrossRef]
  46. National Development and Reform Commission (NDRC). Outline of China’s 11th Five-Year Economic and Social Development Program. Available online: https://www.ndrc.gov.cn/xwdt/gdzt/ghjd/quanwen/ (accessed on 24 March 2006).
  47. Yang, H.; Ma, M.; Thompson, J.R.; Flower, R.J. Waste management, informal recycling, environmental pollution and public health. J. Epidemiol. Community Health 2018, 72, 237–243. [Google Scholar] [CrossRef] [PubMed]
  48. Ma, H.; Chou, N.T.; Wang, L. Dynamic coupling analysis of urbanization and water resource utilization systems in China. Sustainability 2016, 8, 1176. [Google Scholar] [CrossRef] [Green Version]
  49. Yang, H.; Huang, X.; Thompson, J.R.; Bright, R.M.; Astrup, R. The crushing weight of urban waste. Science 2016, 351, 674. [Google Scholar] [CrossRef] [Green Version]
  50. Yang, H.; Wright, J.A.; Gundry, S.W. Boost water safety in rural China. Nature 2012, 484, 318. [Google Scholar] [CrossRef]
  51. Yang, H.; Paruch, L.; Chen, X.J.; van Eerde, A.; Skomedal, H.; Wang, Y.L.; Liu, D.; Clarke, J.L. Antibiotic application and resistance in swine production in China: Current situation and future perspectives. Front. Vet. Sci. 2019, 6. [Google Scholar] [CrossRef] [Green Version]
  52. Yang, H.; Shen, X.Y.; Lai, L.; Huang, X.J.; Zhou, Y. Spatio-temporal variations of health costs caused by chemical fertilizer utilization in China from 1990 to 2012. Sustainability 2017, 9, 1505. [Google Scholar] [CrossRef] [Green Version]
  53. Yang, P.; Yang, H.; Lai, D.Y.F.; Jin, B.S.; Tong, C. Production and uptake of dissolved carbon, nitrogen, and phosphorus in overlying water of aquaculture shrimp ponds in subtropical estuaries, China. Environ. Sci. Pollut. Res. 2019, 26, 21565–21578. [Google Scholar] [CrossRef]
  54. Yang, H.; Flower, R.J.; Thompson, J.R. Rural factories won’t fix Chinese pollution. Nature 2012, 490, 342–343. [Google Scholar] [CrossRef]
  55. Hu, M.C.; Zhang, X.Q.; Siu, Y.L.; Li, Y.; Tanaka, K.; Yang, H.; Xu, Y.P. Flood mitigation by permeable pavements in Chinese sponge city construction. Water 2018, 10, 172. [Google Scholar] [CrossRef] [Green Version]
  56. Liu, J.; Kattel, G.; Arp, H.P.H.; Yang, H. Towards threshold-based management of freshwater ecosystems in the context of climate change. Ecol. Model. 2015, 318, 265–274. [Google Scholar] [CrossRef] [Green Version]
  57. Yang, H.; Flower, R.J.; Thompson, J.R. China’s new leaders offer green hope. Nature 2013, 493, 163. [Google Scholar] [CrossRef] [PubMed] [Green Version]
  58. Qi, X.X.; Mao, X.Y.; Huang, X.J.; Wang, D.Y.; Zhao, H.Y.; Yang, H. Tracing the sources of air pollutant emissions embodied in exports in the Yangtze River Delta, China: A four-level perspective. J. Clean. Prod. 2020, 254, 120155. [Google Scholar] [CrossRef]
  59. Shan, K.; Wang, X.X.; Yang, H.; Zhou, B.T.; Song, L.R.; Shang, M.S. Use statistical machine learning to detect nutrient thresholds in Microcystis blooms and microcystin management. Harmful Algae 2020, 94. [Google Scholar] [CrossRef] [PubMed]
  60. Shan, K.; Shang, M.; Zhou, B.; Li, L.; Wang, X.; Yang, H.; Song, L. Application of Bayesian network including Microcystis morphospecies for microcystin risk assessment in three cyanobacterial bloom-plagued lakes, China. Harmful Algae 2019, 83, 14–24. [Google Scholar] [CrossRef]
  61. Geng, R.Z.; Yin, P.H.; Sharpley, A.N. A coupled model system to optimize the best management practices for nonpoint source pollution control. J. Clean. Prod. 2019, 220, 581–592. [Google Scholar] [CrossRef]
Figure 1. Location of the study area and sample sites in the Qinhuai River, East China.
Water 12 02764 g001
Figure 2. Variable loadings on varimax rotated factors of principal component analysis (PCA) in wet (top) and dry (bottom) seasons in the Qinhuai River, East China.
Water 12 02764 g002
Figure 3. Comparison of water qualities between the wet season and dry season between 1990 and 2014 in the Qinhuai River, East China.
Water 12 02764 g003
Figure 4. Spatial distribution of water quality identification indices (WQIIs) in the Qinhuai River, East China. The map was created using ArcGIS.
Water 12 02764 g004
Figure 5. Redundancy analysis (RDA) of water quality parameters and influence factors. S1 is population density, S2 is per capita GDP, S3 is agricultural fertilizer consumption, S4 is drainage pipeline density, S5 is industrial wastewater discharge, S6 is sewage discharge, S7 is built-up area, and S8 is urbanization rate.
Water 12 02764 g005
Table 1. Sub-basin and river grade of sampling sites.
Sub-BasinRiver GradeSampling Site
Lower Qinhuai River sub-basin Main riverShangfangmen Bridge—QM1, Dongshan Bridge—QM2, Caihong Bridge—QM3, Qinhuaixin River (Caocun Bridge—QM4), Xinhefanshui station—QM5, Yang Bridge—QM6
Secondary riverNiushoushan River (Yinxiang Bridge—QS1),Yuntaishan River (Xinhe Bridge—QS2), Pangjia Bridge—QS3, Qingtian Village—QS4
Jurong River sub-basinMain riverQianhan Village—JM1, Longdu Bridge—JM2, Hushu Bridge—JM3, Zhaojia Village Bridge—JM4
Secondary riverGe Bridge—JS1, Tongjin Bridge—JS2, Liangtai Bridge—JS3, Shuimen Bridge—JS4)
Lishui River sub-basinMain riverWusha Bridge—LM1
Secondary riverErgan River (Changle Bridge—LS1, Kaitai Bridge—LS6), Yigan River (Shahe Bridge—LS2, Zhenzhu Bridge—LS3, Chenjiaba Bridge—LS4), Sangan River (Shijiazhuang Station—LS5), Hengxi River (Hengxihe Bridge—LS7)
Table 2. Statistical description of water quality indicators and environmental standards.
Analysis MethodInstrument and EquipmentMinMaxMeanSDEnvironmental Quality Standard for Surface Water (Class)
IIIIIIIVV
T (°C)Thermometer MethodThermometer (0–50 °C)2.034.6017.838.85Increase (Decrease) in weekly average maximum temperature ≤ 1 (≤2)
pHGlass electrode methodpH meter (PHS-3C)5.418.927.780.366–9
Zn (mg/L)Atomic absorption spectrometry Atomic absorption spectrophotometer
(SOLAAR-M6)
0.001.570.050.10≤0.05(0.05,1](0.05,1](1,2](1,2]
NH4+-N (mg/L)Nessler’s reagent spectrophotometryUV-VIS Spectrophotometer
(TU-1901)
0.0518.201.892.23≤0.15(0.15,0.5](0.5,1](1,1.5](1.5,2]
TN (mg/L)Alkaline potassium persulfate digestion UV spectrophotometric method UV-VIS spectrophotometer
(TU-1900)
0.4930.333.243.64≤0.2(0.2,0.5](0.5,1](1,1.5](1.5,2]
TP (mg/L)Ammonium molybdate spectrophotometric method UV-VIS spectrophotometer
(TU-1900)
0.015.670.340.48≤0.02(0.02,0.1](0.1,0.2](0.2,0.3](0.3,0.4]
DO (mg/L)Electrochemical probe method Portable dissolved oxygen determining meter (S9-Field Kit)0.8010.905.981.66≥7.5(6,7.5](5,6](3,5](2,3]
F (mg/L)Fluorine reagent spectrophotometryUV-VIS spectrophotometer
(TU-1900)
0.071.630.350.17≤1≤1≤1(1,1.5](1,1.5]
TS (m)Disc methodSecchi disc0.100.500.340.06No
CODcr (mg/L)Small-scale sealed tube methodCOD digestion instrument (DRB200)10.2082.224.818.12≤15≤15(15,20](20,30](30,40]
CODMn (mg/L)Acid potassium permanganate method ——2.8028.66.712.13≤2(2,4](4,6](6,10](10,15]
BOD5 (mg/L)Dilution and seeding method Biochemical incubator
(BSP-250)
1.0020.203.851.58≤3≤3(3,4)(4,6](6,10]
Note: The Environmental Quality Standard for Surface Water (GB3838-2002) is from the Ministry of Ecology and Environment, People’s Republic of China (http://www.mee.gov.cn/ywgz/fgbz/bz/bzwb/shjbh/shjzlbz/200206/t20020601_66497.shtml).
Table 3. Comprehensive water quality grade (Ma et al., 2014) [19].
Judging StandardComprehensive Water Quality Grade
1 ≤ X.Y < 2IExcellent
2 ≤ X.Y < 3IIClean
3 ≤ X.Y < 4IIISlightly polluted
4 ≤ X.Y < 5IVModerately polluted
5 ≤ X.Y < 6VHighly polluted
6 ≤ X.Y < 7Inferior V not malodorous and blackSeriously polluted
X. Y > 7Inferior V and malodorous and blackMalodorous and black
Table 4. Variable loadings on varimax rotated factors in both wet and dry seasons.
ParametersWet SeasonDry Season
PC1PC2PC3PC1PC2PC3
T0.23−0.200.830.020.85−0.26
pH−0.11−0.490.78−0.340.90−0.12
DO−0.06−0.740.49−0.830.180.002
CODMn0.970.13−0.040.41−0.140.83
CODcr0.950.190.020.54−0.170.76
BOD50.900.15−0.250.47−0.050.82
NH4+ −N0.380.86−0.100.850.050.41
Zn0.170.24−0.62−0.24−0.480.66
F−−0.220.630.550.010.850.12
TS−0.250.060.85−0.220.68−0.30
TN0.150.79−0.230.75−0.140.18
TP0.560.76−0.210.75−0.050.38
Variability (%)44.8120.1316.2047.0521.0210.35
Cumulative (%)44.8164.9381.1447.0568.0778.42
Table 5. Possible factors influencing water quality in the Qinhuai River.
Rainfall
(mm)
Total Discharge
(108 m3)
Floodgate Open Time (Days)
Total Open
(Days)
Flood Discharge
(Days)
Water Diversion
(Days)
20089951.14770
200914425.2129290
201012315.77935142
201110373.1435350
20129832.42531043

