Article

Biodiversity of Calanoida Copepoda in Different Habitats of the North-Western Red Sea (Hurghada Shelf)

1
Zoology Department, Faculty of Science, Al-Azhar University, Cairo, Nasr City 11823, Egypt
2
Invertebrate Aquaculture Lab., National Institute of Oceanography and Fisheries (NIOF), Alexandria Branch 21556, Egypt
3
Prince Sultan Bin Abdulaziz International Prize for Water Chair, Prince Sultan Institute for Environmental, Water and Desert Research, King Saud University, Riyadh 11451, Saudi Arabia
4
Department of Agricultural Engineering, College of Food and Agricultural Sciences, King Saud University, Riyadh 11451, Saudi Arabia
5
Hydrobiology Lab., Marine Environment Division, National Institute of Oceanography and Fisheries (NIOF), Hurghada Branch 84712, Egypt
*
Authors to whom correspondence should be addressed.
Water 2020, 12(3), 656; https://doi.org/10.3390/w12030656
Submission received: 27 January 2020 / Revised: 24 February 2020 / Accepted: 26 February 2020 / Published: 29 February 2020
(This article belongs to the Special Issue Marine Biology: Biodiversity and Conservation)

Abstract

:
Little is known about the diversity of Calanoida, Copepoda, in different habitats of the north-western Red Sea. In this study, biodiversity of Calanoida, Copepoda, during the cold and warm seasons of 2017, were observed at 12 stations belonging to four different habitats (coral reef (CR), sheltered shallow lagoons (SSL), seagrass (SG), and open deep-water (ODW) habitats) in the Hurghada shelf, north-western Red Sea. SSL habitats were the most affected by environmental conditions, especially temperature, salinity, and depth. Some calanoid species were restricted to certain habitats, others were adapted to live in more than one habitat, while some species showed a wide distribution in all habitats. ODW habitats showed maximum diversity and density of the calanoid species. The effects of temperature and salinity were distinct in the SG and SSL. The results clearly showed that different Red Sea habitats affected the biodiversity of calanoid copepods.

Graphical Abstract

1. Introduction

The coast of Hurghada has unique marine habitats. The waterfront region of Hurghada is described as coral reefs stretching out parallel to the shoreline, and is amongst the most important touristic territories influencing national revenue. Moreover, beside coral reef habitats, the Hurghada shelf has different prevailing marine habitats, such as sheltered shallow lagoons, seagrass, open deep-water habitats, and mangroves. Thus, it is distinct amongst the most appealing resorts in Egypt. The territory includes several human activities that are influenced by ecological changes [1]. Among the different habitats and ecosystems, an enormous number of species are found to be associated with a single and/or multiple habitats [2].
Marine zooplankton, especially the Copepoda, are considered an important bio-indicator of environmental changes associated with global warming. Copepoda represent more than 50% of planktonic metazoan biomass in the marine environment and are considered a secondary producer in marine food webs [2,3,4,5]. Furthermore, the natural productivity of planktonic organisms, especially Copepoda, is very important for the environmental assessment of aquaculture potential [6]. Calanoida Copepoda are considered a dominant component of zooplankton in most marine water bodies worldwide; they are noteworthy because they are relatively the most abundant and diverse among Copepoda orders, under certain conditions [7]. Calanoida play an important role as energy transporters to the higher trophic levels in the marine ecosystem. This is because they consume the most amount of the primary production [8], owing to their role in the transport of organic matter to deep layers (either through faeces and their bodies when they die, or through daily vertical migration), and in the ‘biological’ pump [9,10]. Moreover, Calanoida represent major preys of mesopelagic and bathypelagic fish [11]. Chiffings [12] noted that among the 46 groups of zooplankton in the Northern Red Sea, and 60 groups in the southern part, Calanoida Copepoda were the most important. Little is known about their diversity in the surrounding waters of the different Red Sea habitats. Delalo [13], presenting the first study on the Red Sea zooplankton, implicitly included Calanoida, whilst Halim [14] introduced a review of earlier studies of zooplankton, including Calanoida, followed by further studies by Weikert [15,16]. Schmidt [17] was the first to study the abundance and diversity of Copepoda in the Red Sea at one site in the Gulf of Aqaba. The first specialized detailed study on Calanoida in the Red Sea was presented by Almeida Prado-Por and Por [18], followed by studies by Almeida Prado-Por [19,20,21] on the temporal and spatial distributions of the same group. No recent studies have given particular attention to the study of the ecology and biodiversity of Calanoida in different habitats of the Red Sea.
The current study is restricted to certain habitats in the Red Sea, and focuses on the relationship between the components of the ecosystem and Calanoida diversity and its effects. Literature describing the effect of habitat types on Calanoida Copepoda distribution is also sparse or even lacking. The current study aims to investigate the composition, abundance, and distribution structure, including habitat preference of Calanoida Copepoda species, in relation to different marine habitats in the cold and warm seasons in the Hurghada waterfront region, which is one of the most important tourist cities in Egypt with a large number of human activities in the north-western Red Sea. In addition, the most important environmental parameters affecting the calanoid distribution structure were investigated.

2. Materials and Methods
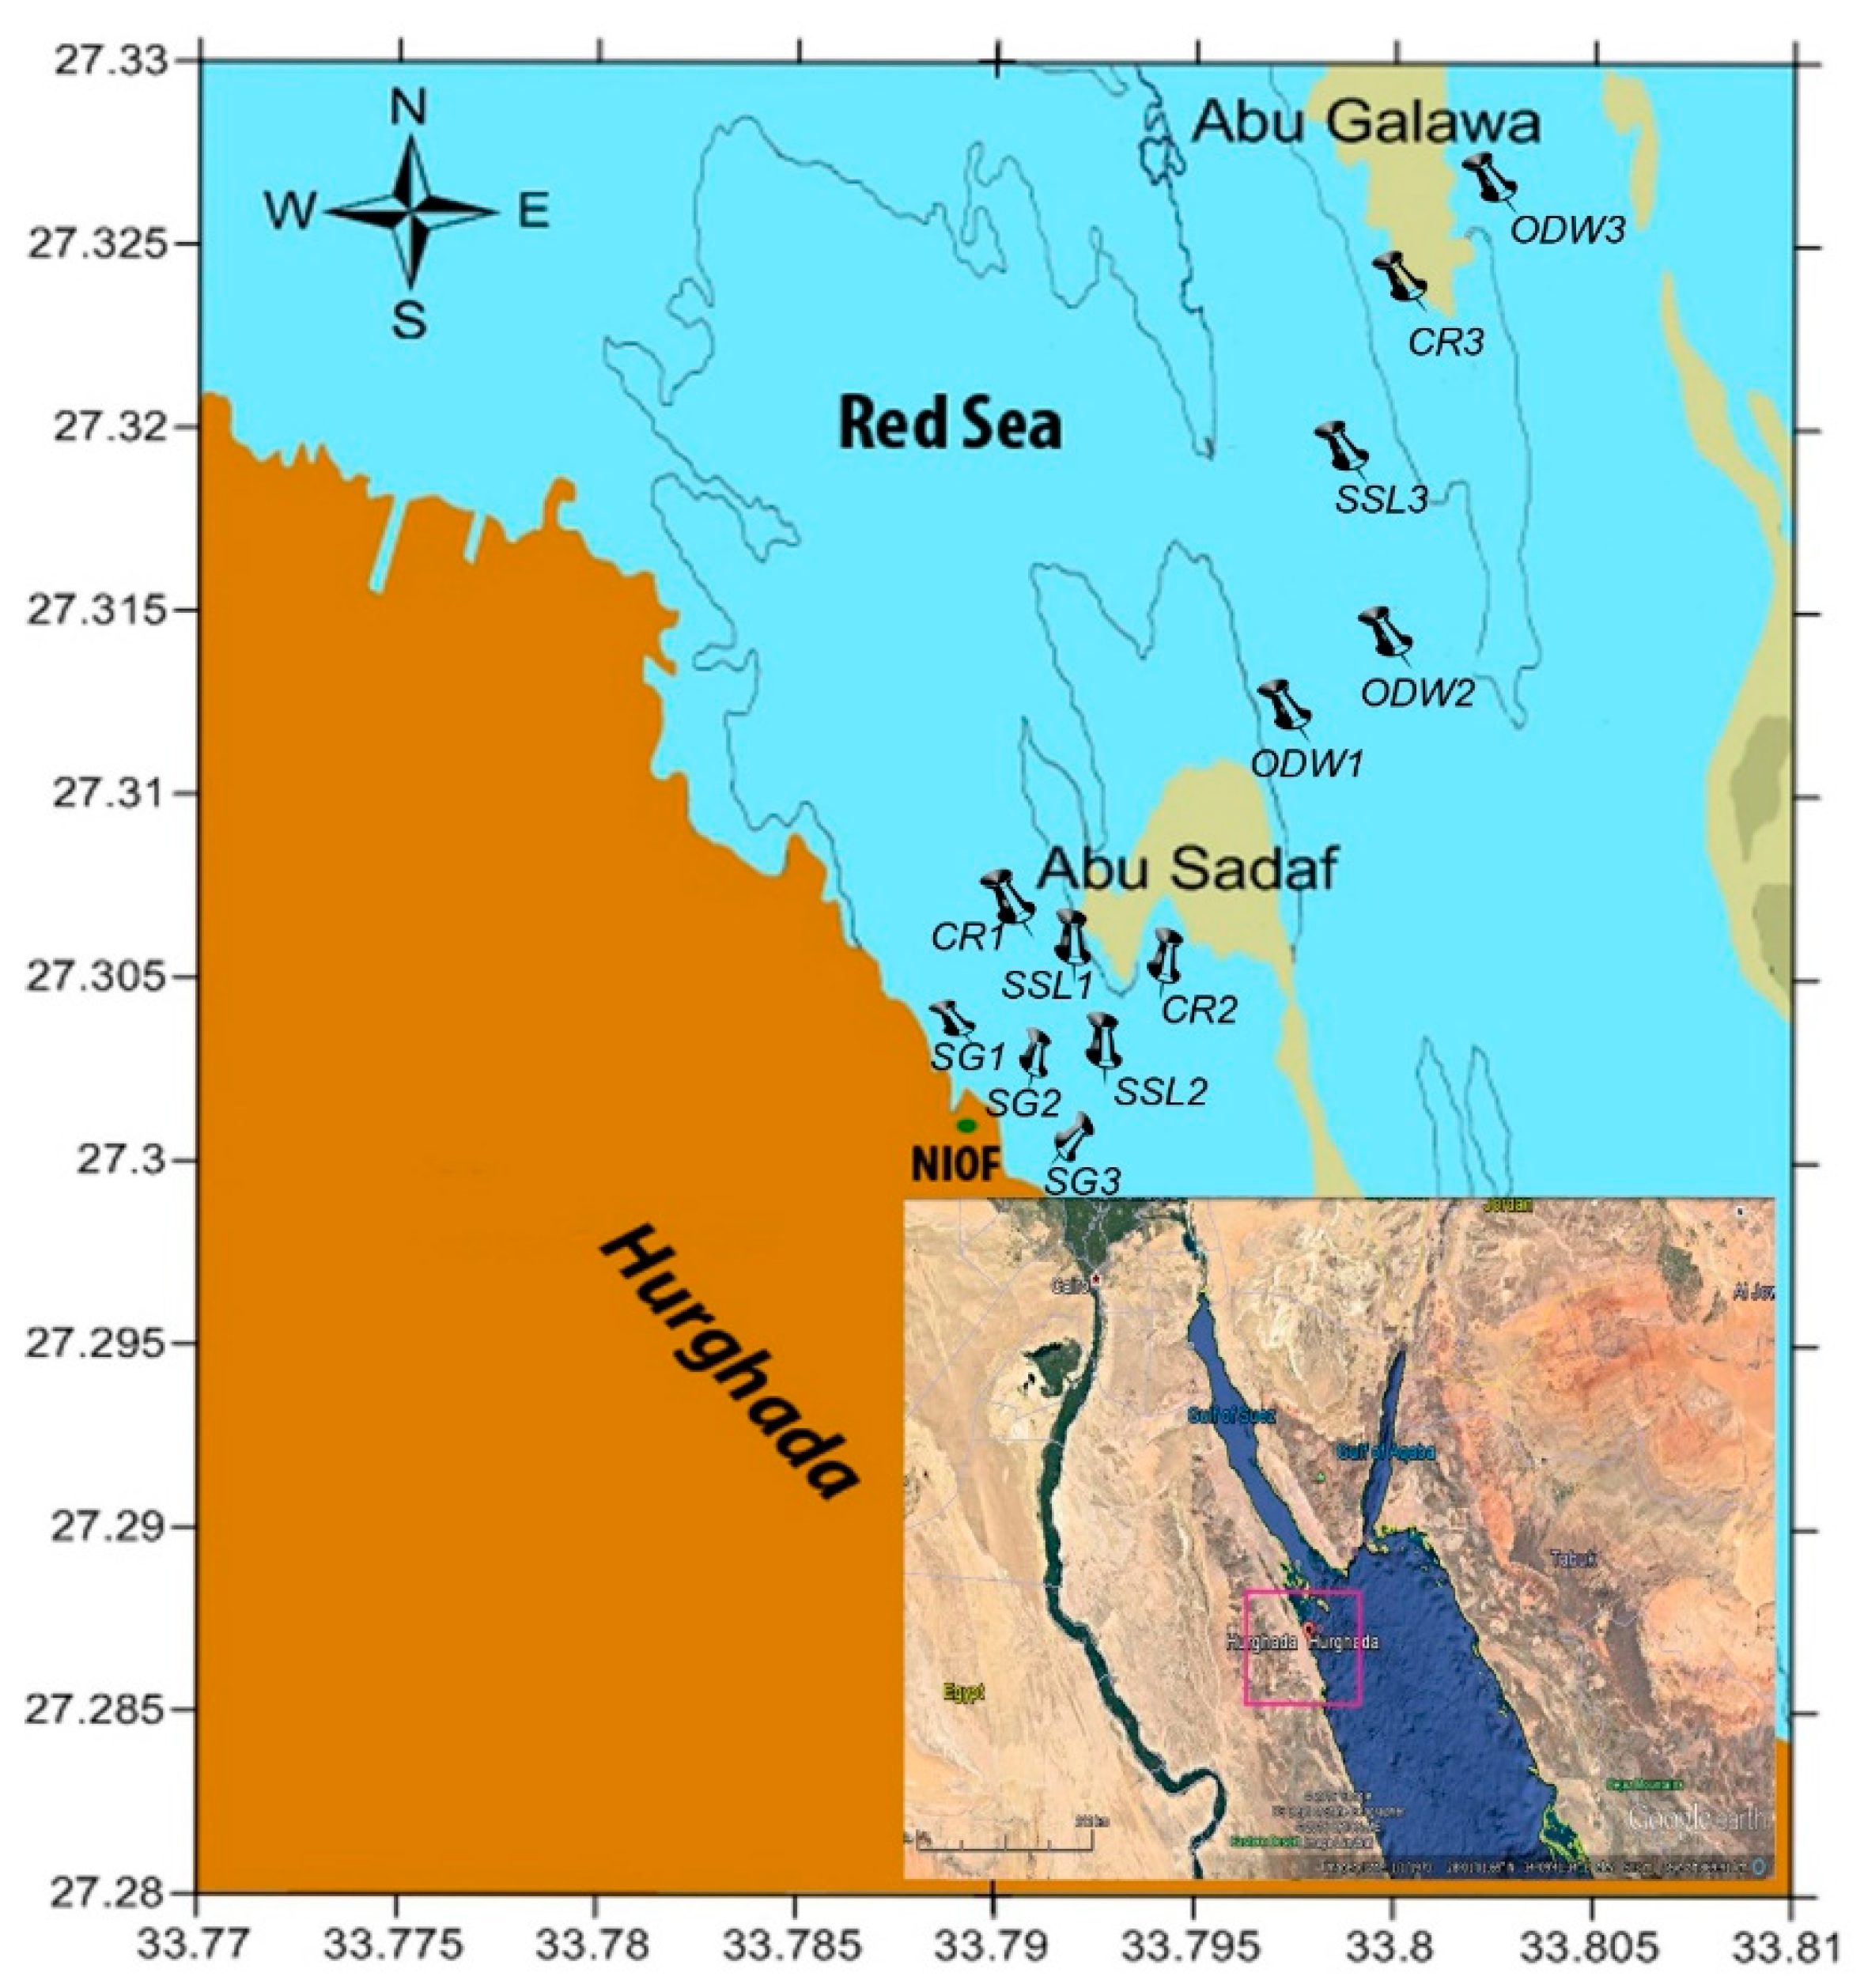
2.1. Study Area

All sampling stations (Figure 1) were in the Hurghada shelf located in the north-western part of the Egyptian coast of the Red Sea (27.30˚ and 27.326˚ N and 33.788˚ and 33.803˚ E). Twelve stations were selected to represent four different marine habitats: Coral Reef (CR), Seagrass (SG), Sheltered Shallow Lagoons (SSL), and Open Deep-Water (ODW).
Each habitat had three replicates and each sampling station was determined using a handheld Global Positioning System. Stations CR1, CR2, and CR3 were defined as coral reef habitats (depth 9–12 m). CR1 and CR2 were adjacent to the Abu-Sadaf reef, while station CR3 was located at the outer margin of the Abu Galawa Island adjacent to the reef edge and represented the coral reef zone. Stations SG1, SG2, and SG3 (depth 5–6.5 m) were defined as seagrass habitats and were located around the National Institute of Oceanography and Fisheries (NIOF), Hurghada Branch. Stations SSL1, SSL2, and SSL3 were defined as sheltered shallow lagoons habitats (depth 2–5 m). Stations ODW1, ODW2, and ODW3 were defined as open deep-water habitats (depth 29–56 m). The location and stations are shown in Figure 1.

2.2. Sampling and Analysis

Samples were collected during the cold season (February, winter 2017) and warm season (August, summer 2017) between 06:18 and 09:39 (local time), during daylight hours. The most prevailing water physico-chemical parameters (temperature, salinity, pH and dissolved oxygen (DO) were measured. Temperature (°C) was measured with an ordinary thermometer graduated to 0.1 °C attached to the water sampler. Salinity was determined using an optical refractometer. The pH values were detected using a digital pH meter (model 201/digital pH meter). Dissolved oxygen (mg/l) was determined according to the Winkler method [22].
Calanoida Copepoda samples were collected as per protocols described by Abo-Taleb and Gharib [2]. Samples were collected using a standard plankton net (No. 25) of 55 µm mesh size with a diameter of 55 cm at the mouth. The net was lowered from the boat and towed horizontally along the surface layer of each station for 10 min with a towing speed of 2 knots, avoiding the reef edges. The net was equipped with a digital flow meter to calculate the efficiency of the filtration. After each tow, the net was rinsed thoroughly by dipping in seawater. This operation was performed thrice from three different locations at each station (N = 9 for each station, N = 27 for each habitat, N = 108 for each season). After sample collection, samples were transferred immediately to a small glass bottle and preserved in 4% neutralized formalin, and then, sample volume was adjusted to 100 mL. Each sample was examined in a Petri dish under a stereomicroscope and non-copepod groups were removed. The average of copepods was counted and used to estimate the copepod abundance, which is expressed as individual/m3. For estimation of standing crop, sub-samples of 5 mL were transferred to a counting chamber using a plunger pipette (three subsamples from each sample were analyzed and the average was obtained). Standing crop was calculated and estimated as individuals per cubic meter as described by Santhanam and Srinivasan [23] using the following formula:
N = n     v V     S
V = π   r 2   d   f
where N: Total number of zooplankton per cubic meter, n: Average number of zooplankton in 5 mL of the sample, v: Volume of concentrated sample (100 mL), V: Volume of total filtered water (m3), S: volume of subsamples (5 mL), π r2: The total area of the net mouth. d: Length of the tow by the net, ƒ: Filtration coefficient (calculated by dividing the reading of the flow meter attached to the plankton net by the reading obtained without a bucket; as the value of filtration coefficient approaches 1, the net has high filtration efficiency).

2.3. Species Identification and Dissection

Species dissection and identification was performed using a stereomicroscope. The accurate identification of Calanoida Copepoda was performed by dissecting each species using fine needles on a glass slide and using a mixture of water, glycerine, and alcohol in the proportion 2:1:1. Only adults have been identified, while the immature stages have been counted altogether. The following references were consulted for identification: Sars [24], Newell and Newell [25], Rose [26], Mori [27], González and Bowman [28], Silas and Pillai [29], Bradford-Grieve [30], Boltovskoy et al. [31], and Conway et al. [32].

2.4. Statistical Analysis

Multiple correlation analysis and multiple regression analysis were computed using MINITAB Release 16, depending on fauna (abundance and diversity) and the measured ecological parameters with a significance level of p ≤ 0.05. PcOrd 5.0 (functions of data analysis to analyze various environmental and ecological data within the framework of the Euclidean exploratory methods) was applied to detect correlations between the different environmental parameters measured at the twelve stations representing the four prevailing Red Sea habitats. In addition, PcOrd 5.0 was used for (1) the hierarchical clustering, and two ways hierarchical clustering applied for the stands, depending on their zooplankton species composition using Euclidean similarity matrix; and (2) the distribution of stations based on the zooplankton species composition in each one versus the environmental condition using PCA methods.

3. Results

3.1. Physico-Chemical Parameters

The investigated physico-chemical parameters (Table 1) showed that temperature ranged from 28.00 to 36.50 °C, salinity varied from 35.20 to 44.00 ppt, and dissolved oxygen (DO) ranged from 8.08 to 5.50 mg/l in the cold and warm seasons, respectively. The pH in all observed stations in both seasons were alkaline (9.00 to 7.80) except in the SG stations, which were neutralized and tended to be slightly alkaline (7.00 to 7.70). Among the different surveyed habitats, the maximum temperature and salinity was observed at the SSL habitats during the warm season (34.35 ± 1.99 °C and 42.93 ± 0.95 ppt, respectively). The SSL habitats also recorded the minimum temperature and salinity (28.13 ± 0.15 °C and 38.13 ± 2.57 ppt, respectively) during the cold season.
In the warm season, among stations, station SSL2 recorded the highest temperature (36.50 °C), salinity (44.00 ppt), and pH (9.00), while it recorded the lowest DO (5.50 mg/l). Moreover, station SSL2 had the lowest depth (2 m) of all investigated stations. ODW habitats recorded the maximum average DO, both in cold (7.84 ± 0.23 mg/l) and warm (6.47 ± 0.33 mg/l) seasons. The highest DO values in the cold (8.05 mg/l) and warm (6.85 mg/l) seasons were recorded at station ODW3, considered the deepest site (56 m). In contrast, SSL stations recorded the minimum average of DO, both in cold (7.12 ± 0.19 mg/l) and warm (5.92 ± 0.36 mg/l) seasons.

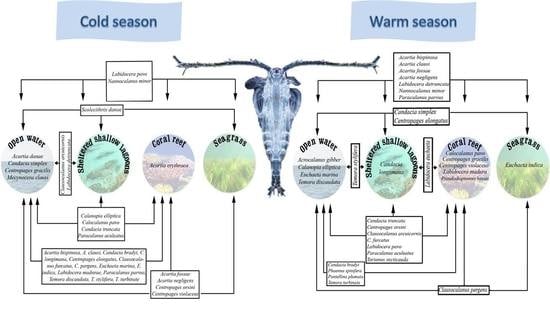
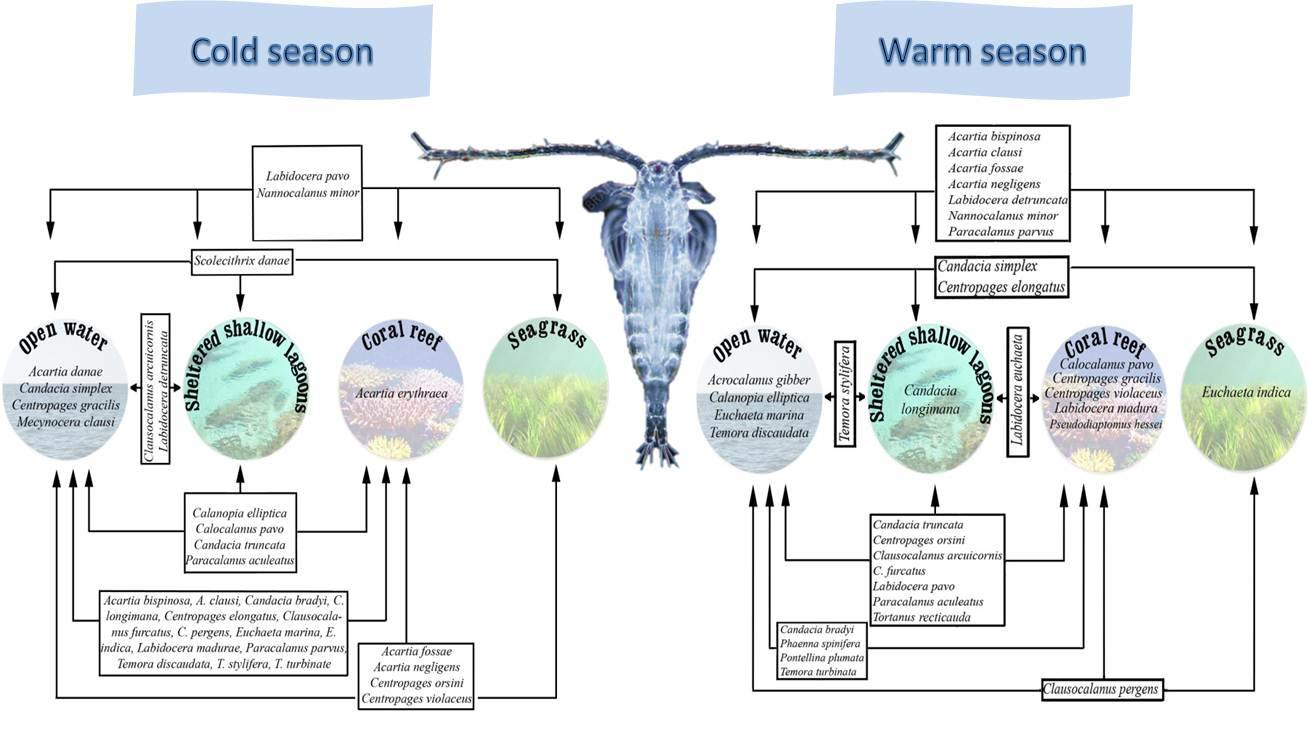
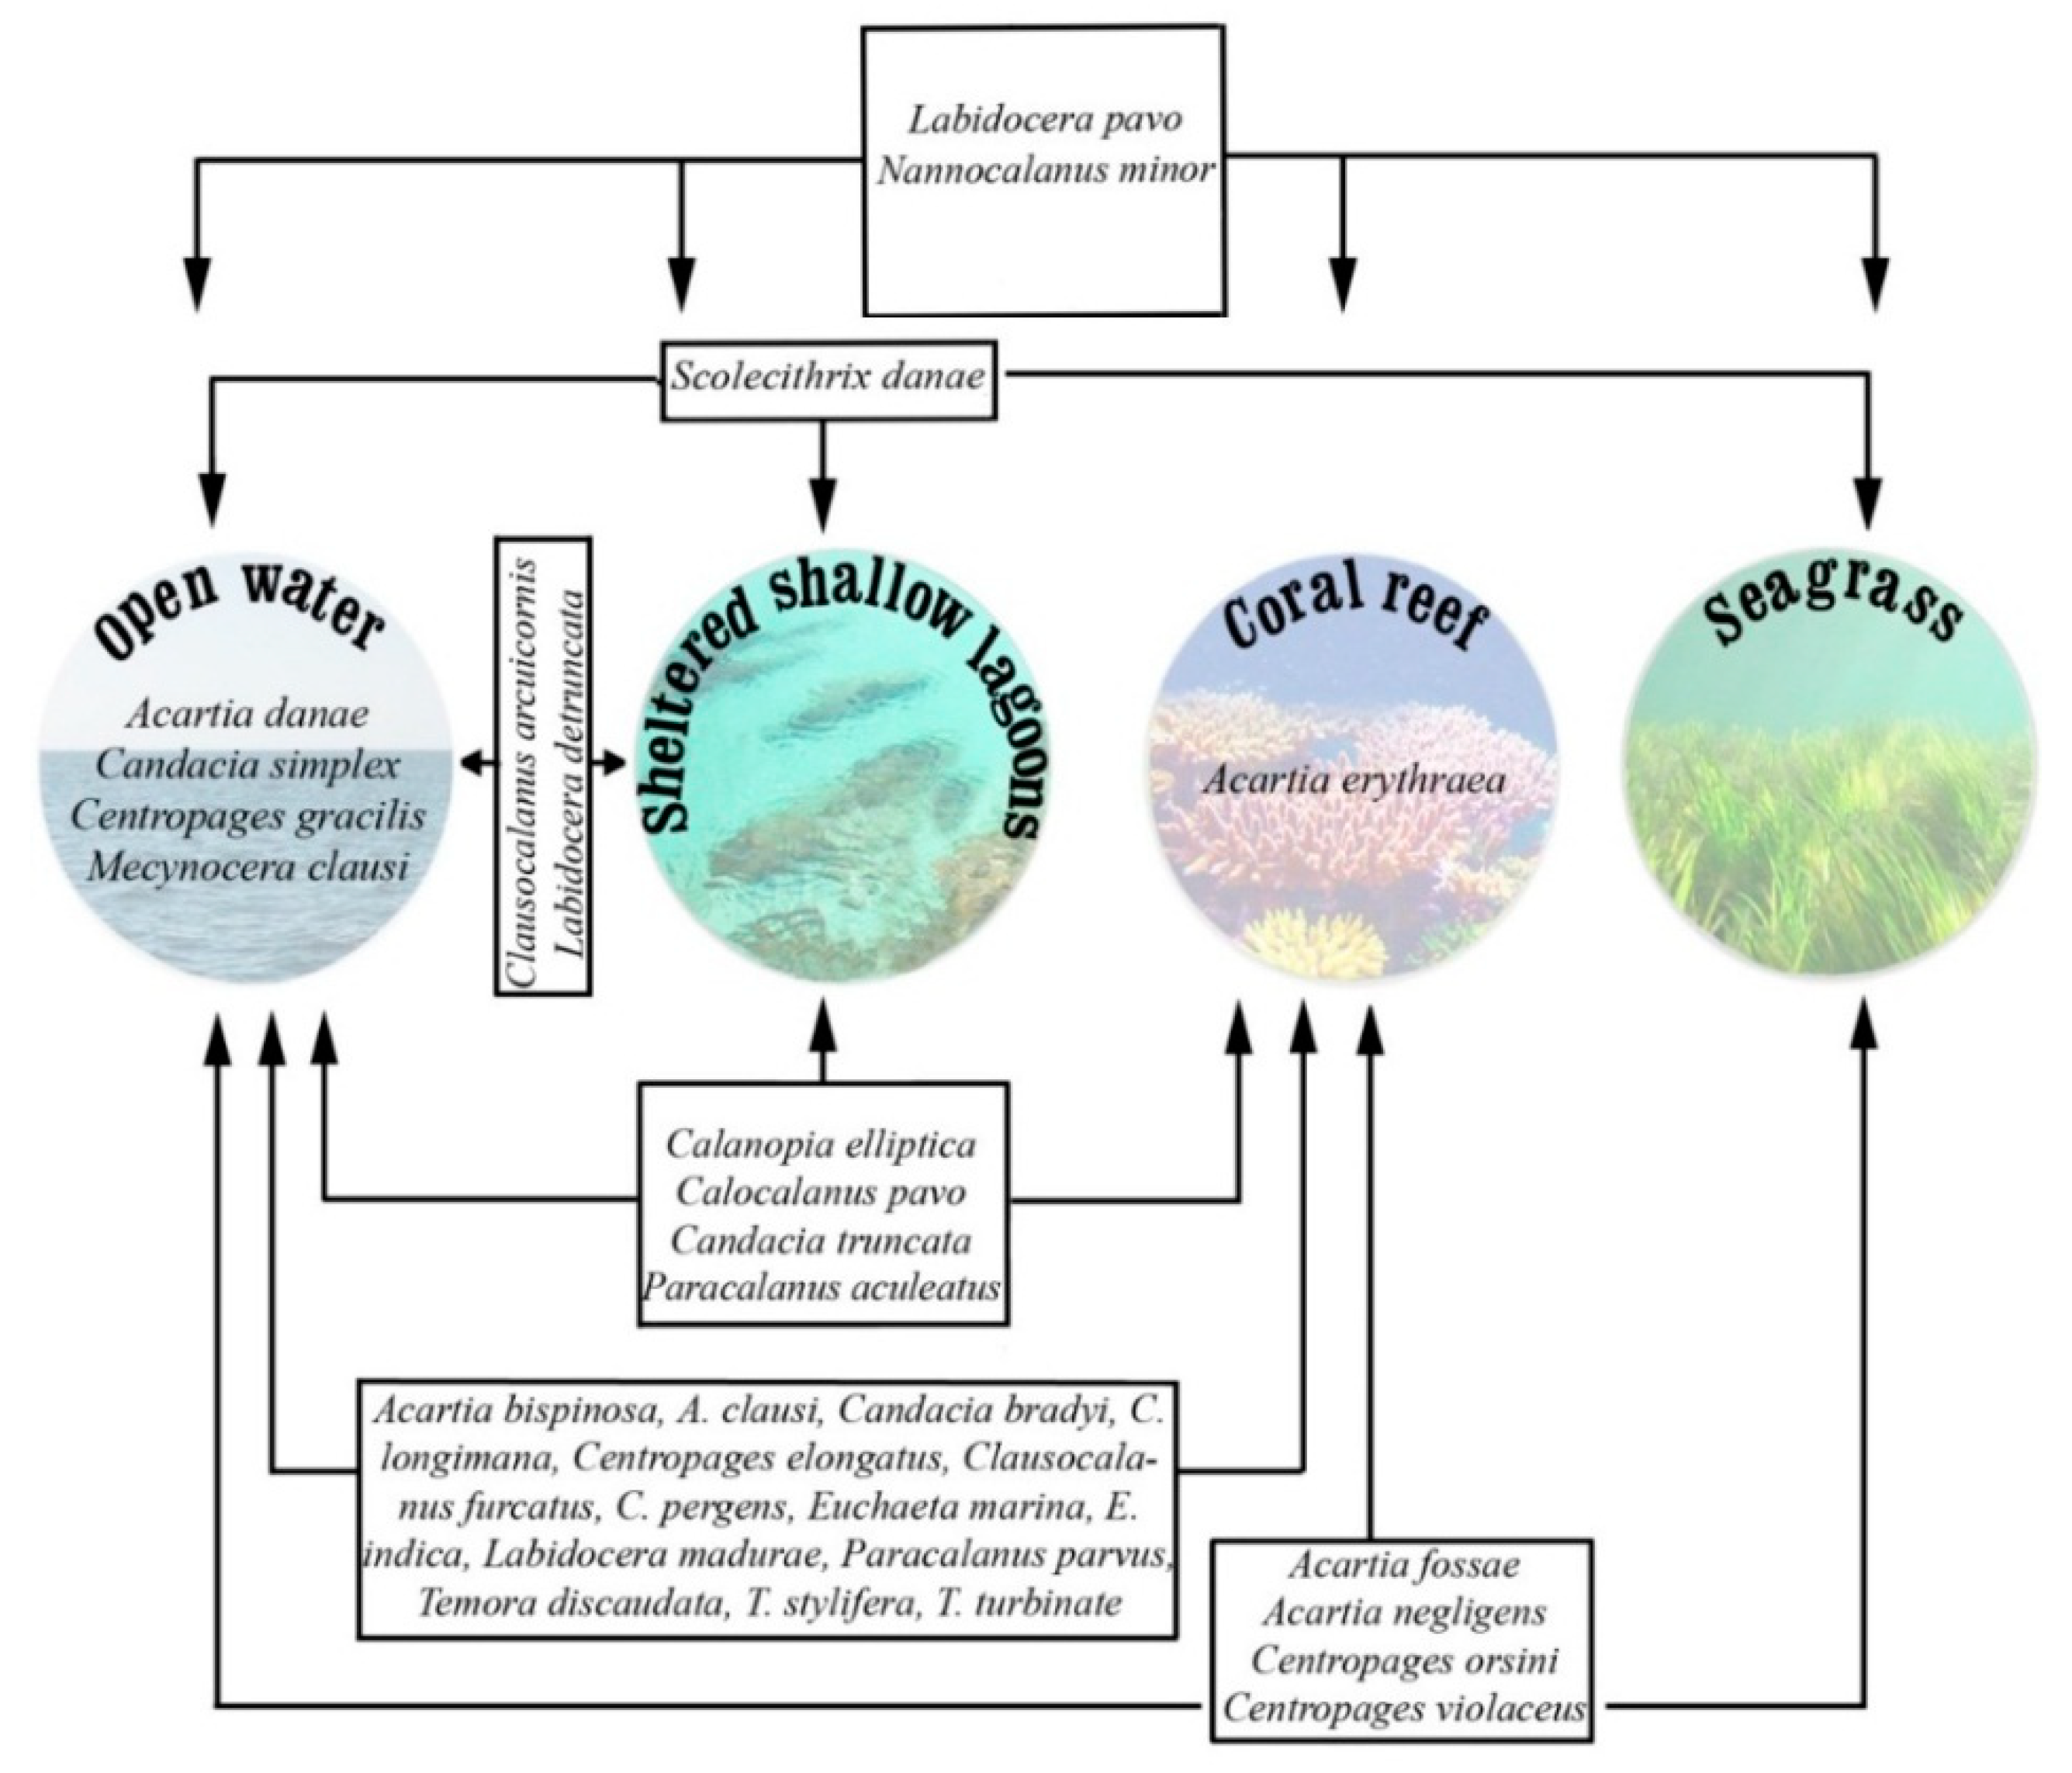
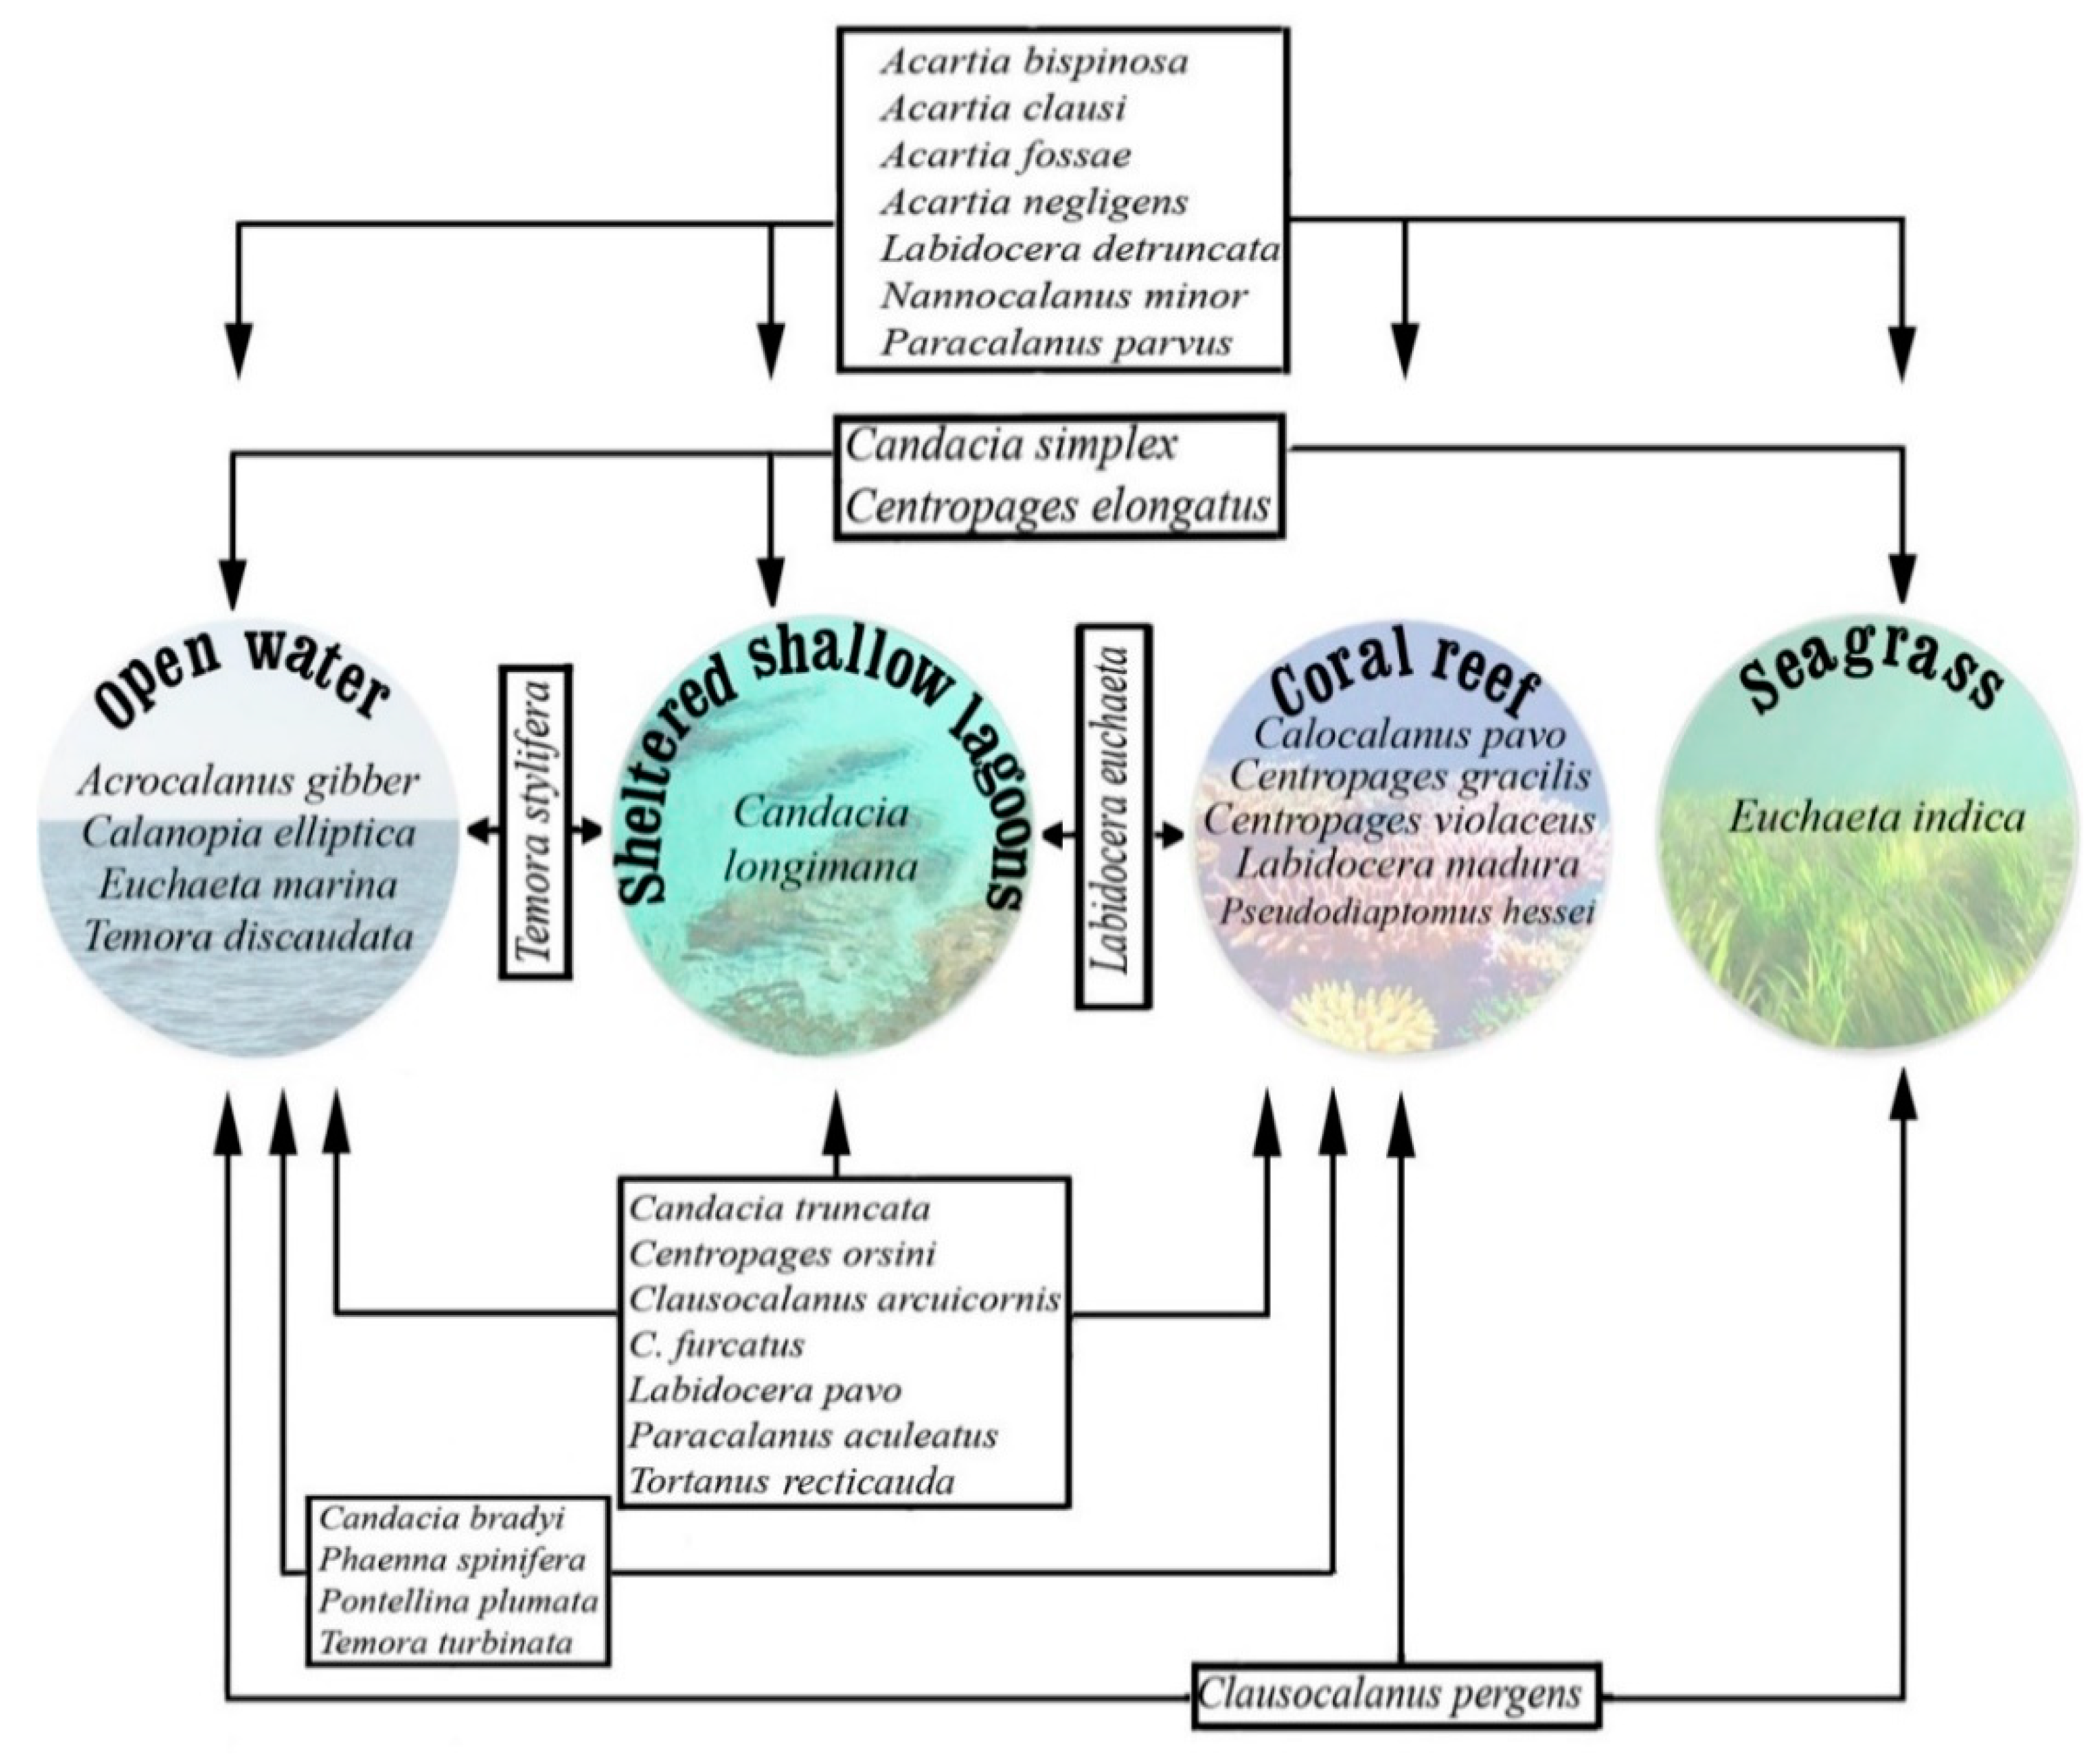
3.2. Dynamics of Species in Different Habitats

Calanoida Copepoda were represented by 38 species belonging to 18 genera and 13 families, in addition to the immature forms (nauplius larvae and copepodite stages), distributed in all the studied Red Sea habitats (Table 2). Six species were exclusive of the warm period, while four species were exclusive of the cold period (Figure 2 and Figure 3, respectively). During the warm season, among all habitats, the highest diversity was observed in ODW1 and ODW3 (17 and 16 species, respectively) and abundance (1400 and 1470 org./m3, respectively), while station ODW3 sustained the highest diversity (27 species) and abundance (387 org./m3) during the cold season. The lowest diversities and abundances were recorded in the SG and SSL habitats during the cold and warm seasons, respectively.
Figure 2 shows the distribution of different Calanoida species at different habitats during the cold season. Some species were restricted to certain habitats; Acartia danae, Candacia simplex, Centropages gracilis, and Mecynocera clausi were restricted to ODW; Acartia erythraea characterized the CR habitat; while no species were found to be restricted to the SG or SSL habitats during this season (Figure 2). Labidocera pavo and Nannocalanus minor were the only two species that were widespread in all investigated habitats. In contrast, some species were found in ODW, CR, and SG habitats, while others were recorded in ODW, CR, and SSL habitats (Figure 2). Scolecithrix danae was the only species having the ability to inhabit SG, ODW, and SSL habitats. Clausocalanus arcuicornis and Labidocera detruncata were recorded only in ODW and SSL habitats. There was no species that occurred both in the CR and SSL habitats. The highest number of species (14 species) were found in ODW and CR (Figure 2).
Figure 3 shows the distribution of Calanoida species in different habitats during the warm season. Some species were restricted to certain habitats, such as Candacia longimana at the SSL habitats, Euchaeta indica at the SG habitats, and Acrocalanus gibber, Calanopia elliptica, Euchaeta marina, and Temora discaudata at the ODW habitats. CR habitats were characterized by five species that were not recorded in any other habitat during this season. Seven species had a wide distribution and were recorded in all habitats (Figure 3).
In contrast, some species adapted to survive in different habitats and were found in ODW, SSL, and CR habitats. Clausocalanus pergens was also observed in ODW, CR, and SG habitats. Candacia simplex and Centropages elongatus were observed in ODW, SSL, and SG habitats. Finally, some species were found to be restricted to two specific habitats; Candacia bradi, Phaenna spinifera, Pontellina plumata, and Temora turbinata were constrained to ODW and CR habitats; Temora stylifera was recorded in only ODW and SSL habitats; and Labidocera euchaeta in only SSL and CR habitats (Figure 3).
Generally, Labidocera, as a genus, and Nannocalanus minor could be found in all habitats during different seasons. In contrast, Centropages gracilis was recorded in only one habitat; however, this habitat changed from one season to the other. It was a CR inhabitant during the warm season but during the cold season, they were found only in ODW habitats. Acartiidae, which was widespread during the warm season, demonstrated a different trend in the cold season. It became restricted to only ODW (A. danae) or CR (A. erythraea) or both habitats together (A. bispinosa and A. clausi), while some species could survive in the two previous habitats in addition to the SG habitat, such as A. fossae and A. negligens. In contrast, during the cold season, there was no species of this genus restricted to SG habitats alone.
Regardless of the habitat types, results of the spatial distribution of species within all studied stations (Figure 4) showed that during the cold season, the highest occurrence (92%) was recorded for two species (N. minor and L. pavo). A. erythraea and M. clausi occurred with a value of 8% in one station during this season. There were no species having a wide distribution over all the studied stations, except the immature forms. In contrast, during the warm season, three species were recorded at all stations with 100% frequency of occurrence. In contrast, nine species were restricted to a single station, with an occurrence value of 8% of the studied sites (Figure 4).
The differences in abundance of common species at different habitats were analyzed to see whether the difference was significant. The results showed that during the cold season, there were no significant differences (p < 0.05) observed in abundances of the common species (L. pavo and N. minor) in different habitats, as shown in Table 3. In contrast, during the warm season, there were no significant differences (p < 0.05) observed in abundances of the common species at different habitats. The only highest significant difference (p < 0.05) was observed with N. minor in the ODW habitat, followed by SSL, SG, and CR, as shown in Table 3.

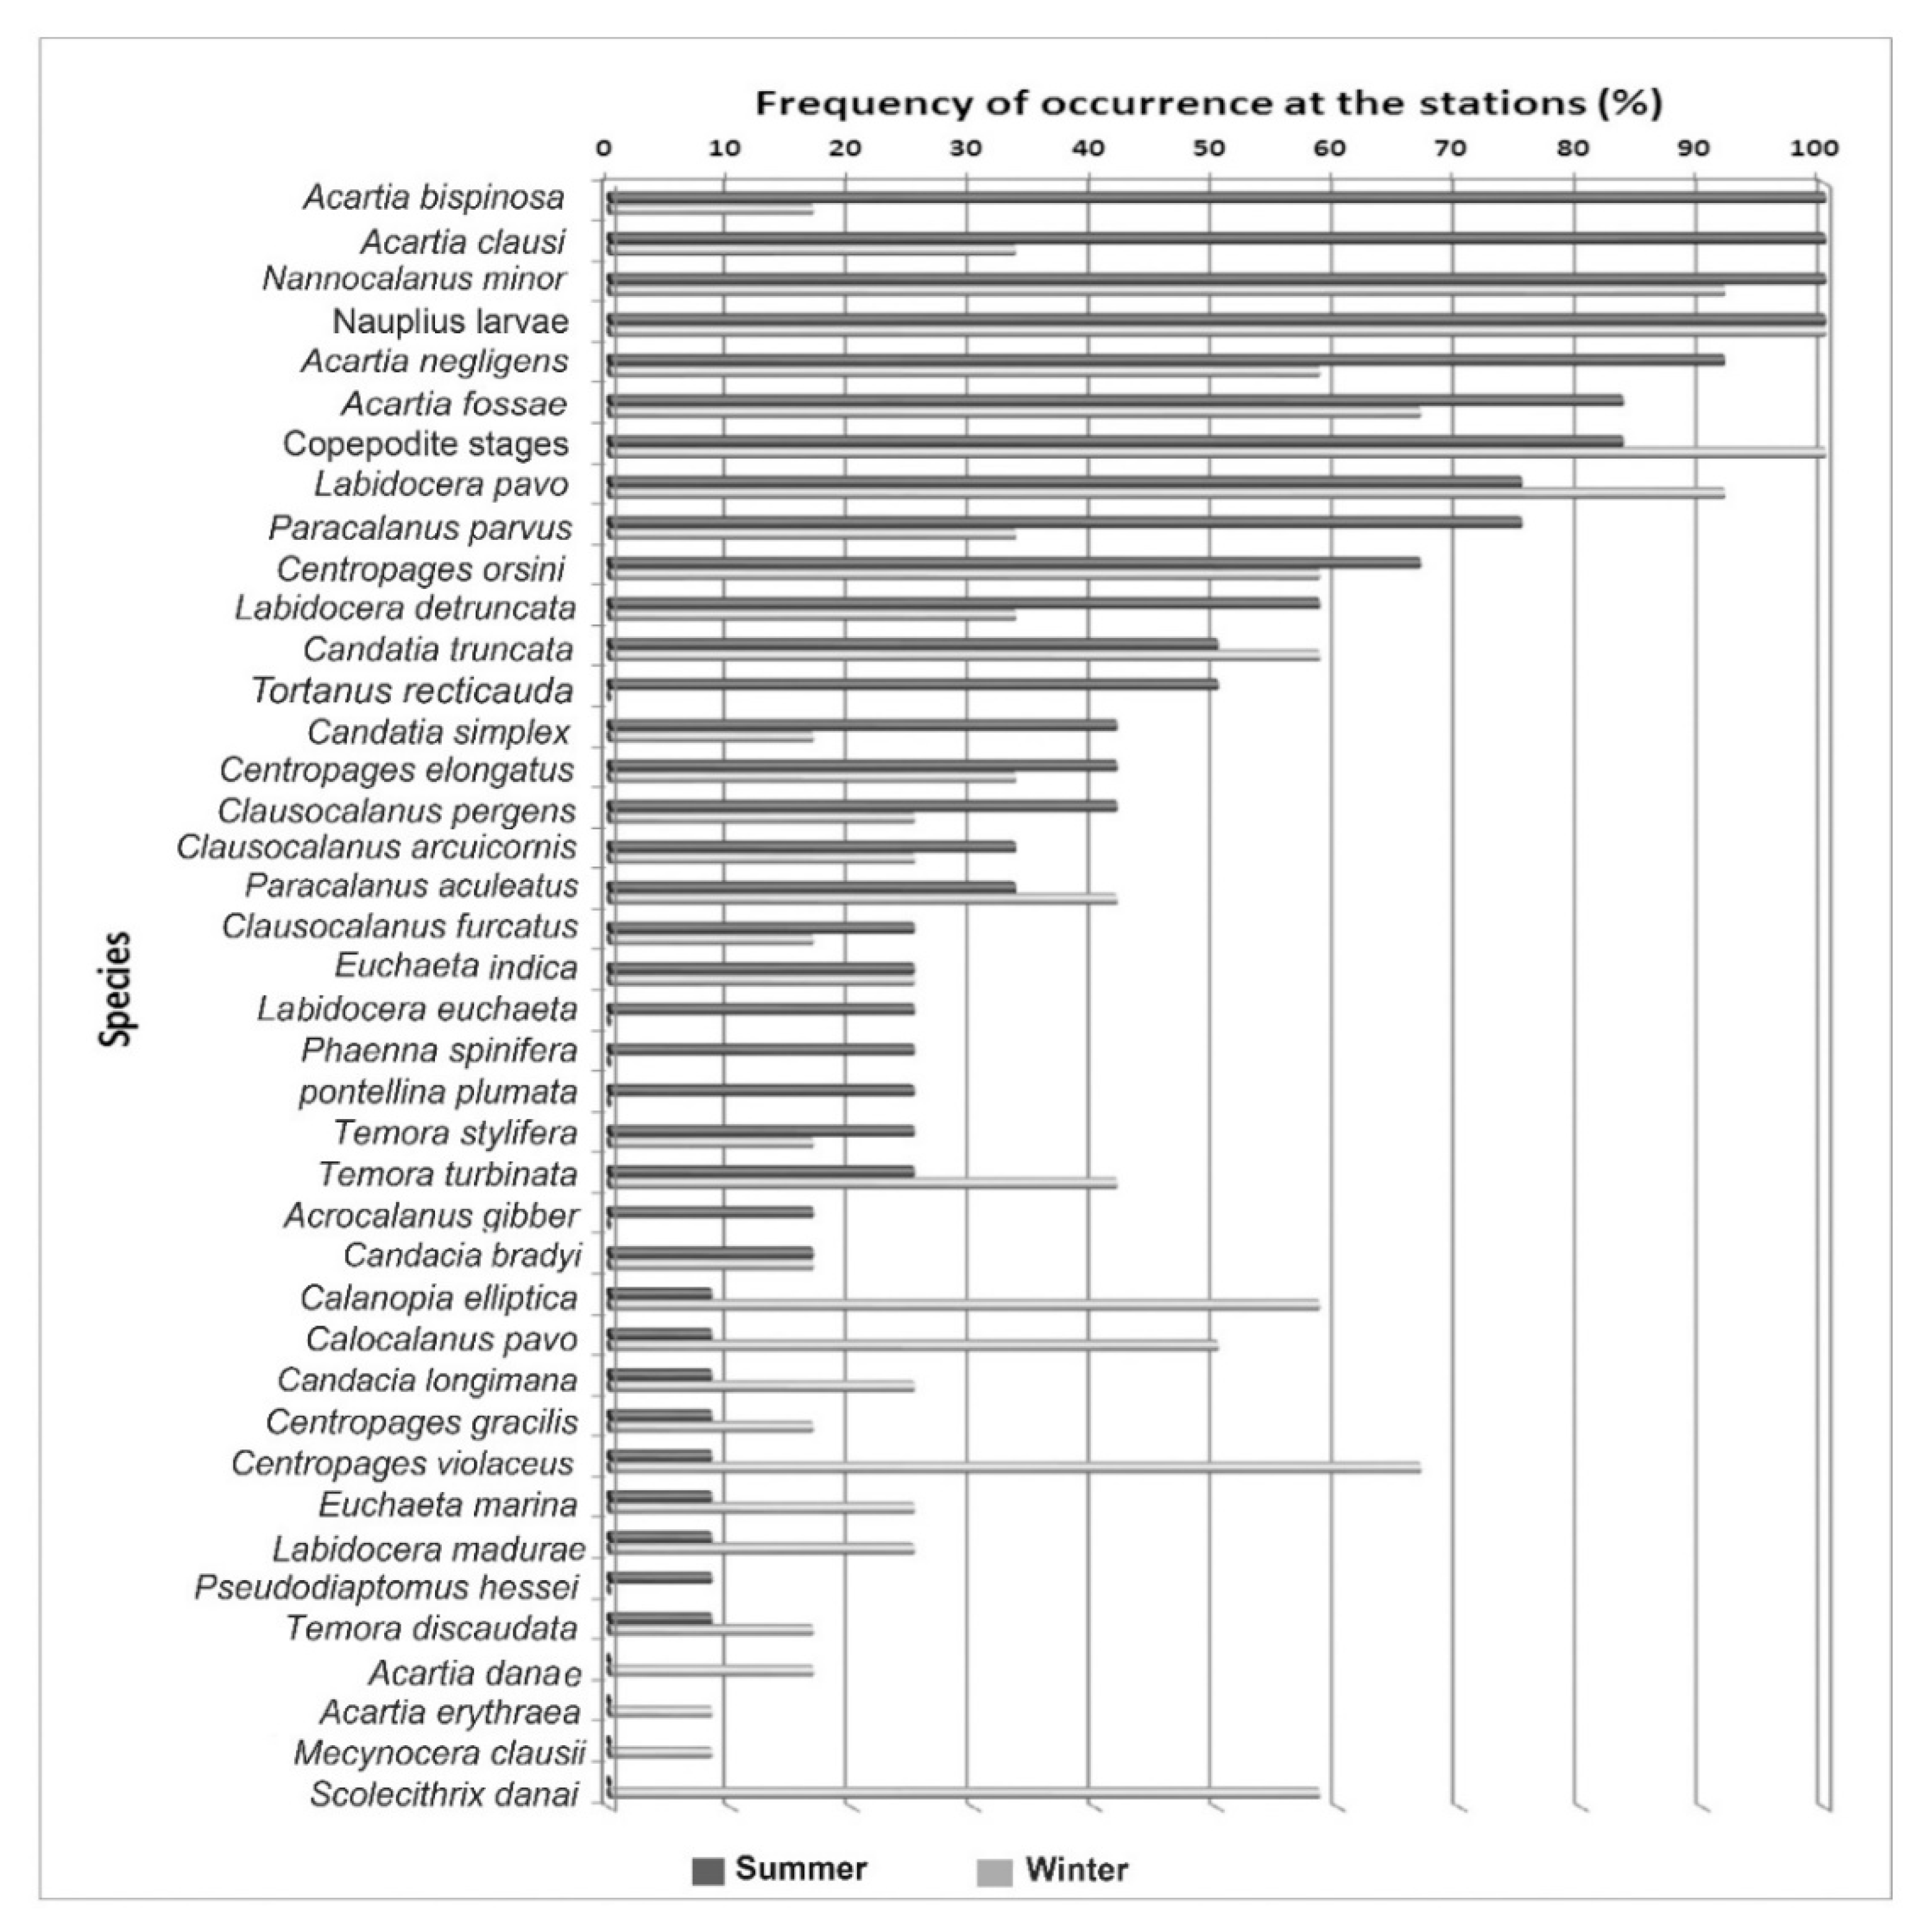
3.3. Seasonal Variation

The diversity and density of Calanoida species in relation to different stations and habitat types (SG, CR, SSL, and ODW) are shows at Table 4. The species diversity and abundance varied in relation to seasons and habitat types. Generally, regardless of the habitat types, higher diversity, and abundance (34 species and 1119 org./m3, respectively) was observed in the warm season rather than the cold season (32 species and 221 organisms/m3, respectively), Table 4. Regardless of the seasons, ODW habitats had the highest diversity and average abundance during the warm (26 species and 1312 org./m3, respectively) and cold seasons (31 species and 313 org./m3, respectively), while SG habitats recorded the lowest diversity and average abundance during the warm (11 species and 915 org./m3, respectively) and cold seasons (7 species and 124 org./m3, respectively), Table 4.
The immature stages (nauplius and copepodites) showed an obvious variation between seasons, as well as between different habitats. The winter showed relatively limited abundance (average 163.3 ± 145.8 individuals/m3) compared to the huge increase that occurred during the summer (average 895.1 ± 326.5 individuals/m3). During the cold season, the highest abundance of immature forms was recorded in open water habitats (mean 289.5 ± 221.04 individuals/m3), while the lowest numbers were obtained from seagrass habitats (mean 79 ± 31.2 individuals/m3). This case was relatively reverse during the warm season, where the lowest abundance of immature stages was noted from open water habitats (762.5 ± 534.59 individuals/m3), while the largest numbers ever during this season were in reef habitats (1169.5 ± 662.96 individuals/m3), Table 5.

3.4. Multiple correlation analysis

Multiple correlation analyses between Calanoida abundance and diversity and the prevailing environmental conditions (temperature, salinity, DO, and pH) were performed with p ≤ 0.05 as the significance level. During the cold season, abundance of Acartia erythraea was positively correlated with pH (r = 0.753), while abundance of Candacia simplex, Centropages violaceus, and Temora stylifera were negatively correlated with temperature (r = −0.633, −0.649, and −0.637, respectively). The effect of water depth was evident in the abundance of some species, which decreased in sheltered shallow lagoons habitats and gradually increased with the water depth, recording a positive correlation between their abundance and water depth (r = 0.845, Candacia simplex; r = 0.732, Centropages orsinii; r = 0.630, Clausocalanus pergens; and r = 0.749, Labidocera madurae). DO was positively correlated with abundance of C. simplex (r = 0.842), C. orsinii (r = 0.875), and L. madurae (r = 0.615), while salinity was positively correlated with Labidocera detruncata abundance (r = 0.670) and negatively with that of Centropages orsinii (r = −0.725). Calanoida diversity during the cold season was positively correlated with water depth (r = 0.794) and DO (r = 0.694), while negatively correlated with temperature (r = −0.655) and salinity (r = −0.724). In contrast, Calanoida abundance was positively correlated with the abundance of Acartia fossae (r = 0.693), Centropages elongatus (r = 0.663), and Paracalanus parvus (r = 0.758).
During the warm season, abundance of two species, Euchaeta indica, and Candacia simplex, was negatively correlated with pH (r = −0.865 and −0.774, respectively). Paracalanus aculeatus abundance correlated positively with temperature (r = 0.617). Moreover, abundance of Temora discaudata was positively correlated with water depth (r = 0.717) and DO (r = 0.833). In contrast, total abundance of Calanoida in the studied habitats during the warm season was mainly controlled by the abundance of three species, Acartia bispinosa, Acrocalanus gibber, and Tortanus recticauda, which were correlated with the total Calanoida abundance (r = 0.617, 0.595, and 0.741, respectively).
Overall, during the warm season, the water depth was correlated positively with the dissolved oxygen (r = 0.929) and negatively with salinity (r= −0.885), while in the cold season the salinity correlated positively with depth (r = 0.853) and temperature (r= 0.613). There was a positive correlation between temperature and salinity (r = 0.622) in the warm season and a negative correlation between salinity and DO during the warm (r = −0.755) and cold (r = −0.805) seasons. This may explain the condition of environmental stress in the SSL habitats.

3.5. Multiple Regression Analysis

Multiple regression analysis of total Calanoida versus water depth, salinity, pH, temperature, and DO resulted in the following prediction regression equations:
Abundance (Individuals/m3) = − 677 + 1.56 Depth + 7.3 Temp+ 13.2 Salinity − 23.6 DO+ 21.9 pH
Diversity (Number of species) = −125 + 0.180 Depth− 0.54 Temp+ 3.32 Salinity + 1.13 DO + 0.76 pH
Stepwise regression prediction equations: The prediction equations for estimating the abundance of the organisms resulted in some errors that could be minimised using the stepwise regression equations that were performed to exclude parameters, which were not strongly correlated (not significant, p > 0.05):
Abundance (Individuals/m3) = 96.4 − 43 DO + 1.42 Depth
Diversity (Number of species) = −96.04 + 0.203 Depth + 2.6 Salinity

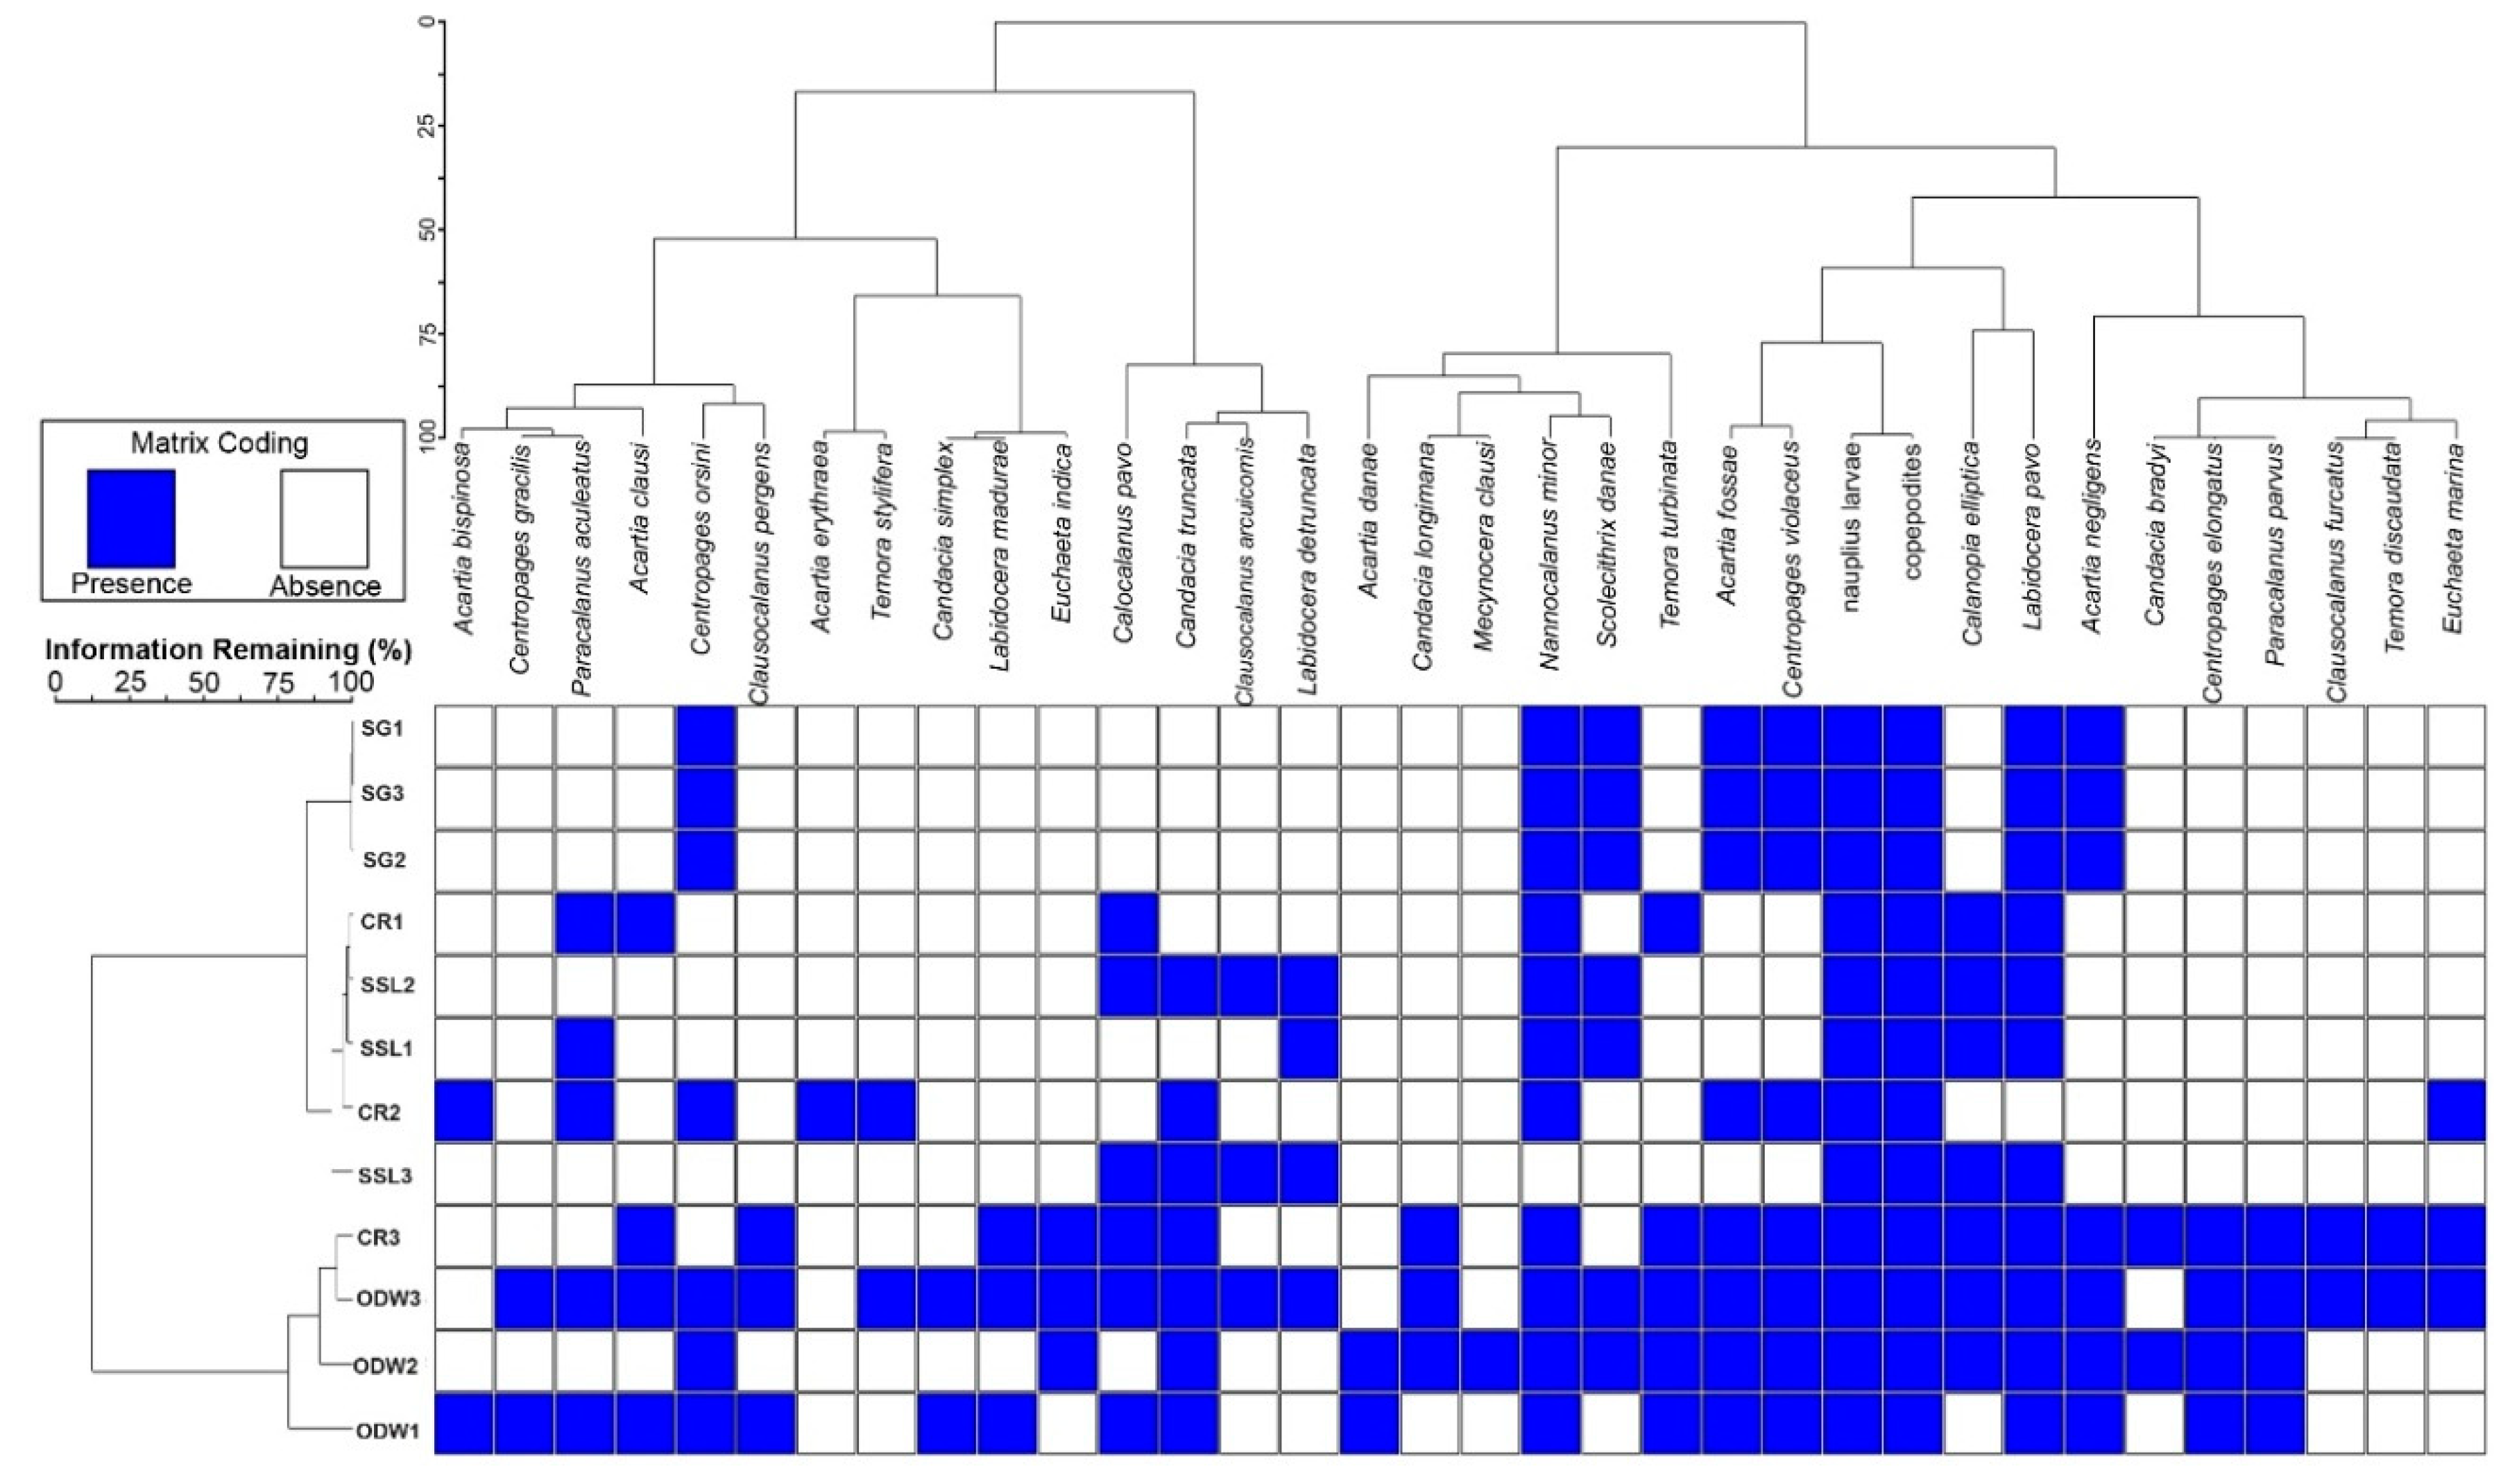
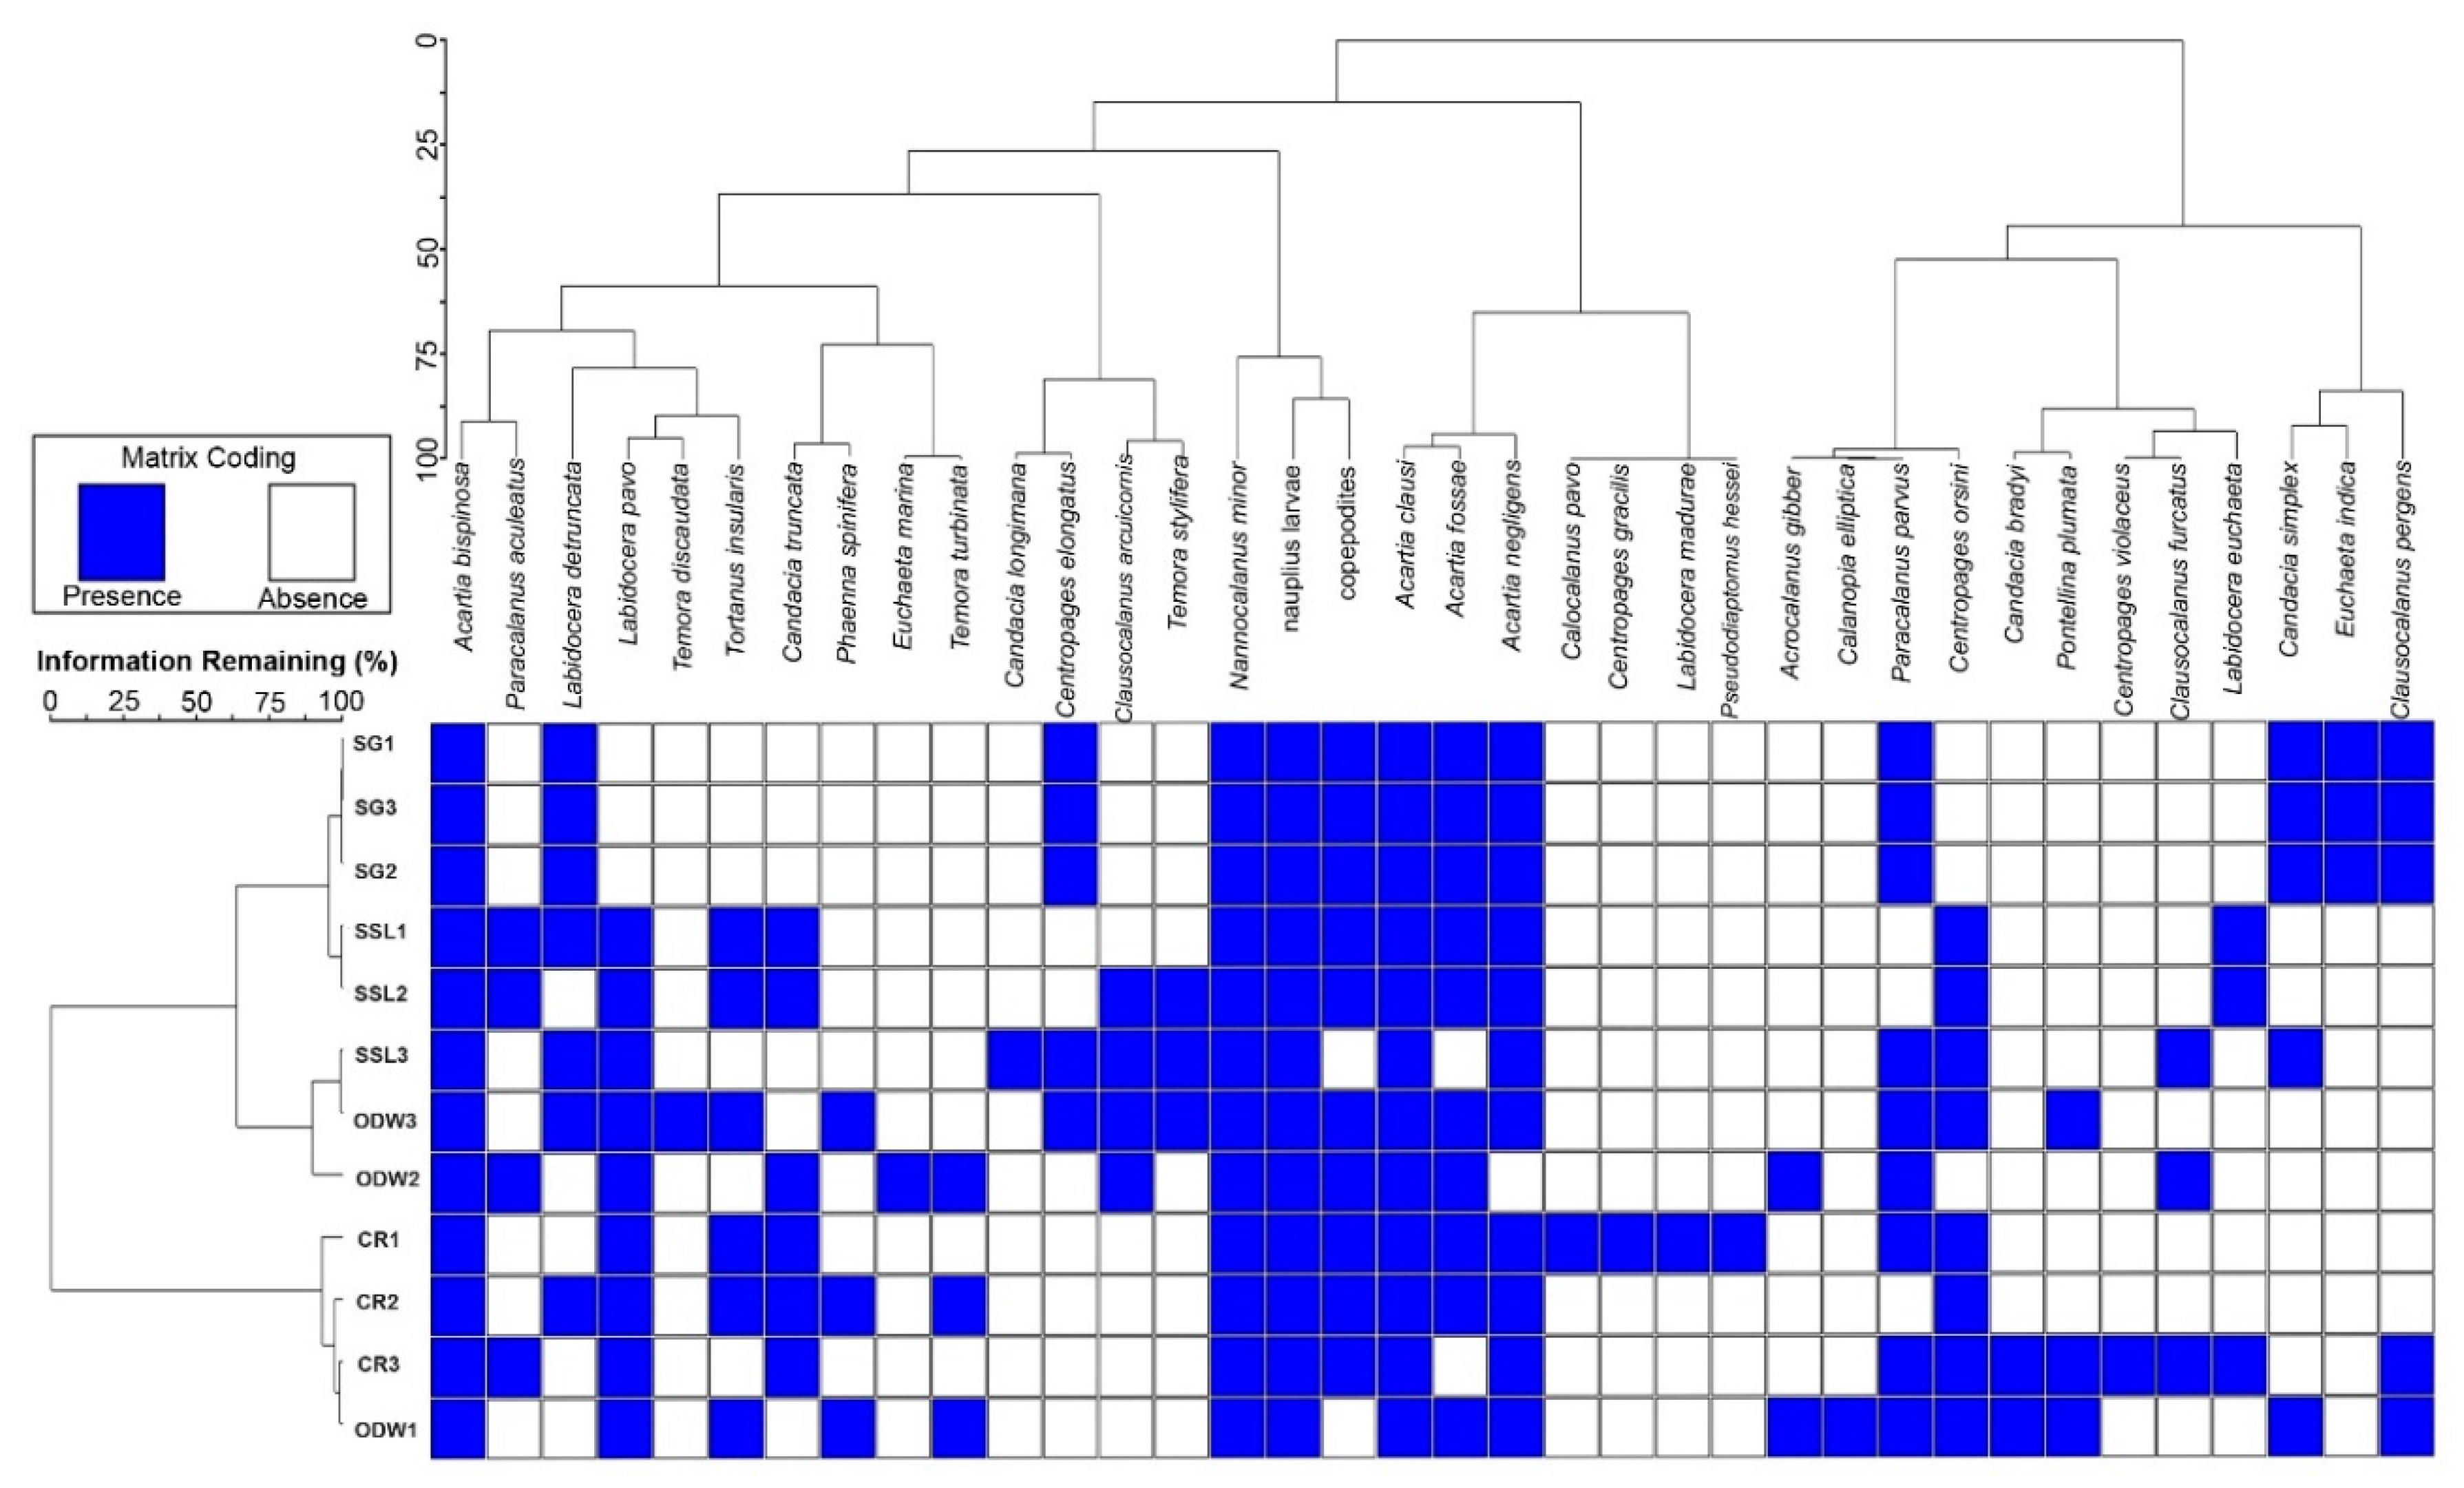
3.6. Cluster Analysis

Based on species composition, during the cold season, there was relative similarity between different stations and the maximum similarity was observed between SG habitats. There was high similarity (96.35%) during this season between the CR (CR1) and the SSL (SSL2) habitats. Among the cluster formed by all ODW and CR stations, CR3 formed a separate cluster that recorded minimum similarity (13.54) with the remaining stations, (Figure 5).
In contrast, during the warm season, the highest similarity (99.62%) was recorded between SG stations (SG1 and SG3), followed by the similarity (93.59%) between SSL habitats (SSL1 and SSL2). The minimum similarity (7.32%) was recorded between SG and SSL habitats and ODW (ODW1) (significant difference, p < 0.05), (Figure 6).

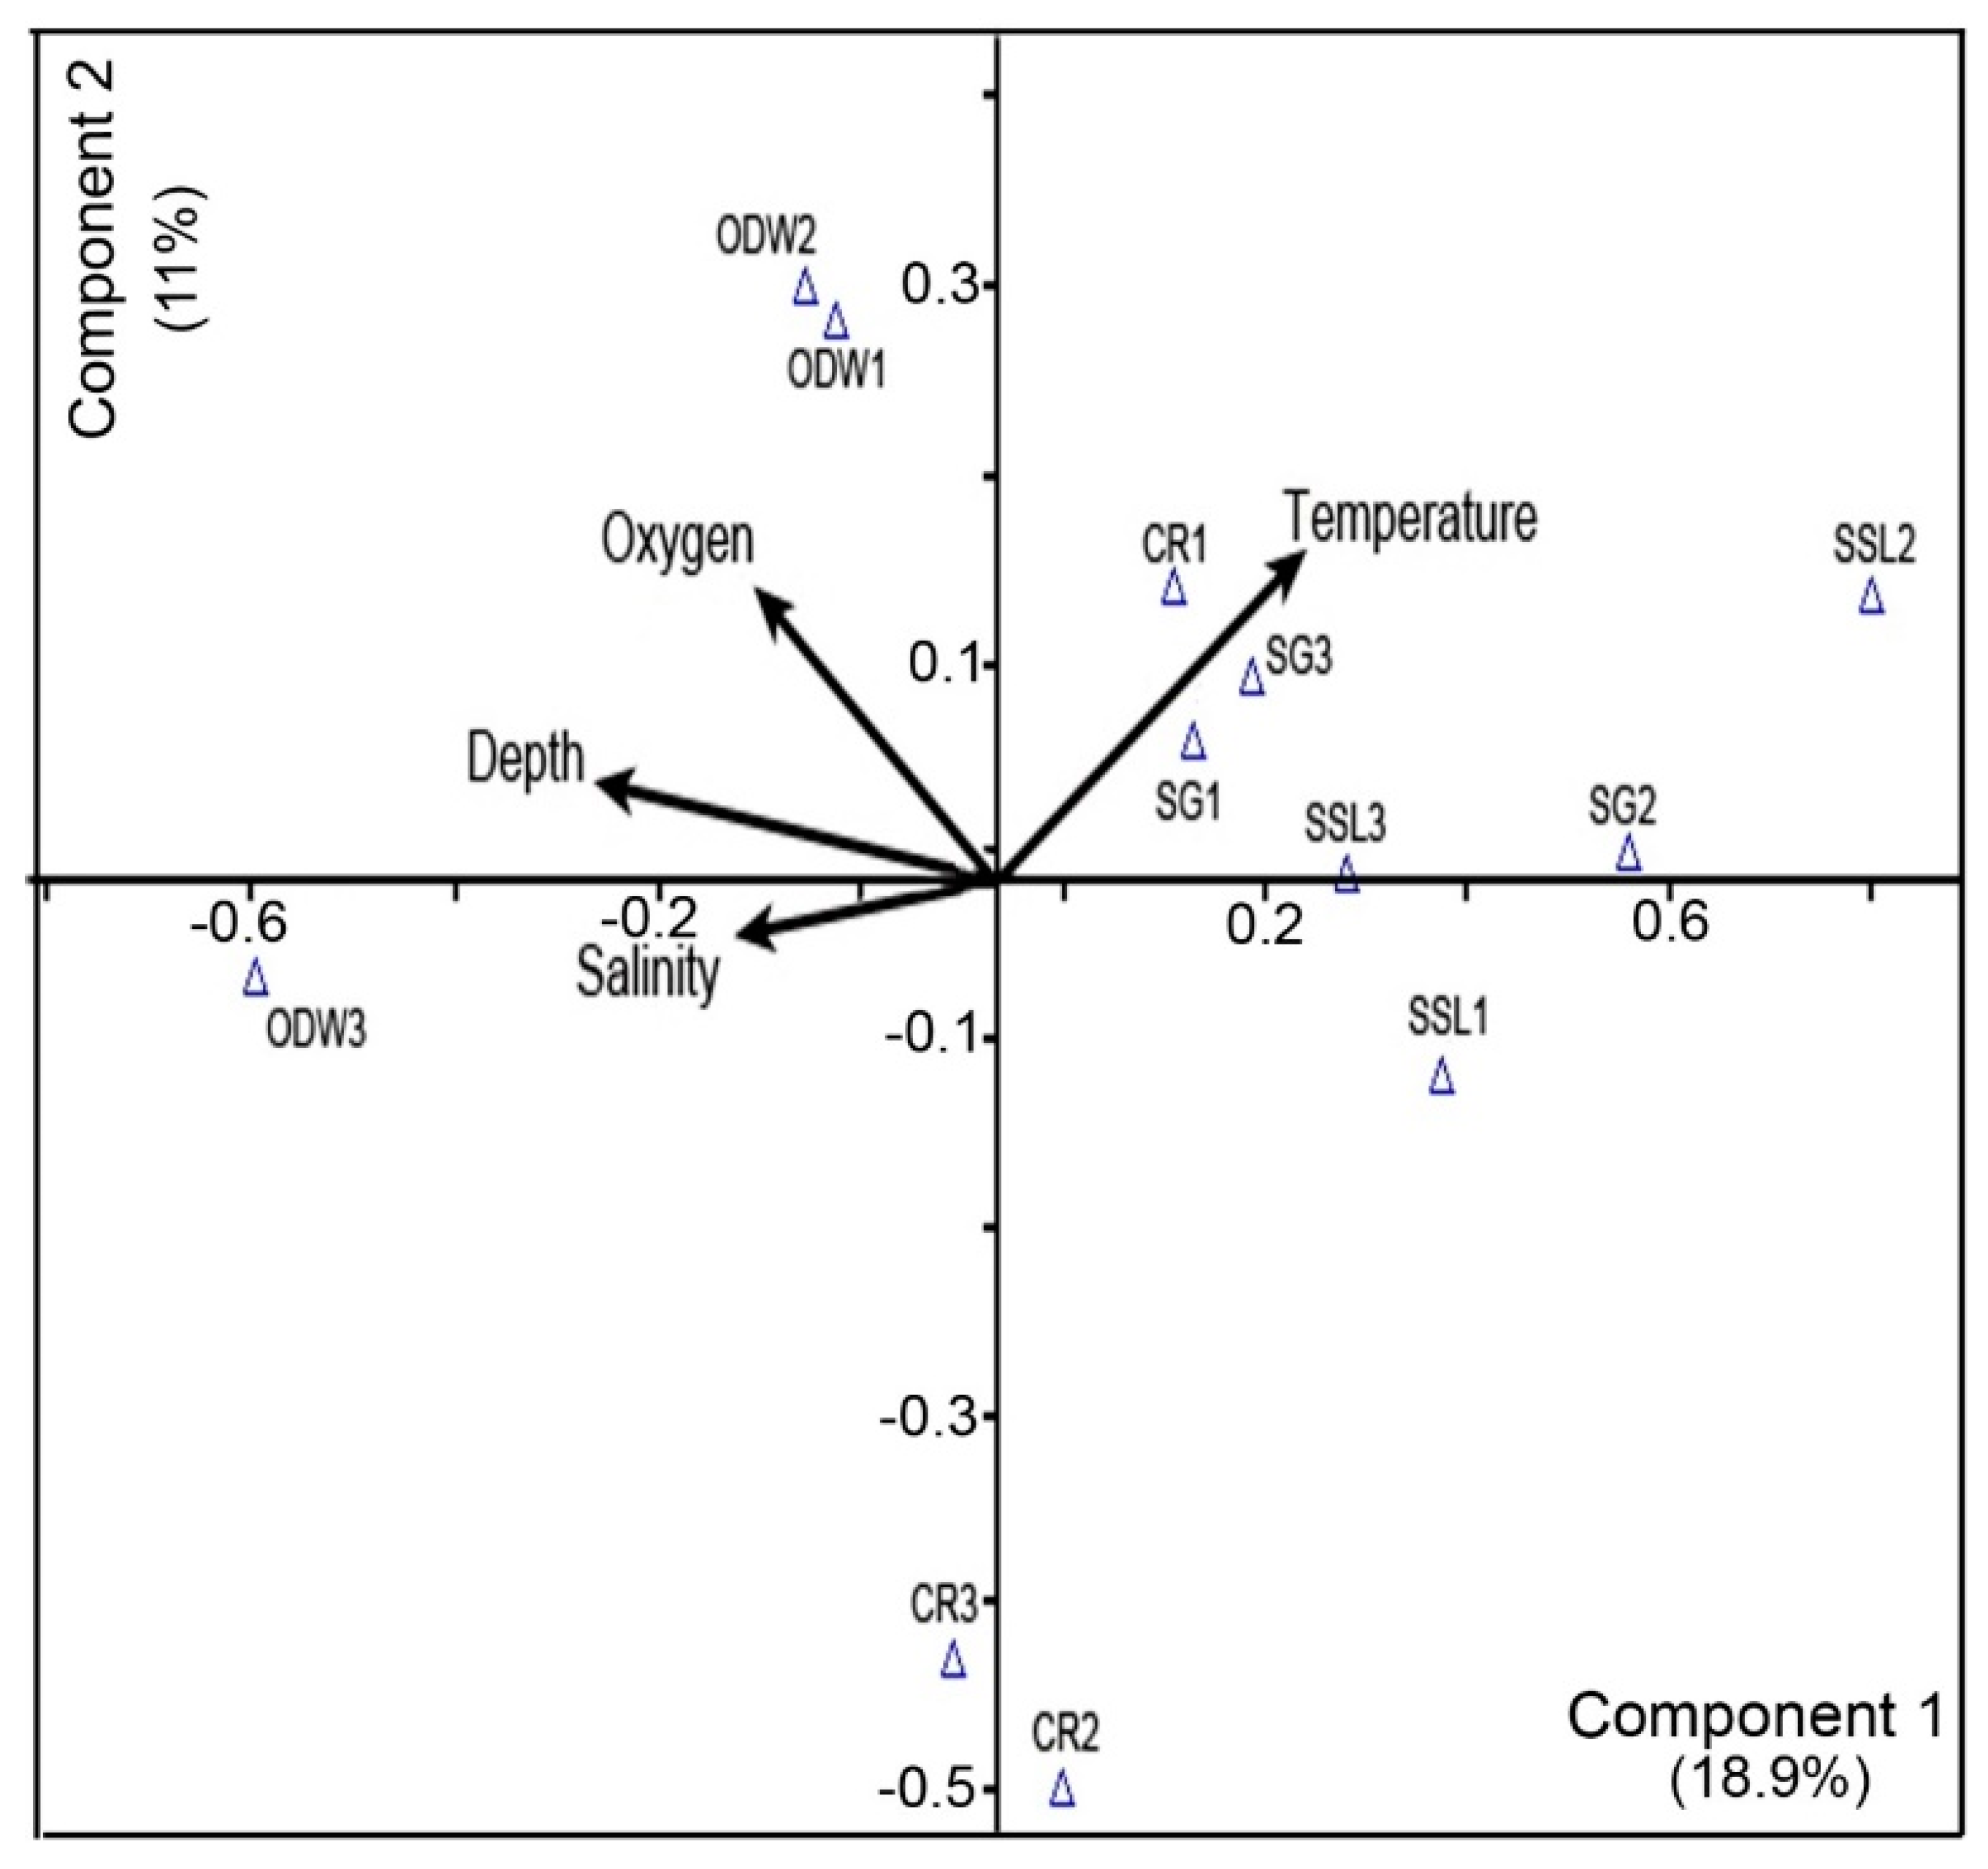
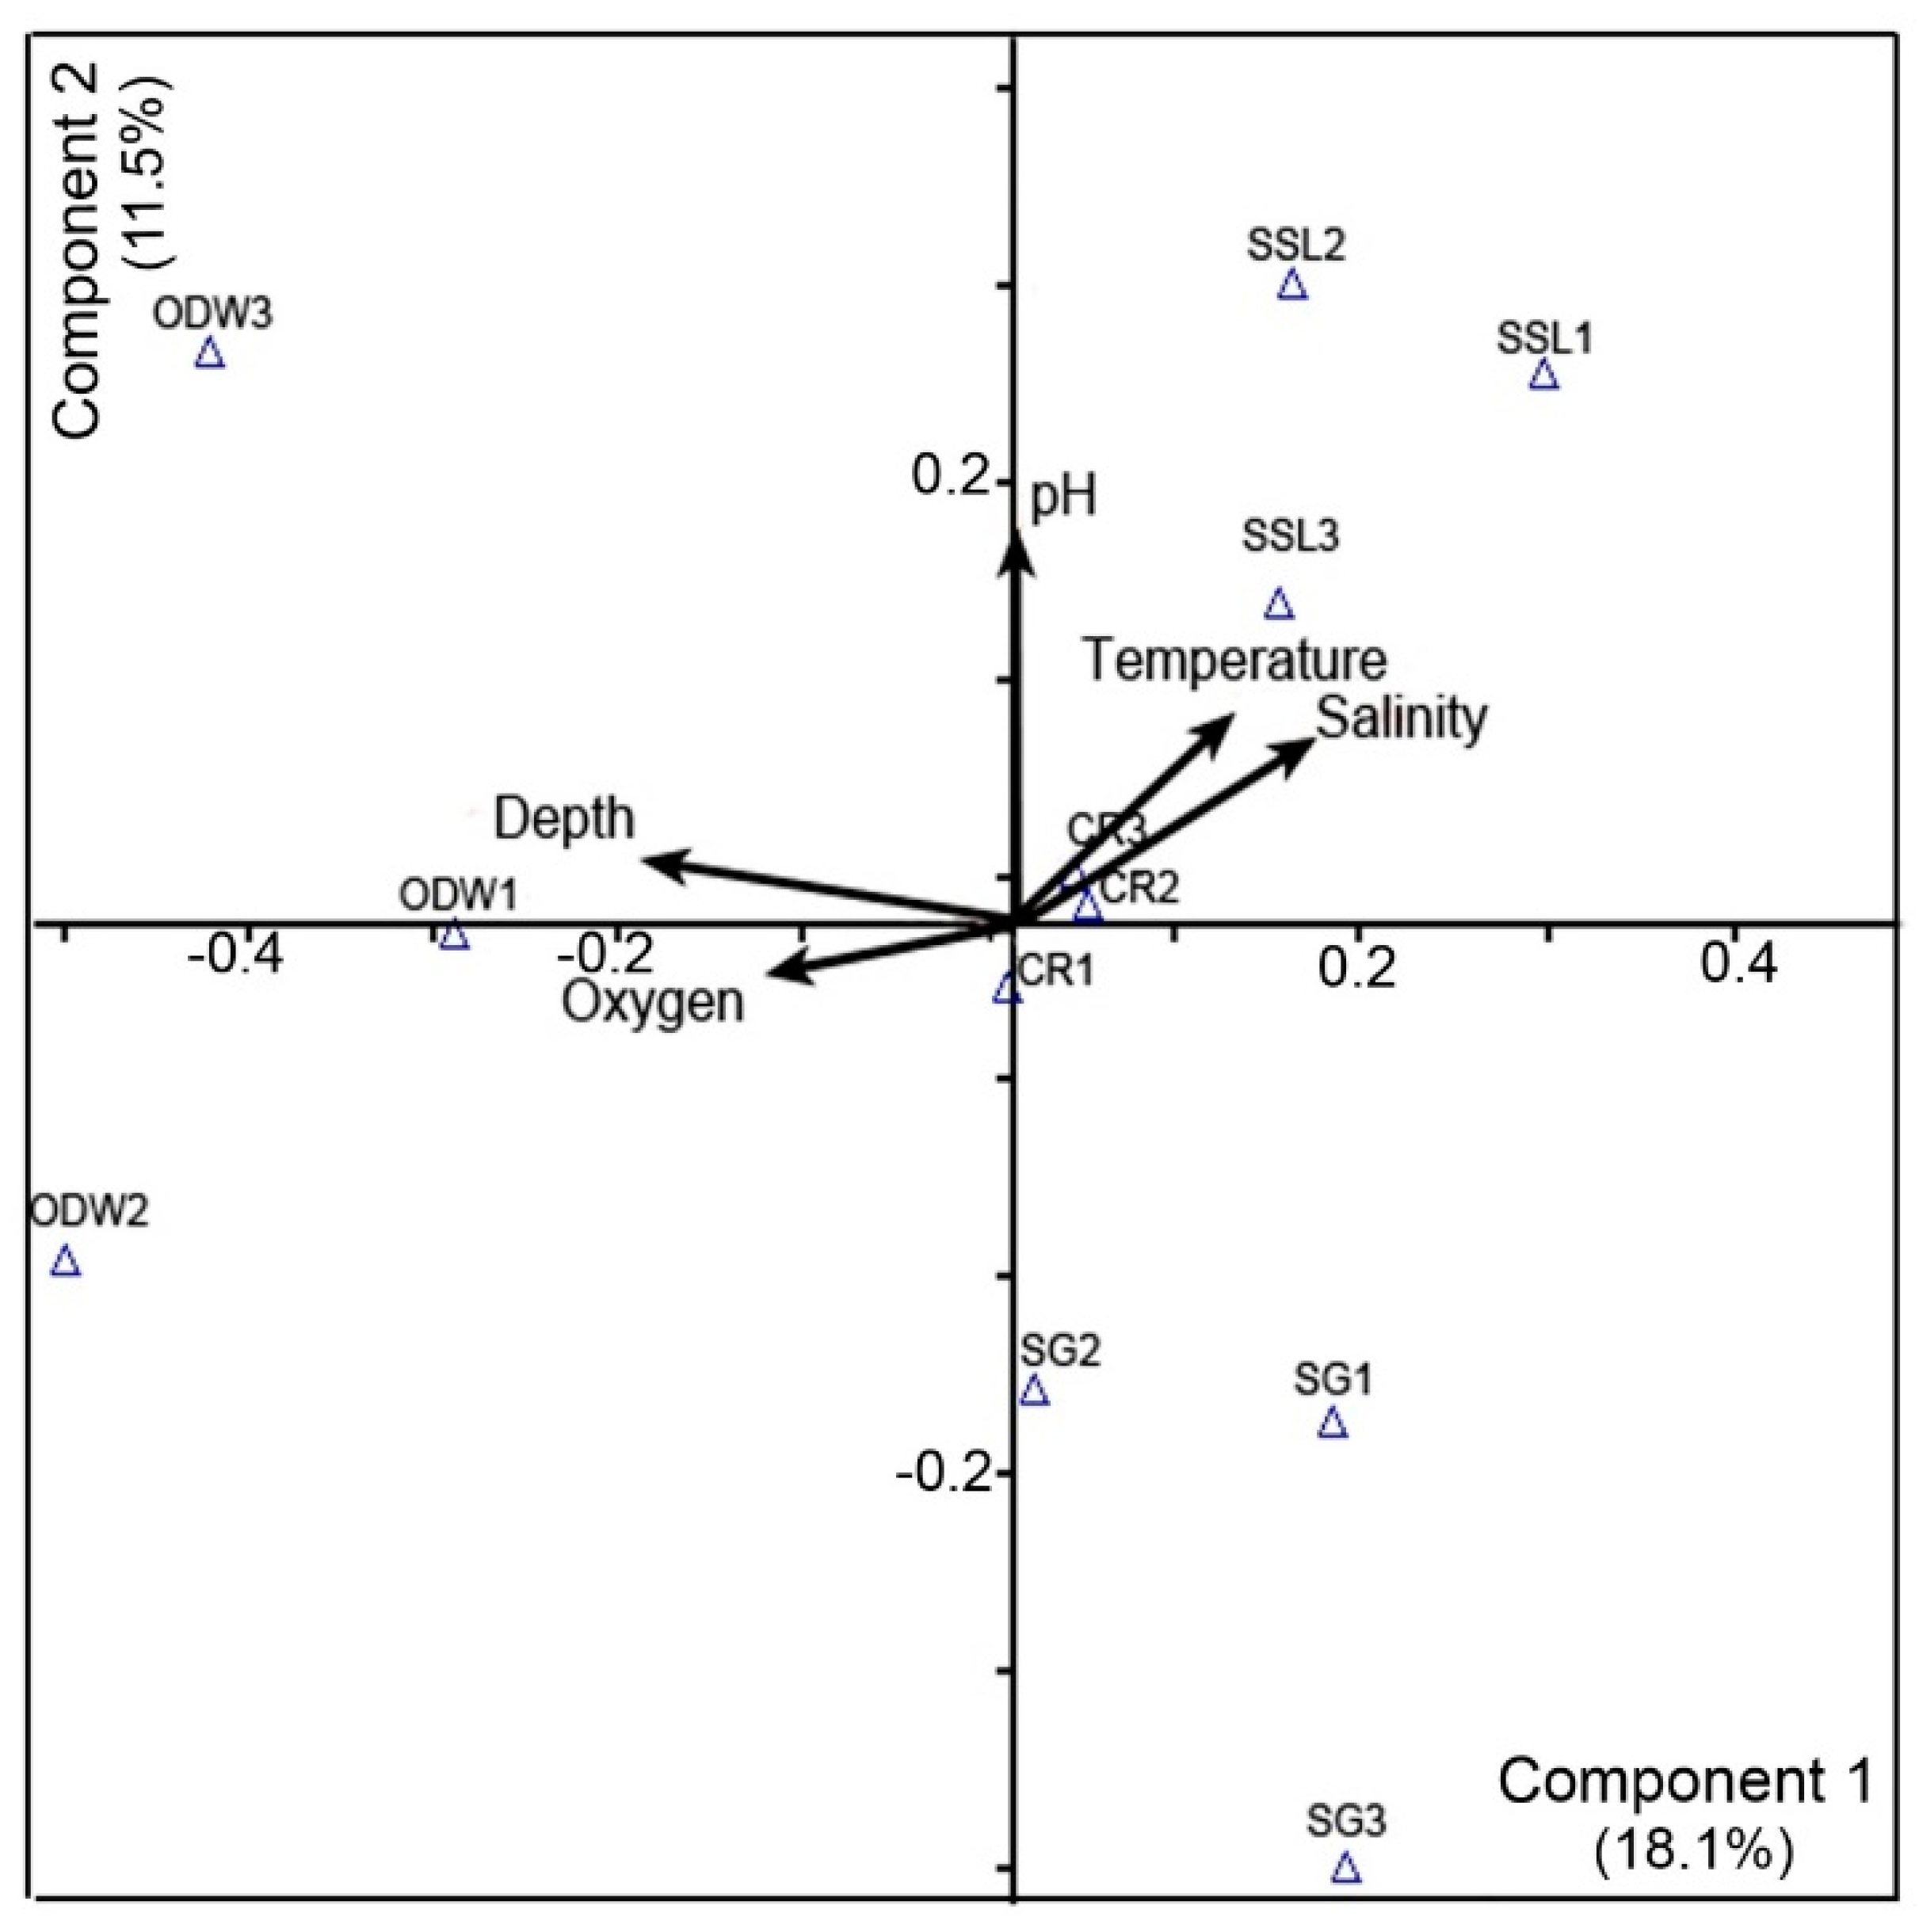
3.7. Principal Component Analysis (PCA)

Five environmental conditions (descriptors) were used: temperature, salinity, DO, pH, and water depth. The relationship of these environmental variables with the first two axes of variation (component 1 and 2 with proportions of variance 18.9 % and 11%, respectively, during cold season, while 18.1%, and 11.5% for axis 1 and 2, respectively, during warm season) indicates the most effective and influential variables. PCA and the components of the environmental data biplot of the first two axes are shown in Figure 7 and Figure 8 for cold and warm seasons, respectively. During the cold season, close correlation was observed between DO and depth contrary to the temperature along the first axis. These variables showed high DO values and depth at the ODW stations (ODW1 and ODW2) in contrast to the SG stations, CR1, and SSL that were more influenced by water temperature. The SSL (SSL1) was characterized by low salinity content (Figure 7).
In contrast, during the warm season, there were close correlations between temperature and salinity in contrast to the depth and DO along the first axis. The pH was obviously more correlated with the second axis. Variables associated with axis 1 (temperature and salinity) indicate an environmental stress condition gradient and clearly illustrates the tendency of SSL habitats being severely affected by environmental changes. Axis 2 is related to pH. PCA ordination of the data, according to the 12 reference stations, indicates the water quality differences between both the habitats and the sampling stations. Sample points were well distinguished according to each habitat. In ODW habitats, stations are clearly distinguished by being deeper, higher in DO content, and ecologically more stable. SG stations were characterized by low DO content and they were negatively correlated with pH values (Figure 8).

4. Discussion

The unique geographic location of the Red Sea makes the ecosystem highly sensitive to temperature and salinity, which is reflected in the distribution and diversity of plankton communities [20]. Plankton are considered very important bioindicator for the marine ecosystem and monitoring of the water quality. Many studies reported that the plankton (phyto and zoo) composition, distribution, diversity, and communities are affected by variations in environmental and nutritional conditions [2,6,33,34,35,36,37,38,39,40,41,42,43].
In the current study, the differences between the lowest (in cold season) and the highest (in warm season) temperature and salinity values were 8.5 °C and 8.8 ppt, respectively. SSL habitats were the most affected by environmental conditions, especially temperature, salinity, and depth. The alteration in temperature and salinity values clearly affected these habitats with minimum temperature and salinity values (28.1 °C and 35.2 ppt, respectively) during the cold season and the maximum values (36.5 °C and 44 ppt, respectively) during the warm season. These differences observed in the northern part of the Red Sea are clearly affecting the abundance and diversity of Calanoida Copepoda within the Red Sea, especially the SSL habitats [44]. PCA results indicated that the hydrological conditions, including temperature and salinity, have a great effect on the semi-enclosed areas such as sheltered shallow habitats. This may explain why there are no species restricted to such habitats during the winter [2].
Of all the studied habitats, the highest average temperature and salinity (34.4 °C and 42.9 ppt, respectively) were recorded during the warm season in shallow lagoon environments, which also showed the lowest values (28.1 °C and 38.1 ppt, respectively) during the cold season. This seasonal variation, and variability in other habitats of these two environmental factors, may be the main cause of the low diversity and abundance of Calanoida in these habitats. Many studies have indicated that there is a decline in Copepoda diversity because of changes in temperature and salinity [45]. These are considered the main factors that control and regulate the abundance and distribution of Copepoda, and of most other plankton organisms [46,47,48,49,50,51,52,53]. When excess food is available for aquatic organisms, the species abundance will mainly depend on temperature because the rising temperature in an area with highly nutritional salts and food content causes eutrophication that can be a limiting factor to many Copepoda species [54,55,56,57].
Owing to the rapid response of Copepoda to environmental conditions and their short life cycle, they are considered a good bio-indicator for ecosystem status and health [58,59]. Copepoda are considered the dominant zooplankton group in many parts of the Red Sea; they represent 70% of the total metazooplankton numbers [60,61]. Calanoida are relatively the most dominant among copepod orders [7], especially in the Red Sea [61]. According to El-Serehy and Abdel-Rahman [62], Calanoida represented 64% of the total Copepoda species and comprised 47 species among a total of 74 Copepoda species recorded during their study, while Al-Najjar [61] recorded 34 Calanoida (62%) from a total of 55 Copepoda species, and they comprised 49.2% (38 species of a total 67 adult Copepoda) in the study by Abo-Taleb and Gharib [2]. Therefore, using these as bio-indicators is of great value; hence, the importance of this study.
In the present study, 38 species of Calanoida, in addition to the immature forms (nauplius larvae and copepodites), were distributed in different habitats of the Red Sea. Almeida Prado-Por [19] identified 31 Calanoida species from samples collected seasonally from a stratified tow from the Gulf of Aqaba in 1975; the author assumed that Calanoida plankton, both quantitatively and qualitatively, was poor. The present data indicated that although the total number of Calanoida species in winter (by a relatively marginal extent) was lower (32 species) than in summer (34 species), in the SSL and SG habitats that have a special nature, the species number in winter was always higher than in the summer, reflecting the effect of such habitats on the Calanoida community. The winter peak of Calanoida species numbers in the Red Sea has been previously noted by Almeida Prado-Por [19] and El-Serehy and Abdel-Rahman [62].
Calanoida recorded increases in densities during the warm season in all habitats. This noticeable summer peak of Calanoida in the Red Sea may follow the peak of the zooplankton in the Indian Ocean, that are introduced into the Red Sea through the Bab El-Mandeb Strait during spring, owing to the prevailing pattern of water exchange towards the Red Sea. In winter, the plankton abundance in the Red Sea reduces as the surface water becomes less energetic because of the deficiency of nourishment and lack of water exchange [44], explaining the significant decrease in densities during the cold season. Furthermore, Chen [63] and Li et al. [64] recorded that the reproduction frequency of Copepoda, hatching rate, and even mating recurrence increases when the temperature rises above 35 °C. Classification of the different habitats in the studied area of the Red Sea was based on the fact that every habitat is controlled by several factors, including environmental conditions, availability of food, natural enemies, and predators, in addition to the competition for the space. Gusmão and McKinnon [65] noted the effects of the presence of ecto- and endo-parasites, limitation of food, pollution, and ultraviolet radiation on Copepoda reproduction. These factors reflected on the distribution and abundance of the organisms and the consequences appear as the higher decrease in number of species and their densities in semi-enclosed and coral reef habitats than in the sandy open water. These results are consistent with those of El-Serehy and Abdel-Rahman [62] who observed higher decreases in the number of Copepoda species, as general, (total 48 species), specially Calanoida (35 species) in the coral reefs of the Red Sea at Hibika and Abu Galum than in the offshore sandy stations of Nuweiba and Ras Burka (74 Copepoda species involve 47 Calanoida), where 26 species of Copepoda were absent, including 12 species of the order Calanoida alone. Moreover, in the current study, the highest number of Calanoida species was recorded from open water habitats during the warm and cold seasons (26 and 31 species, respectively).
The results of the present study illustrated that the lowest species numbers and abundance during cold and warm seasons were recorded in seagrass habitats, followed by the shallow lagoons and the coral reef habitats, while the highest were recorded in the open deep-water areas. These results are consistent with those of Abo-Taleb and Gharib [2], who studied the distribution of epipelagic Copepoda in the same habitats as our study. Depending on habitat type, there is an inverse relationship between Copepoda abundance and fish larvae. This finding was confirmed by Abu El-Regal [66] who studied fish larvae distribution and abundance along the coast of Hurghada. They noticed significant differences in larval abundance between different sites in the inshore areas; the highest abundance was recorded at the sheltered sites while the lowest was observed at open exposed sites.
In addition, Abo-Taleb and Gharib [2] studied the distribution of epipelagic Copepoda in the same habitats as our study and concluded that seagrass are the preferred habitats for the juveniles and fish larvae more than any other investigated habitat [67]. Many studies indicated that the stomach content of the seagrass and coral reef fishes and larvae comprised Calanoida as the bulk food items [2,62,68]. The location and abundance of fish larvae are strongly related to the habitat types and the adult spawning juveniles are known to utilise seagrass beds as a potential nursery habitat [67,69]. Fish larvae prefer seagrass substrates more than corals, for example, Lethrinus spp. dominantly inhabit seagrass beds in the juvenile life [68,69,70]. Hence, some offshore fish larvae seek seagrass habitats as nursery grounds [71]. Seagrass attract offshore larvae in high numbers owing to the presence of chemical odour cues of the plumes of some seagrasses that diffuse over a relatively wide distance [72].
Seagrass and coral reef habitats are considered a great attraction for many organisms from different trophic levels (more than 35 families of coral reef fish were recorded by El-Regal et al. [5] in the same area as the present study); this causes competition for food and space as their maximum levels are reached. This represents a great risk to the minute organisms, especially Calanoida Copepoda, which act as the second level within the trophic chain. Thus, Calanoida, which are the most threatened organisms, face high predation danger; this may explain the decrease in calanoid numbers in such habitats and their increase in the open water. There have been several studies confirming this assumption.
Williams et al. [68] studied the food items of different coral reef fish and their stomach contents and indicated their feeding on endemic copepod species. Moreover, the reef inhabitants and zooplanktivores have intense predation roles on copepod species in the flowing water over the coral reefs [73,74,75]. Similarly, El-Serehy and Abdel-Rahman [62] suggested that Calanoida are considered the first preferable food item among Copepod orders for the planktivores in the coral reef. This may explain the absence of Clausocalanus arcuicornis from coral reef habitats during the warm season and Temora stylifera during the cold season.
All these above-mentioned species have been recorded in this study and could explain why they were not restricted to coral reef habitats but found among different habitats—they may be escaping from predators. Therefore, Acrocalanus gibber was restricted to the open deep-water habitat and not recorded at any other habitat, while it disappeared during the winter. Clausocalanus arcuicornis and Paracalanus aculeatus were recorded at three habitats during the cold and warm seasons (SSL, ODW, and CR). Phaenna spinifera was found in the coral reef and open deep water during the warm season, and disappeared during the cold season, while Temora stylifera was an inhabitant of the coral reef and open deep water during the cold season, and open deep water and sheltered habitats during the warm season. During the cold season, there were no species restricted to sheltered shallow habitats, and this may be owing to the effect of rainfall in changing the environmental conditions in these semi-enclosed areas, such as changes in water salinity, which can result in death, escape of organisms, or act as a barrier against invasion of organisms. These barriers may be ecological [76] or biological such as predators. In this study, Clausocalanidae were represented by three species, C. arcuicornis, C. furcatus, and C. pergens; Clausocalanus is widespread and well-known in aquatic environments worldwide. Cornils et al. [77] noted that this genus is one of the most abundant and common genera of Calanoida in ocean waters, especially in the tropical and subtropical regions, as it can tolerate severe environmental conditions, especially high temperature.
Among all recorded species, Nannocalanus minor was the only species that could exist in all habitats during the cold and warm seasons; this may be because of the special characteristics that this species possesses, including (unlike many calanoid copepods) continuous reproduction (up to 5 generations/year) through most of its range, resulting in multiple generations produced [78]. In addition, this species is a cosmopolitan recorded from different water bodies; the Pacific Ocean [79], Atlantic Ocean [80], Indian Ocean [81], subtropical oceans [82], and Mediterranean Sea [45], which reflects its great ability to withstand various environmental conditions.
Raymont [83] noticed that the breeding positively correlated with the water temperature; hence, at the warm seas, most species reproduce all the year-round. It is common that immature forms of Copepoda (nauplius larvae and copepodites) reach their maximum abundance (that can rises to bloom) during summer as mentioned by several authors [2,84,85].

5. Conclusions

The Red Sea is an exquisite ecosystem with many diverse habitats. As the habitat changes, the environmental conditions and biodiversity differ. Copepoda, especially Calanoida, which represents the larger proportion of zooplankton, are second level producers in the marine food web. These minute organisms are affected by changes in these habitats, where some of them thrive and others disappear. Furthermore, the present study observed that some Calanoida species were widespread and adapted to exist in all habitats and seasons, such as Nannocalanus minor. This species has a great tolerance to live in different environmental conditions, making it a focal species that needs to be further studied. Understanding habitat preferences provides critical information for habitat management and/or native species conservation. The present study extends basic data regarding the Calanoida community and diversity in the different habitats of the Hurghada shelf, north-western Red Sea. One of the difficulties encountered in the current study is that it is the first, to the best of our knowledge, to compare the biodiversity and abundance of Calanoida copepods species in the various Red Sea habitats (coral reefs, shallow lagoons, seagrass, and open deep water). Owing to the importance of comparative studies of biodiversity and environmental conditions in different habitats of the Red Sea, as well as the lack of such studies, there is an urgent need to conduct more studies—especially on the communities of zooplankton and copepods—and expand the study of these habitats to include other habitats, such as mangroves and rocky habitats.

Author Contributions

H.A-T.: Conceptualization, data curation, formal analysis, investigation, methodology, visualization, writing—original draft, writing—review and editing, project administration. A.E.-S: Funding acquisition, resources, visualization, writing—original draft, writing—review and editing, project administration. A.A.: Funding acquisition, resources, visualization, writing—original draft, project administration. M.M.M.: Investigation, methodology, visualization, writing—original draft. M.A.: Data curation, formal analysis, investigation, methodology, visualization, writing—original draft, writing—review and editing. All authors have read and agreed to the published version of the manuscript.

Funding

This work was supported by the Vice Deanship of Research Chairs at King Saud University.

Acknowledgments

The authors wish to express their gratitude to the editor, the reviewers for their valuable comments and assistance in revising the manuscript. This project was financially supported by the Vice Deanship of Research Chairs at King Saud University.

Conflicts of Interest

The authors declare no conflict of interest.

References

  1. Hilmi, N.; Safa, A.; Reynaud, S.; Allemand, D. Coral Reefs and Tourism in Egypt’s Red Sea. Top. Middle East. N. Afr. Econ. 2012, 14, 416–434. [Google Scholar]
  2. Abo-Taleb, H.A.; Gharib, S.M. Seasonal distribution of epipelagic copepods at the different habitats in the north- western Red Sea, Egypt. Egypt. J. Aquat. Biol. Fish. 2018, 22, 139–157. [Google Scholar] [CrossRef] [Green Version]
  3. Shimode, S.; Toda, T.; Kikuchi, T. Spatio-temporal changes in diversity and community structure of planktonic copepods in Sagami Bay, Japan. Mar. Biol. 2006, 148, 581–597. [Google Scholar] [CrossRef]
  4. Ferdous, Z.; Muktadir, A.K.M. A Review: Potentiality of zooplankton as bioindicator. Am. J. Appl. Sci. 2009, 6, 1815–1819. [Google Scholar] [CrossRef]
  5. Abu El-Regal, M.A.; El-Wazeer, A.; Abou Elnaga, Z.S.; Amr, A.A. Composition and spatio-temporal distribution of zooplankton community in the Egyptian Red Sea coast at Hurghada. Egypt. J. Aquat. Biol. Fish. 2018, 22, 1–12. [Google Scholar] [CrossRef] [Green Version]
  6. Ashour, M.; Abo-Taleb, H.A.; Abou-Mahmoud, M.M.; El-Feky, M.M.M. Effect of the integration between plankton natural productivity and environmental assessment of irrigation water, El-Mahmoudia Canal, on aquaculture potential of Oreochromis niloticus. Turk. J. Fish. Aquat. Sci. 2018, 18, 1163–1175. [Google Scholar] [CrossRef]
  7. Cornils, A.; Sieger, R.; Mizdalski, E.; Schumacher, S.; Grobe, H.; Schnack-Schiel, S.B. Copepod species abundance from the Southern Ocean and other regions (1980–2005)—A legacy. Earth Sys. Sci. Data 2018, 10, 1457–1471. [Google Scholar] [CrossRef] [Green Version]
  8. Yamaguchi, A.; Matsuno, K.; Homma, T. Spatial changes in the vertical distribution of calanoid copepods down to great depths in the North Pacific. Zool. Stud. 2015, 54, 13. [Google Scholar] [CrossRef] [Green Version]
  9. Hernández-León, S.; Ikeda, T. A global assessment of mesozooplankton respiration in the ocean. J. Plankton Res. 2005, 27, 153–158. [Google Scholar] [CrossRef] [Green Version]
  10. Kobari, T.; Steinberg, D.K.; Ueda, A.; Tsuda, A.; Silver, M.W.; Kitamura, M. Impacts of ontogenetically migrating copepods on downward carbon flux in the western Subarctic Pacific Ocean. Deep Sea Res. Part II: Top. Stud. Oceanogr. 2008, 55, 1648–1660. [Google Scholar] [CrossRef]
  11. Moku, M.; Kawaguchi, K.; Watanabe, H.; Ohno, A. Feeding habits of three dominant myctophid fishes, Diaphus theta, Stenobrachius leucopsarus and S. nannochir, in the Subarctic and transitional waters of the Western North Pacific. Mar. Ecol. Prog. Ser. 2000, 207, 129–140. [Google Scholar] [CrossRef] [Green Version]
  12. Chiffings, A.W. Arabian Seas. In A global representative system of Marine Protected Areas, Central Indian Ocean, Arabian Seas, East Africa and East Asian Seas; Kelleher, G., Bleakley, C., Wells, S., Eds.; Great Barrier Reef Marine Park Authority: Washington, DC, USA, 1995; Volume 3, pp. 39–70. [Google Scholar]
  13. Delalo, E.P. Distribution of the zooplankton biomass in the Red Sea and the Gulf of Aden, winter 1961-1962. Okeanol. Issled. 1966, 15, 131–139. [Google Scholar]
  14. Halim, Y. Plankton of the Red Sea. Oceanogr. Mar. Biol.-Ann. Rev. 1969, 7, 231–275. [Google Scholar]
  15. Weikert, H. The oxygen minimum layer in the Red Sea: Ecological implications of the zooplankton occurrence in the area of the Atlantis-II Deep. Meeresforsch.-Rep. Mar. Res. 1980, 28, 1–9. [Google Scholar]
  16. Weikert, H. The vertical distribution of zooplankton in relation to habitat zones in the area of the Atlantis II Deep, Central Red Sea. Mar. Ecol. Prog. Ser. Oldend. 1982, 8, 129–143. [Google Scholar] [CrossRef]
  17. Schmidt, H.E. The vertical distribution and diurnal migration of some zooplankton in the Bay of Eilat (Red Sea). Helgol. Wiss. Meeresunters. 1973, 24, 333–340. [Google Scholar] [CrossRef] [Green Version]
  18. Almeida Prado-Por, M.S.; Por, F.D. First data on the Calanoida (Copepoda) of the Northern Gulf of Aqaba (Red Sea). Rapp. Comm. Int. Mer Méditerr. 1981, 27, 173–174. [Google Scholar]
  19. Almeida Prado-Por, M.S. The diversity and dynamics of Calanoida (Copepoda) in the northern Gulf of Eilat (Aqaba), Red Sea. Oceanol. Acta 1983, 6, 139–145. [Google Scholar]
  20. Almeida Prado-Por, M.S. Distribution of the Calanoid Copepoda along the Gulf of Elat (Aqaba), Red Sea. Rapp. Comm. Int. Mer Méditerr. 1985, 29, 249–252. [Google Scholar]
  21. Almeida Prado-Por, M.S. A dial cycle of vertical distribution of the Calanoidea (Crustacea: Copepoda) in the northern Gulf of Aqaba (Elat). A propos des migrations Lessepsiennes. Bull. Inst. Océan. Monaco 1990, 7, 109–116. [Google Scholar]
  22. Rice, E.W.; Baird, R.B.; Eaton, A.D.; Clesceri, L.S. Standard Methods for the Examination of Water and Wastewater, 23rd ed.; American Public Health Association: Washington, DC, USA, 2017; p. 4-144-153. [Google Scholar]
  23. Santhanam, R.; Srinivasan, A. A Manual of Marine Zooplankton; Oxford & IBH Publishing: New Delhi, India, 1994; p. 160. [Google Scholar]
  24. Sars, G.O. The fresh-water Entomostraca of the Cape Province (Union of South Africa). Part III: Copepoda. Ann. S. Afr. Mus. 1927, 25, 85–149. [Google Scholar]
  25. Newell, G.E.; Newell, R.C. Marine Plankton: A Practical Guide; Hutchinson Educational Ltd. Press: London, UK, 1963; p. 221. [Google Scholar]
  26. Rose, M. Faune de France 26: Copépodes pélagiques; Paul Lechevalier: Paris, France, 1933; p. 374. [Google Scholar]
  27. Mori, T. The Pelagic Copepoda from the Neighbouring Waters of Japan; Soyo Company: Tokyo, Japan, 1964; p. 150. [Google Scholar]
  28. González, J.G.; Bowman, T.E. Planktonic copepods from Bahia Fosforescente, Puerto Rico, and adjacent waters. Proc. US Natl. Mus. 1965, 117, 241–304. [Google Scholar] [CrossRef]
  29. Silas, E.G.; Pillai, P.P. The calanoid copepod family Pontellidae from the Indian Ocean. J. Mar. Biol. Assoc. India. 1973, 15, 771–858. [Google Scholar]
  30. Bradford-Grieve, J.M. The marine fauna of New Zealand: Pelagic calanoid Copepoda: Megacalanidae, Calanidae, Paracalanidae, Mecynoceridae, Eucalanidae, Spinocalanidae, Clausocalanidae. New Zeal. Ocean. Inst. Mem. 1994, 102, 1–60. [Google Scholar]
  31. Boltovskoy, D.; Correa, N.; Boltovskoy, A. Diversity and endemism in cold waters of the South Atlantic: Contrasting patterns in the plankton and the benthos. Sci. Mar. 2005, 69, 17–26. [Google Scholar] [CrossRef]
  32. Abo-Taleb, H.A. Key to the Red Sea Labidocera (Crustacea; Calanoida: Pontellidae) copepods, the distribution of the species in various habitats, with special reference to two new records, and a historical correction. Egypt. J. Aquat. Res. 2019, 45, 1–7. [Google Scholar] [CrossRef]
  33. Heneash, A.; Ashour, M.; Matar, M. Effect of Un-live Microalgal diet, Nannochloropsis oculata and Arthrospira (Spirulina) platensis, Comparing to Yeast on Population of Rotifer, Brachionus plicatilis. Mediterr. Aquac. J. 2015, 7, 48–54. [Google Scholar] [CrossRef]
  34. Ashour, M.; Elshobary, M.E.; El-Shenody, R.; Kamil, A.-W.; Abomohra, A.E.-F. Evaluation of a native oleaginous marine microalga Nannochloropsis oceanica for dual use in biodiesel production and aquaculture feed. Biomass Bioenergy 2019, 120, 439–447. [Google Scholar] [CrossRef]
  35. Ashour, M.; Kamel, A. Enhance growth and biochemical composition of Nannochloropsis oceanica, cultured under nutrient limitation, using commercial agricultural fertilizers. J. Ma. Sci. Res. Dev. 2017, 7, 233. [Google Scholar]
  36. El-Shenody, R.A.; Ashour, M.; Ghobara, M.M.E. Evaluating the chemical composition and antioxidant activity of three Egyptian seaweeds Dictyota dichtoma, Turbinaria decurrens, and Laurencia obtuse. Braz. J. food Technol. 2019, 22, e2018203. [Google Scholar] [CrossRef] [Green Version]
  37. Elshobary, M.; El-Shenody, R.; Ashour, M.; Zabed, H.M.; Qi, X. Antimicrobial and antioxidant characterization of bioactive components from Chlorococcum minutum, a newly isolated green microalga. Food Biosci. J. 2020. (Accepted). [Google Scholar] [CrossRef]
  38. Sharawy, Z.Z.; Ashour, M.; Abbas, E.; Ashry, O.; Helal, M.; Nazmi, H.; Kelany, M.; Kamel, A.; Hassaan, M.; Rossi, W.J.; et al. Effects of dietary marine microalgae, Tetraselmis suecica, on production, gene expression, protein markers and bacterial count of Pacific white shrimp Litopenaeus vannamei. Aquac. Res. 2020, 1–13. [Google Scholar] [CrossRef]
  39. Nour, M.A.; Zaki, M.A.; Ashour, M.; Kamel, A.; Taha, S.M.; Omar, E. Effect of different Nannochloropsis oculata diets (cultured under different nitrogen and phosphorus regime) on growth and biochemical composition of rotifers Brachionus plicatilis. In Proceedings of the 12th International Congress on Microbial Interaction and Applications of Beneficial Microbes, Munich, Germany, 17–18 July 2017. [Google Scholar] [CrossRef]
  40. Omar, E.; Zaki, M.; Ashour, M.; Kamel, A.; Taha, S.M.; Nour, M.A. Effect of nutrient limitations on growth and biochemical composition of outdoor cultured Chaetoceros calcitrans. In Proceedings of the 12th International Congress on Microbial Interaction and Applications of Beneficial Microbes, Munich, Germany, 17–18 July 2017. [Google Scholar] [CrossRef]
  41. Nour, A.M.; Ashour, M.; Kamil, A.; Taha, S.M.; Zaki, M.A.; Omar, E. The use of artificial fertilizers for culture of marine microalgae: 1. Growth and biochemical constituents of Nannochloropsis oculata. In Proceedings of the World Congress and Expo on Applied Microbiology, Frankfurt, Germany, 18–20 August 2015. [Google Scholar] [CrossRef]
  42. El-Wazzan, E.; Kamel, A.; Ashour, M.; Abdel Razek, F.A. Effect of microalgal diet on larval growth and survival of the carpet shell clam, Tapes deccussatus. In Proceedings of the 3rd International Conference on Aquatic Resources: Prospects and Challenges (ICAR, 09), Alexandria, Egypt, 17–20 November 2009. [Google Scholar]
  43. Nour, A.M.; Ashour, M.; Kamil, A.; Taha, S.M.; Zaki, M.A.; Omar, E. The use of artificial fertilizers for culture of marine microalgae: 2. Growth and biochemical constituents of Chaetoceros calcitrans. In Proceedings of the World Congress and Expo on Applied Microbiology, Frankfurt, Germany, 18–20 August 2015. [Google Scholar] [CrossRef]
  44. Beckmann, W. Mesozooplankton distribution on a transect from the Gulf of Aden to the Central Red Sea during the winter monsoon. Oceanol. Acta 1984, 7, 87–102. [Google Scholar]
  45. Abou Zaid, M.M.A.; El Raey, M.; Ezz, S.M.A.; Aziz, N.E.A.; Abo-Taleb, H.A. Diversity of copepoda in a stressed eutrophic bay (El-Mex Bay), Alexandria, Egypt. Egypt. J. Aquat. Res. 2014, 40, 143–162. [Google Scholar] [CrossRef] [Green Version]
  46. Sameoto, D.D. Influence of the biological and physical environment on the vertical distribution of mesozooplankton and micronekton in the Eastern Tropical Pacific. Mar. Biol. 1986, 93, 263–279. [Google Scholar] [CrossRef]
  47. Devreker, D.; Souissi, S.; Seuront, L. Development and mortality of the first naupliar stages of Eurytemora affinis (Copepoda, Calanoida) under different conditions of salinity and temperature. J. Exp. Mar. Biol. Ecol. 2004, 303, 31–46. [Google Scholar] [CrossRef]
  48. Holste, L.; Peck, M.A. The effects of temperature and salinity on egg production and hatching success of Baltic Acartia tonsa (Copepoda: Calanoida): A laboratory investigation. Mar. Biol. 2005, 148, 1061–1070. [Google Scholar] [CrossRef]
  49. Farrag, M.M.; El-Naggar, H.A.; Abou-Mahmoud, M.A.; Alabssawy, A.N.; Ahmed, H.O.; Abo-Taleb, H.A.; Kostas, K. Marine Biodiversity Patterns off Alexandria Area, Southeastern Mediterranean Sea, Egypt. Environ. Monit. Ass. 2019, 191, 367–394. [Google Scholar] [CrossRef]
  50. Abo-Taleb, H.A.; Al-Maghraby, M.A.; El Raey, M.; Aboul Ezz, S.M.; Abdel Aziz, N.E.; Abou Zaid, M.M. Mapping the Different Planktonic Groups at One of the Egyptian Bays along Mediterranean Coast. Oceanogr. Fish Open Access J. 2018, 6, 5. [Google Scholar] [CrossRef] [Green Version]
  51. Aboul Ezz, S.M.; Abdel Aziz, N.E.; Abou Zaid, M.M.; El Raey, M.; Abo-Taleb, H.A. Environmental assessment of El-Mex Bay, Southeastern Mediterranean by using Rotifera as a plankton bio-indicator. Egypt. J. Aquat. Res. 2014, 40, 43–57. [Google Scholar] [CrossRef] [Green Version]
  52. Karlsson, K.; Puiac, S.; Winder, M. Life-history responses to changing temperature and salinity of the Baltic Sea copepod Eurytemora affinis. Mar. Biol. 2018, 165, 1–30. [Google Scholar] [CrossRef] [Green Version]
  53. Srinui, K.; Ohtsuka, S.; Metillo, E.B.; Nishibori, M. A new species of Acartia (Copepoda, Calanoida) from the Philippines based on morphological and molecular analyses. Zookeys 2019, 814, 71–94. [Google Scholar] [CrossRef] [Green Version]
  54. Abo-Taleb, H.A.; El Raey, M.; Zaid, M.A.; Ezz, S.A.; Aziz, N.A. study of the physico-chemical conditions and evaluation of the changes in eutrophication-related problems in El-Mex Bay. Afr. J. Environ. Sci. Technol. 2015, 9, 354–364. [Google Scholar]
  55. Soliman, H.A.; Fatma, A.A.; AbouZeid, A.E.; Ashour, M. Optimum growth conditions of three isolated diatoms species; Skeletonema costatum, Chaetoceros calcitrans and Detonula confervacea and their utilization as feed for marine penaeid shrimp larvae. EJAR 2010, 36, 161–183. [Google Scholar]
  56. Soliman, H.A.; Fatma, A.A.; AbouZeid, A.E.; Ashour, M. Population growth rate, fecundity, filtration and ingestion rate of marine rotifer Brachionus plicatilis fed with motile and immotile microalgae. EJAR 2008, 34, 426–439. [Google Scholar]
  57. Ashour, M. Marine Microalgae: Aquaculture and Biodiesel Production, 1st ed.; LAP Lambert Academic Publisher: Saarbrücken, Germany, 2015; pp. 1–240. [Google Scholar]
  58. Reid, P.C.; Edwards, M. Long-term changes in the pelagos, benthos and fisheries of the North Sea. Senck. Marit. 2001, 31, 107–115. [Google Scholar] [CrossRef]
  59. Chust, G.; Vogt, M.; Benedetti, F.; Nakov, T.; Villéger, S.; Aubert, A.; Vallina, S.M.; Righetti, D.; Not, F.; Biard, T.; et al. Mare incognitum: A glimpse into future plankton diversity and ecology research. Front. Mar. Sci. 2017, 10, 4–68. [Google Scholar]
  60. Khalil, M.T.; El-Rakman, N.S.A. Abundance and diversity of surface zooplankton in the Gulf of Aqaba, Red Sea. Egypt. J. Plankton Res. 1997, 19, 927–936. [Google Scholar]
  61. Al-Najjar, T. The Seasonal Dynamics and Grazing Control of Phyto- and Mesozooplankton in the Northern Gulf of Aqaba. Ph.D. Thesis, University of Bremen, Bremen, Germany, 2000. [Google Scholar]
  62. El-Serehy, H.; Abdel-Rahman, N. Distribution patterns of planktonic copepods crustaceans in the coral reefs and sandy areas along the Gulf of Aqaba, Red Sea, Egypt. Egypt. J. Biol. 2004, 6, 126–135. [Google Scholar]
  63. Chen, S.J. An indoor culture study of Euierpe acutifrons from Xiamen Bay. J. Xiamen Fish. Coll. 1988, 12, 339–345. [Google Scholar]
  64. Li, C.; Luo, X.; Huang, X.; Gu, B. Influences of temperature on development and survival, reproduction and growth of a calanoid copepod (Pseudodiaptomus dubia). Sci. World, J. 2009, 9, 866–879. [Google Scholar] [CrossRef] [Green Version]
  65. Gusmão, L.F.M.; McKinnon, A.D. Sex ratios, intersexuality and sex change in copepods. J. Plankton Res. 2009, 31, 1101–1117. [Google Scholar] [CrossRef]
  66. Abu El-Regal, M. Abundance and diversity of coral reef fish larvae at Hurghada, Egyptian Red Sea. Egypt. J. Aquat. Biol. Fish. 2008, 12, 17–33. [Google Scholar] [CrossRef] [Green Version]
  67. Beck, M.W.; Heck, K.L.; Able, K.W.; Childers, D.L.; Eggleston, D.B.; Gillanders, B.M.; Halpern, B.; Hays, C.G.; Hoshino, K.; Minello, T.J.; et al. The identification, conservation, and management of estuarine and marine nurseries for fish and invertebrates. Bioscience 2001, 51, 633–641. [Google Scholar] [CrossRef]
  68. Williams, D.M.; Dixon, P.; English, S. Cross-shelf distribution of copepods and fish larvae across the central Great Barrier Reef. Mar. Biol. 1988, 99, 577–589. [Google Scholar]
  69. Cushing, D.H. Plankton production and year-class strength in fish populations: An update of the match/mismatch hypothesis. Adv. Mar. Biol. 1990, 26, 249–293. [Google Scholar]
  70. Wilson, G.G. A description of the early juvenile colour patterns of eleven Lethrinus species (Pisces: Lethrinidae) from the Great Barrier Reef, Australia. Rec. Aust. Mus. 1998, 50, 55–83. [Google Scholar] [CrossRef] [Green Version]
  71. Nakamura, Y.; Shibuno, T.; Lecchini, D.; Watanabe, Y. Habitat selection by emperor fish larvae. Aquat. Biol. 2009, 6, 61–65. [Google Scholar] [CrossRef] [Green Version]
  72. Atema, J.; Kingsford, M.J.; Gerlach, G. Larval reef fish could use odour for detection, retention and orientation to reefs. Mar. Ecol. Prog. Ser. 2002, 241, 151–160. [Google Scholar] [CrossRef]
  73. Glynn, P.W. Ecology of a Caribbean coral reef. The Porites reef-flat biotope: Part II. Plankton community with evidence for depletion. Mar. Biol. 1973, 22, 1–21. [Google Scholar] [CrossRef]
  74. Johannes, R.E.; Gerber, R. Import and export of net plankton by an Eniwetok coral reef community. Gt. Barrier Reef Comm. (Brisbane, Aust.) 1974, 1, 97–104. [Google Scholar]
  75. Hamner, W.M.; Jones, M.S.; Carleton, J.H.; Hauri, I.R.; Williams, D.M. Zooplankton, planktivorous fish, and water currents on a windward reef face: Great Barrier Reef, Australia. Bull. Mar. Sci. 1988, 42, 459–479. [Google Scholar]
  76. Cowen, R.K.; Gawarkiewicz, G.; Pineda, J.; Thorrold, S.R.; Werner, F.E. Population connectivity in marine systems an overview. Oceano. 2007, 20, 14–21. [Google Scholar] [CrossRef] [Green Version]
  77. Cornils, A.; Niehoff, B.; Richter, C.; Al-Najjar, T.; Schnack-Schiel, S.B. Seasonal abundance and reproduction of clausocalanid copepods in the northern Gulf of Aqaba (Red Sea). J. Plankton Res. 2006, 29, 57–70. [Google Scholar] [CrossRef]
  78. Ashjian, C.J.; Wishner, K.F. Temporal persistence of copepod species groups in the Gulf Stream. Deep Sea Res. Part I: Oceanogr. Res. Pap. 1993, 40, 483–516. [Google Scholar] [CrossRef]
  79. Matsuno, K.; Yamaguchi, A.; Hirawake, T.; Nishino, S.; Inoue, J.; Kikuchi, T. Reproductive success of Pacific copepods in the Arctic Ocean and the possibility of changes in the Arctic ecosystem. Polar Biol 2015, 38, 1075–1079. [Google Scholar] [CrossRef]
  80. Owre, H.B. Plankton of the Florida current. Part VIII. A list of the copepoda. Bull. Mar. Sci. 1962, 12, 489–495. [Google Scholar]
  81. Conway, D.V.P.; White, R.G.; Hugues-Dit-Ciles, J.; Gallienne, C.P.; Robins, D.B. Guide to the Coastal and Surface Zooplankton of the South-Western Indian Ocean; DEFRA Darwin Initiative Zooplankton Programme; Occasional Publication of the Marine Biological Association of the United Kingdom, No. 15: Plymouth, UK, 2003; p. 354. [Google Scholar]
  82. Grice, G.D.; Hulsemann, K. Abundance, vertical distribution and taxonomy of calanoid copepods at selected stations in the northeast Atlantic. Proc. Zool. Soc. Lond. 1965, 146, 213–262. [Google Scholar] [CrossRef]
  83. Raymont, J.E. Plankton and Productivity in the Oceans. Volume II zooplankton; Pergamon Press: New York, NY, USA, 1983; p. 496. [Google Scholar]
  84. Vervoort, W. Notes on the Biogeography and Ecology of Free-Living, Marine Copepoda. In Biogeography and Ecology in Antarctica; van Mieghem, J., van Oye, P., Eds.; Springer: Dordrecht, The Netherland, 1965; Volume 15, pp. 381–400. [Google Scholar]
  85. Atkinson, A.; Sinclair, J.D. Zonal distribution and seasonal vertical migration of copepod assemblages in the Scotia Sea. Polar Biol. 2000, 23, 46–58. [Google Scholar] [CrossRef]
Figure 1. Map illustrating the location of sampling stations in the Red Sea along the coast of Hurghada, Egypt.
Water 12 00656 g001
Figure 2. Schematic showing the distribution of different Calanoida species in different habitats during the cold season (arrows indicate the habitat in which the organisms were found).
Water 12 00656 g002
Figure 3. Schematic showing the distribution of different calanoid species in different habitats during the warm season (arrows indicate the habitat in which the organisms were found).
Water 12 00656 g003
Figure 4. Histogram showing the frequency of occurrence of Calanoida Copepoda at different stations during the investigation period.
Water 12 00656 g004
Figure 5. Dendrogram of two-way cluster analysis based on group average clustering linkage from Euclidean similarity matrix showing the similarity between studied stations during cold season.
Water 12 00656 g005
Figure 6. Dendrogram of two-way cluster analysis based on group average clustering linkage from Euclidean similarity matrix showing the similarity between studied stations during warm season.
Water 12 00656 g006
Figure 7. Principal Component Analysis (PCA) components projection on Axis 1 and Axis 2 showing the distribution of the stations based on the prevailing environmental condition during warm season.
Water 12 00656 g007
Figure 8. PCA components projection on Axis 1 and Axis 2 showing the distribution of the stations based on the prevailing environmental condition during cold season.
Water 12 00656 g008
Table 1. Studied abiotic factors in different habitat and stations during cold (C) and warm (W) seasons.
Habitat TypesStationsDepth (m)Temperature °CSalinity g/l (ppt)DO mg/lpH
CWCWCWCW
Seagrass (SG)SG1629.1030.9041.0341.617.686.227.707.40
SG2529.5032.5041.2041.007.626.257.307.50
SG36.529.0031.0041.3042.007.406.007.507.00
Av ± SD5.83 ± 0.7629.20 ± 0.2631.47 ± 0.941.18 ± 0.1441.54 ± 0.507.57 ± 0.156.16 ± 0.147.5 ± 0.207.30 ± 0.26
Coral Reef (CR)CR11228.7031.0041.4541.787.296.158.108.10
CR2928.5030.0041.3541.887.346.168.408.30
CR31328.4029.9041.1141.767.456.248.008.20
Av± SD11.33 ± 2.0828.53 ± 0.1530.30 ± 0.6141.30 ± 0.1741.81 ± 0.067.36 ± 0.086.18 ± 0.058.17 ± 0.218.20 ± 0.10
Sheltered Shallow Lagoon (SSL)SSL12.828.0034.0039.2042.607.236.137.908.40
SSL2228.1036.5035.2044.006.905.508.009.00
SSL3528.3032.5640.0042.207.246.138.008.40
Av± SD3.27 ± 1.5528.13 ± 0.1534.35 ± 1.9938.13 ± 2.5742.93 ± 0.957.12 ± 0.195.92 ± 0.367.97 ± 0.068.60 ± 0.35
Open Deep Water (ODW)ODW12928.5030.1041.0141.237.896.258.108.20
ODW23129.0029.8041.0740.327.596.327.808.00
ODW35628.0030.2041.1240.228.056.857.908.00
Av± SD38.67 ± 15.0428.50 ± 0.5030.03 ± 0.2141.07 ± 0.0640.59 ± 0.567.84 ± 0.236.47 ± 0.337.93 ± 0.158.07 ± 0.12
Represented Data are mean ± SD. Different superscript letters in each column indicate significant differences (p < 0.05). Statistical differences (p < 0.05, n = 3) between groups are indicated by different letters.
Table 2. List of families and species of calanoid copepods which identified in the present study.
Acartiidae
Acartia bispinosa Carl 1907
Acartia clausi Giesbrecht 1889
Acartia danae Giesbrecht 1889
Acartia erythraea Giesbrecht 1889
Acartia fossae Gurney 1927
Acartia negligens Dana 184
Clausocalanoidae
Clausocalanus arcuicornis (Dana 1849)
Clausocalanus furcatus (Brady 1883)
Clausocalanus pergens Farran 1926
Pontellidae
Calanopia elliptica (Dana 1846; 1849)
Labidocera detruncata (Dana 1849)
Labidocera euchaeta (Dana 1846)
Labidocera madura Scott A.1909
Labidocera pavo Giesbrecht 1889
Pontellina plumata (Dana 1849)
Calanidae
Nannocalanus minor (Claus 1863)
Euchaetidae
Euchaeta indica Wolfenden 1905
Euchaeta marina (Prestandrea 1833)
Pseudodiaptomidae
Pseudodiaptomus hessei (Mrázek 1894)
Candaciidae
Candacia bradyi Scott A. 1902
Candacia longimana (Claus 1863)
Candacia simplex (Giesbrecht 1889)
Candacia truncata (Dana 1849)
Paracalanidae
Acrocalanus gibber Giesbrecht 1888
Calocalanus pavo (Dana 1852)
Mecynocera clausi Thompson I.C. 1888
Paracalanus aculeatus Giesbrecht 1888
Paracalanus parvus (Claus 1863)
Scolecitrichidae
Scolecithrix danae (Lubbock 1856)
Temoridae
Temora discaudata Giesbrecht 1889
Temora stylifera (Dana 1849)
Temora turbinata (Dana 1849)
Centropagoidae
Centropages elongatus Giesbrecht 1896
Centropages gracilis (Dana 1849)
Centropages orsini Giesbrecht 1889
Centropages violaceus (Claus 1863)
Phaennidae
Phaenna spinifera Claus 1863
Tortanidae
Tortanus recticauda (Giesbrecht, 1889)
Table 3. Diversity and density of Calanoida species, related to different stations and habitats.
Habitat typesStationsCold SeasonWarm Season
Diversity sp. No.Density Org./m3Diversity sp. No.Density Org./m3
Seagrass (SG)SG1711111889
SG2714811963
SG3711211892
Total712411915
Coral Reef (CR)CR17127141233
CR210209121387
CR320367151276
Total25234241299
Sheltered Shallow Lagoon (SSL)SSL16157121099
SSL28145131063
SSL3633814689
Total921319950
Open Deep Water (ODW)ODW119316171400
ODW217236131065
ODW327387161470
Total31313261312
Total32221341119
Table 4. Abundances of the common species in different habitats in cold and warm seasons.
HabitatsCold SeasonWarm Season
Labidocera pavoNannocal-anus minorAcartia bispinosaAcartia clausiAcartia fossaeAcartia negligensLabidocera detruncataNannocal-anus minorParacalanus parvus
SG8.33 ± 4.50a4.00 ± 0.00a13.3 ± 1.5a17.3 ± 1.5a13.0 ± 2.0a2.0 ± 1.0a1.3 ± 0.6a22.0 ± 3.0b4.3 ± 1.5a
CR4.00 ± 4.00a5.33 ± 2.30a18.3 ± 2.3a18.3 ± 24.8a11.3 ± 16.3a4.3 ± 3.5a1.3 ± 2.3a18.3 ± 2.3b0.7 ± 0.6a
SSL10.0 ± 10.14a3.00 ± 4.35a33.3 ± 25.5a13.7 ± 8.7a11.7 ± 11.1a2.3 ± 1.5a1.7 ± 2.1a26.7 ± 14.6b0.3 ± 0.6a
ODW11.33 ± 6.65a7.33 ± 8.50a28. ± 8.9a22.7 ± 10.6a5.3 ± 2.3a1.7 ± 2.1a1.3 ± 2.3a52.0 ± 8.9a10.7 ± 16.7a
mean ± SD8.42 ± 6.45a4.92 ± 4.5223.3 ± 14.218 ± 12.610.3 ± 9.02.6 ± 2.21.4 ± 1.729.8 ± 15.74.0 ± 8.4
Represented Data are mean ± SD. Different superscript letters in each column indicate significant differences (p < 0.05). Statistical differences (p < 0.05, n = 3) between groups are indicated by different letters.
Table 5. Abundance (range, average ± SD) of the immature stages of Copepoda (individuals/m3) at different habitats and seasons.
SeasonsHabitatsRangeAverage ± SD
Cold seasonSG76–8279 ± 31.2
CR72–140106 ± 52.73
SSL73–284178.5 ± 119.63
ODW101–478289.5 ± 221.04
Warm seasonSG705–837771 ± 439.02
CR1047–12921169.5 ± 662.96
SSL589–1166877.5 ± 549.69
ODW360–1165762.5 ± 534.59

