Review

The Science behind Scour at Bridge Foundations: A Review

1
Department of European and Mediterranean Cultures, University of Basilicata, 75100 Matera, Italy
2
Department of Civil, Architectural and Environmental Engineering, University of Naples Federico II, via Claudio 21, 80125 Napoli, Italy
3
Department of Civil and Environmental Engineering, University of Strathclyde, 75 Montrose Street, Glasgow G1 1XJ, UK
*
Author to whom correspondence should be addressed.
Water 2020, 12(2), 374; https://doi.org/10.3390/w12020374
Submission received: 14 December 2019 / Revised: 12 January 2020 / Accepted: 22 January 2020 / Published: 30 January 2020
(This article belongs to the Special Issue Bridge Hydraulics: Current State of the Knowledge and Perspectives)

Abstract

:
Foundation scour is among the main causes of bridge collapse worldwide, resulting in significant direct and indirect losses. A vast amount of research has been carried out during the last decades on the physics and modelling of this phenomenon. The purpose of this paper is, therefore, to provide an up-to-date, comprehensive, and holistic literature review of the problem of scour at bridge foundations, with a focus on the following topics: (i) sediment particle motion; (ii) physical modelling and controlling dimensionless scour parameters; (iii) scour estimates encompassing empirical models, numerical frameworks, data-driven methods, and non-deterministic approaches; (iv) bridge scour monitoring including successful examples of case studies; (v) current approach for assessment and design of bridges against scour; and, (vi) research needs and future avenues.

1. Introduction

“If a builder builds a house for a man and does not make its construction firm, and the house which he has built collapses and causes the death of the owner of the house, that builder shall be put to death. If it causes the death of a son of the owner of the house, they shall put to death a son of that builder. If it causes the death of a slave of the owner of the house, he shall give to the owner of the house a slave of equal value. If it destroys property, he shall restore whatever it destroyed, and because he did not make the house, which he built, firm, and it collapsed, he shall rebuild the house that collapsed from his own property (i.e., at his own expense).”
—The Code of Hammurabi about 2250 B.C. [1]
Human-made structures and infrastructure are objects of continuous improvement due to their importance and role in society. Going beyond current practices for increasing their safety has been recognized as a fundamental issue for thousands of years. The Hammurabi code is an example of a regulating framework for ensuring the safety of structures, by punishing builders of faulty constructions [1,2]. Since times immemorial, bridges have been (and still are) a challenge for architects, engineers, and builders. This challenge covers all the phases from design to construction, maintenance, monitoring, and rebuilding. Failing bridges may cause severe disruption to infrastructure networks, social and economic problems, possible cultural-heritage losses, and on some occasions, many casualties. Scour from sediments around bridge foundations is one of the greatest threats to bridge safety.
Scour is an erosional process that can occur in rivers due to the interaction between any type of structure located underwater and the river flow. It is by far the leading cause of bridge failure worldwide [3,4,5,6,7,8], resulting in significant direct losses and disruption to road networks in terms of transportation operation, petrol, high traffic, additional laborers due to temporary closure, detours to the network road, and reconstruction works [9,10,11]. In Europe, bridges and road infrastructure reparations due to the 2002 flood in Germany amounted to €577 million [12], while the Austrian Federal Railways operator, ÖBB, faced economic losses of about €100 million due to flooding [13]. In the U.K., 20 road bridges were partially or totally destroyed due to flood events in 2009 [14], having estimated financial losses about £2 million per week. Additionally, the costs for scour risk mitigation is estimated at €541 million per year for the period 2040–2070 in Europe [15]. In turn, in the U.S.A., damages to bridges and highways from major floods in 1964 and 1972 amounted to $100 million per event [16], and the Federal Highway Administration (FHWA) estimated that, on average, 50 to 60 bridges collapse each year in the country [17]. In New Zealand, it was estimated that scour damages are about 36 million NZ $/year [18]. In Iran, the financial losses due to bridge collapse reached the cost of US $562.5 million in the first decade of the 21st century [19], while the estimated annual value of scour damage in South Africa amounts 22 million South African Rands (ZAR) [20]. Additionally, the damage of the flood in 2007 to transport infrastructure in Bangladesh and Indonesia amounted to 34% and 25% of the total infrastructure costs (US $363 million and US $35 million, respectively [21]).
Figure 1 shows notable examples of bridges that collapsed due to scour in two different countries that are severely affected by floods every year, Italy and the U.K. Among the different types of bridges, masonry arch bridges are the most vulnerable because they are often built on shallow foundations and have a rigid behavior that is sensitive to settlements [22]. The collapse of these bridges caused not only significant direct and indirect economic losses, but also losses of cultural heritage.
This paper aims to present an up-to-date state-of-the-art review on bridge scour. Section 2 briefly reviews the different types of scour and the physics of sediment particle motion. Section 3 describes the controlling scour dimensionless parameters; physical modelling; bridge scour estimates based on empirical, numerical, and data-driven approaches; and, non-deterministic frameworks. Section 4 shows the recent advancements in terms of scour measurements and bridge monitoring. Section 5 deals with the current approach for assessment and design of bridges against scour, while Section 6 discusses research needs and future directions.

2. Processes and Definitions

2.1. Different Types of Scour

Scour is an erosional process that can occur in rivers due to natural or man-made events. Natural erosional processes take place in rivers because they act as conduits for the movement of water and sediment [23]. The changes of streamflow and availability of sediment over time create the river morphology. Man-made scour can be caused, for instance, by legal or illegal sediment extraction, dam operations, and the influence in general of any structure placed into the river stream. Various definitions of different types of scour have been proposed in the literature. In the rest of the manuscript, reference is made to the definitions given in the Construction Industry Research and Information Association (CIRIA) manual on scour at bridges and other hydraulic structures [23], which are briefly reported below.
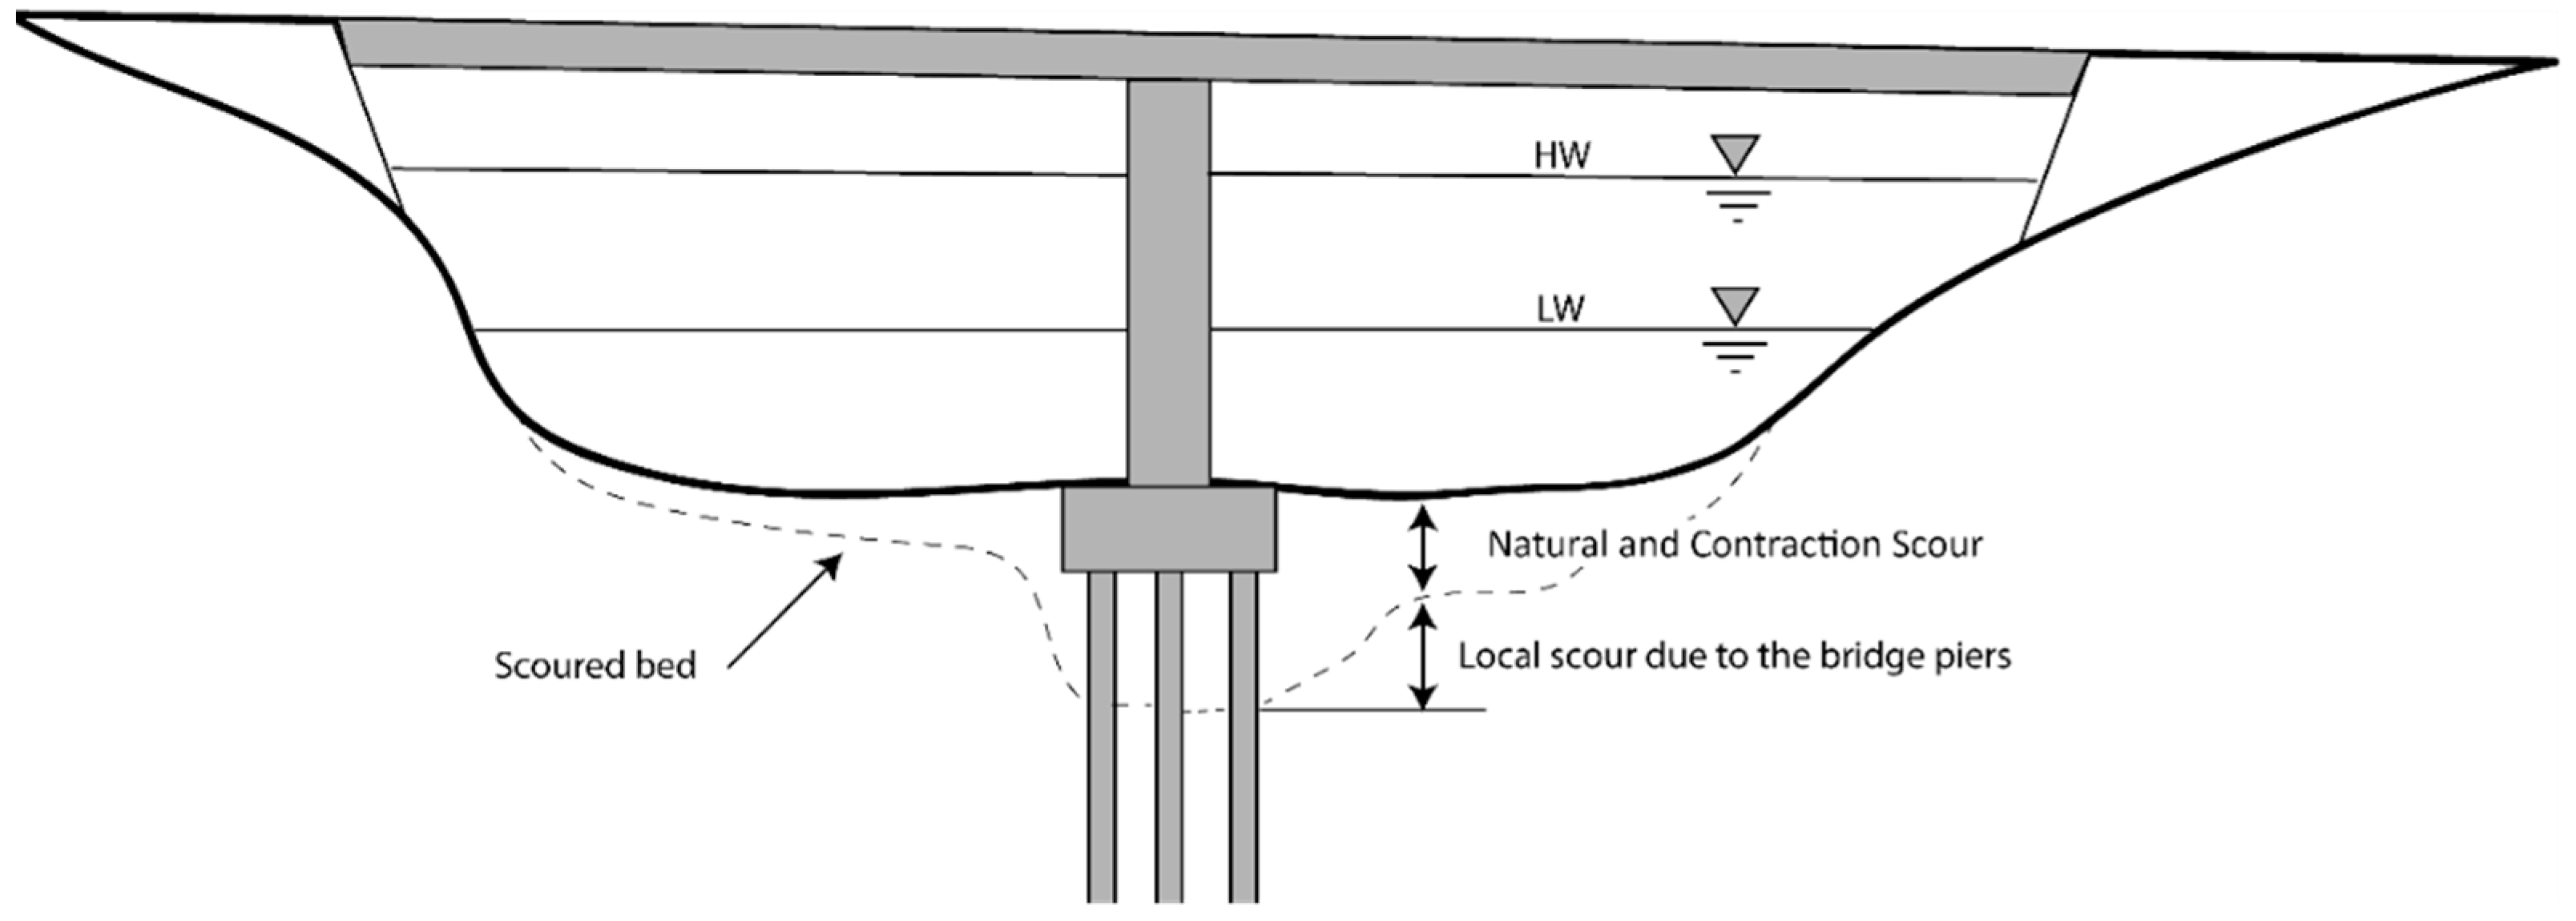
  • Natural scour: Natural scour occurs due to the natural variability of river stream flows and sediment regime, considering the influence from the catchment to the river scale. Gradation of the riverbed, lateral channel migration, bend, and confluence scour are part of the natural scour.
  • Contraction scour: Contraction scour occurs due to flow contraction when flow velocity, and thus shear stresses, increase, for instance, between bridge abutments. Contraction scour normally takes place within the complete river stream width.
  • Local scour: Local scour emerges due to a local concentration of turbulence generated by structures that obstruct and split the flow (e.g., bridge piers and abutments). Local scour occurs around these structures because of the limited influence range they have on the river flow.
  • Total scour: Total scour is defined as the sum of effects of all the scour processes that take place at a given location.
Figure 2 shows the different types of scour than can occur close to a bridge, considering local, contraction, and total scour.
Regarding the temporal evolution of scour, according to Zanke [24], any scour process can be classified in four different phases: (i) initial; (ii) progressing; (iii) developing; and (iv) equilibrium. Link [25] defined these phases for the bridge-pier scour process under simplified situations such as uniform sediment material, cylindrical pier shape, and steady hydraulic conditions. The definition of these bridge-pier scour phases is reported as follows,
  • Initial phase: The scour process starts showing erosional patters on the lateral side of the cylindrical pier.
  • Progressing phase: The erosional patterns progress from the lateral side to the front of the pier. From the moment the two scour patterns coincide at the front of the pier, the deepest scour depth is achieved.
  • Developing phase: The scour process develops, and the scour rate slows down.
  • Equilibrium phase: Erosion inside the scour-hole is negligible.

2.2. Sediment Particle Motion

The sediment motion occurs as a result of the two-phase interaction between a fluid and the sediments. Three different modes can be used to describe the particle motion, namely rolling and/or sliding, saltating, and suspended. These modes can also be divided into bed-load transport (rolling, sliding, and saltating) and suspended load transport (suspended). It is noteworthy that bedload and suspended load transport can occur simultaneously. Figure 3 illustrates the mentioned sediment transport modes.
Particle motion takes place when the fluid capacity exceeds the sediment capacity to stand in its place. Extra resistance capacity can be found in cohesive sediments, which have a significant content of clay or silt (e.g., for the bridge scour case, [26,27,28]). The condition for particle motion can be mathematically described by Equation (1),
θ θ c ,
where, θ and θ c are the Shields and the critical Shields parameter, respectively. θ c depends on the grain Reynolds number Re * , as was shown by Shields [29], among other researchers. The functional relation between θ c and Re * is normally known as the Shields curve. Bonnefille [30] and Yalin [31] demonstrated that the Shields curve can also be expressed in terms of the dimensionless sedimentological grain size D * ( = ( ρ g υ 2 ) 1 3 d s ) , where, ρ is the dimensionless effective density, g the gravitational acceleration, υ the kinematic viscosity, and d s the sediment size, whereas some empirical formulae are introduced as follows:
θ c = 0.24 D * 1 f o r 1 < D * 4
θ c = 0.14 D * 0.64 f o r 4 < D * 10
θ c = 0.04 D * 0.1 f o r 10 < D * 20
θ c = 0.013 D * 0.29 f o r 20 < D * 150
θ c = 0.055 f o r 150 < D * .
Hjulström [32] proposed the commonly called Hjulström curve to relate the critical flow velocity to grain size, explicitly. Such a curve is valid for sediments with a density of ρ s = 2650   kg / m 3 and water from 10 to 20 °C as fluid temperature. On the other side, the Shields curve can be employed under more general conditions, but there is a direct dependence on the shear stress, rather than on the flow velocity. Both the Hjulström and Shields curves are uncertain within their estimations, and the original diagrams provide a beginning motion zone. Uncertainty is due to different sources. For instance, those diagrams were developed almost one century ago, and therefore significant measuring errors could have influenced results (e.g., accuracy in water pumps, flow velocities, and flow depths). On the other hand, it is widely recognized that sediment particle motion depends on sediment-fluid properties’ interaction [33,34,35]. Consequently, the following factors influence and result in uncertainty in the incipient motion results: (i) sediment particle composition (cohesive vs. non-cohesive, natural vs. plastic) [36] and shape (spherical vs. non-spherical, uniform vs. non-uniform grain size distribution) [37,38]; (ii) changes in temperature producing changes in fluid viscosity [39,40]; (iii) flow-depth effects and scale effects of turbulence [41]; and, (iv) presence of biological/biogeochemistry agents and biofilms [42,43].
From a practical point of view, the critical mean flow velocity ( u c ) can be considered to establish whether sediment motion occurs or not. When the flow velocity is higher than u c , sediment particles start their movement. u c can be estimated by means of ad-hoc experiments, by using diagrams (e.g., [32]), and/or through different equations developed for this purpose. Table 1 shows six different equations that estimate the value of u c . These equations have been developed over the years with diverse purposes and a different level of complexity characterizes them. Some of them do not follow the dimensional homogeneity theory, according to which, equations must have the same units of measure. This is the case of Equations (7), (10), and (11), where units of velocity are only on the left side of the equations. Therefore, special precaution must be considered by applying empirical critical velocity equations.

3. Local Scour Depth Estimation

3.1. Physical Modelling and Controlling Scour Parameters

Most of the current approaches for estimating local scour are based on empirical formulae fitted to experimental data obtained via laboratory tests on scaled physical models. Physical modelling relies on maintaining similitude between movable bed laboratory experiments (models) and actual rivers representing real conditions (prototypes). The similitude between models and prototypes can be achieved keeping constant key dimensionless parameters, containing the physics of the phenomena. In 1986, Raudkivi [50] introduced the functional trends of scour that mainly depend on three dimensionless parameters to describe local scour, namely, the flow intensity ( u / u c , where u is the mean flow velocity), the relative flow depth to pier diameter ( h / D , where D is the pier diameter), and the relative diameter of the pier to sediment size ( D / d 50 , where d 50 is the sediment size).
Scour phenomena occur when u / u c is greater than a threshold value, whereas, for lower values, no erosional process exists. For instance, the value 0.3 was proposed as a threshold by Chiew [51] and Mia and Nago [52]; while 0.4 by Jones and Sheppard [53], and 0.5 by Zanke [54]. The most widely accepted and adopted value is 0.5 [54,55,56,57,58]. Clear-water scour occurs for 0.3 0.5 < u / u c 1.0 , and live-bed scour for u / u c > 1.0 . The former type of scour occurs when no sediment is transported from upstream into the scour hole, whereas live-bed scour appears under general sediment transport conditions [59]. The influence of u / u c on the scour process under high velocities was investigated by Zanke [54], and recently by Ettmer et al. [60] using plastic sediment materials. Differences were highlighted under clear-water conditions, live-bed scour, and entrainment into sediment suspension. It is noteworthy that during real flood events, scour can initially develop under clear-water conditions, followed by live bed and/or suspended sediment conditions, to return again to clear water conditions [61].
The parameter h / D affects the vorticity, which is associated with the generation of scour. For instance, for decreasing flow depths, the influence of the surface roller on the riverbed increases, damping the vortices in front of the pier. Vice versa, the bridge scour depth increases with h / D [62]. Different authors have identified different threshold values of h / D beyond which the scour process does not depend any more on the water depth. Among them, Breusers et al. [55] concluded that h / D > 3 ensures this independence, whereas Ettema [63] determined that bridge scour is almost independent on h / D for h / D > 1 , and fully independent for h / D > 3 . Melville and Sutherland [64] recommended h / D > 2.6 for water depth independence and design purposes. Whitehouse [65] concluded that h / D > 4 to avoid water depth effects. Link [25] observed an increasing scour depth by decreasing the flow depth in his experimental scour runs. Melville [66] distinguished between negligible and non-negligible effects of h / D establishing narrow and wide piers. According to him, negligible effects can be achieved for h / D 1.5 . In this context, the equilibrium scour depth is independent of h for narrow piers, whereas it increases proportionately with D . Conversely, for wide piers, the scour depth increases with h and is independent of D .
Concerning the influence of the third non-dimensional parameter ( D / d 50 ) , Ettema [63], Breusers and Raudkivi [67], and Melville and Coleman [62] stated that the maximum scour depth under clear water conditions is independent of D / d 50 for values larger than 25. According to Melville and Chiew [68], D / d 50 should be larger than 50. Sheppard et al. [69], Lee and Sturm [70], and Lança et al. [71] established that the equilibrium scour depth Z e q * can decrease for D / d 50 values larger than 25. In particular, Lança et al. [71] stated research needs to characterize the D / d 50 influence for values larger than 100. Lee and Sturm [70] showed the dependence of D / d 50 , establishing a logarithmical relationship between D / d 50 and Z e q * for D / d 50 < 25 , and Z e q * ~ 1.3 for D / d 50 > 400 .
The effects of blockage ratio (defined as D / b , where, b is the channel width) on scour has been frequently treated as a minor issue when D / b is less than ten percent [72]. New evidence has suggested that the influence of D / b on scour also depends on D / d 50 , where for D / d 50 > 100 , this effect seems to amplify [73]. The effects of D / b have been also investigated by Hodi [74], D’Alessandro [75], Tejada [76], Williams et al. [77], among others; finding the same trend. Williams et al. [73] proposed a new parameter, k c , which is defined as the ratio between the mean separating streamline velocity ( u s ) and u c . Their results suggest that the blockage influence on scour can be described by k c , proposing new equilibrium-scour prediction formulae (see, e.g., Equation (23)). Nevertheless, further experimentation is required to properly identify the effects of D / b on scour for high values of D / d 50 .
Working under complex hydraulic conditions and flood waves, Pizarro et al. [58] proposed the dimensionless effective flow work W* as a generalization of u / u c for unsteady flows. The definition of W* relies on the concept of stream power applied to local scour phenomena and on dimensional considerations, including variables characterizing the sediment, bridge pier, flow, and fluid. The mathematical definition of W* encompasses the integration of hydraulic loads on time, and thus it is suitable for scour description under steady, quasi-steady, and 100% unsteady flows. The mathematical formulation is as follows,
W * = 0 t e n d F r d 3 u e f z R δ d t ,
where, F r d = u e f / ρ g d s is the densimetric Froude number, u e f = u u c s is the excess velocity above the incipient scour condition, u c s , z R = D 2 / 2 d s is a reference length, t e n d is a considered time, and δ is the delta Dirac function,
δ = { 0 u / u c s < 1.0 1 u / u c s 1.0 .
Link et al. [78] evaluated the feasibility of physical scale modelling using three flumes with different geometries and five different sediment materials (natural and artificial). According to them, the bridge scour process is controlled by W* and D * , while scale effects in D / d 50 distorted models are negligible. Bombar [79] found that the effect of flow deceleration during the falling limb of the hydrograph was weaker than the effect of flow acceleration during the rising phase on scouring. Schendel et al. [80] investigated the role and impact of hydrograph shape, using W*, on tidal current-induced scour in physical models. Their findings showed that W* was suitable for analysis of scour under tidal currents, with reasonable practical accuracy. Recently, Manes and Brocchini [59] proposed a new formula to predict equilibrium scour depths, which was derived by merging theoretical aspects (i.e., the phenomenological theory of turbulence) with considerations taken from empirical evidence. The approach employed by the authors constitutes the first attempt to the development of predictive scour models founded more on physical than empirical grounds. A review paper treating the topic of bridge scour under waves can be found at Gazi et al. [81], whereas scour at bridge foundations under supercritical flows was recently reviewed by Link et al. [82].

3.2. Equilibrium Scour and Temporal Evolution of Scour: Empirical Approaches

During the last decades, different models have been proposed for the estimation of the local scour depth at bridge foundations. These models mainly rely on laboratory-experimental data that are often affected by oversimplified setups (flume geometry, sediment, steady hydraulic conditions), non-uniform procedures, and experimental errors. In general, the scour formulae can be divided into two main classes: (i) equilibrium scour models and (ii) time-dependent scour formulae. In general, scour formulae depend on flow characteristics (u and h), fluid properties (density and viscosity), sediment properties (density, sediment size), and pier geometry (shape and dimension). Table 2 lists seven equilibrium-scour models which have been taken into consideration due to their widespread use worldwide, the ranking of the best scour equations published by Sheppard et al. [83], and new-proposed ones accounting for blockage issues explicitly. For instance, the HEC-18 (Hydraulic Engineering Circular No. 18) and FDOT (Florida Department of Transportation) equations (Richardson and Davis [48] and Sheppard et al. [84], respectively) are widely used in the U.S.A., whereas the equation proposed by Gao et al. [85] is diffused in China. Equilibrium scour equations have been mainly proposed for design purposes and are based on experimental laboratory data. A detailed description of the experiments employed to develop such equations is not always available. However, comparisons among the more widely used scour equations can be found in the literature (see, e.g., Liang et al. [86], Gaudio et al. [87], Park et al. [88], Sheppard et al. [84], Qi et al. [89], Wang et al. [90], Qi et al. [91], and Sheppard et al. [83]).
Despite experimental-based scour modelling having been performed under different ranges of hydraulic and sediment material, the range corresponding to standard field scales is frequently unexplored. Typical scour experiments involved controlled flows, sediments, and geometric conditions that present a considerable lack of similarity between prototypes and models. Naturally, this hampers the comparison and uniformity of experimental data, derived equations, and trends on bridge scour. Figure 4 compares the results of the application of some of the equilibrium scour formulae listed in Table 2 (figure adapted from Pizarro and Tubaldi [92]). The input variables considered for the comparison were taken from the numerical case study considered in Pizarro and Tubaldi [92], i.e., d50 = 2.0 (mm), D = 1.5 (m), river width B = 22.0 (m), channel slope S = 0.0001 (m/m), and Manning’s roughness coefficient nGMS = 0.017 (s/m1/3). Figure 4B shows a boxplot of the five computed equilibrium scour depths (mean = 1.29 m, standard deviation = 0.36 m). Remarkably, for this combination of input variables, the difference between the maximum and minimum calculated scour depth depths is of about 100%.
According to Williams et al. [77], a revised definition of the densimetric Froude number using the velocity along the separating streamline, u s , was shown to have an influential role on the scour process. Consequently, the equilibrium scour depth also depends on u s , which is a variable that is not commonly considered in typical equilibrium scour models. It is interesting to mention that the philosophy behind these equilibrium-scour prediction formulae has overprediction (envelope curves) as the best fitting. This fact can be one of the reasons for such a large epistemic uncertainty in scour results.
The first studies analyzing the temporal evolution of scour depth under clear-water conditions were developed under steady-state conditions. Among them, Zanke [54] proposed a semi-empirical formula based on the principle of mass conservation on the bedload. Dey [96] derived a theoretical model based on the idea that the principal agent in the scour process is the horseshoe vortex, in which the mass conservation law must be satisfied. Melville and Chiew [68] and Oliveto and Hager [97] developed empirical scour formulae, where a logarithmic relationship between time and scour-depth was assumed. Recently, the Sheppard and Miller [98] and Melville [66] equations were combined and slightly modified in order to form a new scour equation: the Sheppard and Melville (S/M) equation which performs better than a number of previous formulae [84]. Pandey [99] evaluated six existing time-dependent scour equations using graphical and statistical analysis, reporting that Oliveto and Hager’s formula [97] predicts the temporal scour depth better than other equations. Although the aforementioned scour models are valid under steady hydraulic conditions, they can also be employed for describing scour evolution under unsteady conditions, adopting the convolution technique (see, e.g., [100,101,102]). Such a technique relies on the superposition concept that allows the representation of the hydrograph as a sequence of steady discharge steps, for which steady scour models are valid. Hager and Unger [103] proposed a formula for the computation of flood wave scour, imposing the condition of an exponential hydrograph. Link et al. [104] proposed the dimensionless effective flow work (DFW) model to evaluate the time-dependent scour depth under flood waves based on W * , while Pizarro et al. [105] derived the bridge-pier scour entropic (BRISENT) model based on both the informational entropy concept (uncertainty) and the principle of maximum entropy. DFW and BRISENT models allow estimation of the time-dependent scour depth with high accuracy under complex and different hydraulic scenarios (steady discharge, stepwise hydrographs, and unsteady flood waves). Models for describing the temporal evolution of scour under live-bed conditions are very scarce, mainly due to the difficulty in recreating these conditions in the laboratory.
Recently, Link et al. [106] developed a simple model to account for the refilling part of the scour process that relies on the sediment mass balance at the scour hole. The original formulation by Foster and Huggins [107] and Lu et al. [108] was modified by changing the characteristic length scale and considering the sediment transport capacity as the one corresponding with the inception of scour instead of inception of general sediment motion. Furthermore, a fractional sediment transport formulation was employed based on Dey [109], and consequently, the use of Meyer-Peter and Müller [110] was adopted. The deposition model has two different fitting parameters, but for a correct application, it is necessary to couple it with an erosional model. In this regard, Link et al. [106] used the deposition model coupled with Link et al. [104]. The deposition model was validated by using field scour measurements under real flood events showing low values of errors (see Figure 7 for models’ performances, flood events, and scour measurements). Table 3 lists five time-dependent scour prediction formulae selected based on their widespread use and computation approaches, such as convolution technique and direct scour depth computation.
The reported scour equations contain, in general, many parameters that have to be estimated. This issue of model calibration can be easier tackled at a laboratory scale due to availability of scour data. However, fitting the scour models to a real-bridge case study can be difficult, complicated, and at some locations, impossible to achieve due to the lack and accuracy of field scour information. Additionally, time-dependent scour models need scour data continuously, making the calibration and validation even more difficult.

3.3. Scour Estimates: Numerical Approaches and Data-Driven Methods

In order to avoid intrinsic limitations of empirical models, numerical studies have been carried out to estimate the scour evolution by simulating the flow pattern around hydraulic infrastructures. In particular, a detailed representation of the horseshoe vortex and complex bridge geometry have been of interest. Olsen and Melaaen [111] and Olsen and Kjellesvig [112] solved the Reynolds-averaged Navier-Stokes (RANS) equations, utilizing the finite-volume methods around cylindrical piers and non-cohesive sediment, by coupling them with the Exner equation for the evolution of the sediment bed. Model calibration was performed considering scour measurements at a physical model under clear-water conditions. Tseng et al. [113] computed the three-dimensional flow around square and circular piers, corroborating good agreement with experimental data reported by Dargahi [114]. Salaheldin et al. [115] computed different turbulence models and benchmarked their results with literature data. Results showed that a robust three-dimensional hydrodynamic model could effectively add information to experimental studies of complex flow fields and scour initiation around bridge piers with different size, shape, and dimension. Roulund et al. [116] used the k-ω SST model reproducing the vortex shedding at the lee side of a cylinder and providing 3D morphodynamics simulations. Sumer [117] published a review of the mathematical modelling of scour covering different approaches. Among them, the free surface effects and the influence of small-scale turbulence on sediment transport were recognized for future research.
The unsteady RANS were successfully used to model turbulence at piers with different geometries. However, they tended to overpredict the magnitude of the eddy viscosity, and therefore, important features were unrepresented at the turbulent horseshoe vortex system [118,119]. Considering suspended sediment transport, Baykal et al. [120] and Baykal et al. [121] reported an improvement in terms of deposition patterns downstream of the bridge pier.
Recently, machine learning algorithms were employed to predict the bridge scour depth. Differently from the standard regression models reviewed in the previous sections, this type of technique does not require anticipated knowledge of the mathematical relationships among key parameters, and therefore, no information about the process is needed. In this context, artificial neural networks (ANNs) have shown promising results in predicting the local scour depth [122,123,124,125,126,127]. Bateni et al. [128] predicted the equilibrium and time-dependent scour depth using ANNs and the adaptive neuro-fuzzy inference systems (ANFIS). By building the model, the authors considered five variables, namely, flow depth, mean velocity, critical flow velocity, mean gran diameter, and pier diameter. Results confirmed that data-driven models overperformed empirical methods, while through sensitivity analysis, pier dimension was the most relevant variable in the equilibrium scour depth. Firat and Gungor [129] employed the generalized regression neural networks (GRNN) and the feed-forward neural networks (FFNN) with scour data from the literature. Results demonstrated that GRNN performed better than FFNN, and that the most influencing variables on equilibrium scour depth predictions were pier dimension and sediment size. Toth and Brandimarte [130] applied ANN models to field and laboratory bridge scour data. Training sub-datasets were therefore classified by the origin of data (laboratory vs. field) and transport mode (clear-water vs. bedload), and in consequence, a higher degree of specialization was achieved to predict the equilibrium scour depth.
Despite promising results, machine learning-based algorithms have found limited application in the engineering practice due to the need for a large amount of data required for training and validation. In turn, numerical methods are not widely employed in the engineering practice due to their high computational costs and the very idealized conditions that they can simulate.

3.4. Non-Deterministic Approaches

Since the early studies of Barbe et al. [131] and Johnson [132], numerous works have acknowledged the importance of employing non-deterministic approaches for evaluating the scour depth at bridge foundations. In particular, probabilistic frameworks have been developed over the years to incorporate the effect of the uncertainties relevant to the problem [131,132,133,134,135,136,137,138,139,140,141], such as those characterizing the parameters associated with estimating discharge, flow depth, flow velocity, and the epistemic uncertainties affecting the scour prediction models in the scour depth evaluation.
Lagasse et al. [142] developed a novel risk-based procedure for bridge scour assessment, consistent with the load and resistance factor design (LRFD) approach commonly employed in structural and geotechnical engineering. The study was motivated by the need to clarify whether unaccounted-for biases in the scour depth formula, and input parameter and hydraulic modelling uncertainty, lead to overly conservative estimates of scour depths. The results of the investigation and the proposed risk-based procedure are described in the NCHRP (National Cooperative Highway Research Program) 24-34 [142] and Johnson et al. [143]. It is noteworthy that the proposed approach is not fully probabilistic in the sense that only a 100-year-flood event is considered for scour assessment purposes, instead of all the possible floods during the bridge’s lifetime.
Tubaldi et al. [144] developed a Markovian framework for describing the probabilistic evolution of clear water scour at bridge piers accounting for memory effects, i.e., accounting for the history- and time-dependent nature of the scour process. According to the Markovian process assumption, the change of the scour depth during one flood event depends on the scour level accumulated until the occurrence of the event itself, rather than on the entire hydrologic and scour history. Results confirmed that assuming both independence of scour events and always attained equilibrium scour depths, they may lead to unrealistic estimates of scour. On these findings, Pizarro and Tubaldi [92] assessed the epistemic uncertainty related to the temporal evaluations of clear-water scour under multiple flood events. They included more realistic flood shapes into the Markovian framework, identifying the most influencing hydraulic parameters in the computation of scour depths. Results corroborated the high sensitivity of the exceedance probability to the choice of the time-dependent scour model, while the effects of the epistemic uncertainty associated with the equilibrium scour models were lower than those associated with the time-dependent scour ones. Figure 5 shows results considering the BRISENT model and the Markovian framework on a numerical case study. In particular, the probability mass function of scour can be computed for different values of bridge lifetime (in this case from 5 to 100 years). Additionally, the probability of exceedance of scour, in function of the considered time, can also be computed.
Manfreda et al. [145] introduced the theoretically derived probability distribution of scour (TDDS) based on the probability distribution of floods, the velocity-area rating curve [146], and BRISENT model [105]. The TDDS was the first attempt to couple hydraulic, hydrological, and erosional models in a closed and analytical way, resulting in an estimate of the probability distribution of scour that can be used for design or scour risk assessment purposes.
Several different approaches have been proposed to deal with the issue of estimating the scour depth at bridge foundations. Among them, the approaches discussed in this section are physical modelling; empirical formulae; and numerical, data-driven, and non-deterministic methods. It is evident that all these approaches give an extra effort to the research in question, but on the other side, there is a huge lack of consensus within the scientific community. The science behind scour at bridge foundations is currently characterized by high empiricism and uncertainty, especially at real-scale bridges. Physical modelling and empirical approaches are normally developed/performed at small geometric scales (laboratory flumes) with controlled hydraulic and boundary conditions. Therefore, their applicability to real-geometric-scale bridges is not completely validated. Field scour data is critical to deal with the aforementioned issue, motivating also the possibility to develop better scour frameworks. The next section deals with the advancements of bridge scour monitoring with a focus on successful case studies and technology used.

4. Bridge Scour Monitoring

Field campaigns aiming to monitor real-time bridge-scour are practically non-existent due to accessibility issues under flood events, and damage and performance of sensors. Different technologies for field scour monitoring have been proposed and used in the past few years. A review of bridge scour monitoring techniques was recently carried out by Prendergast and Gavin [147], Deng and Cai [148], and Wang et al. [149]. Monitoring technologies can be classified into three different classes [149]: (i) monitoring with reference target (e.g., magnetic sliding collar [150], float-out devices [151], smart rocks [152,153]); (ii) soil-water interface (e.g., echo sonars [154], fiber Bragg grating sensors [155,156], TDR [157]); and (iii) reverse monitoring (e.g., tilt sensors and modal parameter [158,159]). These sensors and monitoring technologies have advantages and disadvantages, such as real-time data collection and difficulties in measuring the refill scour process, and different economic costs. For instance, scour monitoring with reference targets is easy to carry out, install, and operate but cannot continuously acquire data. Furthermore, it is not possible to monitor the refill scour process. Nevertheless, it is a cheap alternative. On the other side, sensors in the soil-water interface category are easy to install and consent continuous monitoring. Finally, reverse monitoring is environmentally friendly, easy to operate and interpret, but can be influenced by other variables such as wind, hydraulic factors, and traffic. Figure 6 shows a schematic illustration of a bridge pier with possible scour monitoring instrumentation, while Table 4 presents the advantages and disadvantages of the sensors mentioned above. Remarkable, long, and continuous scour time-series still do not exist, despite the increasing advances in technology.
Examples of successful field measurements were reported by Lu et al. [108], Su and Lu [151,160], and Hong et al. [161]. Sturm et al. [162] were able to measure the time-dependent scour during floods, while Link et al. [106] continuously measured flow characteristics and scour depths during six flood events, employing ultrasonic scour sensors. Remarkable, Link et al. [106] also proposed a deposition model that fitted field data with high accuracy (see Equation (28)). Figure 7 shows Link et al.’s [106] measured flood events (flood number 4, 5, and 6, respectively) including monitored scour depths and model performance accounting for the erosional and refilling part of the scour process.
Crotti and Cigada [163] reported results from a continuous long-period monitoring program in Italy. They monitored a bridge over the river Po, and included a different type of sensors such as anemometers for wind velocity, ultrasound sensors for water levels, video cameras to identify debris piling and echo sounders, and the patented bed level seeking system (BLESS) for scour depth monitoring. Remarkably, they presented five years of scour measurements at a measuring frequency of 1 h.
Recently, Maroni et al. [164] proposed a Bayesian Network (BN) approach with the aim of expanding the limited information from a reduced number of scour sensors at a few bridge locations to a bridge infrastructure network. This approach allows establishing scour hazard models that compute the scour depth at non-monitored bridge foundations taking into account real-time data from monitored locations. BNs can estimate and continuously update the computed scour depth based on real-time observations (scour depth, streamflow, flow depth), inferring probability distributions of the computed involved variables.
Monitoring of scour at bridge foundations in the field is of paramount importance to quantify both the inherent uncertainty that this complex phenomenon presents and the epistemic uncertainty that scour models contain. Additionally, bridge scour monitoring will set the basis for the introduction of new and better approaches in terms of design, real-time scour assessment, and economic prioritization.

5. The Current Approach for Assessment and Design of Bridges Against Scour

Bridges built over waterways have been designed to withstand a design flood event of a given magnitude with a prefixed return period T, typically of the order of 100 or 200 years [23,62,165,166,167]. The scour depth is then evaluated by assuming that the design flood acts over a theoretically infinite duration, i.e., until the equilibrium scour depth is achieved. Furthermore, a deterministic approach is often employed, neglecting all sources of inherent and epistemic uncertainties that may affect the scour problem, and leading to a one-to-one relationship between the flood discharge and the scour depth. Cumulation phenomena, though important (e.g., Tubaldi et al. [144]), are also disregarded. Under these assumptions, a one-to-one relationship exists between the design flood discharge and the design scour depth, and the probability distribution of the scour depth can be obtained by using a simple transformation of random variables. Current standards and procedures for bridge scour assessment and design are mostly in agreement (e.g., Melville and Coleman [62]). Their philosophy can be established in four different stages that are briefly described below [23]:
  • Screening: Identification of structures that are subject to water body actions and establishment of those that are at risk of scour, potentially.
  • Initial assessment: Quantification of scour depths and comparison with existing level of protection. At this stage, the estimation of hydrologic and hydraulic variables is performed with views in the computation of potential scour depths. Additionally, a first categorization for low and high risk is performed that relies on whether or not the computed scour depth is larger than the foundation depth.
  • Detailed assessment: Following the initial assessment, a detailed scour stage is established for high-risk-of-scour bridges. This consists in the estimation of scour depths in a more refined framework to confirm or change bridge categorization to scour. If the structures are still at high risk, a design process is usually performed for scour protection measures.
  • Re-assessment: Following the already presented stages, a re-assessment process is frequently carried out with the intention to identify changes in the risk of bridges to scour.
The Design Manual for Roads and Bridges (DMRB) is currently used in the United Kingdom as a standard for motorways and trunk roads [167]. The scour risk assessment procedure consists in two stages: (i) scour inspection and identification of low- and high-risk structures (such an identification relies on more qualitative than quantitative analysis), and (ii) more detailed scour assessment and establishment of a scour risk rating. The return period of the design flood event is 200 years plus 20 percent to allow climate change effects on the structure, while the assessment of bridge scour relies on Melville and Sutherland [64]. In addition, underwater surveys should be performed six times per year. On the other side, the Chilean design manual accepts different levels of risk depending on the “importance” of the bridge. For example, a highway bridge on the Chilean Panamericana may have a failure risk of 22% in 50 years (expected bridge life), and thus the return period is 200 years. Minor bridges are designed with higher failure risk. Table 5 presents an extract of the Chilean design manual, linking the return period with the risk of failure for different structure relevancies.
Assuming that the flood (and thus scour) events are independent and identically distributed (i.i.d.), the risk R of exceeding in n years the scour depth with associated return period TR can be estimated as follows:
R 1 ( 1 1 T R ) n .
In Equation (29), 1/TR also denotes the annual probability of exceedance of the flood (scour depth) with return period TR. As pointed out by Proske [2], the mean annual frequency of failure of bridges is between 10 4 and 10 6 , i.e., much lower than the mean annual frequency of exceedance of the design flood ( ~ 10 2 ). This may be, for example., due to the role played by structural redundancy and capability of withstanding the partial loss of support [168], the refilling scour-hole process under live-bed conditions, and the safety factors generally considered in the design. However, not infrequently it is observed that bridges collapse under floods having very low return periods. In general, the floods that cause failure due to scour are considerably scattered, in a range between 1 and more than 1000 years [9,169,170]; therefore, scour accumulation may have an active role in those failures occurring for floods with low return periods [144].
Figure 8 describes the empirical relationship between the return periods (TR) of flood events producing bridge collapse and the bridge age, resulting from a study performing the historical analysis of bridge collapses in the U.S.A. [144]. The mean and standard deviation values of the bridge age are 52.9 and 24.9 years, respectively; while the mean and standard deviation values of the TR of the flood inducing collapse are 673.9 and 1993.2 years, respectively. It is interesting to observe that it was a good proportion of bridges (~78%) that collapsed under events with return period less than 200 years, which is the TR usually considered for bridge design. These data demonstrate that the return period of the design flood scenario cannot be directly related to the risk of failure due to scour. Moreover, the flood peak is not necessarily the only critical variable for the failure of a bridge, but the flood hydrograph and evolution of scour with time should also be considered in the bridge design. Similar conclusions were drawn in another report on bridge failures due to scour in the UK [9]. Recently, Manfreda et al. [145] derived the theoretically derived probability distribution of scour (TDDS) by coupling hydrological, hydraulic, and erosional models in a closed mathematical form. They highlighted the fact that the scour probability distribution is not just a simple transformation of the probability of floods, but it is influenced by the hydrograph shape, cross-sectional river geometry, sediment properties, and bridge characteristics. Therefore, adopting only one flood return period may lead to neglecting most of the complexity involved in the scour process. The work of Tubaldi et al. [144], on the other hand, highlighted the importance of accounting for scour accumulation under multiple events.

6. Research Needs and Future Directions

This work presents an extra effort to provide an up-to-date, comprehensive, and holistic literature review of the problem of scour at bridge foundations. It covers topics related with (i) the physics of sediment transport, (ii) physical modelling and laboratory experiments, (iii) scour equations encompassing diverse levels of complexity and approaches, (iv) bridge scour monitoring in the field, and (v) current approach for bridge assessment and design against scour. The science behind scour at bridge foundations is nowadays characterized by very different approaches with a wider spectrum of complexity and empiricism. Many open questions are still without an answer and the assessment of bridge scour is still defined by a significant degree of uncertainty. In this context, the state-of-the-art constitutes an opportunity to motivate the scientific community to increase the research efforts on the identified issues, with a special treatment to real bridges.
The complexity behind the scour phenomena is undoubtedly one of the reasons for the lack of consensus among researchers. On the other hand, the limited multi-disciplinary approach that academics and practitioners have taken during the past decades is another possible explication of it. In fact, and due to the complexity presented in scour phenomena, various branches of knowledge should be co-working. Among them, physicians (focusing on the physics of the movement of sediments), electronic engineers (on instrumentation and sensors), hydrologists (on river flow dynamics), hydraulic engineers (on the assessment of hydraulic variables such as flow velocities and flow depths), and structural and geotechnical engineers (on bridge responses to scour) can together give a holistic insight of the research topic in question. It is normally believed that scour at a bridge’s foundations is a research topic explored well. Still, and despite the variables affecting the scour phenomenon are well known, this knowledge is valid under controlled conditions (steady flows, limited duration of scour experiments, uniform sediments, simple pier shapes, small geometric scales). However, real bridges do not meet these assumptions necessarily.
The review of the literature on bridge scour presented in this manuscript suggests multiple avenues for future research. Up to date, research has focused on two different main topics. On the one side, the understanding of the physics behind the scour process (through laboratory experiments and numerical simulations) has attracted the attention of several researchers. Consequently, it is expected that more and more formulae for predicting scour will be developed in the future with a stronger basis on the physics of the scour phenomena. However, practical frameworks, such as those making available simple and ready-to-use equations for predicting scour depth, have been acknowledged as a cornerstone for design and engineering practice in general. In this regard, and considering empirical scour equations, even by applying bridge-scour formulae to “ideal cases” (i.e., constant sediment properties, stationary hydraulic conditions, and simple pier geometries), the obtained scour estimates are considerably scattered [84]. Differences of the order of 200% can be observed in the equilibrium scour depth values obtained with the various available scour models, corresponding to a significant presence of epistemic uncertainty. However, due to the lack of field scour data at extreme flood events, the level of conservatism is effectively undefined at those conditions. In this context, possible reasons for anti-conservatism scour safety standards may be: (i) scale effects from laboratory to nature; (ii) simplification of the channel geometry (typically assumed straight and rectangular); (iii) bed material simplification (constant vs. variable d 50 , cohesionless vs. natural sediments); (iv) oversimplified hydraulic conditions (clear-water conditions, steady flows and/or stepwise hydrographs vs. real flood waves); (v) limited range for scour experiment durations (hours or days vs. bridge-design lifetime); (vi) limited range for controlling scour dimensionless parameters; (vii) limited applicability of scour formulae to pile groups; and (viii) influence of other interacting sources of scour (e.g., channel migration, riverbed gradation, contraction scour) and scour accumulation between successive flood events. In this last regard, one research avenue could be the application of stochastic techniques to simulate the temporal evolution of the river discharge regime [139,171,172,173]. Multiple synthetic hydrographs could be generated in a Monte Carlo approach and used together with already available scour rate formulae (e.g., DFW, BRISENT, or the Scour Rate In COhesive Soil (SRICOS) model) to evaluate the corresponding time-dependent scour depth during the time of interest. Coupling scour and deposition models under hydraulic/hydrological loads simulated by this stochastic approach could give a more realistic estimate of the scour depth during the lifetime of the bridge.
A second research avenue concerns the consideration of structural vulnerability in bridge scour risk assessment. The risk of failure of a bridge due to scour should consider the flood hazard (describing the probability of occurrence of flood events with different intensities) as well as the bridge vulnerability, i.e., the probability of failure P f ( z ) conditional to an event of a given scour level z. Studies on scour vulnerability of bridges are rather scarce (see [168,174,175,176,177,178]), and most of them employ a deterministic approach, resulting in a single value of the critical scour depth corresponding to bridge collapse. However, many uncertainties are affecting the bridge response that must be taken into account, including those inherent to the bridge geometry, material properties, and foundation depth, which are often unknown. From a hydraulic point of view, bridge scour analyses provide only a single value of the scour depth, whereas the scour hole usually has a complex shape [179,180] that should be taken into account in evaluating the structural bridge capacity [168].
A third research avenue is the monitoring of scour at bridge foundations, with the aim of obtaining long time-series. Since the scour process strongly depends on the hydrologic/hydraulic conditions, the whole discharge regime should be considered. The scour-risk management is nowadays affected by many uncertainties because of various limitations of current formulae for scour estimation, the impossibility of describing accurately the complex nature of the scour process, and the structural response against scour. Continuous monitoring programs of bridges susceptible to scour are unavoidable in scour risk management. Long scour time-series will allow a more physically based scour treatment, stochastic scour analyses, validation of time-dependent scour formulae under real scenarios, and the reduction of the uncertainties affecting the problem. Moreover, the data acquired via bridge monitoring will be extremely useful to gain information on climate change effects.

Author Contributions

A.P., S.M. and E.T. equally contributed to all phases of the manuscript. All authors have read and agreed to the published version of the manuscript.

Funding

This research was funded by Water JPI project “An integrative information aqueduct to close the gaps between global satellite observation of water cycle and local sustainable management of water resources (iAqueduct)” and by the COST Action CA16219 “HARMONIOUS—Harmonization of UAS techniques for agricultural and natural ecosystems monitoring”.

Conflicts of Interest

The authors declare no conflicts of interest.

References

  1. Harper, R.F. The Code of Hammurabi, King of Babylon: About 2250 BC: Autographed Text, Transliteration, Translation, Glossary Index of Subjects, Lists of Proper Names, Signs, Numuerals…; The Lawbook Exchange, Ltd.: Clark, NJ, USA, 1999; ISBN 1584770031. [Google Scholar]
  2. Proske, D. Bridge Collapse Frequencies versus Failure Probabilities; Springer: Cham, Switzerland, 2018; ISBN 3319738321. [Google Scholar]
  3. Smith, D.W. Bridge failures. Proc. Inst. Civil Eng. 1976, 60, 367–382. [Google Scholar] [CrossRef]
  4. Kattell, J.; Eriksson, M. Bridge Scour Evaluation: Screening, Analysis, & Countermeasures; U.S. Department of Agriculture: Washington, DC, USA, 1998.
  5. Wardhana, K.; Hadipriono, F.C. Analysis of recent bridge failures in the United States. J. Perform. Constr. Facil. 2003, 17, 144–150. [Google Scholar] [CrossRef] [Green Version]
  6. Briaud, J.-L.; Brandimarte, L.; Wang, J.; D’Odorico, P. Probability of scour depth exceedance owing to hydrologic uncertainty. Georisk 2007, 1, 77–88. [Google Scholar] [CrossRef]
  7. Imam, B.M.; Marios, K. Causes and consequences of metallic bridge failures. Struct. Eng. Int. 2012, 22, 93–98. [Google Scholar] [CrossRef] [Green Version]
  8. Cook, W. Bridge Failure Rates, Consequences, and Predictive Trends; Utah State University: Logan, UT, USA, 2014; ISBN 1321576021. [Google Scholar]
  9. van Leuwen, Z.; Lamb, R. Flood and Scour Related Failure Incidents at Railway Assets between 1846 and 2013; JBA Trust: North Yorkshire, UK, 2014. [Google Scholar]
  10. Flooding after Storm Desmond; Zurich Insurance Group: Zurich, Switzerland; JBA Trust: North Yorkshire, UK, 2015; Available online: http://repo.floodalliance.net/jspui/handle/44111/2252 (accessed on 14 December 2019).
  11. Flooding and Scour Risk; Report No. T554; Safe Management of Railway Structures; Rail Safety and Standards Board: London, UK, 2005.
  12. Schulz, C. Identification of critical transport infrastructures. Clim. Chang. vulnerability challenges Spat. Plan. Civ. Prot. 2007. Available online: https://pdfs.semanticscholar.org/0631/a05746f68addae171a503348fa1249f57ff8.pdf (accessed on 14 December 2019).
  13. Kellermann, P.; Schönberger, C.; Thieken, A.H. Large-scale application of the flood damage model RAilway Infrastructure Loss (RAIL). Nat. Hazards Earth Syst. Sci. 2016, 16, 2357–2371. [Google Scholar] [CrossRef] [Green Version]
  14. Cumbria Floods November 2009: An Impact Assessment; Cumbria Intelligence Observatory: Cumbria, UK, 2010.
  15. Nemry, F.; Demirel, H. Impacts of Climate Change on Transport: A focus on road and rail transport infrastructures. Eur. Comm. Jt. Res. Cent. (JRC), Inst. Prospect. Technol. Stud. 2012. Available online: ftp://s-jrcsvqpx101p.jrc.es/pub/EURdoc/JRC72217.pdf (accessed on 14 December 2019).
  16. Brice, J.C.; Blodgett, J.C. Countermeasures for Hydraulic Problems at Bridges: Analysis and Assessment; Office of Research and Development, Federal Highway Administration: Washington, DC, USA, 1978; Volume 1. [Google Scholar]
  17. Shirole, A.M.; Holt, R.C. Planning for a comprehensive bridge safety assurance program. Transp. Res. Rec. 1991, 1290, 39–50. [Google Scholar]
  18. Macky, G.H. Survey of Roading Expenditure due to Scour; CR 90_09; Department of Scientific and Industrial Research, Hydrology Centre: Christchurch, New Zealand, 1990. [Google Scholar]
  19. Gholami, M.; Sam, A.R.B.M.; Yatim, J.M. Assessment of bridge management system in Iran. Proc. Eng. 2013, 54, 573–583. [Google Scholar] [CrossRef] [Green Version]
  20. Armitage, N.; Cunninghame, M.; Kabir, A.; Abban, B. Local Scour in Rivers; The Extent of the Problem in South Africa; The State of the Art of Numerical Modelling; University of Cape Town: Cape Town, South Africa, 2007. [Google Scholar]
  21. Regmi, M.B.; Hanaoka, S. A survey on impacts of climate change on road transport infrastructure and adaptation strategies in Asia. Environ. Econ. Policy Stud. 2011, 13, 21–41. [Google Scholar] [CrossRef]
  22. Scozzese, F.; Ragni, L.; Tubaldi, E.; Gara, F. Modal properties variation and collapse assessment of masonry arch bridges under scour action. Eng. Struct. 2019, 199, 109665. [Google Scholar] [CrossRef]
  23. Kirby, A.; Roca, M.; Kitchen, A.; Escarameia, M.; Chesterton, O. Manual on Scour at Bridges and Other Hydraulic Structures; CIRIA: London, UK, 2015; ISBN 0860177475. [Google Scholar]
  24. Zanke, U. Zusammenhänge zwischen Strömung und Sedimenttransport, Teil 2: Berechnung des Sedimenttransportes hinter befestigten Sohlenstrecken-Sonderfall zweidimensionaler Kolk; Franzius-Institus der TU Hannover: Hannover, Germany, 1978. [Google Scholar]
  25. Link, O. Untersuchung der Kolkung an einem Schlanken Zylindrischen Pheiler in Sandigem Boden. Ph.D. Thesis, Inst. fr Wasserbau und Wasserwirtschaft, Tech. Univ. Darmstadt, Darmstadt, Germany, 2006. [Google Scholar]
  26. Link, O.; Klischies, K.; Montalva, G.; Dey, S. Effects of bed compaction on scour at piers in sand-clay mixtures. J. Hydraul. Eng. 2013, 139, 1013–1019. [Google Scholar] [CrossRef]
  27. Ansari, S.A.; Kothyari, U.C.; Ranga Raju, K.G. Influence of cohesion on scour around bridge piers. J. Hydraul. Res. 2002, 40, 717–729. [Google Scholar] [CrossRef]
  28. Debnath, K.; Chaudhuri, S. Bridge pier scour in clay-sand mixed sediments at near-threshold velocity for sand. J. Hydraul. Eng. 2010, 136, 597–609. [Google Scholar] [CrossRef]
  29. Shields, A. Anwendung der Aehnlichkeitsmechanik und der Turbulenzforschung auf die Geschiebebewegung. Ph.D. Thesis, Technical University of Berlin, Berlin, Germany, 1936. [Google Scholar]
  30. Bonnefille, R. Essais de synthese des lois de debut d’entrainment des sediment sous l’action d’un courant en regime uniform. Bull. du CREC 1963, 5, 67–72. [Google Scholar]
  31. Yalin, M.S. Mechanics of Sediment Transport; Pergamon Press: Oxford, UK, 1976; ISBN 0080166466. [Google Scholar]
  32. Hjulstrom, F. Studies of the morphological activity of rivers as illustrated by the river fyris, bulletin. Geol. Inst. Upsalsa 1935, 25, 221–527. [Google Scholar]
  33. Yang, Y.; Gao, S.; Wang, Y.P.; Jia, J.; Xiong, J.; Zhou, L. Revisiting the problem of sediment motion threshold. Cont. Shelf Res. 2019, 187, 103960. [Google Scholar] [CrossRef]
  34. Lamb, M.P.; Dietrich, W.E.; Venditti, J.G. Is the critical shields stress for incipient sediment motion dependent on channel-bed slope? J. Geophys. Res. Earth Surf. 2008, 113. [Google Scholar] [CrossRef] [Green Version]
  35. Beheshti, A.A.; Ataie-Ashtiani, B. Analysis of threshold and incipient conditions for sediment movement. Coast. Eng. 2008, 55, 423–430. [Google Scholar] [CrossRef]
  36. Righetti, M.; Lucarelli, C. May the Shields theory be extended to cohesive and adhesive benthic sediments? J. Geophys. Res. Ocean. 2007, 112, C05039. [Google Scholar] [CrossRef] [Green Version]
  37. Bridge, J.S.; Bennett, S.J. A model for the entrainment and transport of sediment grains of mixed sizes, shapes, and densities. Water Resour. Res. 1992, 28, 337–363. [Google Scholar] [CrossRef]
  38. Paphitis, D.; Velegrakis, A.F.; Collins, M.B.; Muirhead, A. Laboratory investigations into the threshold of movement of natural sand-sized sediments under unidirectional, oscillatory and combined flows. Sedimentology 2001, 48, 645–659. [Google Scholar] [CrossRef]
  39. Nasr, A.; Kjellström, E.; Björnsson, I.; Honfi, D.; Ivanov, O.L.; Johansson, J. Bridges in a changing climate: A study of the potential impacts of climate change on bridges and their possible adaptations. Struct. Infrastruct. Eng. 2019, 1–12. [Google Scholar] [CrossRef]
  40. Soulsby, R.L.; Whitehouse, R.J.S. Threshold of sediment motion in coastal environments. In Pacific Coasts and Ports’ 97, Proceedings of the 13th Australasian Coastal and Ocean Engineering Conference and the 6th Australasian Port and Harbour Conference, Christchurch, New Zealand, 7–11 September 1997; Centre for Advanced Engineering, University of Canterbury: Christchurch, New Zealand, 1997; Volume 1, p. 145. [Google Scholar]
  41. Yang, Y.; Wang, Y.P.; Gao, S.; Wang, X.H.; Shi, B.W.; Zhou, L.; Wang, D.D.; Dai, C.; Li, G.C. Sediment resuspension in tidally dominated coastal environments: New insights into the threshold for initial movement. Ocean Dyn. 2016, 66, 401–417. [Google Scholar] [CrossRef]
  42. Winterwerp, J.C.; van Kesteren, W.G.M. Introduction to the Physics of Cohesive Sediment Dynamics in the Marine Environment; Elsevier: Amsterdam, The Netherlands, 2004; ISBN 0444515534. [Google Scholar]
  43. Chen, X.D.; Zhang, C.K.; Paterson, D.M.; Thompson, C.E.L.; Townend, I.H.; Gong, Z.; Zhou, Z.; Feng, Q. Hindered erosion: The biological mediation of noncohesive sediment behavior. Water Resour. Res. 2017, 53, 4787–4801. [Google Scholar] [CrossRef]
  44. Mavis, F.T.; Laushey, L.M. Formula for velocity at beginning of bed-load movement is reappraised. Civ. Eng. 1949, 19, 38–39. [Google Scholar]
  45. Novak, P.; Nalluri, C. Correlation of sediment incipient motion and deposition in pipes and open channels with fixed smooth bed. In Proceedings of the Third International Conference on Hydraulic Transport of Solids in Pipes, Golden, CO, USA, 15–17 May 1974; Volume 4, pp. 46–56. [Google Scholar]
  46. Zanke, U. Neuer Ansatz zur Berechnung des Transportbeginns von Sedimenten unter Strömungseinfluß (In German); Mitt. des Franzius-Institut, Technical Univ.: Hannover, Germany, 1977. [Google Scholar]
  47. Van Rijn, L.C. Principles of Sediment Transport in Rivers, Estuaries and Coastal Seas; Aqua Publications: Amsterdam, The Netherlands, 1993; Volume 1006. [Google Scholar]
  48. Richardson, E.V.; Davis, S.R. Evaluating Scour at Bridges; Hydraulic Engineering Circular (HEC) No. 18; U.S. Department of Transportation: Washington, DC, USA, 2001.
  49. Hager, W.H.; Oliveto, G. Shields’ entrainment criterion in bridge hydraulics. J. Hydraul. Eng. 2002, 128, 538–542. [Google Scholar] [CrossRef]
  50. Raudkivi, A.J. Functional Trends of Scour at Bridge Piers. J. Hydraul. Eng. 1986, 112, 1–13. [Google Scholar] [CrossRef]
  51. Chiew, Y.-M. Mechanics of riprap failure at bridge piers. J. Hydraul. Eng. 1995, 121, 635–643. [Google Scholar] [CrossRef]
  52. Mia, M.F.; Nago, H. Design method of time-dependent local scour at circular bridge pier. J. Hydraul. Eng. 2003, 129, 420–427. [Google Scholar] [CrossRef]
  53. Jones, S.; Sheppard, M. Scour at Wide Bridge Piers. Build. Partnerships 2000, 1–10. [Google Scholar] [CrossRef]
  54. Zanke, U. Kolke am Pfeiler in richtungskonstanter Strömung und unter Welleneinfluß. Mitteilungen des Franzius-Instituts für Wasserbau-und Küsteningenieurwes. der Univ. Hann. 1982, 54, 381–416. [Google Scholar]
  55. Breusers, H.N.C.; Nicollet, G.; Shen, H.W. Local scour around cylindrical piers. J. Hydraul. Res. 1977, 15, 211–252. [Google Scholar] [CrossRef]
  56. May, R.W.P.; Willoughby, I.R. Local Scour around Large Obstructions; Hydraulics Research Limited: Wallingford, UK, 1990. [Google Scholar]
  57. Miller Jr, W.; Sheppard, M.D. Time rate of local scour at a circular pile. In Proceedings of the First International Conference on Scour of Foundations, College Station, TX, USA, 17–20 November 2002. [Google Scholar]
  58. Pizarro, A.; Ettmer, B.; Manfreda, S.; Rojas, A.; Link, O. Dimensionless Effective Flow Work for Estimation of Pier Scour Caused by Flood Waves. J. Hydraul. Eng. 2017, 143, 06017006. [Google Scholar] [CrossRef]
  59. Manes, C.; Brocchini, M. Local scour around structures and the phenomenology of turbulence. J. Fluid Mech. 2015, 779, 309–324. [Google Scholar] [CrossRef]
  60. Ettmer, B.; Orth, F.; Link, O. Live-bed scour at bridge piers in a lightweight polystyrene bed. J. Hydraul. Eng. 2015, 141, 4015017. [Google Scholar] [CrossRef]
  61. Hamill, L. Bridge Hydraulics; CRC Press: Boca Raton, FL, USA, 2014; ISBN 148227163X. [Google Scholar]
  62. Melville, B.W.; Coleman, S.E. Bridge Scour; Water Resources Publication: Highlands Ranch, CO, USA, 2000; ISBN 1887201181. [Google Scholar]
  63. Ettema, R. Scour at Bridge Piers; University of Auckland: Auckland, New Zealand, 1980. [Google Scholar]
  64. Melville, B.W.; Sutherland, A.J. Design method for local scour at bridge piers. J. Hydraul. Eng. 1988, 114, 1210–1226. [Google Scholar] [CrossRef]
  65. Whitehouse, R. Scour at Marine Structures: A Manual for Practical Applications; Thomas Telford Ltd.: London, UK, 1998; ISBN 0727726552. [Google Scholar]
  66. Melville, B.W. Pier and abutment scour: Integrated approach. J. Hydraul. Eng. 1997, 123, 125–136. [Google Scholar] [CrossRef]
  67. Breusers, H.N.C.; Raudkivi, A.J. Scouring, hydraulic structures design manual. IAHR, AA Balkema, Rotterdam 1991, 2. [Google Scholar]
  68. Melville, B.W.; Chiew, Y.-M. Time scale for local scour at bridge piers. J. Hydraul. Eng. 1999, 125, 59–65. [Google Scholar] [CrossRef]
  69. Sheppard, D.M.; Odeh, M.; Glasser, T. Large scale clear-water local pier scour experiments. J. Hydraul. Eng. 2004, 130, 957–963. [Google Scholar] [CrossRef]
  70. Lee, S.O.; Sturm, T.W. Effect of sediment size scaling on physical modeling of bridge pier scour. J. Hydraul. Eng. 2009, 135, 793–802. [Google Scholar] [CrossRef]
  71. Lança, R.; Fael, C.; Cardoso, A. Effect of relative sediment size on clear-water equilibrium scour depth at single cylindrical piers. In Proceedings of the 34th World Congress of the International Association for Hydro-Environment Research and Engineering: 33rd Hydrology and Water Resources Symposium and 10th Conference on Hydraulics in Water Engineering, Brisbane, QLD, Australia, 26 June–1 July 2011; Engineers Australia: Barton, Australia, 2011; p. 3582. [Google Scholar]
  72. Chiew, Y.M. Local Scour at Bridge Piers; Report No. 355; University of Auckland: Auckland, New Zealand, 1984. [Google Scholar]
  73. Williams, P.; Balachandar, R.; Bolisetti, T. Examination of Blockage Effects on the Progression of Local Scour around a Circular Cylinder. Water 2019, 11, 2631. [Google Scholar] [CrossRef] [Green Version]
  74. Hodi, B. Effect of Blockage and Densimetric Froude Number on Circular Bridge Pier Local Scour. Master’s Thesis, University of Windsor, Windsor, ON, Canada, 2009. [Google Scholar]
  75. D’Alessandro, C. Effect of blockage on cylindrical bridge pier local scour. 2013. Available online: https://scholar.uwindsor.ca/etd/4966/ (accessed on 14 December 2019).
  76. Tejada, S. Effects of Blockage and Relative Coarseness on Clear Water Bridge Pier Scour. Master’s Thesis, University of Windsor, Windsor, ON, Canada, 2014. [Google Scholar]
  77. Williams, P.; Bolisetti, T.; Balachandar, R. Evaluation of governing parameters on pier scour geometry. Can. J. Civ. Eng. 2016, 44, 48–58. [Google Scholar] [CrossRef] [Green Version]
  78. Link, O.; Henríquez, S.; Ettmer, B. Physical scale modelling of scour around bridge piers. J. Hydraul. Res. 2019, 57, 227–237. [Google Scholar] [CrossRef]
  79. Bombar, G. Scour Evolution Around Bridge Piers Under Hydrographs with High Unsteadiness. Iran. J. Sci. Technol. Trans. Civ. Eng. 2019, 1–13. Available online: https://link.springer.com/article/10.1007%2Fs40996-019-00321-8 (accessed on 14 December 2019). [CrossRef]
  80. Schendel, A.; Welzel, M.; Hildebrandt, A.; Schlurmann, T.; Hsu, T.-W. Role and Impact of Hydrograph Shape on Tidal Current-Induced Scour in Physical-Modelling Environments. Water 2019, 11, 2636. [Google Scholar] [CrossRef] [Green Version]
  81. Gazi, A.H.; Afzal, M.S.; Dey, S. Scour around Piers under Waves: Current Status of Research and Its Future Prospect. Water 2019, 11, 2212. [Google Scholar] [CrossRef] [Green Version]
  82. Link, O.; Mignot, E.; Roux, S.; Camenen, B.; Escauriaza, C.; Chauchat, J.; Brevis, W.; Manfreda, S. Scour at Bridge Foundations in Supercritical Flows: An Analysis of Knowledge Gaps. Water 2019, 11, 1656. [Google Scholar] [CrossRef] [Green Version]
  83. Sheppard, D.M.; Melville, B. Scour at Wide Piers and Long Skewed Piers; NCHRP Report 682; Transportation Research Board: Washington, DC, USA, 2011. [Google Scholar]
  84. Sheppard, D.M.; Melville, B.; Demir, H. Evaluation of Existing Equations for Local Scour at Bridge Piers. J. Hydraul. Eng. 2014, 140, 14–23. [Google Scholar] [CrossRef]
  85. Gao, D.; Pasada, L.; Nordin, C.F. Pier Scour Equations Used in the Peoples Republic of China; FHWA-SA-93-076; Federal Highway Administration: Washington, DC, USA, 1993. [Google Scholar]
  86. Liang, F.; Wang, C.; Yu, X. Performance of Existing Methods for Estimation and Mitigation of Local Scour around Bridges: Case Studies. J. Perform. Constr. Facil. 2019, 33, 4019060. [Google Scholar] [CrossRef]
  87. Gaudio, R.; Grimaldi, C.; Tafarojnoruz, A.; Calomino, F. Comparison of formulae for the prediction of scour depth at piers. In Proceedings of the 1st IAHR European Division Congress, Edinburgh, UK, 4–6 May 2010. [Google Scholar]
  88. Park, C.-W.; Park, H.I.; Cho, Y.-K. Evaluation of the applicability of pier local scour formulae using laboratory and field data. Mar. Georesour. Geotechnol. 2017, 35, 1–7. [Google Scholar] [CrossRef]
  89. Qi, M.; Li, J.; Chen, Q. Comparison of existing equations for local scour at bridge piers: Parameter influence and validation. Nat. Hazards 2016, 82, 2089–2105. [Google Scholar] [CrossRef]
  90. Wang, C.; Yu, X.; Liang, F. Comparison and estimation of the local scour depth around pile groups and wide piers. In Geotechnical Frontiers 2017; Brandon, T.L., Valentine, R.J., Eds.; ASCE: Reston, VA, USA, 2017; pp. 11–19. [Google Scholar]
  91. Qi, M.; Li, J.; Chen, Q. Applicability Analysis of Pier-Scour Equations in the Field: Error Analysis by Rationalizing Measurement Data. J. Hydraul. Eng. 2018, 144, 4018050. [Google Scholar] [CrossRef]
  92. Pizarro, A.; Tubaldi, E. Quantification of modelling uncertainties in bridge scour risk assessment under multiple flood events. Geosciences 2019, 9, 445. [Google Scholar] [CrossRef] [Green Version]
  93. Froehlich, D.C. Analysis of onsite measurements of scour at piers. In Hydraulic Engineering, Proceedings of the 1988 National Conference on Hydraulic Engineering, Colorado Springs, CO, USA, 8–12 August 1988; ASCE: Reston, VA, USA, 1988; pp. 534–539. [Google Scholar]
  94. Johnson, P.A.; Torrico, E.F. Scour around wide piers in shallow water. Transp. Res. Rec. 1994, 66–70. Available online: https://pennstate.pure.elsevier.com/en/publications/scour-around-wide-piers-in-shallow-water (accessed on 14 December 2019).
  95. Williams, P.; Bolisetti, T.; Balachandar, R. Blockage correction for pier scour experiments. Can. J. Civ. Eng. 2018, 45, 1–5. [Google Scholar] [CrossRef]
  96. Dey, S. Time-Variation of Scour in the Vicinity of Circular Piers. Proc. Inst. Civ. Eng. Water Marit. Energy 1999, 136, 67–75. [Google Scholar] [CrossRef]
  97. Oliveto, G.; Hager, W.H. Temporal evolution of clear-water pier and abutment scour. J. Hydraul. Eng. 2002, 128, 811–820. [Google Scholar] [CrossRef]
  98. Sheppard, D.M.; Miller, W., Jr. Live-bed local pier scour experiments. J. Hydraul. Eng. 2006, 132, 635–642. [Google Scholar] [CrossRef] [Green Version]
  99. Pandey, M.; Sharma, P.K.; Ahmad, Z.; Singh, U.K. Evaluation of existing equations for temporal scour depth around circular bridge piers. Environ. Fluid Mech. 2017, 17, 981–995. [Google Scholar] [CrossRef]
  100. Kothyari, U.C.; Garde, R.C.J.; Ranga Raju, K.G. Temporal variation of scour around circular bridge piers. J. Hydraul. Eng. 1992, 118, 1091–1106. [Google Scholar] [CrossRef]
  101. Oliveto, G.; Hager, W.H. Further results to time-dependent local scour at bridge elements. J. Hydraul. Eng. 2005, 131, 97–105. [Google Scholar] [CrossRef]
  102. López, G.; Teixeira, L.; Ortega-Sánchez, M.; Simarro, G. Estimating final scour depth under clear-water flood waves. J. Hydraul. Eng. 2014, 140, 328–332. [Google Scholar] [CrossRef]
  103. Hager, W.H.; Unger, J. Bridge pier scour under flood waves. J. Hydraul. Eng. 2010, 136, 842–847. [Google Scholar] [CrossRef] [Green Version]
  104. Link, O.; Castillo, C.; Pizarro, A.; Rojas, A.; Ettmer, B.; Escauriaza, C.; Manfreda, S. A model of bridge pier scour during flood waves. J. Hydraul. Res. 2017, 55, 310–323. [Google Scholar] [CrossRef]
  105. Pizarro, A.; Samela, C.; Fiorentino, M.; Link, O.; Manfreda, S. BRISENT: An Entropy-Based Model for Bridge-Pier Scour Estimation under Complex Hydraulic Scenarios. Water 2017, 9, 889. [Google Scholar] [CrossRef] [Green Version]
  106. Link, O.; García, M.; Pizarro, A.; Alcayaga, H.; Palma, S. Local Scour and Sediment Deposition at Bridge Piers during Floods. J. Hydraul. Eng. 2020, 146, 04020003. [Google Scholar] [CrossRef]
  107. Foster, G.R.; Huggins, L.F. Deposition of sediment by overland flow on concave slopes. Soil Eros. Predict. Control 1977, 21, 167–182. [Google Scholar]
  108. Lu, J.-Y.; Hong, J.-H.; Su, C.-C.; Wang, C.-Y.; Lai, J.-S. Field measurements and simulation of bridge scour depth variations during floods. J. Hydraul. Eng. 2008, 134, 810–821. [Google Scholar] [CrossRef] [Green Version]
  109. Dey, S. Fluvial Hydrodynamics; Springer-Verlag: Berlin/Heidelberg, Germany, 2014; ISBN 3642190618. [Google Scholar]
  110. Meyer-Peter, E.; Müller, R. Formulas for bed-load transport. In Vol. A2 of Proc., 2nd IAHR Congress, 1–26; International Association for Hydro-Environment Engineering and Research: Delft, The Netherlands, 1948. [Google Scholar]
  111. Olsen, N.R.B.; Melaaen, M.C. Three-dimensional calculation of scour around cylinders. J. Hydraul. Eng. 1993, 119, 1048–1054. [Google Scholar] [CrossRef]
  112. Olsen, N.R.B.; Kjellesvig, H.M. Three-dimensional numerical flow modeling for estimation of maximum local scour depth. J. Hydraul. Res. 1998, 36, 579–590. [Google Scholar] [CrossRef]
  113. Tseng, M.H.; Yen, C.L.; Song, C.C.S. Computation of three-dimensional flow around square and circular piers. Int. J. Numer. Methods Fluids 2000, 34, 207–227. [Google Scholar] [CrossRef]
  114. Dargahi, B. Controlling mechanism of local scouring. J. Hydraul. Eng. 1990, 116, 1197–1214. [Google Scholar] [CrossRef]
  115. Salaheldin, T.M.; Imran, J.; Chaudhry, M.H. Numerical modeling of three-dimensional flow field around circular piers. J. Hydraul. Eng. 2004, 130, 91–100. [Google Scholar] [CrossRef]
  116. Roulund, A.; Sumer, B.M.; Fredsøe, J.; Michelsen, J. Numerical and experimental investigation of flow and scour around a circular pile. J. Fluid Mech. 2005, 534, 351–401. [Google Scholar] [CrossRef]
  117. Mutlu Sumer, B. Mathematical modelling of scour: A review. J. Hydraul. Res. 2007, 45, 723–735. [Google Scholar] [CrossRef]
  118. Khosronejad, A.; Kang, S.; Sotiropoulos, F. Experimental and computational investigation of local scour around bridge piers. Adv. Water Resour. 2012, 37, 73–85. [Google Scholar] [CrossRef]
  119. Brandimarte, L.; Paron, P.; Di Baldassarre, G. Bridge pier scour: A review of processes, measurements and estimates. Environ. Eng. Manag. J. 2012, 11, 975–989. [Google Scholar] [CrossRef]
  120. Baykal, C.; Sumer, B.M.; Fuhrman, D.R.; Jacobsen, N.G.; Fredsoe, J. Numerical investigation of flow and scour around a vertical circular cylinder. Philos. Trans. R. Soc. A Math. Phys. Eng. Sci. 2015, 373, 20140104. [Google Scholar] [CrossRef] [Green Version]
  121. Baykal, C.; Sumer, B.M.; Fuhrman, D.R.; Jacobsen, N.G.; Fredsøe, J. Numerical simulation of scour and backfilling processes around a circular pile in waves. Coast. Eng. 2017, 122, 87–107. [Google Scholar] [CrossRef] [Green Version]
  122. Cheng, M.Y.; Cao, M.T. Hybrid intelligent inference model for enhancing prediction accuracy of scour depth around bridge piers. Struct. Infrastruct. Eng. 2015, 11, 1178–1189. [Google Scholar] [CrossRef]
  123. Najafzadeh, M.; Barani, G.A.; Azamathulla, H.M. GMDH to predict scour depth around a pier in cohesive soils. Appl. Ocean Res. 2013, 40, 35–41. [Google Scholar] [CrossRef]
  124. Zounemat-Kermani, M.; Beheshti, A.A.; Ataie-Ashtiani, B.; Sabbagh-Yazdi, S.R. Estimation of current-induced scour depth around pile groups using neural network and adaptive neuro-fuzzy inference system. Appl. Soft Comput. J. 2009, 9, 746–755. [Google Scholar] [CrossRef]
  125. Hosseini, R.; Fazloula, R.; Saneie, M.; Amini, A. Bagged neural network for estimating the scour depth around pile groups. Int. J. River Basin Manag. 2018, 16, 401–412. [Google Scholar] [CrossRef]
  126. Jeng, D.S.; Bateni, S.M.; Lockett, E. Neural network assessment for scour depth around bridge piers. Civ. Eng. Res. Rep. R855 2005, 1–89. [Google Scholar]
  127. Lee, T.L.; Jeng, D.S.; Zhang, G.H.; Hong, J.H. Neural network modeling for estimation of scour depth around bridge piers. J. Hydrodyn. 2007, 19, 378–386. [Google Scholar] [CrossRef]
  128. Bateni, S.M.; Jeng, D.S.; Melville, B.W. Bayesian neural networks for prediction of equilibrium and time-dependent scour depth around bridge piers. Adv. Eng. Softw. 2007, 38, 102–111. [Google Scholar] [CrossRef]
  129. Firat, M.; Gungor, M. Generalized Regression Neural Networks and Feed Forward Neural Networks for prediction of scour depth around bridge piers. Adv. Eng. Softw. 2009, 40, 731–737. [Google Scholar] [CrossRef]
  130. Toth, E.; Brandimarte, L. Prediction of local scour depth at bridge piers under clear-water and live-bed conditions: Comparison of literature formulae and artificial neural networks. J. Hydroinform. 2011, 13, 812–824. [Google Scholar] [CrossRef] [Green Version]
  131. Barbe, D.E.; Cruise, J.F.; Singh, V.P. Probabilistic approach to local bridge pier scour. Transp. Res. Rec. 1992. Available online: http://hdl.handle.net/1969.1/164643 (accessed on 25 January 2020).
  132. Johnson, P.A. Reliability-based pier scour engineering. J. Hydraul. Eng. 1992, 118, 1344–1358. [Google Scholar] [CrossRef]
  133. Kwak, K.; Briaud, J.L.; Chen, H.C. SRICOS: Computer program for bridge pier scour. In Proceedings of the International Conference on Soil Mechanics and Geotechnical Engineering, Instanbul, Turkey, 27 August 2001; AA Balkema Publishers: Roterdam, The Netherlands, 2001; Volume 3, pp. 2235–2238. [Google Scholar]
  134. Johnson, P.A.; Hell, T.M. Bridge Scour-A Probabilistic Approach. Infrastructure 1996, 1, 24–30. [Google Scholar]
  135. Johnson, P.A.; Ayyub, B.M. Modeling uncertainty in prediction of pier scour. J. Hydraul. Eng. 1996, 122, 66–72. [Google Scholar] [CrossRef]
  136. Johnson, P.A.; Ayyub, B.M. Assessing time-variant bridge reliability due to pier scour. J. Hydraul. Eng. 1992, 118, 887–903. [Google Scholar] [CrossRef]
  137. Yanmaz, A.M.; Üstün, I. Generalized reliability model for local scour around bridge piers of various shapes. Turkish J. Eng. Environ. Sci. 2001, 25, 687–698. [Google Scholar]
  138. Yanmaz, A.M.; Cicekdag, O. Composite reliability model for local scour around cylindrical bridge piers. Can. J. Civ. Eng. 2001, 28, 520–535. [Google Scholar] [CrossRef]
  139. Brandimarte, L.; Montanari, A.; Briaud, J.-L.; D’Odorico, P. Stochastic flow analysis for predicting river scour of cohesive soils. J. Hydraul. Eng. 2006, 132, 493–500. [Google Scholar] [CrossRef]
  140. Briaud, J.L.; Chen, H.C.; Kwak, K.W.; Han, S.W.; Ting, F.C.K. Multiflood and multilayer method for scour rate prediction at bridge piers. J. Geotech. Geoenviron. Eng. 2001, 127, 114–125. [Google Scholar] [CrossRef]
  141. Briaud, J.L.; Ting, F.C.K.; Chen, H.C.; Cao, Y.; Han, S.W.; Kwak, K.W. Erosion function apparatus for scour rate predictions. J. Geotech. Geoenviron. Eng. 2001, 127, 105–113. [Google Scholar] [CrossRef]
  142. Lagasse, P.F.; Ghosn, M.; Johnson, P.A.; Zevenbergen, L.W.; Clopper, P.E. Risk-Based Approach for Bridge Scour Prediction; Final Report; Ayres Associates: Fort Collins, CO, USA, 2013. [Google Scholar]
  143. Johnson, P.A.; Clopper, P.E.; Zevenbergen, L.W.; Lagasse, P.F. Quantifying uncertainty and reliability in bridge scour estimations. J. Hydraul. Eng. 2015, 141, 4015013. [Google Scholar] [CrossRef]
  144. Tubaldi, E.; Macorini, L.; Izzuddin, B.A.; Manes, C.; Laio, F. A framework for probabilistic assessment of clear-water scour around bridge piers. Struct. Saf. 2017, 69, 11–22. [Google Scholar] [CrossRef] [Green Version]
  145. Manfreda, S.; Link, O.; Pizarro, A. A theoretically derived probability distribution of scour. Water 2018, 10, 1520. [Google Scholar] [CrossRef] [Green Version]
  146. Manfreda, S. On the derivation of flow rating-curves in data-scarce environments. J. Hydrol. 2018, 562, 151–154. [Google Scholar] [CrossRef]
  147. Prendergast, L.J.; Gavin, K. A review of bridge scour monitoring techniques. J. Rock Mech. Geotech. Eng. 2014, 6, 138–149. [Google Scholar] [CrossRef]
  148. Deng, L.; Cai, C.S. Bridge scour: Prediction, modeling, monitoring, and countermeasures. Pract. Period. Struct. Des. Constr. 2009, 15, 125–134. [Google Scholar] [CrossRef] [Green Version]
  149. Wang, C.; Yu, X.; Liang, F. A review of bridge scour: Mechanism, estimation, monitoring and countermeasures. Nat. Hazards 2017, 87, 1881–1906. [Google Scholar] [CrossRef]
  150. Yankielun, N.E.; Zabilansky, L. Laboratory investigation of time-domain reflectometry system for monitoring bridge scour. J. Hydraul. Eng. 1999, 125, 1279–1284. [Google Scholar] [CrossRef]
  151. Su, C.C.; Lu, J.Y. Measurements and prediction of typhoon-induced short-term general scours in intermittent rivers. Nat. Hazards 2013, 66, 671–687. [Google Scholar] [CrossRef]
  152. Chen, G.; Schafer, B.P.; Lin, Z.; Huang, Y.; Suaznabar, O.; Shen, J.; Kerenyi, K. Maximum scour depth based on magnetic field change in smart rocks for foundation stability evaluation of bridges. Struct. Heal. Monit. 2015, 14, 86–99. [Google Scholar] [CrossRef]
  153. Tang, F.; Chen, Y.; Guo, C.; Fan, L.; Chen, G.; Tang, Y. Field Application of Magnet-Based Smart Rock for Bridge Scour Monitoring. J. Bridg. Eng. 2019, 24, 4019015. [Google Scholar] [CrossRef]
  154. Briaud, J.-L.; Hurlebaus, S.; Chang, K.-A.; Yao, C.; Sharma, H.; Yu, O.-Y.; Darby, C.; Hunt, B.E.; Price, G.R. Realtime Monitoring of Bridge Scour Using Remote Monitoring Technology; Texas Transportation Institute: College Station, TX, USA; Texas A&M University System: College Station, TX, USA, 2011. [Google Scholar]
  155. Sohn, H.; Farrar, C.R.; Hemez, F.M.; Shunk, D.D.; Stinemates, D.W.; Nadler, B.R.; Czarnecki, J.J. A Review of Structural Health Monitoring Literature: 1996–2001; Los Alamos National Labaratory: Los Alamos, NM, USA, 2003; pp. 1–331. [Google Scholar]
  156. Lin, Y.-B.; Chen, J.-C.; Chang, K.-C.; Chern, J.-C.; Lai, J.-S. Real-time monitoring of local scour by using fiber Bragg grating sensors. Smart Mater. Struct. 2005, 14, 664. [Google Scholar] [CrossRef]
  157. Yu, X.; Asheesh, P.; Zhang, N.; Thapa, B.; Tjuatja, S. Thermo-TDR probe for measurement of soil moisture, density, and thermal properties. In Geo-CONGRESS 2014: Geo-Characterization and Modeling for Sustainability, Proceedings of the Geo-CONGRESS 2014, Atlanta, GA, USA, 23–26 February 2014; ASCE: Reston, VA, USA, 2014; pp. 2804–2813. [Google Scholar]
  158. Lo, K.-F.; Ni, S.-H.; Huang, Y.-H.; Zhou, X.M. Measurement of unknown bridge foundation depth by parallel seismic method. Exp. Tech. 2009, 33, 23–27. [Google Scholar] [CrossRef]
  159. Liang, F.; Li, Y.; Chen, H. Influence of scour depth on vertically cyclic behaviors of single pile with model tests. J. Tongji Univ. 2014, 42, 1511–1515. (in Chinese). [Google Scholar]
  160. Su, C.-C.; Lu, J.-Y. Comparison of Sediment Load and Riverbed Scour during Floods for Gravel-Bed and Sand-Bed Reaches of Intermittent Rivers: Case Study. J. Hydraul. Eng. 2016, 142, 5016001. [Google Scholar] [CrossRef]
  161. Hong, J.-H.; Guo, W.-D.; Chiew, Y.-M.; Chen, C.-H. A new practical method to simulate flood-induced bridge pier scour—A case study of Mingchu bridge piers on the Cho-Shui River. Water 2016, 8, 238. [Google Scholar] [CrossRef]
  162. Sturm, T.; Sotiropoulos, F.; Landers, M.; Gotvald, T.; Lee, S.; Ge, L.; Navarro, R.; Escauriaza, C. Laboratory and 3D Numerical Modeling with Field Monitoring of Regional Bridge Scour in Georgia; Final Report; Georgia Department of Transportation: Atlanta, GA, USA, 2004. [Google Scholar]
  163. Crotti, G.; Cigada, A. Scour at river bridge piers: Real-time vulnerability assessment through the continuous monitoring of a bridge over the river Po, Italy. J. Civ. Struct. Heal. Monit. 2019, 9, 1–16. [Google Scholar] [CrossRef]
  164. Maroni, A.; Tubaldi, E.; Douglas, J.; Ferguson, N.; Zonta, D.; McDonald, H.; Walker, D.; Greenoak, E.; Green, C. Using Bayesian networks for the assessment of underwater scour for road and railway bridges. In Proceedings of the Structural Faults and Repair 2018 and European Bridge Conference 2018, Edinburgh, UK, 15–17 May 2018. [Google Scholar]
  165. Arneson, L.A.; Zevenbergen, L.W.; Lagasse, P.F.; Clopper, P.E. Evaluating Scour at Bridges, 5th ed.; Hydraulic Engineering Circular No. 18, Publication No. FHWA-HIF-12-003; U.S. Department of Transportation: Washington, DC, USA, 2012.
  166. Chilean MOP (Chilean Ministry of Public Works). Highways Design Manual; Santiago de Chile: Santiage, Chile, 2000. (in Spanish) [Google Scholar]
  167. The assessment of scour and other hydraulic actions at highway structures. In Design Manual for Roads and Bridges, Vol. 3–Highway Structures: Inspection &Maintenance; Highways Agency: London, UK, 2012.
  168. Tubaldi, E.; Macorini, L.; Izzuddin, B.A. Three-dimensional mesoscale modelling of multi-span masonry arch bridges subjected to scour. Eng. Struct. 2018, 165, 486–500. [Google Scholar] [CrossRef] [Green Version]
  169. Flint, M.M.; Fringer, O.; Billington, S.L.; Freyberg, D.; Diffenbaugh, N.S. Historical Analysis of Hydraulic Bridge Collapses in the Continental United States. J. Infrastruct. Syst. 2017, 23, 4017005. [Google Scholar] [CrossRef] [Green Version]
  170. Ashraf, F.U.; Flint, M.M. Analysis of Peak Flow Distribution for Bridge Collapse Sites. Water 2020, 12, 52. [Google Scholar] [CrossRef] [Green Version]
  171. Dimitriadis, P.; Koutsoyiannis, D.; Papanicolaou, P. Stochastic similarities between the microscale of turbulence and hydro-meteorological processes. Hydrol. Sci. J. 2016, 61, 1623–1640. [Google Scholar] [CrossRef] [Green Version]
  172. Dimitriadis, P.; Koutsoyiannis, D. Climacogram versus autocovariance and power spectrum in stochastic modelling for Markovian and Hurst–Kolmogorov processes. Stoch. Environ. Res. Risk Assess. 2015, 29, 1649–1669. [Google Scholar] [CrossRef]
  173. Dimitriadis, P.; Koutsoyiannis, D. Stochastic synthesis approximating any process dependence and distribution. Stoch. Environ. Res. Risk Assess. 2018, 32(6), 1493–1515. [Google Scholar] [CrossRef]
  174. Barbetta, S.; Camici, S.; Moramarco, T. A reappraisal of bridge piers scour vulnerability: A case study in the Upper Tiber River basin (central Italy). J. Flood Risk Manag. 2017, 10, 283–300. [Google Scholar] [CrossRef]
  175. Federico, F.; Silvagni, G.; Volpi, F. Scour Vulnerability of River Bridge Piers. J. Geotech. Geoenviron. Eng. 2003, 129, 890–899. [Google Scholar] [CrossRef]
  176. Lamb, R.; Aspinall, W.; Odbert, H.; Wagener, T. Vulnerability of bridges to scour: Insights from an international expert elicitation workshop. Nat. Hazards Earth Syst. Sci. 2017, 17, 1393. [Google Scholar] [CrossRef] [Green Version]
  177. Richardson, E.V.; Huber, F.W. Evaluation of bridge vulnerability to hydraulic forces, stream instability, and scour. In Transportation Research Record 1290, TRB; National Research Council: Washington, DC, USA, 1991; pp. 25–38. [Google Scholar]
  178. Tanasić, N.; Hajdin, R. Management of bridges with shallow foundations exposed to local scour. Struct. Infrastruct. Eng. 2018, 14, 468–476. [Google Scholar] [CrossRef]
  179. Link, O.; Pfleger, F.; Zanke, U. Characteristics of developing scour-holes at a sand-embedded cylinder. Int. J. Sediment Res. 2008, 23, 258–266. [Google Scholar] [CrossRef]
  180. Pagliara, S.; Carnacina, I. Temporal scour evolution at bridge piers: Effect of wood debris roughness and porosity. J. Hydraul. Res. 2010, 48, 3–13. [Google Scholar] [CrossRef]
Figure 1. (A) Rubbianello Bridge, Rubbianello, Italy; (B) Copley Bridge, Halifax, U.K. (courtesy of Calderdale Metropolitan Borough Council).
Water 12 00374 g001
Figure 2. Sketch of the different types of scour, including natural, contraction, and local scour caused by bridge piers.
Water 12 00374 g002
Figure 3. Illustration of the sediment transport modes.
Water 12 00374 g003
Figure 4. Application of the first five equilibrium scour formula listed in Table 2. (A) Visual comparison considering a chronological development. (B) Boxplot of the equilibrium scour depths. Adapted from Pizarro and Tubaldi [92].
Water 12 00374 g004
Figure 5. Results from the use of bridge-pier scour entropic (BRISENT) model coupled with the Markovian framework. (A) Probability Mass Function (PMF) of the scour depth z in function of the considered bridge lifetime (T from 5 to 100 years). (B) Probability of exceedance of z (P(Z > z)) in function of the considered time. Adapted from Pizarro and Tubaldi [92].
Water 12 00374 g005
Figure 6. Sketch showing monitoring instruments for bridge scour measurements.
Water 12 00374 g006
Figure 7. Continuous scour-depth monitoring and performance of models. Field data published by Link et al. [106].
Water 12 00374 g007
Figure 8. Return period of the flood event producing a bridge collapse and the bridge age. Red line corresponds with TR = 200 years that usually is considered for bridge design, while the dashed black line represents a perfect agreement. Data published by Flint et al. [169].
Water 12 00374 g008
Table 1. Prediction formulae to compute the critical velocity uc.
AuthorsMathematical ExpressionObservationsEquation N°
Mavis and Laushey [44] u c = 0.5 ρ 1 2 d 50 4 9 d50 in mm
u c in feet/s
ρ is dimensionless
(7)
Novak [45] u c = 1.6 ( ρ g d 50 ) 1 / 2 g and d50 are in the international system of units (SI)(8)
Zanke [46] u c = { 2.8 ( ρ g d 50 ) 1 / 2 + 14.7 υ d 50 c } tanh ( 3.09 × 10 4 H * ) + 2.5 3.5 H * = ( g υ 2 ) 1 3 ( h 1 )
Variables according to the SI.
It accounts for the viscosity and cohesion effects as well as for the influence of the flow depth h.
(9)
Van Rijn [47] u c = 8.5 d 50 0.6 log ( 12 h 3 d 90 ) Valid for sand particles with a grain size between 0.05 and 2 mm and with a d 90 = 2 d 50 (10)
Richardson and Davis [48] u c = 6.19 h 1 6 d 50 1 3 Sediments with density of ρ s = 2650   kg / m 3 (11)
Hager and Oliveto [49] u c = 2.33 D * 1 4 ( R d 50 ) 1 6 ( ρ g d 50 ) 1 / 2     f o r     D * 10 R = hydraulic radius.
D* = dimensionless sedimentological grain size
(12)
u c = 1.08 D * 1 12 ( R d 50 ) 1 6 ( ρ g d 50 ) 1 / 2     f o r     10 < D * 150 (13)
u c = 1.65 ( R d 50 ) 1 6 ( ρ g d 50 ) 1 / 2     f o r     D * > 150 (14)
Table 2. Equilibrium-scour prediction formulae to compute scour depth.
AuthorsMathematical ExpressionObservationsEquation N°
Froehlich [93] z D = 0.32 K s F r 0.2 ( D p D ) 0.62 ( h D ) 0.46 ( D d 50 ) 0.08 + 1 D p = projected width of pier.
h = flow depth.
F r = Froude number.
K S = factor for pier shape.
(17)
Melville [66] z = K h K I K d 50 K S K θ K h = { 2.4 D for   D h < 0.7 2 ( h D ) 0.5 for   0.7 < D h < 5 4.5 h for   D h > 5
K I = { ( u I ( u I p u c ) ) u c for   ( u I ( u I p u c ) ) u c < 1.0 1 for   ( u I ( u I p u c ) ) u c 1.0
K d 50 = { 0.57 log 10 ( 2.24 D d 50 ) for   D d 50 25 1 for   D d 50 > 25
K θ = factor for the angle of attack.
(18)
Sheppard et al. [84] z D = 2.5 f 1 f 2 f 3
for   0.4 u u c 1.0
f 1 = tanh ( ( h / D ) 0.4 )
f 2 = { 1 1.2 [ ln ( u / u c ) ] 2 }
f 3 = [ ( D / d 50 ) 0.4 ( D / d 50 ) 1.2 + 10.6 ( D / d 50 ) 0.13 ]
(19)
Richardson and Davis [48] z D = 2 K s K θ K 3 K 4 K w ( h D ) 0.35 F r 0.43 K 3 = factor for the mode of sediment transport.
K 4 = factor for armoring by bed material.
K w = factor for very wide piers after Johnson and Torrico [94]. z m a x = 2.4 D   f o r   F r 0.8 z m a x = 3 D   f o r   F r > 0.8
(20)
Gao et al. [85] z = 0.46 K ς D 0.60 h 0.15 d 50 0.07 ( u I u c u c u c ) η u c = incipient velocity for local scour at a pier.
u c = 0.645 ( d 50 D ) 0.053 u c
u c = ( h d 50 ) 0.14 [ 17.6 ( ρ s ρ ρ ) d + 6.05 x 10 7 ( 10 + h d 0.72 ) ] 0.5
K ς = shape and alignment factor.
η = { 1 for   clear-water   scour ( u c u ) 9.35 + 2.23 log 10 d for   live-bed   scour
(21)
Williams et al. [77] z D = 1.01 F d s 0.284 ( h D ) 0.325 ( D d 50 ) 0.059 F d s is the densimetric Froude number based on separation velocity ( F d s = u s g d 50 ( ρ 1 ) )(22)
Williams et al. [95] z D = 0.76 k c 1.69 ( h D ) 0.32 k c is the ratio of velocity along streamline at point of separation on pier to critical velocity of sediment(23)
Table 3. Selected time-dependent scour prediction formulae.
AuthorsMathematical ExpressionObservationsEquation N°
Melville and Chiew [68] z z e q = exp { 0.03 | u c u ln ( t t e q ) | 1.6 } Subscript “eq” means equilibrium.
t e q = { 48.26 D u ( u u c 0.4 ) for   h D > 6 ,   1.0 > u u c > 0.4 30.89 D u ( u u c 0.4 ) ( h D ) 0.25 for   h D 6 ,   1.0 > u u c > 0.4
(24)
Hager and Unger [103] Z M ( T M ) = [ Q M ( T M ) ] 0.80 n log ( γ T M ) Subscript “M” means at maximum or peak conditions.
Z M = z / z M
Q M = q / q M
T M = t / t M
(25)
Pizarro et al. [105] z z R = 1 λ ln { 1 + W * W m a x * [ exp ( S ) 1 ] } z R = D 2 2 d 50
λ = 4.237 ( D d 50 ) 0.957
S = 21.185 ( D / d 50 ) 0.957 0.4 ( D / d 50 ) 1.2 + 10.6 ( D / d 50 ) 0.13
W m a x * = exp [ 21.84 ( ln D d 50 ) 0.295 ]
(26)
Link et al. [104] z z R = c 1 ( 1 e c 2 W * c 3 ) c 1 ,   c 2 ,   and   c 3 are model parameters(27)
Link et al. [106] D e p { 0 , ξ g s * t Δ t g s * t α ρ s ( 1 p ) ξ g s * t Δ t g s * t z t Δ t , ξ g s * t Δ t > g s t D e p is the sediment deposition over a time interval Δ t .
g s * t is the sediment transport capacity.
p is the soil porosity.
ρ s is the sediment density.
α   and   ξ are model parameters.
(28)
Table 4. Advantages and disadvantages of sensors for field scour monitoring. Adapted from Wang et al. [149].
Instrument/SensorEasy to Install and OperateCan Be Used during Floods?Continuous Monitoring?Able to Measure Refilling Process?Affected by Traffic or Other Hydraulic Factors?Expensive? *
Magnetic sliding collarYESYESNONONOII
Float-out deviceYESYESNONONOI
Smart rockYESYESYESNONOI
SonarYESYESYESYESNOII
Fiber Brag grating sensorNOYESYESYESNOIII
TDRYESYESYESYESNOII
Tilt sensor and modal parameterYESYESYESYESYESI
* Sensors are catalogued in three classes: “I” corresponds to the less expensive alternative, while “III” to the most expensive one.
Table 5. Return period and risk failure for bridges and viaducts. Extract of the Chilean design manual, Table 3. 1002.302.A, [166].
Type of StructureType of RouteReturn Period (Years)Expected Structure Life (Years)Risk of Failure (%)
DesignVerificationDesignVerification
Bridges and ViaductsHighways200300502215
Roads100150504028

