Spatiotemporal Variation in Relative Humidity in Guangdong, China, from 1959 to 2017


1
Research Center for Ecological Civilization Construction and Sustainable Development in Xijiang & Beijiang River Basin of Guangdong Province, Foshan University, Foshan 528000, China
2
Department of Geography and Environment Science, University of Reading, Reading RG6 6AB, UK
*
Author to whom correspondence should be addressed.
Water 2020, 12(12), 3576; https://doi.org/10.3390/w12123576
Submission received: 16 September 2020
/
Revised: 15 December 2020
/
Accepted: 15 December 2020
/
Published: 20 December 2020
(This article belongs to the Special Issue The Impact of Climate Change and Human Activities on Aquatic Environments)
Abstract
:Despite the marked influence of relative humidity (RH) on ecosystems and human society, the spatiotemporal pattern of RH is far from clearly understood. This study analyzed the spatiotemporal variation in RH in Guangdong Province, South China, in the period of 1959–2017. The RH data were collected from 74 national standard meteorological stations. The spatiotemporal variation in RH was evaluated using rotate empirical orthogonal function (REOF) zoning, Mann–Kendall test, and wavelet transform methods. Based on the REOF decomposition situation of monthly RH field, Guangdong was divided into six subareas. The annual mean of RH in the whole province was 78.90%. In terms of spatial variation, overall annual mean RH decreased from southwest to northeast in the province. Temporally, annual mean RH showed a declining trend in the last six decades. Particularly, the RH in the Pearl River Delta area declined at the rate of 1.349%/10a. Mann–Kendall tests showed that mutation points of annual mean RH mostly appeared in the 1990s, especially in the early 1990s. Continuous wavelet transforms of annual mean RH displayed that inland subareas have similar cycle characteristics, and the east coast and Pearl River Delta have no significant period in most time domains. The results provide new understanding of RH variation in the last six decades in South China, which is valuable for detecting climate change, monitoring hazardous weather, and predicting future environmental change.
1. Introduction
As an important component of global water cycle, water vapor in the lower troposphere is the main source of atmospheric precipitation. In addition, water vapor is one of greenhouse gases in the atmosphere, and it accounts for approximately 50% of atmospheric greenhouse effect [1]. The prediction of multiple climate models suggests that the content of water vapor in the atmosphere will increase due to global warming, and the increased water vapor will exacerbate global warming because of the enhanced greenhouse effect, thereby forming the enhanced vicious feedback. Moreover, it is considered the main reason for the increase of precipitation in the middle and high latitudes in the world [2,3].
Specific humidity and relative humidity (RH) are widely used to reflect the content of water vapor in the atmosphere. RH is the ratio of the actual amount of water vapor in the atmosphere to the amount of water vapor that the air can maintain at a certain temperature [4]. RH can directly affect the growth of plants and the comfort level of humans [5,6,7]. In addition, RH is more suitable for analyzing the feedback of climate change [8,9]. RH is one of main factors affecting atmospheric particle concentration and aerosol radiation characteristics, further affecting air quality and visibility [10,11,12,13,14]. Some studies show that the research on RH change is helpful to understand the formation of fog, haze, and the generation of Particulate Matter 2.5 (PM2.5) [15,16,17]. It has also been found that RH in some rapid urbanization areas has declined significantly [18,19,20,21]. Some scholars think that the outbreak and spread of some diseases, for example, COVID-19 [22,23], influenza [24,25], hand-foot-mouth disease [26,27], dengue [28], potato blight [29], and senile disease [30], are closely related to RH [31].
Globally, studies indicate that RH has generally decreased in the United States [32], Canada [33], Poland [34], Spain [35], Switzerland [36], Northern Ireland [29], Nigeria [37], Taiwan of China [38], and other countries or regions in recent decades. In the fifth assessment report of the Intergovernmental Panel on Climate Change (IPCC), the reanalysis data in last 15 years indicate a declining trend of RH in the middle and low latitudes [39]. In the meantime, some observation data of RH show a rising trend in Bulgaria [40] and Iran [41].
The research on RH in China showed a declining trend in many areas, but there was spatiotemporal variation [42]. For example, RH showed a declining trend after 2000–2001 in most areas of northwest China, the Qinghai-Tibet Plateau, and southwest China, but a rising trend before 2000–2001. The change velocities are also different. The declining velocity of RH after 2000–2001 was obviously larger than the rising velocity before 2000–2001 [43,44,45]. Similarly, RH generally showed a declining trend in northeast China [46], north China [44] and the Yangtze River Delta [47] in recent decades.
Comparatively, the spatiotemporal variation in RH in South China in the last decades is far from clearly understood. Guangdong is a province in South China (Figure 1), with a large population and rapid economy development, and also dramatic environmental change, particularly since the Reform and Opening Up policy in late 1970s [48,49]. There are some studies on temperature [50], precipitation [51], drought and flood [52], and evaporation [53] in Guangdong, but little is known about RH in the region, especially the long-term trend of RH. Meanwhile, with the improvement of living standards, people are more sensitive to the comfort level of life [54]. To fill the knowledge gap, this research studied the spatiotemporal variation in RH in Guangdong in the last six decades, based on the results of rotate empirical orthogonal function (REOF) zoning, Mann–Kendall test, and wavelet transform methods. The main aims of the research are to (1) estimate the spatiotemporal variations in RH in Guangdong Province during the research period; (2) determine the mutation points of yearly RH in the different subareas; and (3) analyze the cycle characteristics of RH in the region. The results are helpful to expand the understanding of the water cycle and climate change and to improve the management of water resources.
In addition, this study attempts to explore the following questions: Is there significant spatial difference in RH between the areas with different economic development levels (the developed Pearl River Delta and the less developed the rest of Guangdong province)? Is there significant spatial difference in RH between different geographical areas (the southern coastal area and the northern and northwestern inland areas)? Has the RH in Guangdong province been influenced by the Reform and Opening Up policy?
2. Data Source and Analysis
2.1. Study Area
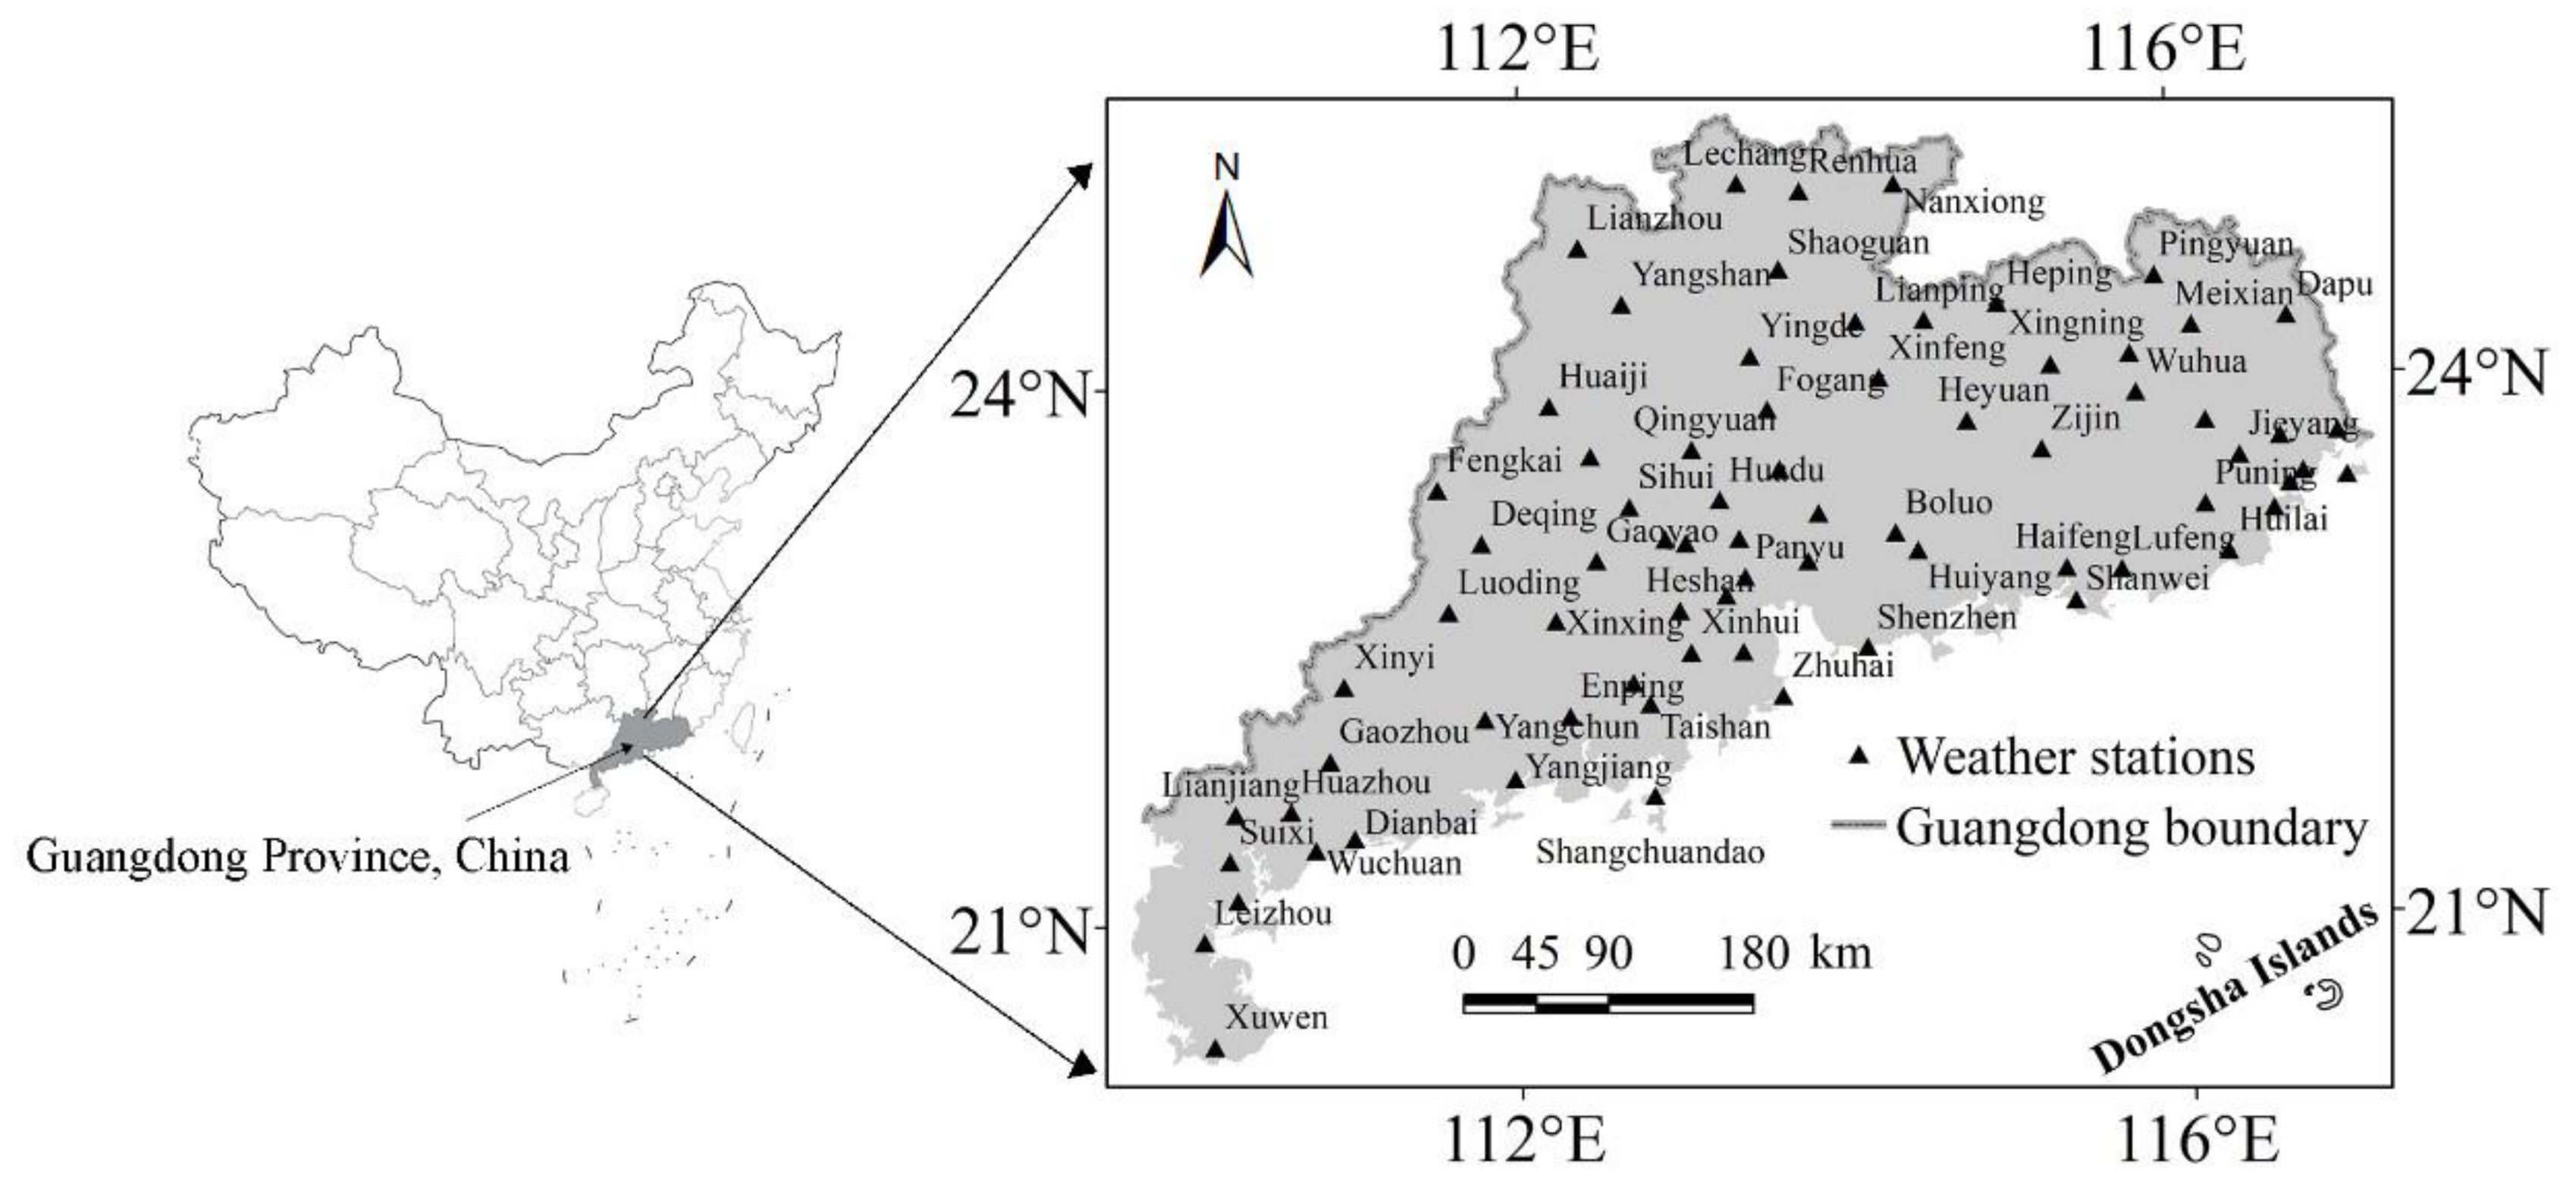
Guangdong Province is located in the southernmost part of mainland China (20°13′ N∼25°31′ N, 109°39′ E∼117°19′ E) (Figure 1), with a total land area of 179,800 km2. Terrain in Guangdong is high in the north and low in the south. The north, northeast, and west are mainly mountainous areas, while the central and southern coastal areas are mostly low hills, platforms, and plains. Dongjiang River, Xijiang River, and Beijiang River converge to form the Pearl River in southcentral Guangdong, and the Pearl River Delta plain is formed in the area. Notably, the Pearl River Delta plain is one of the most developed areas in China. In addition, Hanjiang River is the main river in the southeast Guangdong.
Guangdong Province is in the monsoon climate zone, with central subtropical, south subtropical, and tropical climates from north to south. It is one of the regions with the most abundant light, heat, and water resources in China. With a permanent population of about 115.21 million by the end of 2019, it is by far one of the most populous provinces in China. Since 1989, Guangdong has ranked first in GDP of all Chinese provinces, accounting for about 1/8th of the country’s total economic output in 2019.
2.2. Data
This study analyzed monthly mean data of RH from 86 national standard meteorological stations in Guangdong, which were coordinated by the National Climate Center (NCC) of the China Meteorological Administration (CMA). All data were screened before analysis. According to the principle of consistent length and relatively uniform distribution, data from 74 stations in the period January 1959–December 2017 were selected for this research. Despite some missing observation data in six stations, they were less than 0.3% of total data in each station. The missing data were replaced by the averages of neighboring months and this gap filling method had little influence on the result [55]. The data were checked with strict quality control and three aspects inspection (reliability, consistency, and representativeness), and all showed good integrity.
2.3. Data Processing Method
2.3.1. Rotate Empirical Orthogonal Function (REOF) Decomposition
Considering the spatial variation in RH, the rotate empirical orthogonal function (REOF) decomposition method [56] was applied to divide Guangdong into different subareas. REOF can decompose the feature field and make the maximum variance rotation based on the empirical orthogonal function (EOF) [57]. In the spatial fields created by the REOF decomposition method, high load values are often concentrated in a small area, and the division of spatial structure is clearer than the EOF method [58].
2.3.2. The Linear Trend Estimation
The linear trend estimation [59] was applied to evaluate the spatiotemporal variation in RH of Guangdong from 1959 to 2017. Linear tendency estimation can be conducted as follows:
where yi is RH, ti is the corresponding time, and i is RH sequence. Coefficients a and b are estimated by the least square method. Regression coefficient b can reflect the change trend of RH. b > 0 indicates an increasing trend, while b < 0 suggests a decreasing trend.
yi = a + b × ti
2.3.3. The Mann–Kendall Trend Test
The Mann–Kendall method proposed by Mann and Kendall [60] is a non-parametric statistical test method based on rank. The Mann–Kendall method does not require the sample to follow a certain distribution and is not interfered with by a few outliers. It is also one of the effective methods of time series trend analysis, showing good performance to reveal overall trends of time series evolution and abrupt changes [61,62]. At present, it has been widely used in the analysis of the time series of hydrological and meteorological elements, and recommended by the World Meteorological Organization (WMO) [63].
Inspection Statistics
Inspection statistics (S) is defined by the non-parametric Mann–Kendall trend test as follows:
where i ≠ j, and i, j ≤ n. Sign ( ) is a Sign function. When Di − Dj is <, =, or > 0, Sign (Di − Dj) is −1, 0, or 1, respectively. For the long time series (n > 10), the statistic Z is calculated as follows:
when Z > 0, the time series shows an increasing trend. When Z < 0, the time series represents a decreasing trend. When |Z| ≥ 1.28, 1.64, or 2.32, it means that the discriminant results have passed the significance test with the reliability of 90%, 95%, or 99%, respectively [61,62].
Detection of Mann–Kendall Mutation
Time series D2, D3, …, and Dn construct an orderly column ri; ri represents the sample accumulation number of Di > Dj (1 ≤ j ≤ i). The rank series (Sk) is calculated as follows:
where when Di > Dj, ri = 1; when Di ≤ Dj, ri = 0 (j = 1, 2, …, i). The expected value E(Sk) of Sk and its sequence variance Var(Sk) are defined as follows:
The data sequence is considered independent, and the test statistics (UFk) are calculated as follows:
UFk obeys the standard normal distribution and gives a significance level α. The critical value Uα can be obtained by looking up the standard normal distribution table. For example, when α is 0.05, its critical value Uα = ±1.96; when | UFk | > | Uα |, the time series has a significant increase or decrease trend. The UFk points over the study period are plotted as a curve to determine whether they have an increasing or decreasing trend. The reverse sequence calculation of the above steps was conducted. The result was multiplied by −1 to obtain the new time series UBk. UFk and UBk sequence diagrams were drawn. When UFk > 0, the sequence is an increasing trend; when UFk < 0, the sequence is a decreasing trend. When UFk exceeds the critical value, the increasing or decreasing trend reaches the significant level. When the UFk and UBk two curves intersect, the intersection point is the beginning of mutation [61,62].
This study found that the autocorrelation of the time series of hydrological and meteorological elements had an impact on the M–K test results. Therefore, the autocorrelation of the relative humidity time series was tested before the M–K test, and the influence of significant correlation was eliminated by the means of variance correction [64,65].
2.3.4. Continuous Wavelet Transform (CWT)
Continuous wavelet transform (CWT) [66] was adopted to analyze the multi-scale periodic characteristics of each RH series. Morlet wavelet was selected as the basic wavelet, and was calculated as follows:
where is a constant. When is ≥ 5, Morlet wavelet satisfies the permissibility condition. t is the time variable.
Continuous wavelet transform (CWT) was developed based on Fourier transform [66]. It adopted variable size and movable change window for spectrum analysis, which can obtain time-frequency coupling characteristics of data series, and became an effective tool for analyzing time series [67,68]. To eliminate the effect of internal circulation, low-pass filtering [69] was applied to filter out the variability less than two years before wavelet transform of each RH time series.
2.3.5. Kriging Interpolation
Kriging interpolation was applied for the interpolation of the spatial distribution of RH. Kriging interpolation, based on regional variables and centered on variogram, can make full use of the spatial location information of sample points [70]. In recent years, the Kriging interpolation method has been widely applied in hydrology and meteorology [71].
All the data analyses were conducted using Matlab 2014a (MathWorks, Natick, MA, USA) and maps were created using ArcGIS 10.2 (ESRI Inc., Redlands, CA, USA).
3. Results
3.1. REOF Zoning
Monthly RH field was decomposed by the REOF method, the first 6 eigenvectors were taken for rotation, and cumulative contribution of explanatory variance reached 95.2% (Table 1). The first 6 spatial types can reflect spatial distribution characteristics of RH in Guangdong. Spatial distribution of load value of each rotation factor was shown in Figure 1. According to the spatial distribution of high load value of each rotation factor, Guangdong was divided into 6 subareas: (1) the western coastal subarea (Figure 2a), mainly including Leizhou Peninsula and the west coast (Wuchuan, Gaozhou, Yangjiang, and Shangchuan Island); (2) the Pearl River Delta subarea (Figure 2b), including Guangzhou, Shenzhen, Zhuhai, Zhongshan, and Taishan; (3) the eastern coastal subarea (Figure 2c), including Chaozhou, Jieyang, Shantou, Shanwei, and Nan’ao Island; (4) the western inland subarea (Figure 2d), including Huaiji, Deqing, Xinxing, and Xinyi; (5) the eastern inland subarea (Figure 2e), including Meixian, Heyuan, and Longchuan; and (6) the northern inland subarea (Figure 2f), including Shaoguan, Lianzhou, and Qingyuan.
3.2. Annual Mean RH and Variation Trend in Each Subarea
Annual mean RH in the whole province was 78.90% (Table 2). There are some spatial variations between subareas. Annual mean RHs in the western inland and western coastal subarea were all more than 80%, followed by the eastern coastal subarea (78.81%), while annual mean RHs in other subareas were between 77.5% and 78.0%.
Annual mean RH in all subareas showed a declining trend. Mean linear trend (decline rate) in the whole province was −0.678%/10a. The largest decline rate (−1.349%/10a) was in the Pearl River Delta subarea, followed by the eastern coastal subarea (−0.868%/10a), and decline rates in other subareas were between −0.20%/10a and −0.50%/10a. The Mann–Kendall test indicated the declining trend in all subareas passed the 95% level of significance (MK < −1.96, Table 2), with the exception of the western coastal subarea.
3.3. Monthly Mean RH and Variation Trend in Each Subarea
Monthly mean RH variation was similar in the eastern inland, western inland, northern inland and the Pearl River Delta subareas (Figure 3a). There were two RH peaks in one year, the first one (also the maximum) in June and the second one in August.
Monthly mean RH gradually increased from January to June, peaked in June, and then gradually declined, with a single peak, in the eastern coastal subarea.
Monthly mean RH in the western coastal subarea increased gradually from January to April, with peak (also the maximum) in April, fluctuated between April and August, and then declined after August.
In each subarea, the minimum and the sub low value appeared in December and November, respectively.
In January, RH values were close in the western inland subarea (77.31%) and western coastal subarea (77.83%), and they were obviously higher than those in the other four subareas (72–74%). During February–April, RH in the western coastal subarea was also higher markedly than other subareas. The monthly maximum variability was calculated as the difference between monthly highest RH and monthly lowest RH. The order of the monthly maximum variability of RH was as follows: Pearl River Delta (15.16%) > eastern coastal subarea (14.15%) > western coastal (12.36%) > northern inland subarea (11.67%) > eastern inland (10.68%) > western inland subarea (9.05%).
In terms of the RH variation trend in each month in the subareas (Figure 3b), decreases of RH were slower in the western coastal subarea, but quicker in the eastern coastal and Pearl River Delta subareas. Decline rates of RH in the eastern coastal subarea exceeded 1.25%/10a in three months (September, October, and December). In the Pearl River Delta, decline velocities of RH all exceeded 1.0%/10a except in January (0.703%/10a). Comparison between months indicate that RH declined slowly or even rose slightly in January. For example, RH rose slowly in the western coastal (0.342%/10a), northern inland (0.103%/10a), and western inland subarea (0.057%/10a) in January. Other than the western coastal subarea, RH declined quickly in all subareas in September, October, and December. Especially in the Pearl River Delta, decline rates of RH exceeded 1.98%/10a. In the western coastal subarea, there was little difference in decline velocity of RH from February to November (0–0.45%/10a), while RH declined much more quickly in December (0.815%/10a).
3.4. Mutation Analysis
The Mann–Kendall test of annual mean RH in each subarea was also conducted (Figure 4). Table 3 shows the statistics of mutation year, and the significant variation trend and the corresponding periods are shown in Figure 4. When the variation trend of annual mean RH passed the 95% significance level in all subareas, the periods appeared during 2000–2017, and they were all decline trends. Most of the mutations occurred in the 1990s, especially the early 1990s. For example, mutations in the Pearl River Delta, western inland, northern inland, and eastern coastal subarea occurred in 1990, 1991, 1992, and 1994, respectively.
3.5. Continuous Wavelet Transform Analysis
To analyze the main oscillation cycle and corresponding period, continuous wavelet transform of annual mean RH in each subarea was conducted (Figure 5). To eliminate the effect of internal circulation, low-pass filtering [69] was applied to filter out the variability less than two years before wavelet transform of each time series. Table 4 shows the statistics of significant cycle and the corresponding periods are shown in Figure 5. There were some similarities in time and frequency domains in the eastern inland, western inland, and northern inland subarea. For example, there were 2.1–3.3 years of significant oscillation period in the 1970s, and 2.0–3.5 years of significant oscillation period during 2008–2015. Time and frequency domains in the eastern coastal subarea were similar to those in the Pearl River Delta. Most of the time domain had no significant period, while there were only 2–3 years of a significant oscillation period around 2010. Different from other subareas, significant frequency and time domains were continuous in the western coastal subarea, but the range of frequency domain changed constantly. In the whole range of time domain, there were generally 2–4 years of a significant oscillation period. During 1996–2007, there also existed 4–5 years of a significant oscillation period.
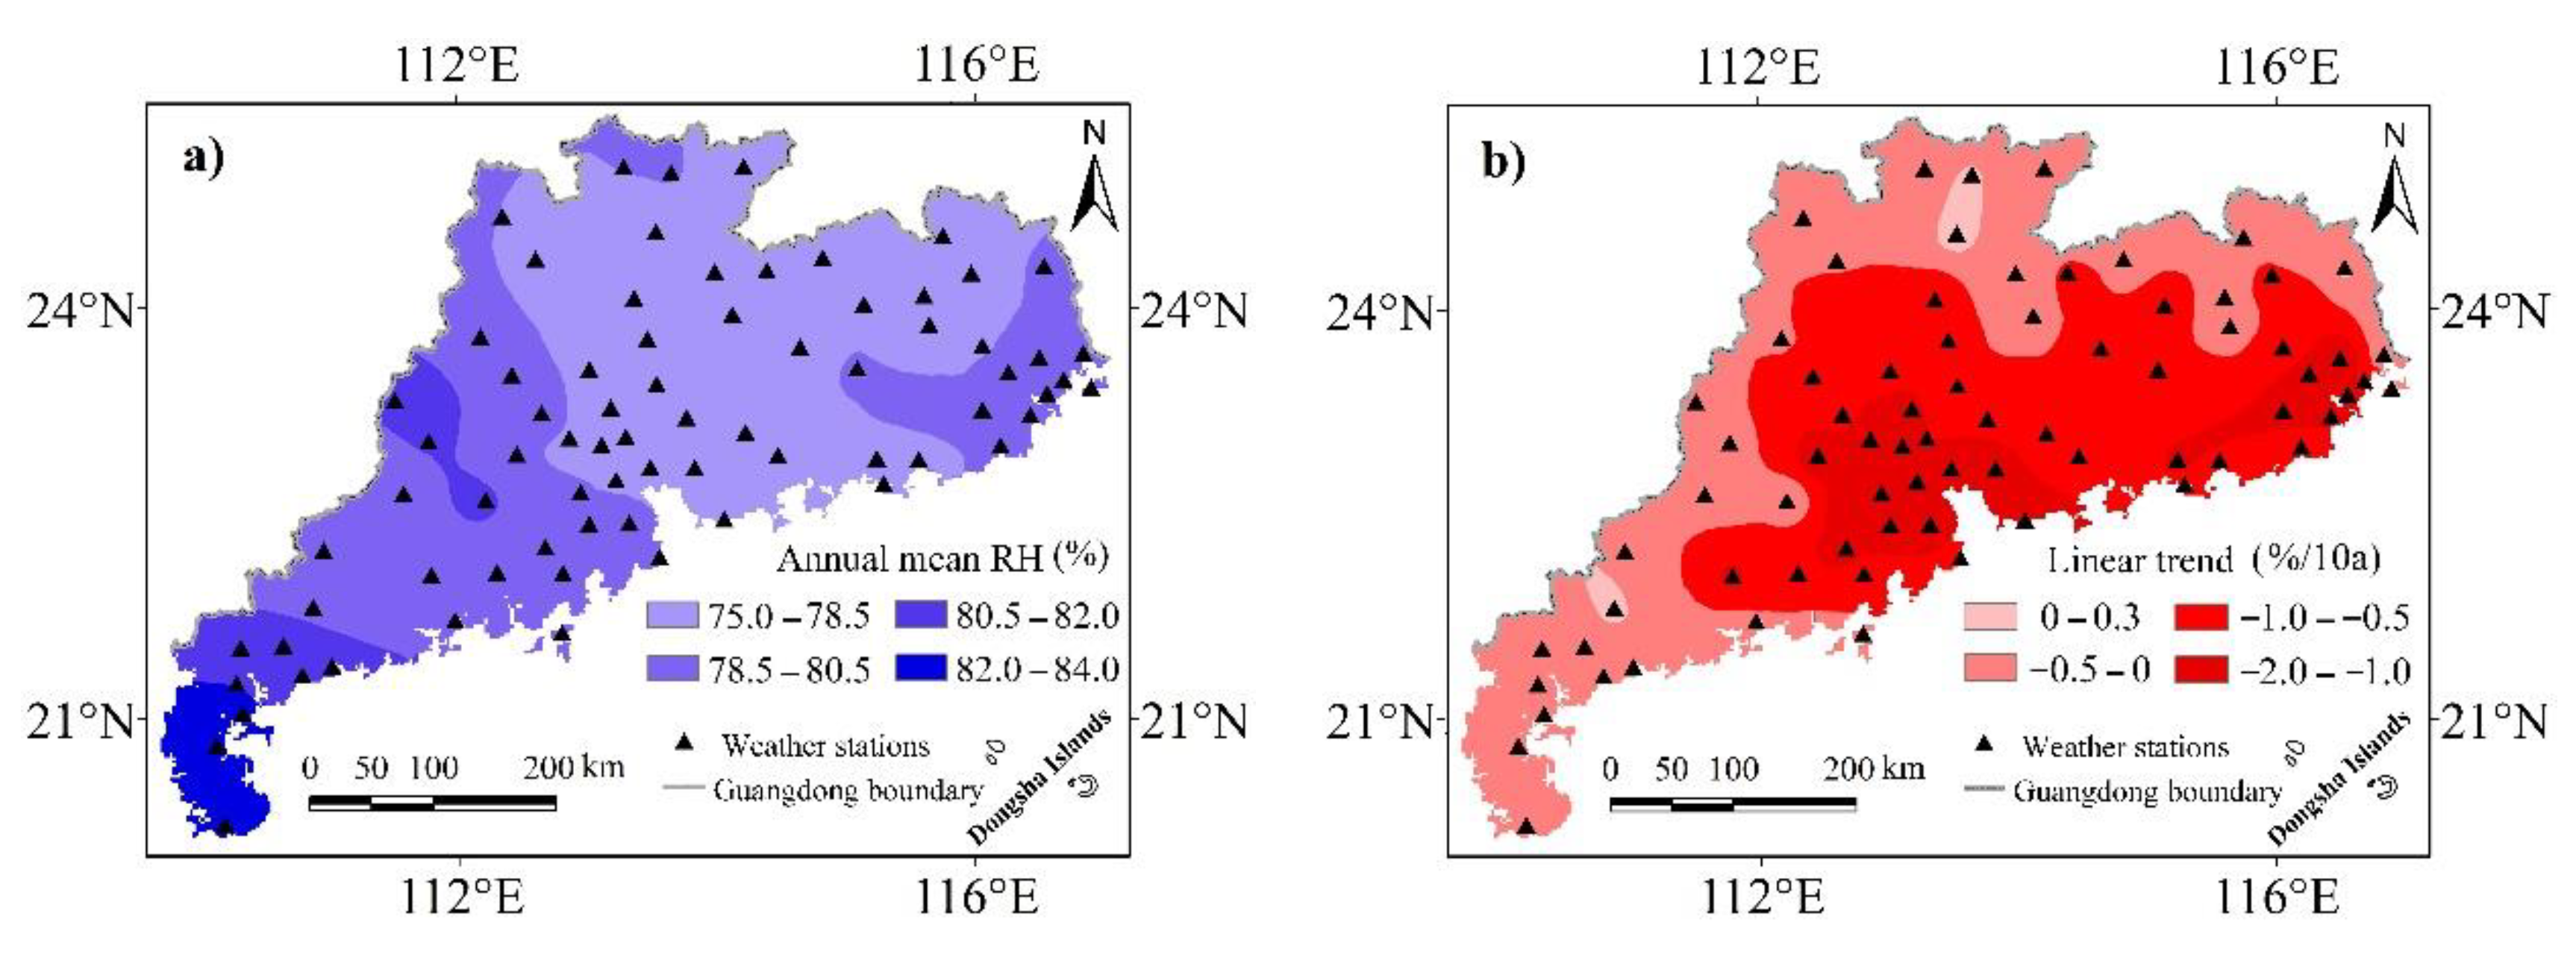
3.6. Spatial Difference of Annual Mean RH and Variation Trend in Whole Province
Figure 6a shows the spatial distribution of annual mean RH in Guangdong. Overall, it decreased from southwest to northeast. The highest annual mean RH was in Leizhou Peninsula (82.0–84.0%). The second highest annual mean RH appeared in the north of Leizhou Peninsula (Lianjiang, Wuchuan, and Dianbai) and the northwest of Guangdong (Fengkai and Deqing), between 80.5% and 82.0%. In the north of Guangdong (Shaoguan, Liaozhou, and Qingyuan), the northeast of Guangdong (Meixian, Heyuan, and Huiyang), the north (Shunde and Guangzhou) and the east (Shenzhen and Dongguan) of the Pearl River Estuary, the annual mean RH was smaller (75.0–78.5%). In other regions, annual mean RH was between 78.5% and 80.5%.
Figure 6b reflects the spatial distribution of linear trends of annual mean RH in Guangdong. Overall, annual mean RH showed a declining trend in most stations. Particularly, annual mean RH in the Pearl River Delta and the Hanjiang River Delta (Chaozhou, Shantou, and Jieyang) declined quickly, with the linear trends between −1.0%/10a and −2.0%/10a. In the northeast of Guangdong (Meixian, Fengshun, and Heyuan), the north-central Guangdong (Yingde, Qingyuan, and Guangning), and the south-central Guangdong (Enping and Taishan), the linear trends were between −0.5%/10a and −1.0%/10a. In other regions, linear trends were between 0 and −0.5%/10a. Annual mean RH only showed a rising trend in very few stations (Gaozhou, Shaoguan, Renhua, and Dabu), with the rates of lower than 0.3%/10a.
4. Discussion
As an important meteorological factor, RH influences the plant growth and human living environment. In addition, RH plays an important role in climate change and air quality. As one of the most rapidly developed areas in China, the environment in Guangdong has also changed dramatically in the last decades [72]. It is of great significance to research the spatiotemporal variation in RH in Guangdong.
4.1. Large Annual Mean RH in Guangdong
In this study, annual mean RH in Guangdong was 78.90% during the research period. There were some differences between subareas, from 77.51% to 81.37%. Comparatively, annual mean RH in Guangdong was higher than those in other regions of China, such as 60% in semiarid area of the west Jilin [73], 67.5% in Shandong [74], 66.44% in southwest inland region [45], and 76% in west Hubei [75]. The higher annual mean RH in Hubei is mainly because of the location of Guangdong, in the south coast of China. Due to the impact of large-scale sea-land thermal contrast, Guangdong starts to be affected by strong southerly winds from the ocean in March and April. The southwest wind from the South China Sea and southeast wind from the Pacific Ocean bring a large amount of water vapor continuously, and the southerly winds can last until September and October in most years [76,77,78,79,80]. Meanwhile, the weak sea breeze also brings water vapor to the land in the process of day-night alternation in coastal region [81,82].
4.2. The Application of Mann–Kendall Trend Test Method
This study used the methods of REOF, linear trend estimation, continuous wavelet transform, and Kriging interpolation. These methods are widely used and accepted. The Mann–Kendall trend test method has been improved since its introduction, while there still are some controversies in its application. Some scholars suggest that the time series should be pre-whitened before the M–K test [83], while others suggest that pre-whitening process is not appropriate for the sequences with low coefficient of variation, large trend slope, and large sample size [84]. Some studies found that the M–K test results of pre-whitening processed sequences were not accurate because of the loss of important information [85]. It is also suggested that the M–K test results can be improved by improving the significance test level and increasing the time series length of samples [64]. In the current study, the variation trend of relative humidity series was obvious, the sample size was large (1959–2017), and the confidence level of 95% was adopted. Therefore, the pre-whitening process was not suitable for our data.
4.3. Concentrated Mutation of RH in the Early 1990s
The mutation point of RH in each subarea of Guangdong mostly appeared in the 1990s, particularly in the early 1990s. Other studies found that the mutations of temperature [50], precipitation [51], and evaporation [53] in Guangdong also mainly appeared in the early 1990s. There are certain relationships between these meteorological factors, and their changing trends can influence each other [86,87]. In addition, concentrated mutations of these meteorological factors may be related to human activities. As the forefront of Reform and Opening Up in China, the development of Guangdong was heavily affected by national policies. In the early 1990s, there were several large adjustments of national polices [88,89]. Since the adjustment, industry and population have been gathering rapidly in Guangdong, especially coastal areas, thereby causing much larger impact on the local water cycle and environment [49,90].
4.4. Rapid Decline of RH in the Pearl River Delta
Our results indicate the decline rates of RH in the Pearl River Delta and eastern coastal subarea (the Hanjiang River Delta) were much larger, especially in the Pearl River Delta (Table 2, Figure 3 and Figure 6). It is mainly because of increase in urban population and expansion of city areas in the Pearl River Delta [91,92]. Especially in recent decades, rapid development of regional economy, increase of surface hardening rate, and rapid expansion of urbanization area caused that vegetation coverage declined, and surface temperature rose gradually, and the amount of water available for evaporation from the ground surface decreased gradually [93,94,95].
In 2019, Chinese government successively issued the Outline of Development Planning of Guangdong–Hong Kong–Macao Bay Area and the Opinions on Supporting Shenzhen to Build a Leading Demonstration Area of Socialism with Chinese Characteristics. In 2020, to mitigate the impact of COVID-19 pandemic, the Chinese government launched a series of new infrastructure construction plans to stimulate the economic development. Under the support of these policies, a new round of economic growth, population concentration, and urban area expansion may occur, and all of these may cause changes to the water cycle and bring threats to the environment and ecosystem [96].
Despite the importance of economic development, the close relationship between water environment, such as RH, and human society, air quality [10,11,12,13,14], extreme weather [15,16,17], plant growth, and disease transmission [31]. Effective measures are needed to minimize the impact on water resources, such as good urban planning with rational distribution of different functional zones in cites [97], increasing green areas, and low-impact development (i.e., sponge city construction in China) [98].
4.5. Limitation and Future Research
Similar to many studies, there are some limitations in the current study. In China, the manual observation of RH was gradually replaced by automatic observation from 2000, and upgradation was completed by 2014. Automatic observation of RH in Guangdong was also achieved during this period. For the automatic RH observation, meteorologists made parallel (comparative) observations for a long period [99]. Under the principle of unified archiving and management of climate data, strict quality evaluation and revision of observation data were conducted, and the possible errors were minimized within the allowable accuracy range. Moreover, strict quality control and inspection were carried out before data release [100,101]. The comparison between automatic observation and manual observation also shows the comparable results between these two methods [102,103].
In this paper, spatiotemporal variations in RH in Guangdong in the last 60 years were studied, and reasons for the changes were explored. However, RH is affected by a series of meteorological factors, such as precipitation, temperature, wind velocity, evaporation, and sunshine, and different kinds of anthropogenic activities, for example, rapid urbanization, vegetation destruction, and others. In future studies, more comprehensive analyses including more meteorological factors and human activities will further improve our understanding of the spatiotemporal change of water cycle.
5. Conclusions
In this study, the RH at 74 stations in Guangdong Province, South China, from 1959 to 2017 were analyzed. REOF decomposition, the Mann–Kendall test, and continuous wavelet transform were conducted. The main conclusions are as follows:
- (1)
- Based on the REOF decomposition situation of monthly RH field during 1959–2017, Guangdong Province was divided into 6 subareas: eastern inland subarea, eastern coastal subarea, western inland subarea, western coastal subarea, northern inland, and Pearl River Delta subarea. Overall, mean annual RH decreased at the rate of −0.678%/10a in the whole province. Spatially, annual mean RH declined quicker in the Pearl River Delta and eastern coastal subarea. The mean RH during the whole period of 1959–2017 in the whole province was 78.90%. Spatially, the mean RH decreased from southwest to northeast.
- (2)
- According to the Mann–Kendall test of annual mean RH, when variation trends in the subareas passed 95% confidence test, the periods appeared during 2000–2017 and they all were in decline trends. Moreover, mutation points mostly appeared in the 1990s, especially in the early 1990s.
- (3)
- Continuous wavelet transform of annual mean RH showed that the significant oscillation periods of 2–3 years in the 1970s and 2008–2015 in eastern inland, western inland, and northern inland subareas, while they were around 2010 in eastern coastal subarea and Pearl River Delta subarea.
Author Contributions
Conceptualization, Z.L. and H.Y.; data curation, Z.L. and H.Y.; funding acquisition, Z.L., H.Y., and X.W.; investigation, X.W.; methodology, Z.L.; software, Z.L.; validation, H.Y. and X.W.; formal analysis, Z.L.; project administration, X.W.; resources, X.W.; visualization, H.Y.; writing—original draft preparation, Z.L.; writing—review and editing, H.Y. All authors have read and agreed to the published version of the manuscript.
Funding
This study was financially supported by Natural Science Foundation of China (No. 41571091); Youth Fund of Humanistic and Social Sciences of the Ministry of Education of PRC in 2017 (No. 17YJCZH114); the “13th Five-year” Planning Item of Guangdong Philosophy and Social Sciences (No. GD16CGL10); Natural Science Foundation of Guangdong Province (No. 2015A030310505); Foshan University Interdisciplinary Program in Art and Science (No. 2019xw102), and Foshan University Lingnan Visiting Professor scheme.
Acknowledgments
The authors thank the National Climate Central (NCC), China Meteorological Administration (CMA) for providing the data for this study. The authors also thank Faming ZENG and Zhaoxiong LIANG from Foshan University for their help with the project.
Conflicts of Interest
No conflict of interest exists in the submission of this manuscript, and manuscript is approved by all authors for publication.
References
- Schmidt, G.A.; Ruedy, R.A.; Miller, R.L.; Lacis, A.A. Attribution of the present-day total greenhouse effect. J. Geophys. Res. Atmos. 2010, 115. [Google Scholar] [CrossRef]
- Dai, A. Global precipitation and thunderstorm frequencies. Part I: Seasonal and interannual variations. J. Clim. 2001, 14, 1092–1111. [Google Scholar] [CrossRef]
- Cubasch, U.; Meehl, G.A.; Boer, G.J.; Stouffer, R.J.; Dix, M.; Noda, A.; Senior, C.A.; Raper, S.; Yap, K.S. Projections of future climate change. In Climate Change 2001. The Scientific Basis; Houghton, J.T., Ding, Y., Griggs, D.J., Noguer, M., Linden, P.J., Dai, X., Maskell, K., Johnson, C.A., Eds.; Cambridge University Press: Cambridge, UK, 2001; Volume 2, pp. 525–582. [Google Scholar]
- Vicente-Serrano, S.M.; Nieto, R.; Gimeno, L. Recent changes of relative humidity: Regional connections with land and ocean processes. Earth Syst. Dyn. 2018, 9, 915–937. [Google Scholar] [CrossRef] [Green Version]
- Lepeule, J.; Litonjua, A.A.; Gasparrinie, A. Lung function association with outdoor temperature and relative humidity and its interaction with air pollution in the elderly. Environ. Res. 2018, 165, 110–117. [Google Scholar] [CrossRef] [PubMed]
- Fan, X.; Liu, W.; Wargocki, P. Physiological and psychological reactions of sub-tropically acclimatized subjects exposed to different indoor temperatures at a relative humidity of 70%. Indoor Air 2019, 29, 215–230. [Google Scholar] [CrossRef] [PubMed]
- Buonocore, C.; De Vecchi, R.; Scalco, V. Influence of relative air humidity and movement on human thermal perception in classrooms in a hot and humid climate. Build. Environ. 2018, 146, 98–106. [Google Scholar] [CrossRef]
- Sherwood, S.; Ingram, W.; Tsushima, Y.; Satoh, M.; Roberts, M. Relative humidity changes in a warmer climate. J. Geophys. Res. Atmos. 2010, 115, 10–63. [Google Scholar] [CrossRef] [Green Version]
- Held, I.M.; Shell, K.M. Using Relative Humidity as a State Variable in Climate Feedback Analysis. J. Clim. 2012, 25, 2578–2582. [Google Scholar] [CrossRef] [Green Version]
- Wang, X.; Zhang, R.; Yu, W. The Effects of PM2.5 Concentrations and Relative Humidity on Atmospheric Visibility in Beijing. J. Geophys. Res. Atmos. 2019, 124, 2235–2259. [Google Scholar] [CrossRef]
- Wang, H.; Ding, J.; Xu, J. Aerosols in an arid environment: The role of aerosol water content, particulate acidity, precursors, and relative humidity on secondary inorganic aerosols. Sci. Total Environ. 2019, 646, 564–572. [Google Scholar] [CrossRef] [Green Version]
- Li, Z.; Smith, K.A.; Cappa, C.D. Influence of relative humidity on the heterogeneous oxidation of secondary organic aerosol. Atmos. Chem. Phys. 2018, 18, 14585–14608. [Google Scholar] [CrossRef] [Green Version]
- Hinks, M.L.; Montoya-Aguilera, J.; Ellison, L. Effect of relative humidity on the composition of secondary organic aerosol from the oxidation of toluene. Atmos. Chem. Phys. 2018, 18, 1643–1652. [Google Scholar] [CrossRef] [Green Version]
- Fan, L.; Qin-wen, T.; Xia, J. Effect of Relative Humidity on Particulate Matter Concentration and Visibility During Winter in Chengdu. Huanjing Kexue 2018, 39, 1466–1472. [Google Scholar] [CrossRef]
- Zalakeviciute, R.; Lopez-Villada, J.; Rybarczyk, Y. Contrasted Effects of Relative Humidity and Precipitation on Urban PM2.5 Pollution in High Elevation Urban Areas. Sustainability 2018, 10, 2064. [Google Scholar] [CrossRef] [Green Version]
- Pan, X.; Ge, B.; Wang, Z. Synergistic effect of water-soluble species and relative humidity on morphological changes in aerosol particles in the Beijing megacity during severe pollution episodes. Atmos. Chem. Phys. 2019, 19, 219–232. [Google Scholar] [CrossRef] [Green Version]
- Eck, T.F.; Holben, B.N.; Kim, J. Influence of cloud, fog, and high relative humidity during pollution transport events in South Korea: Aerosol properties and PM2.5 variability. Atmos. Environ. 2020, 232, 117530. [Google Scholar] [CrossRef]
- Zheng, S.; Liu, S. Urbanization effect on climate in Beijing (In Chinese). Clim. Environ. Res. 2008, 13, 123–133. [Google Scholar] [CrossRef]
- Yang, P.; Ren, G.Y.; Hou, W. Tempo–Spatial patterns of relative humidity and the Urban dryness Island effect in Beijing City. J. Appl. Meteorol. Climatol. 2017, 56, 2221–2237. [Google Scholar] [CrossRef]
- Wu, Y.; Ge, X.; Wang, J. Responses of secondary aerosols to relative humidity and photochemical activities in an industrialized environment during late winter. Atmos. Environ. 2018, 193, 66–78. [Google Scholar] [CrossRef]
- Liu, W.D.; You, H.L.; Dou, J.X. Urban-rural humidity and temperature differences in the Beijing area. Theor. Appl. Climatol. 2009, 96, 201–207. [Google Scholar] [CrossRef]
- Feng, Y.; Marchal, T.; Sperry, T. Influence of wind and relative humidity on the social distancing effectiveness to prevent COVID-19 airborne transmission: A numerical study. J. Aerosol Sci. 2020, 147, 105585. [Google Scholar] [CrossRef] [PubMed]
- Auler, A.C.; Cassaro, F.A.M.; Da Silva, V.O. Evidence that high temperatures and intermediate relative humidity might favor the spread of COVID-19 in tropical climate: A case study for the most affected Brazilian cities. Sci. Total Environ. 2020, 729, 139090. [Google Scholar] [CrossRef] [PubMed]
- Peci, A.; Winter, A.-L.; Li, Y. Effects of Absolute Humidity, Relative Humidity, Temperature, and Wind Speed on Influenza Activity in Toronto, Ontario, Canada. Appl. Environ. Microbiol. 2019, 84, e02426. [Google Scholar] [CrossRef] [PubMed] [Green Version]
- Kormuth, K.A.; Lin, K.; Prussin, A.J. Influenza Virus Infectivity Is Retained in Aerosols and Droplets Independent of Relative Humidity. J. Infect. Dis. 2018, 218, 739–747. [Google Scholar] [CrossRef] [PubMed]
- Yang, Y.; You, E.; Wu, J. Effects of relative humidity on childhood hand, foot, and mouth disease reinfection in Hefei, China. Sci. Total Environ. 2018, 630, 820–826. [Google Scholar] [CrossRef] [PubMed]
- Bo, Z.; Ma, Y.; Chang, Z. The spatial heterogeneity of the associations between relative humidity and pediatric hand, foot and mouth disease: Evidence from a nation-wide multicity study from mainland China. Sci. Total Environ. 2020, 136103. [Google Scholar] [CrossRef]
- Wu, X.; Lang, L.; Ma, W. Non-linear effects of mean temperature and relative humidity on dengue incidence in Guangzhou, China. Sci. Total Environ. 2018, 628, 766–771. [Google Scholar] [CrossRef]
- Butler, C.J.; Garcia-Suarez, A.M. Relative humidity at Armagh Observatory, 1838-2008. Int. J. Climatol. 2012, 32, 657–668. [Google Scholar] [CrossRef] [Green Version]
- Chen, Y.H.; Liang, J.; Lin, H.Y. The Relationship of Air Temperature, Relative Humidity and Nosocomial Infection in Guangzhou (In Chinese). J. Xianning Univ. 2012, 26, 108–111. [Google Scholar] [CrossRef]
- Wang, P.; Goggins, W.B.; Chan, E.Y.Y. A time-series study of the association of rainfall, relative humidity and ambient temperature with hospitalizations for rotavirus and norovirus infection among children in Hong Kong. Sci. Total Environ. 2018, 643, 414–422. [Google Scholar] [CrossRef]
- Uchiyama, J.D.; Aronowicz, I.A.; Butovich, S. Increased evaporative rates in low humidity conditions simulating airplane travel: A probable cause of dry eye symptoms. Investig. Ophthalmol. Vis. Sci. 2006, 47, 248–456. [Google Scholar] [CrossRef]
- Van Wijngaarden, W.A.; Vincent, L.A. Examination of discontinuities in hourly surface relative humidity in Canada during 1953-2003. J. Geophys. Res. Atmos. 2005, 110. [Google Scholar] [CrossRef]
- Wypych, A. Twentieth century variability of surface humidity as the climate change indicator in Kraków (Southern Poland). Theor. Appl. Climatol. 2010, 101, 475–482. [Google Scholar] [CrossRef]
- Vicente-Serrano, S.M.; Azorin-Molina, C.; Sanchez-Lorenzo, A.; Moran-Tejeda, E.; Lorenzo-Lacruz, J.; Revuelto, J.; Lopez-Moreno, J.I.; Espejo, F. Temporal evolution of surface humidity in Spain: Recent trends and possible physical mechanisms. Clim. Dyn. 2014, 42, 2655–2674. [Google Scholar] [CrossRef] [Green Version]
- Fatichi, S.; Molnar, P.; Mastrotheodoros, T.; Burlando, P. Diurnal and seasonal changes in near-surface humidity in a complex orography. J. Geophys. Res. Atmos. 2015, 120, 2358–2374. [Google Scholar] [CrossRef]
- Akinbode, O.M.; Eludoyin, A.O.; Fashae, O.A. Temperature and relative humidity distributions in a medium-size administrative town in southwest Nigeria. J. Environ. Manag. 2008, 87, 95–105. [Google Scholar] [CrossRef]
- Shiu, C.J.; Liu, S.C.; Chen, J.P. Diurnally Asymmetric Trends of Temperature, Humidity, and Precipitation in Taiwan. J. Clim. 2009, 22, 5635–5649. [Google Scholar] [CrossRef] [Green Version]
- Stocker, T.F.; Qin, D.; Plattner, G.K.; Tignor, M.; Allen, S.K.; Boschung, J.; Nauels, A.; Xia, Y.; Bex, V.; Midgley, P.M. Summary for policy-makers. In Climate Change 2013: The Physical Science Basis. Contribution of Working Group I to the Fifth Assessment Report of the Intergovernmental Panel on Climate Change; IPCC, Ed.; Cambridge University Press: Cambridge, UK; New York, NY, USA, 2013; Volume 3, pp. 159–204. [Google Scholar]
- Nojarov, P. Variations in precipitation amounts, atmosphere circulation, and relative humidity in high mountainous parts of Bulgaria for the period 1947-2008. Theor. Appl. Climatol. 2012, 107, 175–187. [Google Scholar] [CrossRef]
- Talaee, P.H.; Sabziparvar, A.A.; Tabari, H. Observed changes in relative humidity and dew point temperature in coastal regions of Iran. Theor. Appl. Climatol. 2012, 110, 385–393. [Google Scholar] [CrossRef]
- Nian, D.; Deng, Q.; Fu, Z. Research progress of relative humidity and its changing annual cycle (in Chinese). Adv. Earth Sci. 2018, 33, 762–774. [Google Scholar] [CrossRef]
- Xie, X.; You, Q.; Lin, H.Y. Surface relative humidity decreases and its cause over the Qinghai-Tibetan Plateau in recent ten years (in Chinese). Plateau Meteorol. 2018, 37, 642–650. [Google Scholar]
- Wang, Z.; Ding, Y.; He, J.; Yu, J. An updating analysis of the climate change in China in recent 50 years (in Chinese). Acta Meteor. Sin. 2004, 62, 228–236. [Google Scholar] [CrossRef]
- Li, H.; Han, L.; Jia, Z.; Wang, B.; Chen, X. The changes of the average relative humidity in Southwest China (in Chinese). Plateau Mt. Meteorol. Res. 2016, 36, 42–47. [Google Scholar] [CrossRef]
- Liu, Y.; Li, Y.; Xie, J.; Zhang, H. Climate Change Characteristics of Free Atmospheric Humidity and Its Relationship with Temperature and Precipitation in Northeast China (in Chinese). Sci. Geogr. Sin. 2016, 36, 628–636. [Google Scholar] [CrossRef]
- Shi, J.; Zhou, W.; Cui, L. Change trend of climatic factors in the Yangtze River delta from 1959 to 2005 (in Chinese). Resour. Sci. 2008, 30, 1803–1810. [Google Scholar]
- Yang, H.; Huang, X.; Thompson, J.R.; Flower, R.J. Enforcement key to China’s environment. Science 2015, 347, 834–835. [Google Scholar] [CrossRef]
- Yang, H. China must continue the momentum of green law. Nature 2014, 509, 535. [Google Scholar] [CrossRef] [Green Version]
- Huang, Q.; Chen, Z.; Liu, Z. Temporal and spatial variations of extreme temperature in Guangdong over the last 60 years in the background of global warming (in Chinese). Trop. Geogr. 2012, 32, 246–251. [Google Scholar] [CrossRef]
- Lu, W.; Liu, B.; Chen, J.; Chen, X. Variation trend of precipitation in the Pearl RiverBasin in recent 50 years (in Chinese). J. Nat. Resour. 2014, 29, 80–90. [Google Scholar] [CrossRef]
- Chen, Z.; Huang, Q.; Liu, Z. Analyzing the spatial-temporal variation of wet and dry spells during 1962–2007 in Guangdong province (in Chinese). Adv. Water Sci. 2013, 24, 469–476. [Google Scholar] [CrossRef]
- Fan, L.; Guo, P.; Guan, Y. Changes in pan evaporation and its cause over Guangdong (in Chinese). Acta Geogr. Sin. 2010, 65, 863–872. [Google Scholar] [CrossRef]
- Yang, H.; Ma, M.; Thompson, J.R.; Flower, R.J. Waste management, informal recycling, environmental pollution and public health. J. Epidemiol. Community Health 2018, 72, 237–243. [Google Scholar] [CrossRef] [PubMed]
- Zhang, Q.; Zhou, Y.; Vijay, P. Scaling and clustering effects of extreme precipitation distributions. J. Hydrol. 2012, 454, 187–194. [Google Scholar] [CrossRef]
- Chang, C.-H.; Lee, H.; Kim, D. Hindcast and forecast of daily inundation extents using satellite SAR and altimetry data with rotated empirical orthogonal function analysis: Case study in Tonle Sap Lake Floodplain. Remote Sens. Environ. 2020, 241, 111732. [Google Scholar] [CrossRef]
- Xu, Q.; Guan, Z.; Jin, D. Regional Characteristics of Interannual Variability of Summer Rainfall in the Maritime Continent and Their Related Anomalous Circulation Patterns. J. Clim. 2019, 32, 4179–4192. [Google Scholar] [CrossRef]
- Wu, F.; Yang, X.; Shen, Z. Regional and seasonal variations of outdoor thermal comfort in China from 1966 to 2016. Sci. Total Environ. 2019, 665, 1003–1016. [Google Scholar] [CrossRef]
- He, Q.; Gu, Y.; Zhang, M. Spatiotemporal trends of PM2.5 concentrations in central China from 2003 to 2018 based on MAIAC-derived high-resolution data. Environ. Int. 2020, 137, 105536. [Google Scholar] [CrossRef]
- Burn, D.H.; Hag Elnur, M.A. Detection of hydrologic trends and variability. J. Hydrol. 2002, 255, 107–122. [Google Scholar] [CrossRef]
- Wang, J. Determining the most accurate program for the Mann-Kendall method in detecting climate mutation. Theor. Appl. Climatol. 2020, 142, 847–854. [Google Scholar] [CrossRef]
- Lamchin, M.; Lee, W.K.; Jeon, S.W.; Wang, S.W.; Lim, C.H.; Song, C.; Sung, M. Long-term trend and correlation between vegetation greenness and climate variables in Asia based on satellite data. Sci. Total Environ. 2018, 618, 1089–1095. [Google Scholar] [CrossRef]
- Phuong, D.N.D.; Tram, V.N.Q.; Nhat, T.T. Hydro-meteorological trend analysis using the Mann-Kendall and innovative-Sen methodologies: A case study. Int. J. Glob. Warm. 2020, 20, 145–164. [Google Scholar] [CrossRef]
- Wang, F.; Shao, W.; Yu, H. Re-evaluation of the Power of the Mann-Kendall Test for Detecting Monotonic Trends in Hydrometeorological Time Series. Front. Earth Sci. 2020, 8, e14. [Google Scholar] [CrossRef]
- Sa’adi, Z.; Shahid, S.; Ismail, T. Trends analysis of rainfall and rainfall extremes in Sarawak, Malaysia using modified Mann-Kendall test. Meteorol. Atmos. Phys. 2019, 131, 263–277. [Google Scholar] [CrossRef]
- Peng, J.; Luo, X.X.; Liu, F.; Zhang, Z.H. Analysing the influences of ENSO and PDO on water discharge from the Yangtze River into the sea. Hydrol. Process. 2018, 32, 1090–1103. [Google Scholar] [CrossRef]
- Lapins, S.; Roman, D.C.; Rougier, J. An examination of the continuous wavelet transform for volcano-seismic spectral analysis. J. Volcanol. Geotherm. Res. 2020, 389, 106728. [Google Scholar] [CrossRef]
- Chen, X.; Yin, L.; Fan, Y. Temporal evolution characteristics of PM2.5 concentration based on continuous wavelet transform. Sci. Total Environ. 2020, 699, 134244. [Google Scholar] [CrossRef]
- Sagaidachnyi, A.; Fomin, A.; Usanov, D.; Skripal, A. Real-time technique for conversion of skin temperature into skin blood flow: Human skin as a low-pass filter for thermal waves. Comput. Methods Biomech. Biomed. Eng. 2019, 22, 1009–1019. [Google Scholar] [CrossRef]
- Shao, Y.; Ma, Z.; Wang, J.; Bi, J. Estimating daily ground-level PM2.5 in China with random-forest-based spatiotemporal kriging. Sci. Total Environ. 2020, 740, 139761. [Google Scholar] [CrossRef]
- Shukla, K.; Kumar, P.; Mann, G.; Khare, M. Mapping spatial distribution of particulate matter using Kriging and Inverse Distance Weighting at supersites of megacity Delhi. Sustain. Cities Soc. 2020, 54, 101997. [Google Scholar] [CrossRef]
- Yang, H.; Flower, R.J.; Thompson, J.R. Sustaining China’s water resources. Science 2013, 339, 141. [Google Scholar] [CrossRef]
- Jin, Y.; Lian, S.; Zhou, D.; Xu, J.; Peng, C. Study on change of relative humidity in semiarid region under global climate change (in Chinese). J. Northeast. Norm. Univ. (Nat. Sci. Ed.) 2009, 41, 134–138. [Google Scholar] [CrossRef]
- Liu, X.; Li, B.; Lian, L. Tempo-spatial variations of aerial and subaerial air relative humidity in Shandong Province during 1960–2012 (in Chinese). Bull. Soil Water Conserv. 2017, 37, 218–223. [Google Scholar]
- Sun, S.; Ju, Z. Variation characteristics of relative humidity in three gorges dam area (in Chinese). Meteorol. Sci. Technol. 2002, 30, 300–303. [Google Scholar] [CrossRef]
- Tang, X.; Chen, B.D.; Liang, P.; Qian, W.H. Definition and Features of the North Edge of the East Asian Summer Monsoon. Acta Meteorol. Sin. 2010, 24, 43–49. [Google Scholar] [CrossRef]
- Lv, X.; Zhang, X.Q.; Chen, J. The interdecadal variability of north-south movement of East Asian summer monsoon and its effect on the regional rainfall over China (in Chinese). J. Trop. Meteorol. 2011, 27, 860–868. [Google Scholar] [CrossRef]
- Jiang, Z.; He, J.; Li, J.; Yang, J.; Wang, J. Northerly advancement characteristics of the East Asian Summer monsoon with its interdecadal variations (in Chinese). Acta Geogr. Sin. 2006, 61, 675–686. [Google Scholar] [CrossRef]
- Ding, Y.H.; Wang, Z.Y.; Sun, Y. Inter-decadal variation of the summer precipitation in East China and its association with decreasing Asian summer monsoon. Part I: Observed evidences. Int. J. Climatol. 2008, 28, 1139–1161. [Google Scholar] [CrossRef]
- Ding, Y.; Si, D.; Liu, Y.; Wang, Z.; Li, Y.; Zhao, L.; Song, Y. On the characteristics, driving forces and inter-decadal variability of the East Asian summer monsoon (in Chinese). Chin. J. Atmos. Sci. 2018, 42, 533–558. [Google Scholar] [CrossRef]
- Xu, J.; Guo, M.; Liang, H. Features of sea and land breezes along the coast of the Guangdong province and their distribution patterns (in Chinese). J. Meteorol. Sci. 1992, 12, 188–199. [Google Scholar]
- Qiu, X.; Fan, S. Progress of sea-land Breeze study and the characteristics of sea-land Breeze in three coastal areas in China (in Chinese). Meteorol. Mon. 2013, 39, 186–193. [Google Scholar] [CrossRef]
- Kulkarni, A.; von Storch, H. Monte Carlo experiments on the effect of serial correlation on the Mann-Kendall test of trend. Meteorol. Z. 1995, 4, 82–85. [Google Scholar] [CrossRef]
- Bayazit, M.; Onoz, B. To prewhiten or not to prewhiten in trend analysis? Hydrol. Sci. J. J. Des. Sci. Hydrol. 2009, 52, 611–624. [Google Scholar] [CrossRef]
- Mallick, J.; Talukdar, S.; Alsubih, M. Analysing the trend of rainfall in Asir region of Saudi Arabia using the family of Mann-Kendall tests, innovative trend analysis, and detrended fluctuation analysis. Theor. Appl. Climatol. 2020, 23, 73–87. [Google Scholar] [CrossRef]
- Qin, S.; Yue, C.; He, B.; Li, Y. Variation diagnosis of the relationship between hydrological and meteorological factors in the Jingou River Basin (in Chinese). J. Water Resour. Water Eng. 2019, 30, 50–56. [Google Scholar] [CrossRef]
- Liu, Z.; Huang, Q.; Yang, Y.; Huang, S. Variation diagnosis and driving force analysisof relation of precipitation and temperature in Xijiang River Basin (in Chinese). J. Hydroelectr. Eng. 2020, 39, 1–15. [Google Scholar]
- Qiao, J.; Shi, H. China’s industrial structure and its changes since 1990s (in Chinese). Hum. Geogr. 2007, 22, 55–59. [Google Scholar] [CrossRef]
- Luo, Y.; Gu, R. The pattern and evolutional trend of Chinese manufacturing’s spatial agglomeration: An empirical analysis based on data from 1980 to 2011 (in Chinese). Econ. Geogr. 2014, 34, 82–89. [Google Scholar]
- He, C.F.; Chen, T.M.; Mao, X.Y.; Zhou, Y. Economic transition, urbanization and population redistribution in China. Habitat Int. 2016, 51, 39–47. [Google Scholar] [CrossRef]
- Zhang, M.; Huang, X.; Chuai, X.; Yang, H.; Lai, L.; Tan, J. Impact of land use type conversion on carbon storage in terrestrial ecosystems of China: A spatial-temporal perspective. Sci. Rep. 2015, 5, 10233. [Google Scholar] [CrossRef]
- Lai, L.; Huang, X.; Yang, H.; Chuai, X.; Zhang, M.; Zhong, T.; Chen, Z.; Chen, Y.; Wang, X.; Thompson, J.R. Carbon emissions from land-use change and management in China between 1990 and 2010. Sci. Adv. 2016, 2, e1601063. [Google Scholar] [CrossRef] [Green Version]
- Zhou, L.; Jiang, Z.; Li, Z.; Yang, X. Numerical simulation of urbanization climate effects in regions of East China (in Chinese). Chin. J. Atmos. Sci. 2015, 39, 596–610. [Google Scholar] [CrossRef]
- Zhang, S.; Liu, Y.; Huang, H. Research on quantitative evaluations and spatial and temporal distribution of heat islands for the Pearl River Delta agglomeration (in Chinese). Ecol. Environ. Sci. 2017, 26, 1157–1166. [Google Scholar] [CrossRef]
- Yang, H.; Huang, X.J.; Thompson, J.R.; Bright, R.M.; Astrup, R. The crushing weight of urban waste. Science 2016, 351, 674. [Google Scholar] [CrossRef] [PubMed] [Green Version]
- Yang, H.; Mang, M.; Thompson, J.R.; Flower, R.J. Protect the giant ibis through the pandemic. Science 2020, 369, 929. [Google Scholar] [CrossRef]
- Yang, H.; Xia, J.Q.; Thompson, J.R.; Flower, R.J. Urban construction and demolition waste and landfill failure in Shenzhen, China. Waste Manag. 2017, 63, 393–396. [Google Scholar] [CrossRef]
- Hu, M.C.; Zhang, X.Q.; Siu, Y.L.; Li, Y.; Tanaka, K.; Yang, H.; Xu, Y.P. Flood Mitigation by Permeable Pavements in Chinese Sponge City Construction. Water 2018, 10, 172. [Google Scholar] [CrossRef] [Green Version]
- Mao, J.; Mo, Y.; Zhang, X.Q.; Yang, Y.; Guo, R. Comparison and Analysis of Automatically-observed and Manually-observed Relative Humidity (in Chinese). J. Appl. Meteorol. Sci. 2016, 27, 370–379. [Google Scholar] [CrossRef]
- Zhao, Y.; Ren, Z.; Zhang, Q. Quality control procedures for hourly relative humidity data from national automatic weather stations (in Chinese). J. Meteorol. Sci. 2011, 31, 687–693. [Google Scholar] [CrossRef]
- Ren, Z.; Zhang, Z.H.; Sun, C.; Liu, Y.; Li, J.; Ju, X.; Zhao, Y.; Li, Z.; Zhang, W.; Li, H. Development of Three-Step Quality Control System of Real-Time Observation Data from AWS in China (in Chinese). Meteorol. Mon. 2015, 41, 1268–1277. [Google Scholar] [CrossRef]
- Jutta, H.; Cerhard, M.W.; Herzog, J.; Muller, W.G. Homogenization of various climatological parameters in the German weather service. In Proceedings of the First Seminar for Homogenization of Surface Climatological Data, Budapest, Hungary, 6–12 October 1996; pp. 101–111. [Google Scholar]
- Guttman, N.B.; Baker, C.B. Exploratory analysis of the difference between temperature observations recorded by ASOS and conventional methods. Bull. Am. Meteorol. Soc. 1996, 77, 2865–2873. [Google Scholar] [CrossRef] [Green Version]
Figure 1.
The location of Guangdong Province in China and weather stations in the province.

Figure 2.
Spatial distribution of the first 6 modal loads of monthly relative humidity (RH) according to rotate empirical orthogonal function (REOF) in Guangdong. The high load value regions in figures (a–f) represent the western coastal subarea, the Pearl River Delta subarea, the eastern coastal subarea, the western inland subarea, the eastern inland subarea and the northern inland subarea, respectively.

Figure 3.
Mean (a) and linear trend (b) of RH in each month in each subarea in Guangdong. The letters denote names of the subareas. EIS is the eastern inland subarea; ESC is the eastern coastal subarea; WIS is the western inland subarea; WCS is the western coastal subarea; NIS is the northern inland subarea; and PRDS is the Pearl River Delta subarea.
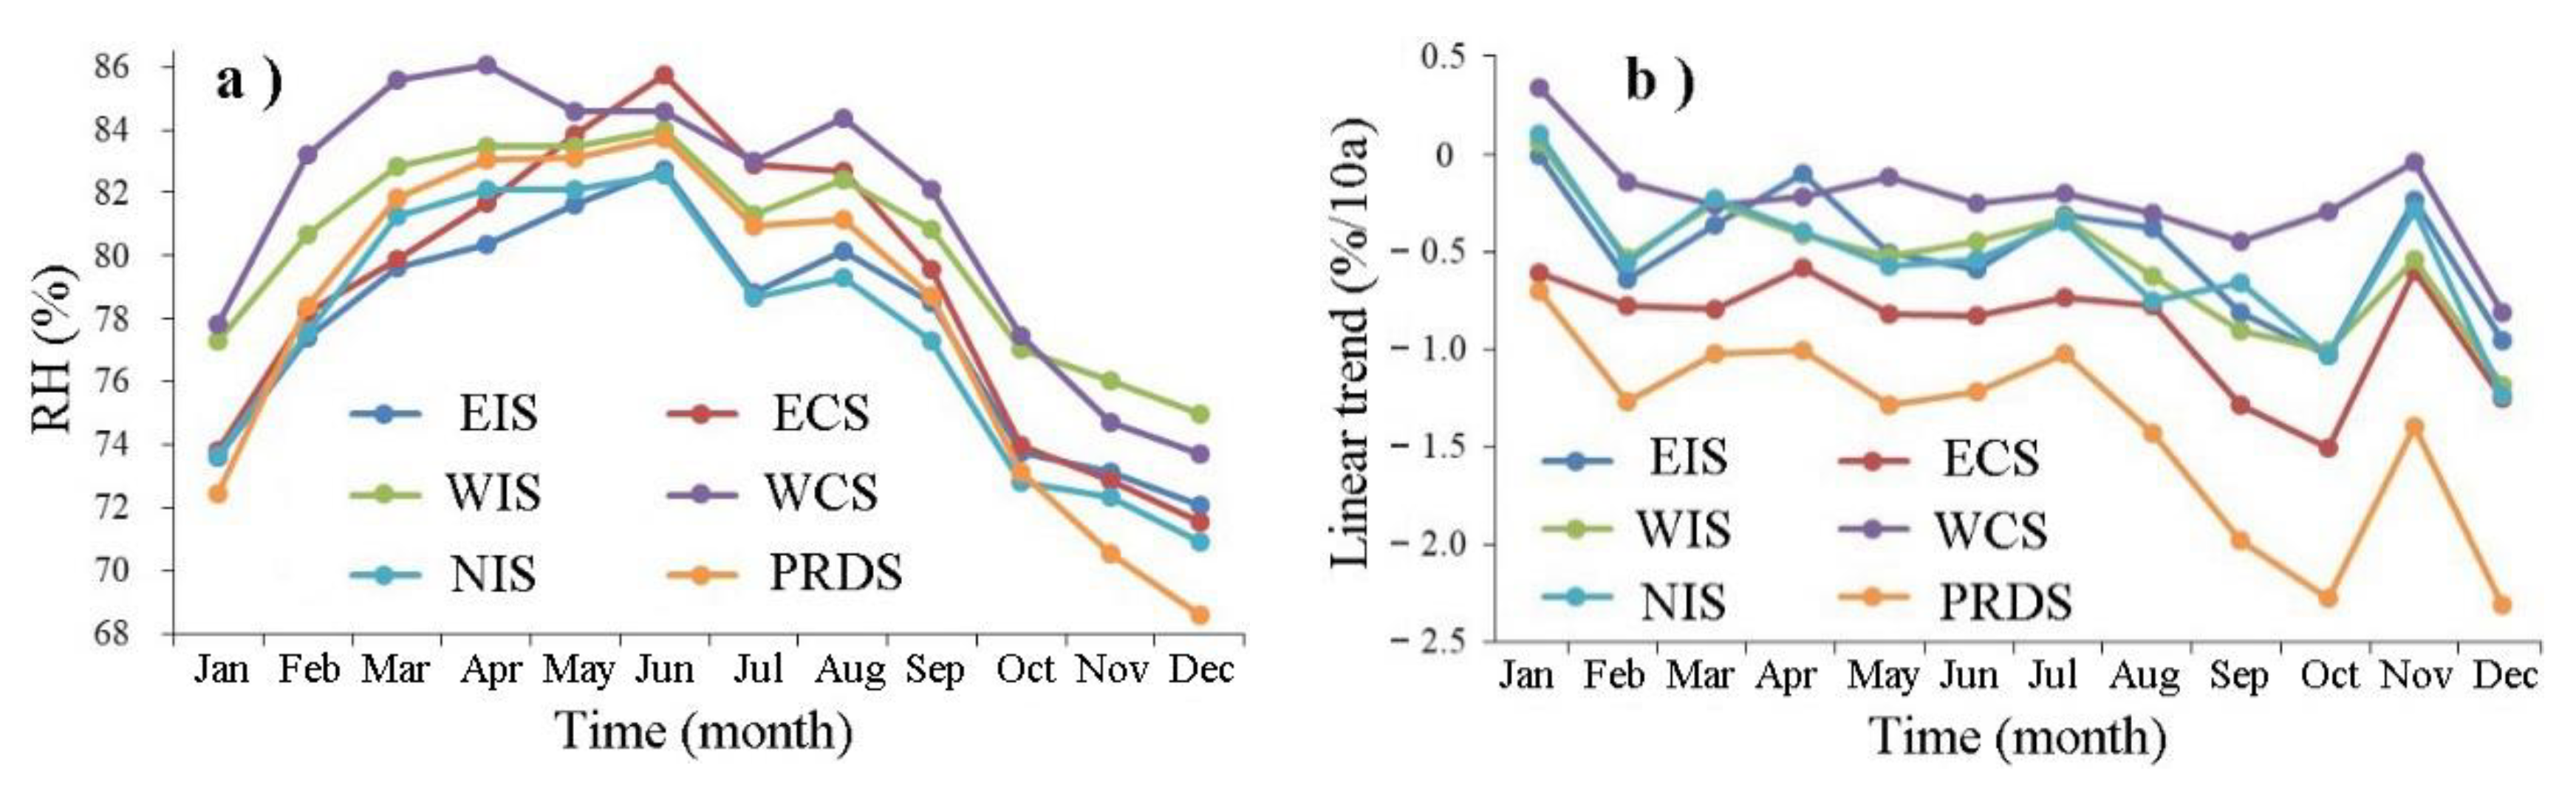
Figure 4.
Mann–Kendall test of average annual RH in eastern inland subarea (a), eastern coastal subarea (b), western inland subarea (c), western coastal subarea (d), northern inland subarea (e), and Pearl River Delta subarea (f). UF is forward data sequence Mann–Kendall statistics, and UB is reverse data sequence Mann–Kendall statistics.
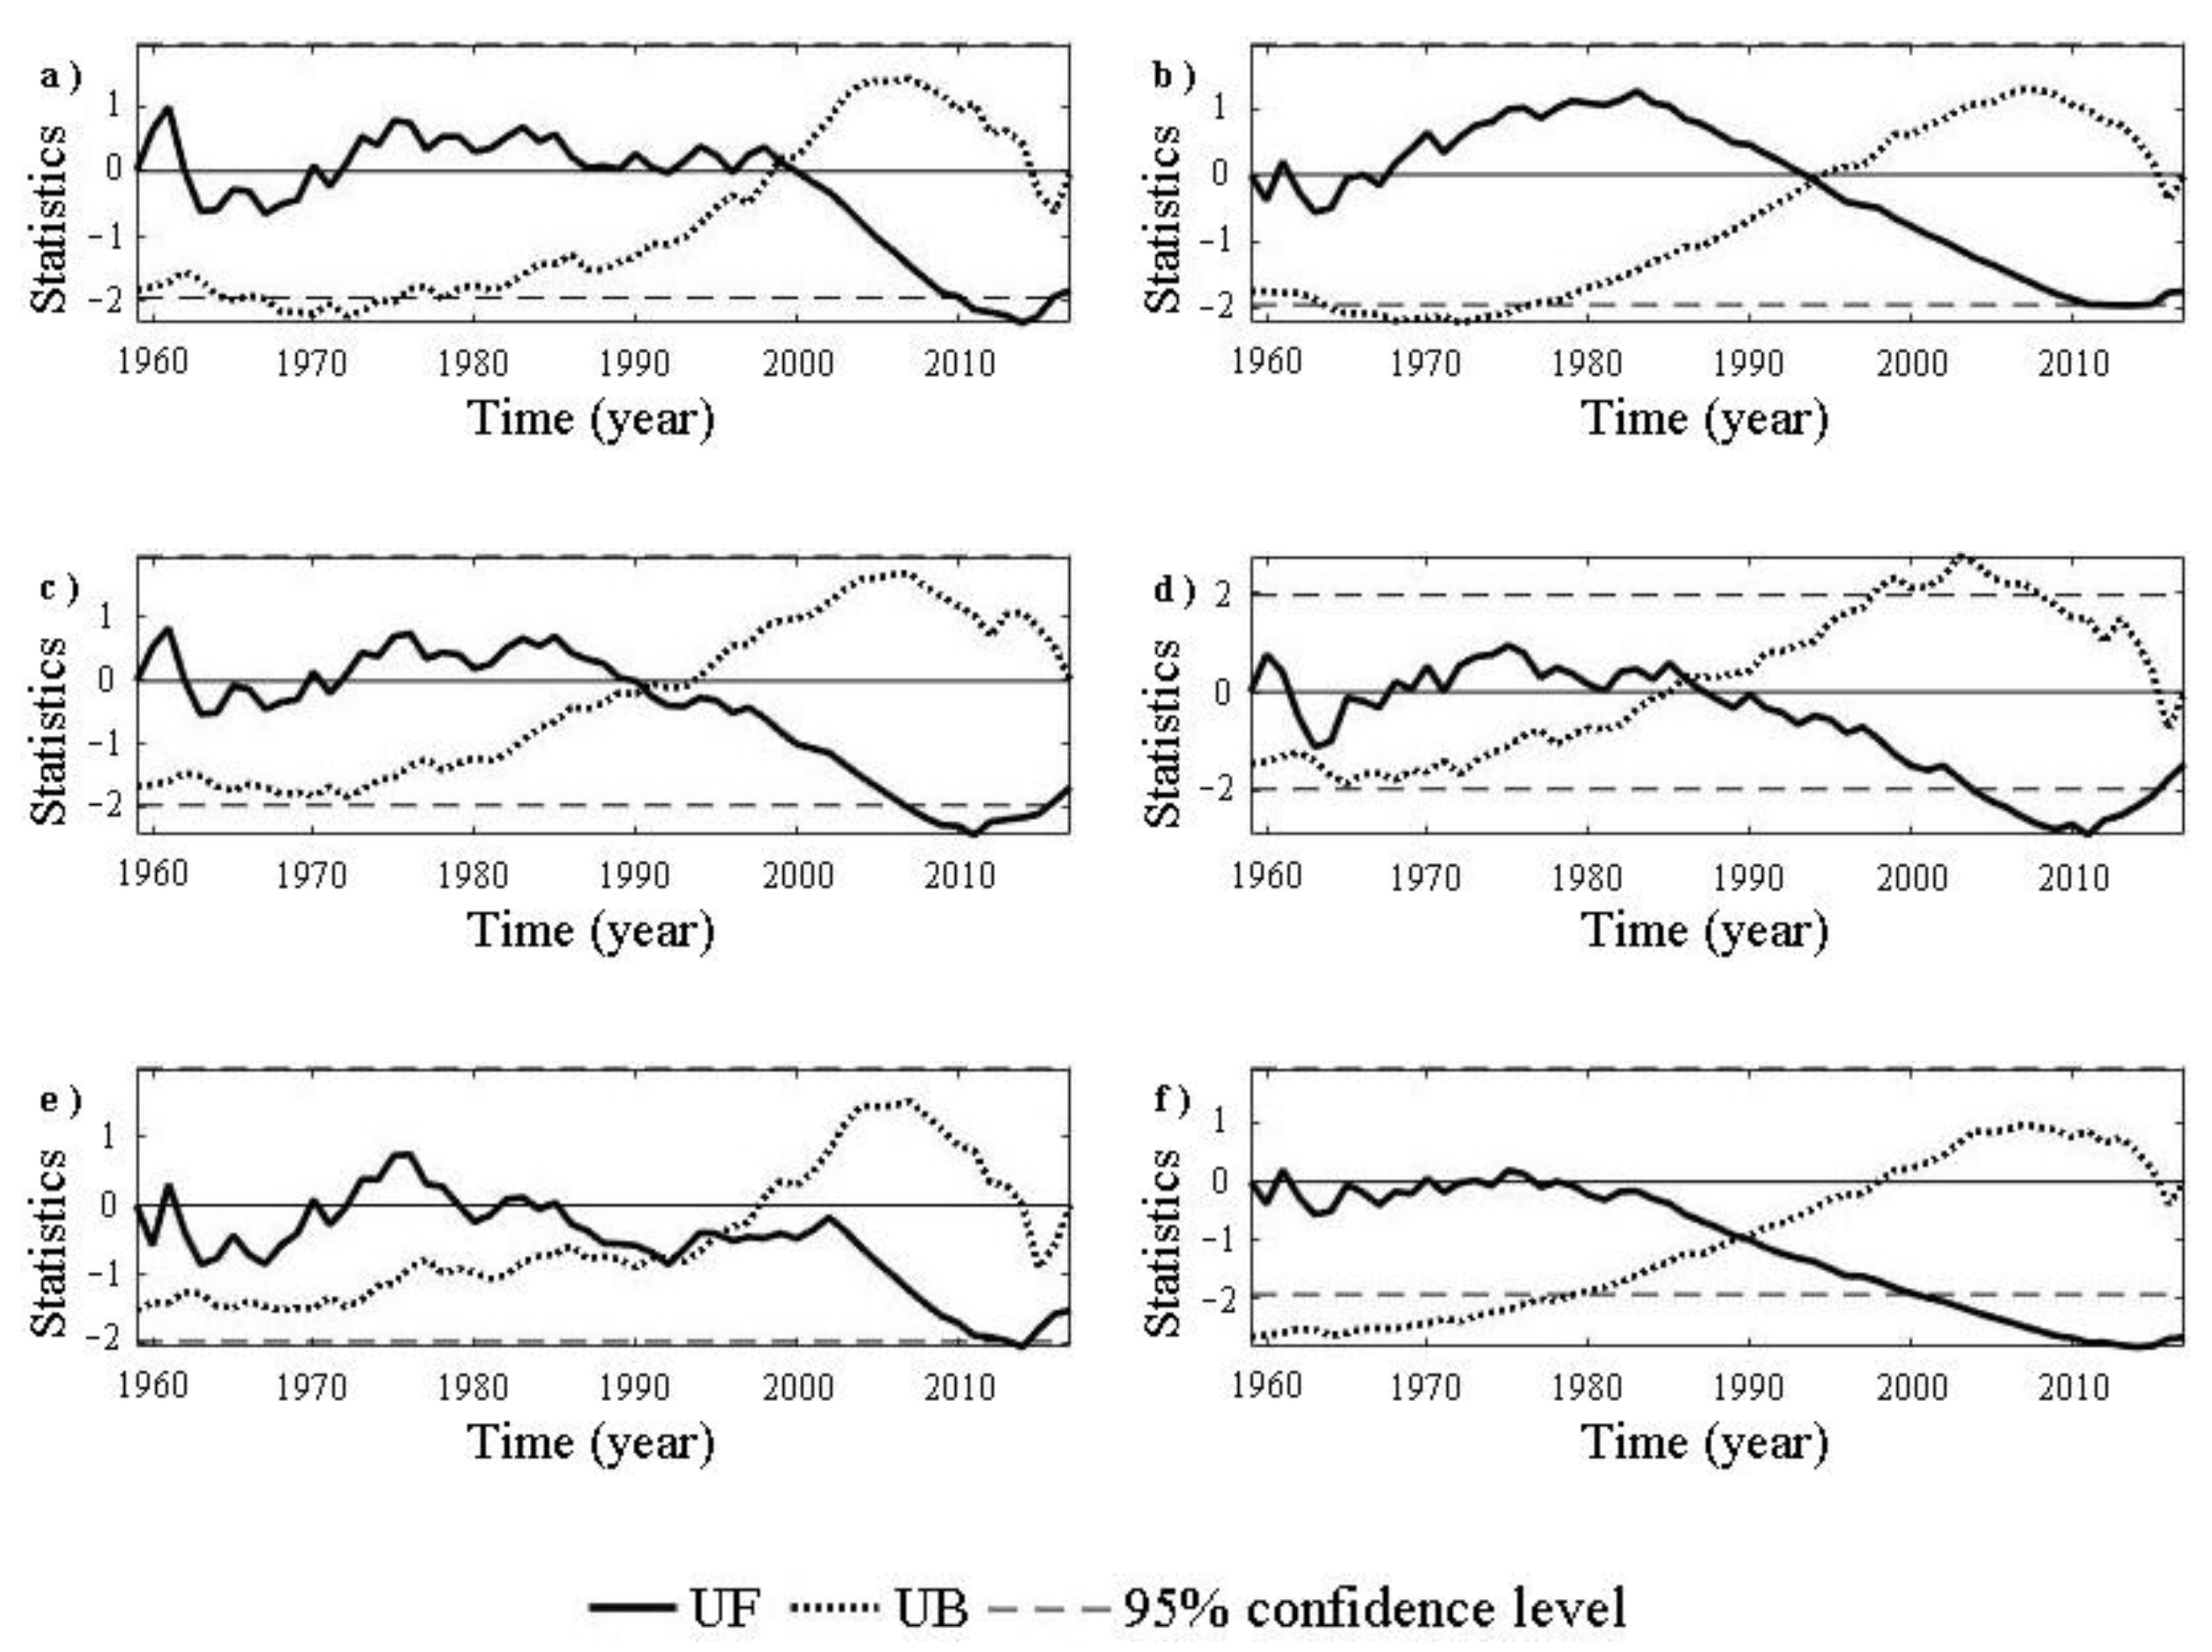
Figure 5.
Continuous wavelet transform of annual mean RH in eastern inland subarea (a), eastern coastal subarea (b), western inland subarea (c), western coastal subarea (d), northern inland subarea (e), and Pearl River Delta subarea (f). (The closed areas of the black thick coils passed the standard red noise test at 95% confidence level. The square cone areas below the black thin solid lines were the cone of influence (COI) areas, and they were the areas where the edge effect of the wavelet transform data were more significant.)
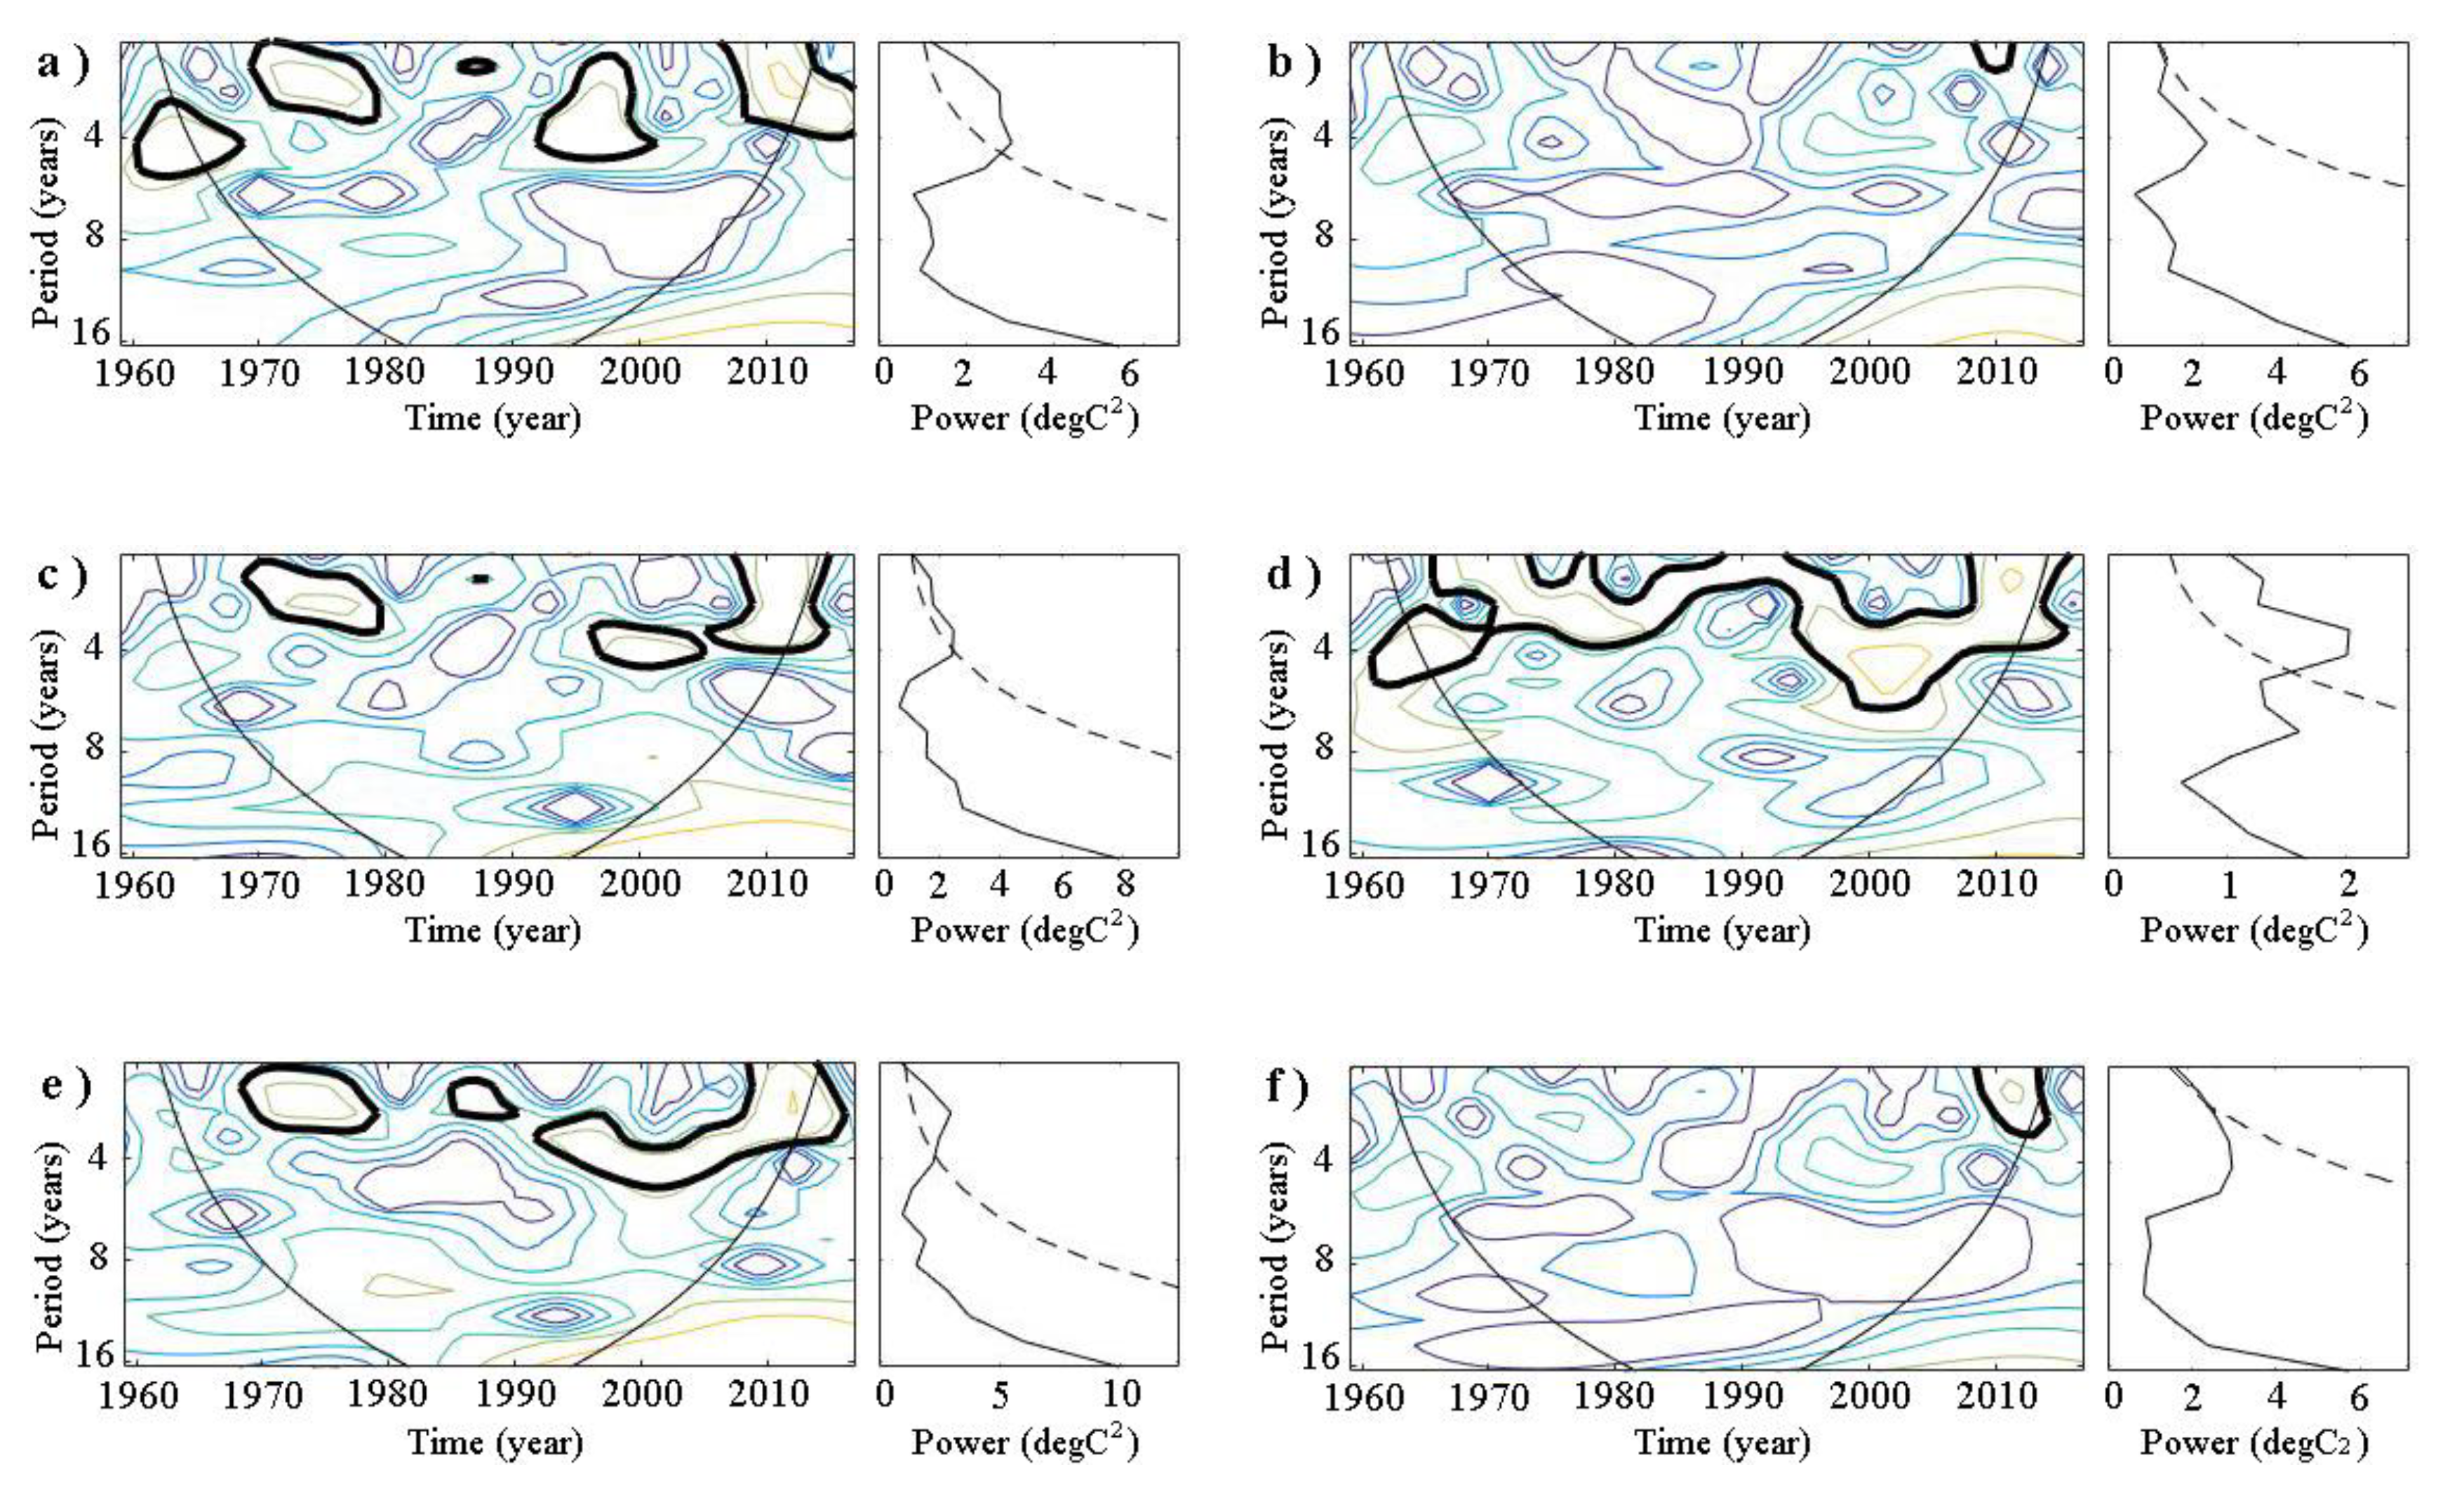
Figure 6.
Spatial distribution of perennial mean (a) and linear trend (b) of RH in Guangdong.

Table 1.
Variance contribution and cumulative variance contribution of the first 6 eigenvectors of rotate empirical orthogonal function (REOF).
Table 1.
Variance contribution and cumulative variance contribution of the first 6 eigenvectors of rotate empirical orthogonal function (REOF).
| Component | 1 | 2 | 3 | 4 | 5 | 6 |
|---|---|---|---|---|---|---|
| Variance contribution (%) | 22.8 | 20.7 | 16.4 | 15.1 | 13.6 | 6.5 |
| Cumulative variance contribution (%) | 22.8 | 43.5 | 59.9 | 75.1 | 88.7 | 95.2 |
Table 2.
Annual mean, linear trend, and Mann–Kendall (M–K) statistics of RH in all subareas and the whole Guangdong province.
Table 2.
Annual mean, linear trend, and Mann–Kendall (M–K) statistics of RH in all subareas and the whole Guangdong province.
| Subarea | Eastern Inland Subarea | Eastern Coastal Subarea | Western Inland Subarea | Western Coastal Subarea | Northern Inland Subarea | Pearl River Delta Subarea | The Whole Province |
|---|---|---|---|---|---|---|---|
| Annual mean (%) | 77.58 | 78.81 | 80.28 | 81.37 | 77.51 | 77.85 | 78.90 |
| Linear trend (%/10a) | −0.452 | −0.868 | −0.469 | −0.207 | −0.350 | −1.349 | −0.678 |
| M-K statistics | −2.91 | −4.57 | −3.13 | −1.92 | −2.71 | −6.73 | −4.42 |
Table 3.
Mutation time and significant variation trend of RH based on Mann–Kendall test.
| Subarea | Eastern Inland Subarea | Eastern Coastal Subarea | Western Inland Subarea | Western Coastal Subarea | Northern Inland Subarea | Pearl River Delta Subarea |
|---|---|---|---|---|---|---|
| Mutation time (year) | 1999 | 1994 | 1991 | 1986 | 1992 | 1990 |
| Significant period | 2010–2016 | 2011–2015 | 2007–2016 | 2004–2015 | 2013–2014 | 2000–2017 |
| Variation trend | decline | decline | decline | decline | decline | decline |
Table 4.
Significant oscillation cycles and corresponding periods of continuous wavelet transforms of annual mean RH in each subarea in Guangdong.
Table 4.
Significant oscillation cycles and corresponding periods of continuous wavelet transforms of annual mean RH in each subarea in Guangdong.
| Subarea | Significant Cycles (a) | Corresponding Periods | Subarea | Significant Cycles (a) | Corresponding Periods |
|---|---|---|---|---|---|
| Eastern inland subarea | 2∼3.5 | 1969–1979 | Eastern coastal subarea | 2.1∼2.3 | 2008–2011 |
| 2.3∼4.5 | 1992–2001 | ||||
| 2∼3.7 | 2007–2013 | ||||
| Western inland subarea | 2.1∼3.5 | 1969–1980 | Western coastal subarea | 2∼4 | 1964–2015 |
| 3.5∼4.5 | 1997–2004 | 4∼5.1 | 1996–2007 | ||
| 2∼4 | 2008–2015 | ||||
| Northern inland subarea | 2.1∼3.3 | 1968–1979 | Pearl River Delta subarea | 2∼3 | 2009–2014 |
| 2.3∼2.7 | 1985–1990 | ||||
| 2.7∼4.5 | 1992–2008 | ||||
| 2∼3.5 | 2008–2015 |
Publisher’s Note: MDPI stays neutral with regard to jurisdictional claims in published maps and institutional affiliations. |
© 2020 by the authors. Licensee MDPI, Basel, Switzerland. This article is an open access article distributed under the terms and conditions of the Creative Commons Attribution (CC BY) license (http://creativecommons.org/licenses/by/4.0/).
Share and Cite
MDPI and ACS Style
Liu, Z.; Yang, H.; Wei, X. Spatiotemporal Variation in Relative Humidity in Guangdong, China, from 1959 to 2017. Water 2020, 12, 3576. https://doi.org/10.3390/w12123576
AMA Style
Liu Z, Yang H, Wei X. Spatiotemporal Variation in Relative Humidity in Guangdong, China, from 1959 to 2017. Water. 2020; 12(12):3576. https://doi.org/10.3390/w12123576
Chicago/Turabian StyleLiu, Zhanming, Hong Yang, and Xinghu Wei. 2020. "Spatiotemporal Variation in Relative Humidity in Guangdong, China, from 1959 to 2017" Water 12, no. 12: 3576. https://doi.org/10.3390/w12123576
Note that from the first issue of 2016, this journal uses article numbers instead of page numbers. See further details here.