Geophysical Characterization of Hydraulic Properties around a Managed Aquifer Recharge System over the Llobregat River Alluvial Aquifer (Barcelona Metropolitan Area)

 ,
,  ,
, 

Abstract
1. Introduction
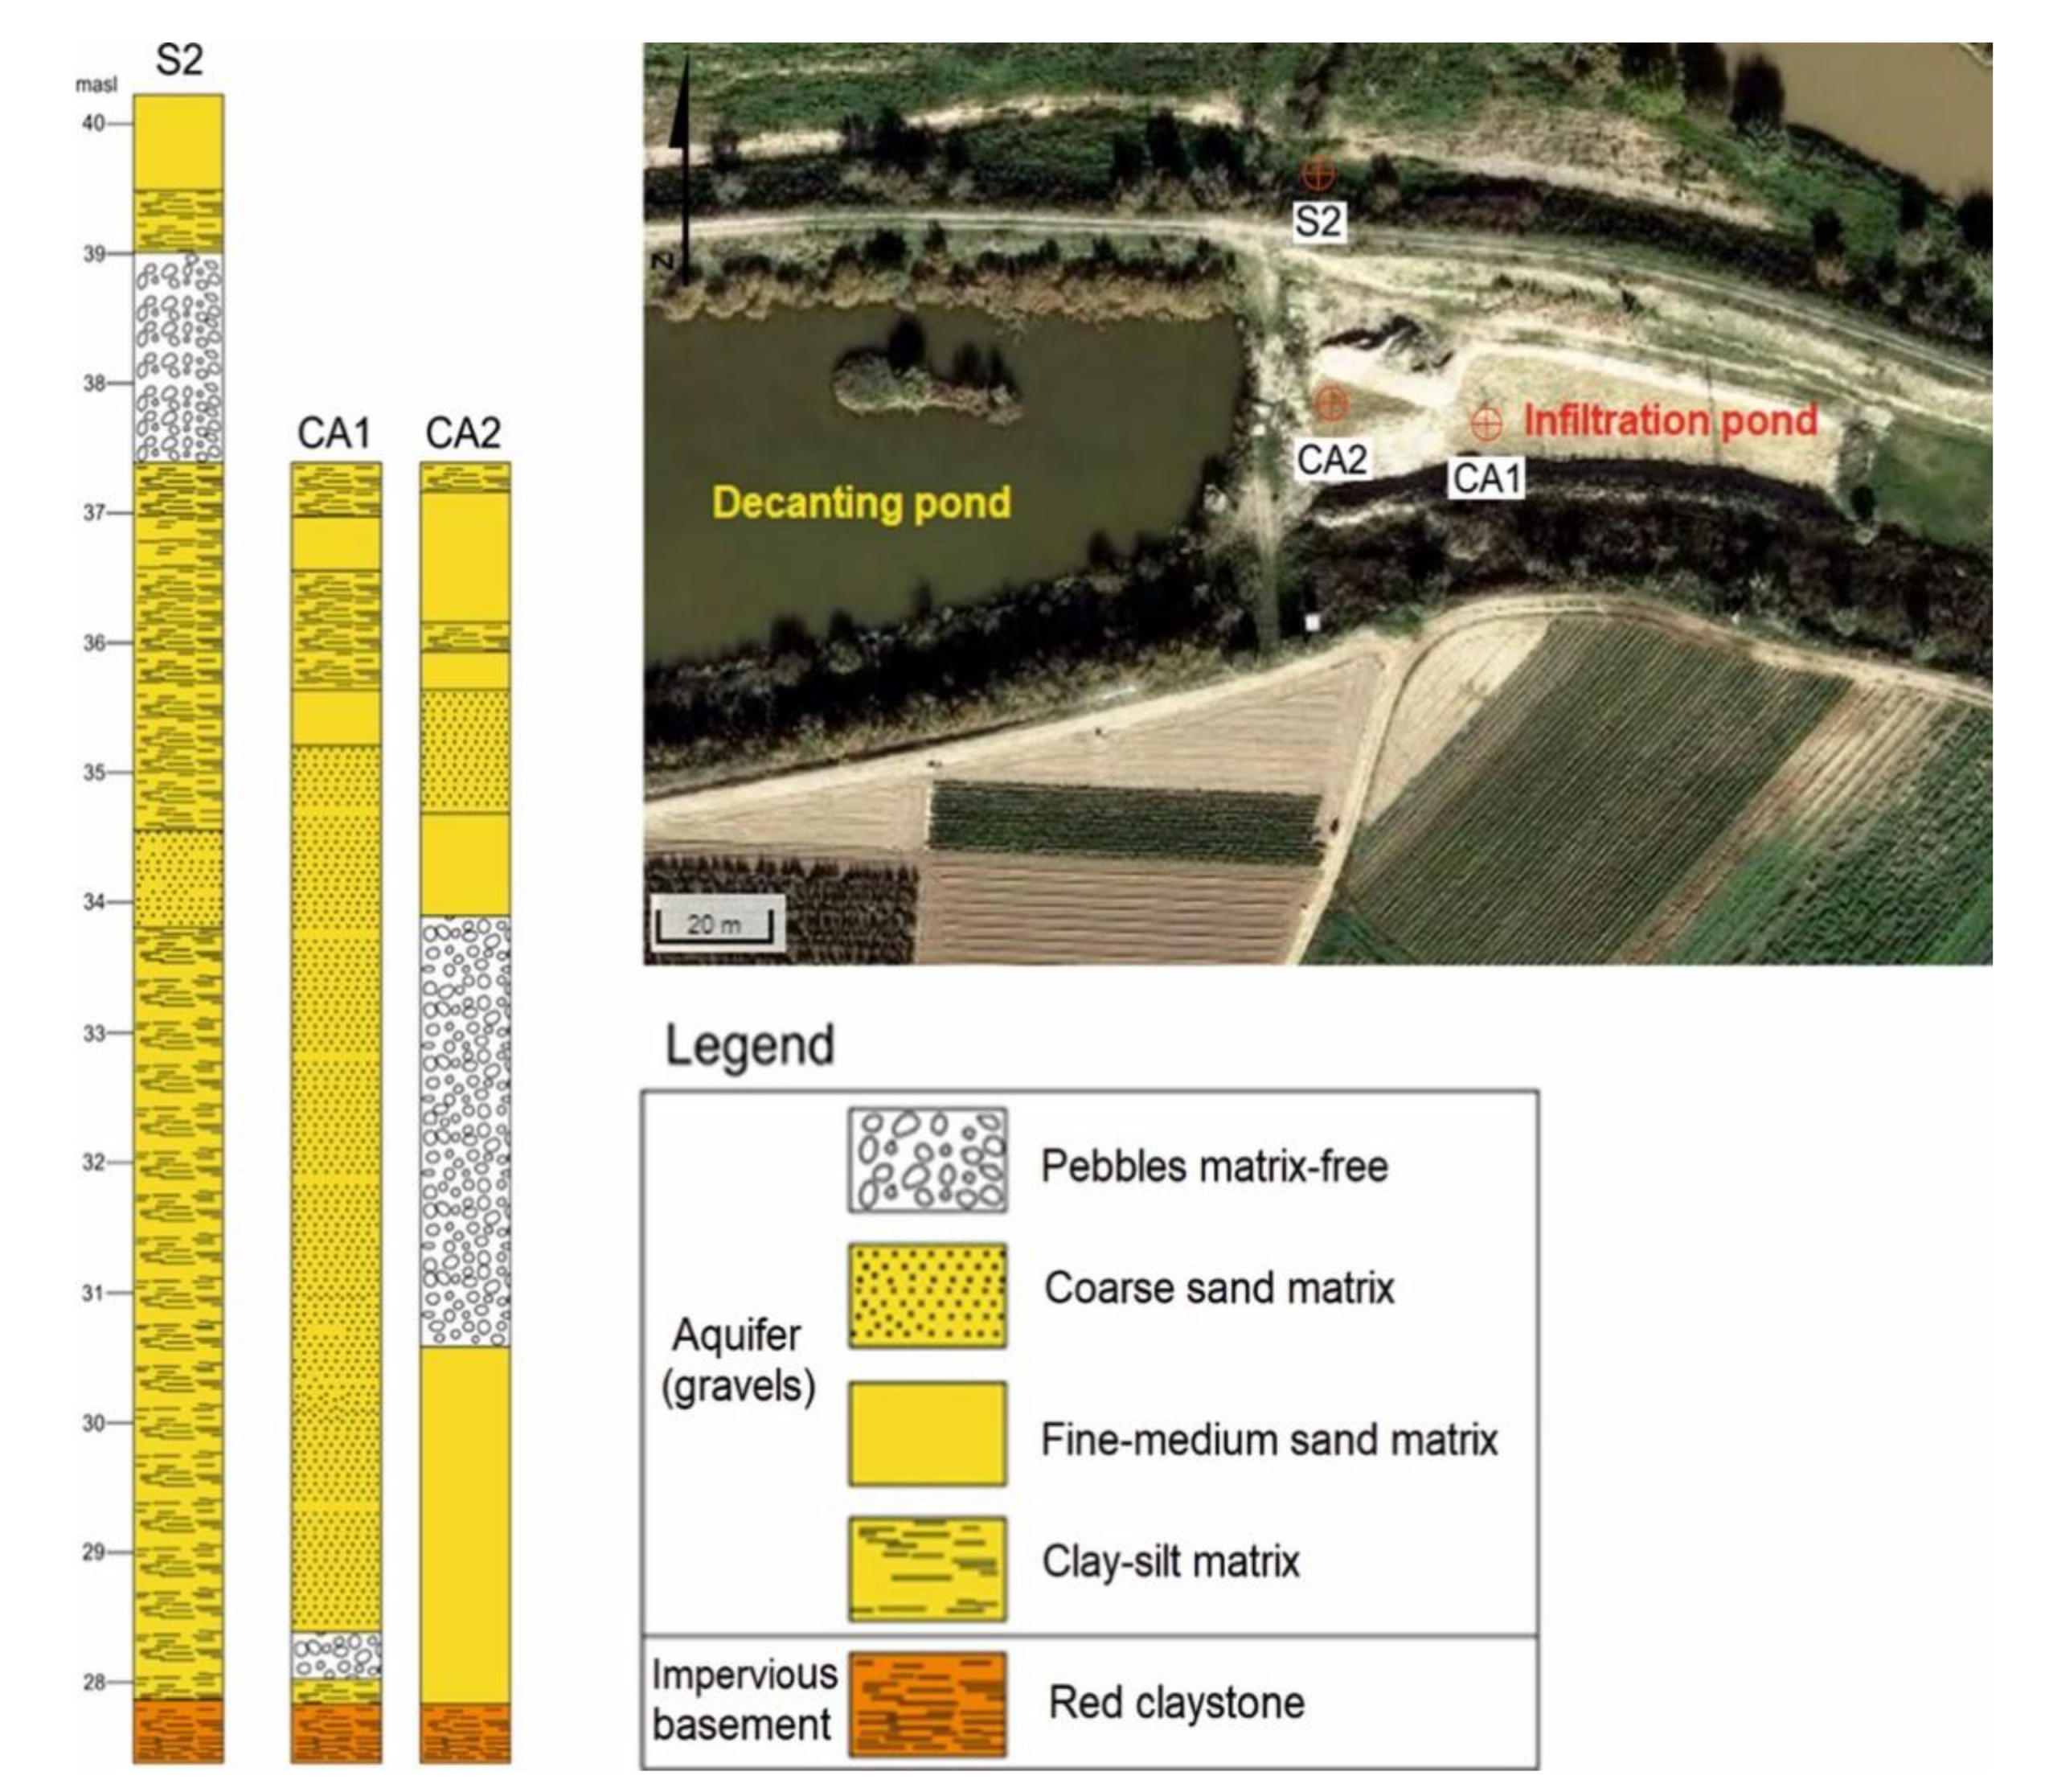
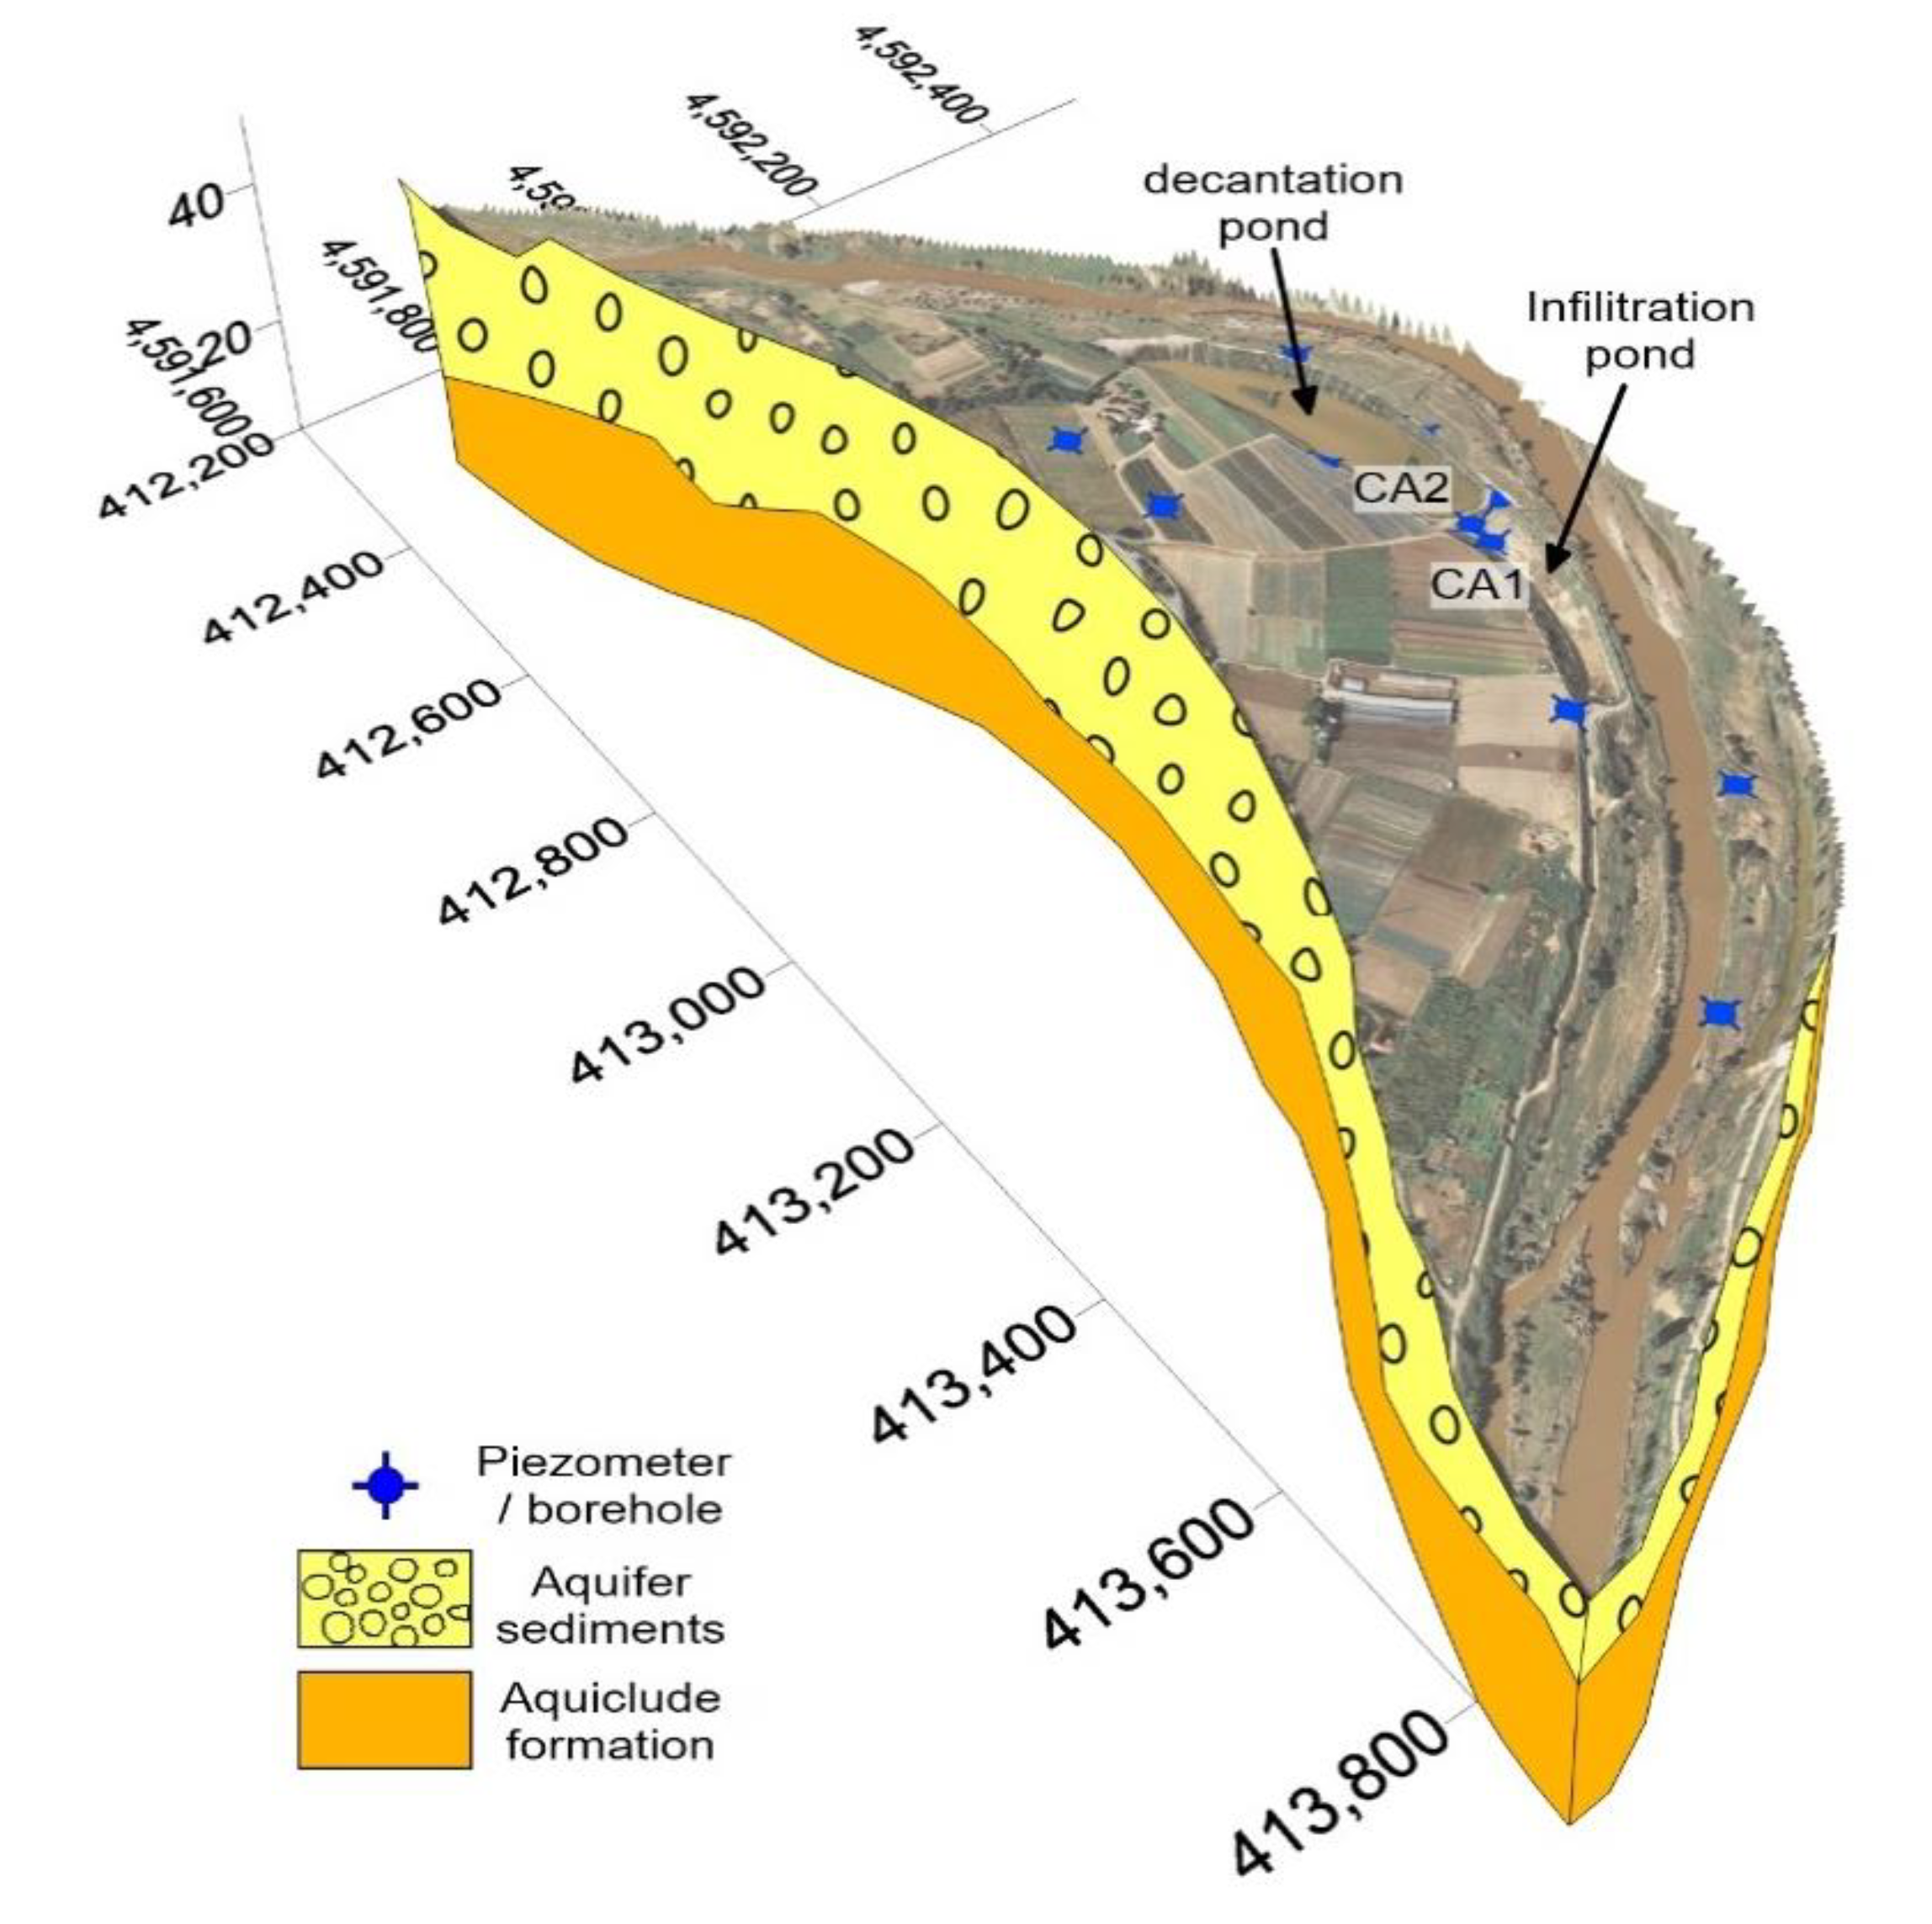
2. Site Description
3. Materials and Methods
3.1. Geophysical Surveys
3.2. Infiltration Rate
3.3. Assessment of Aquifer Recharge
4. Results
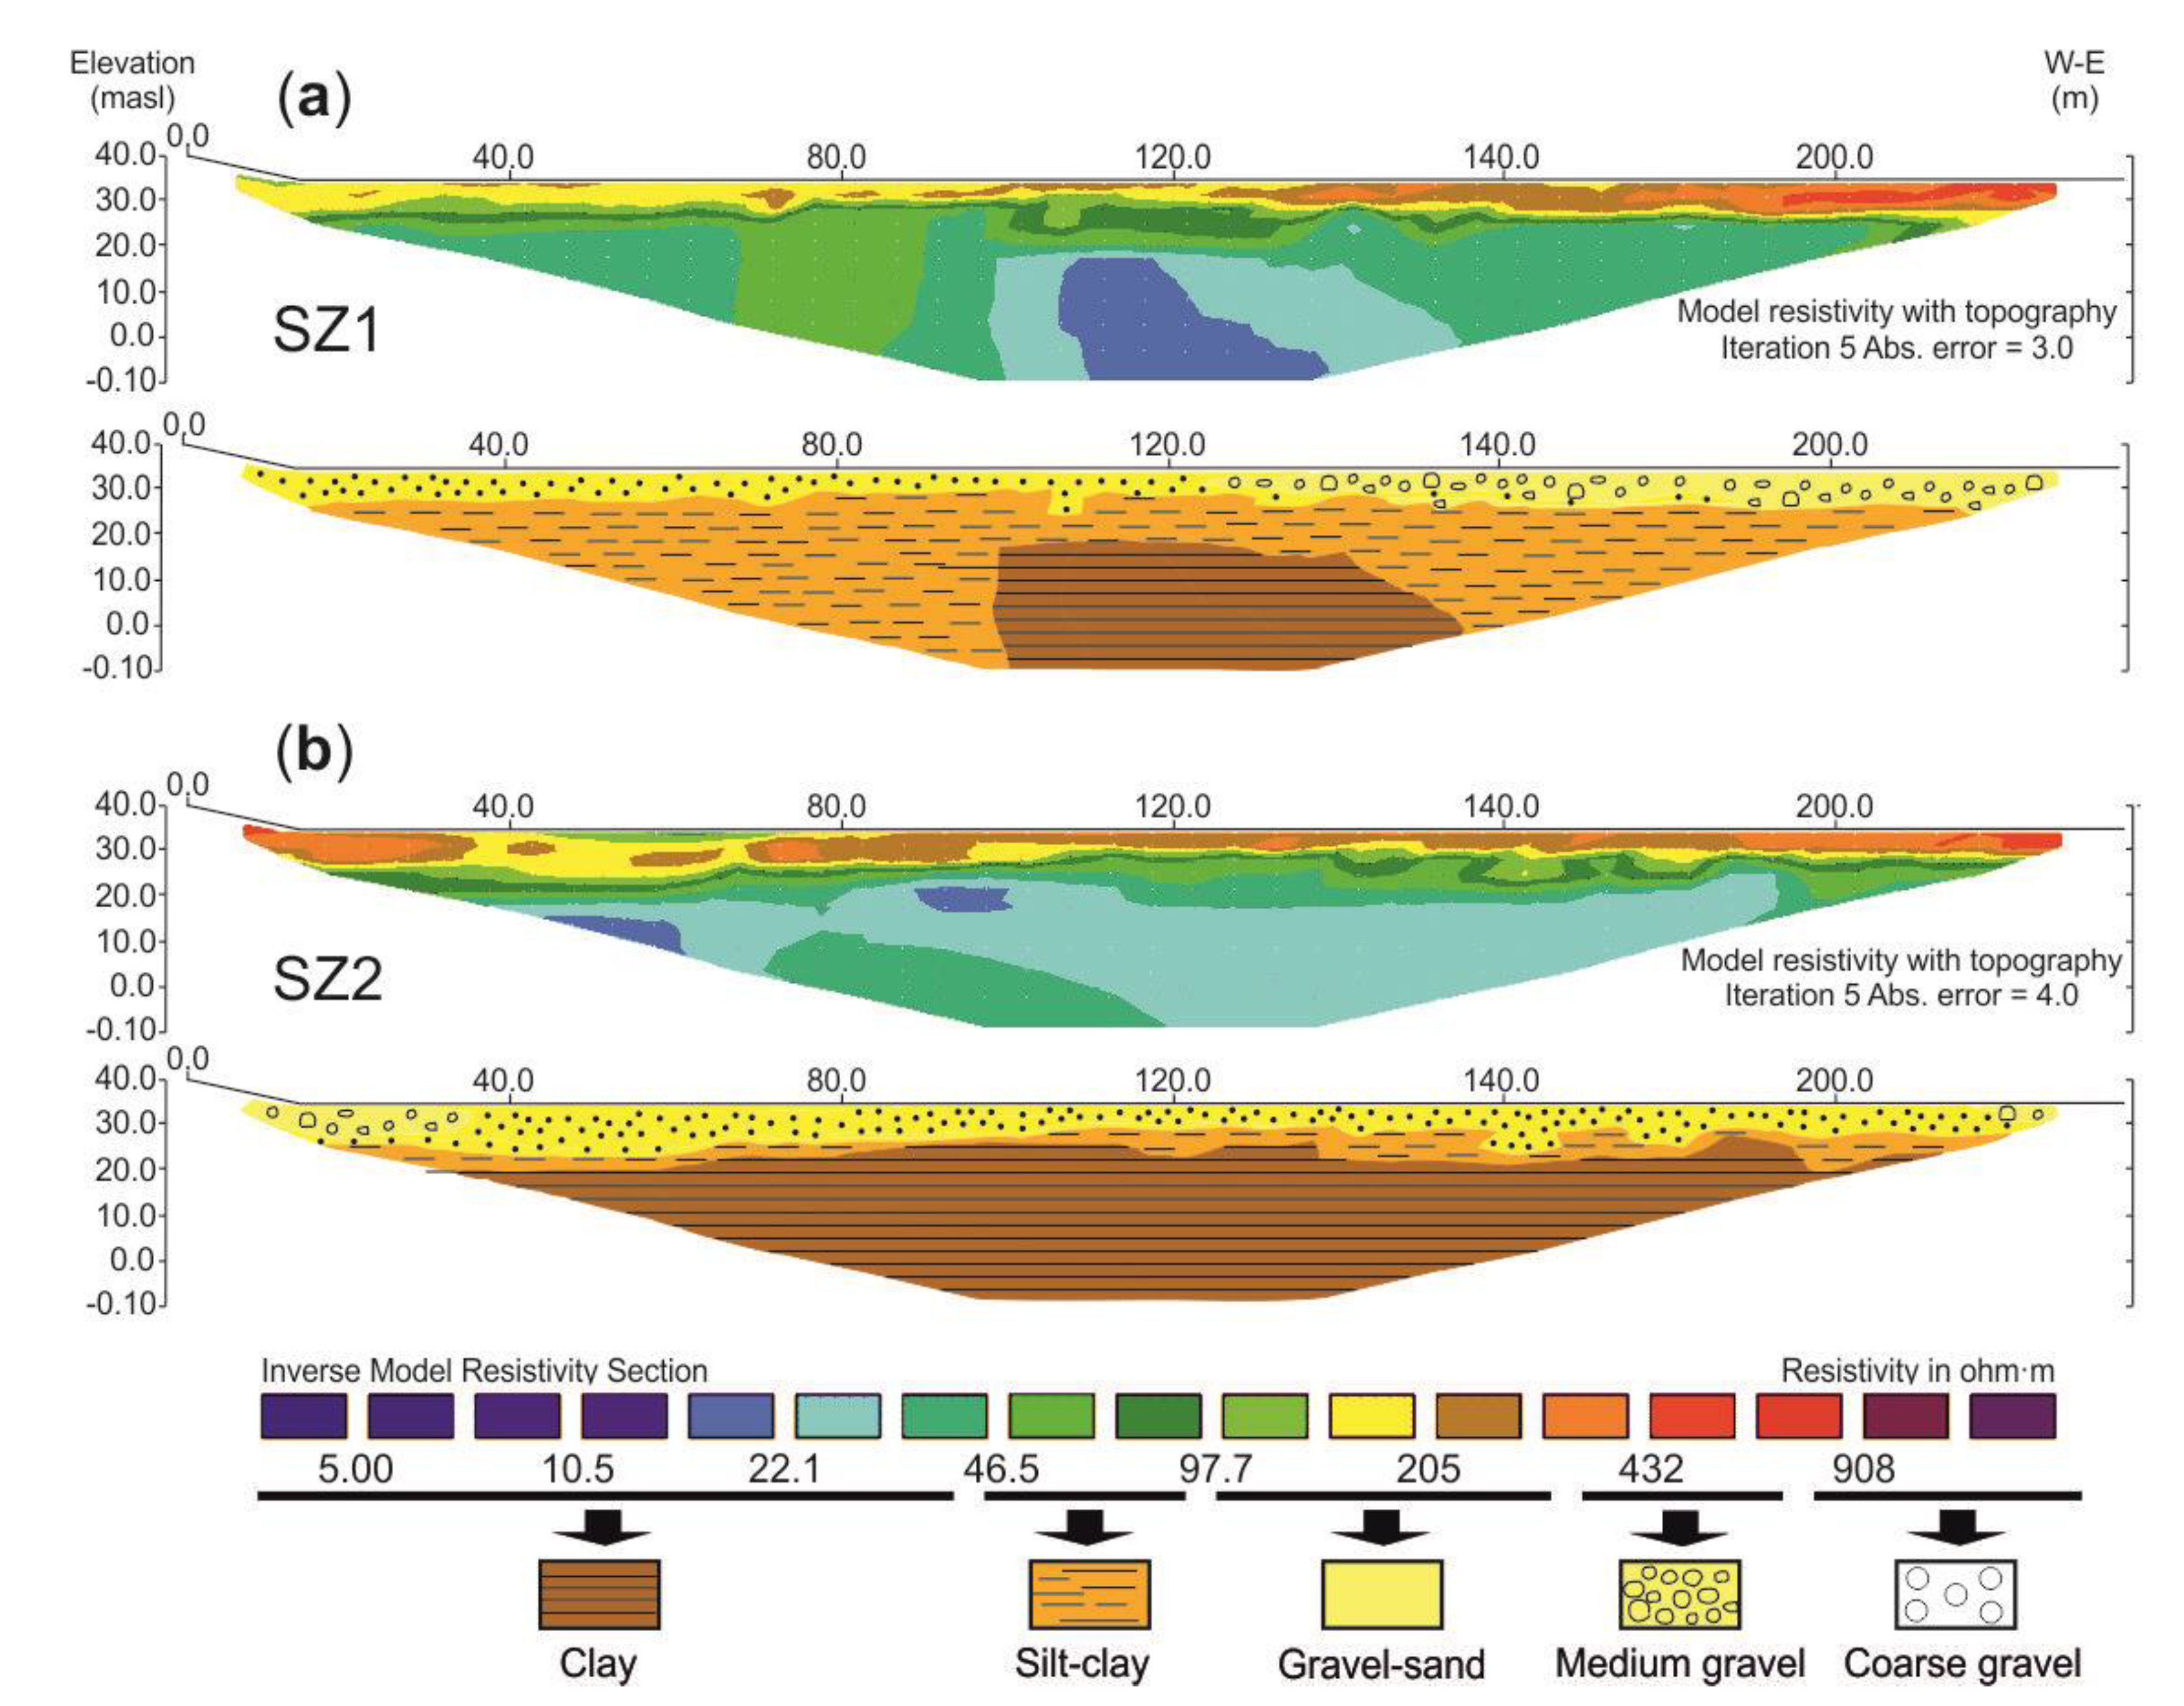
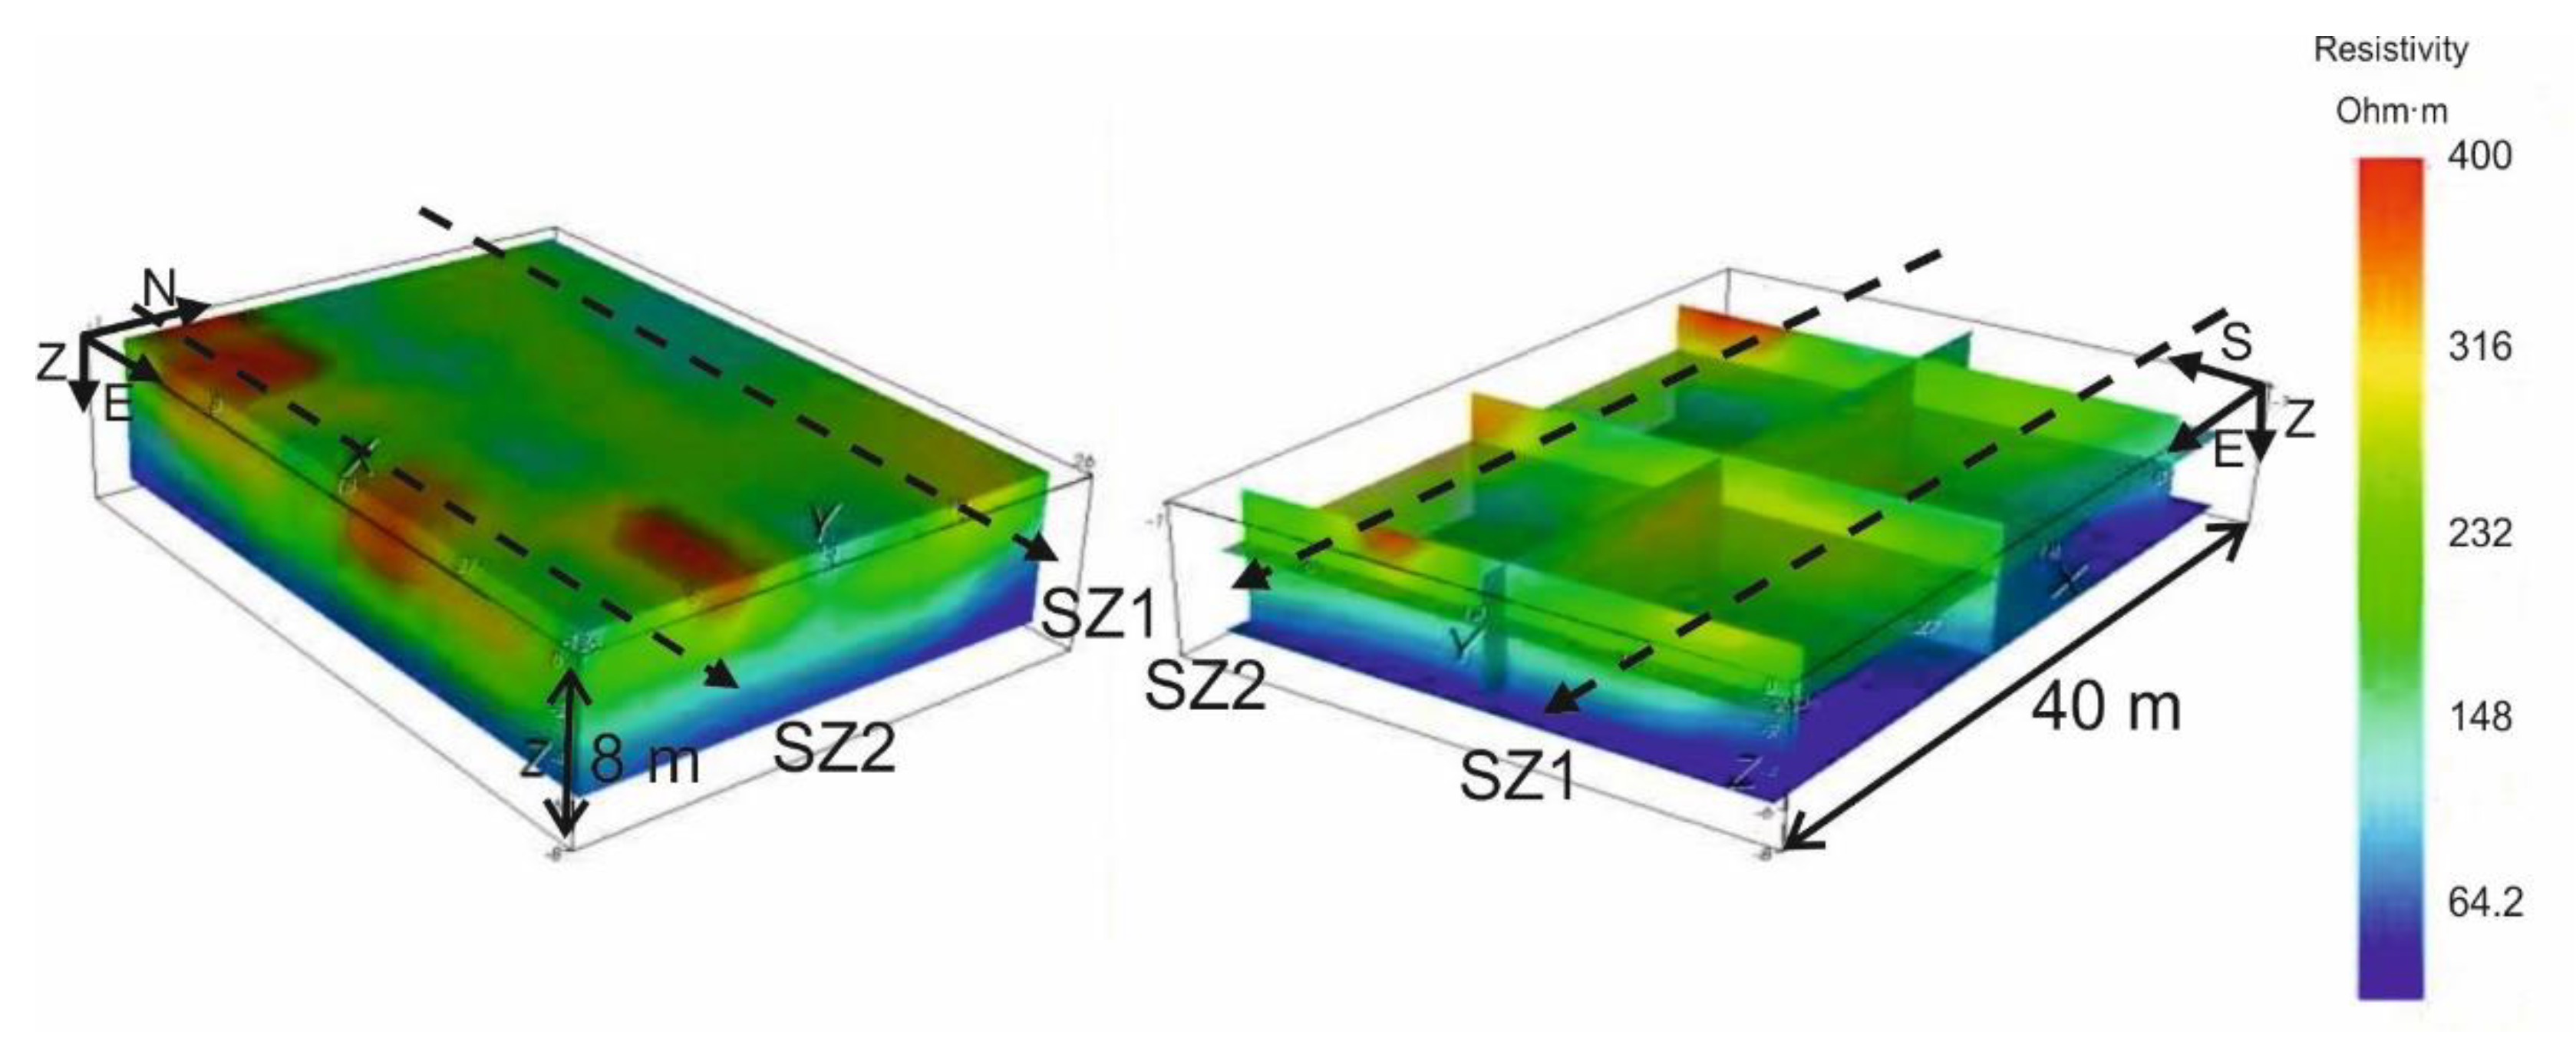
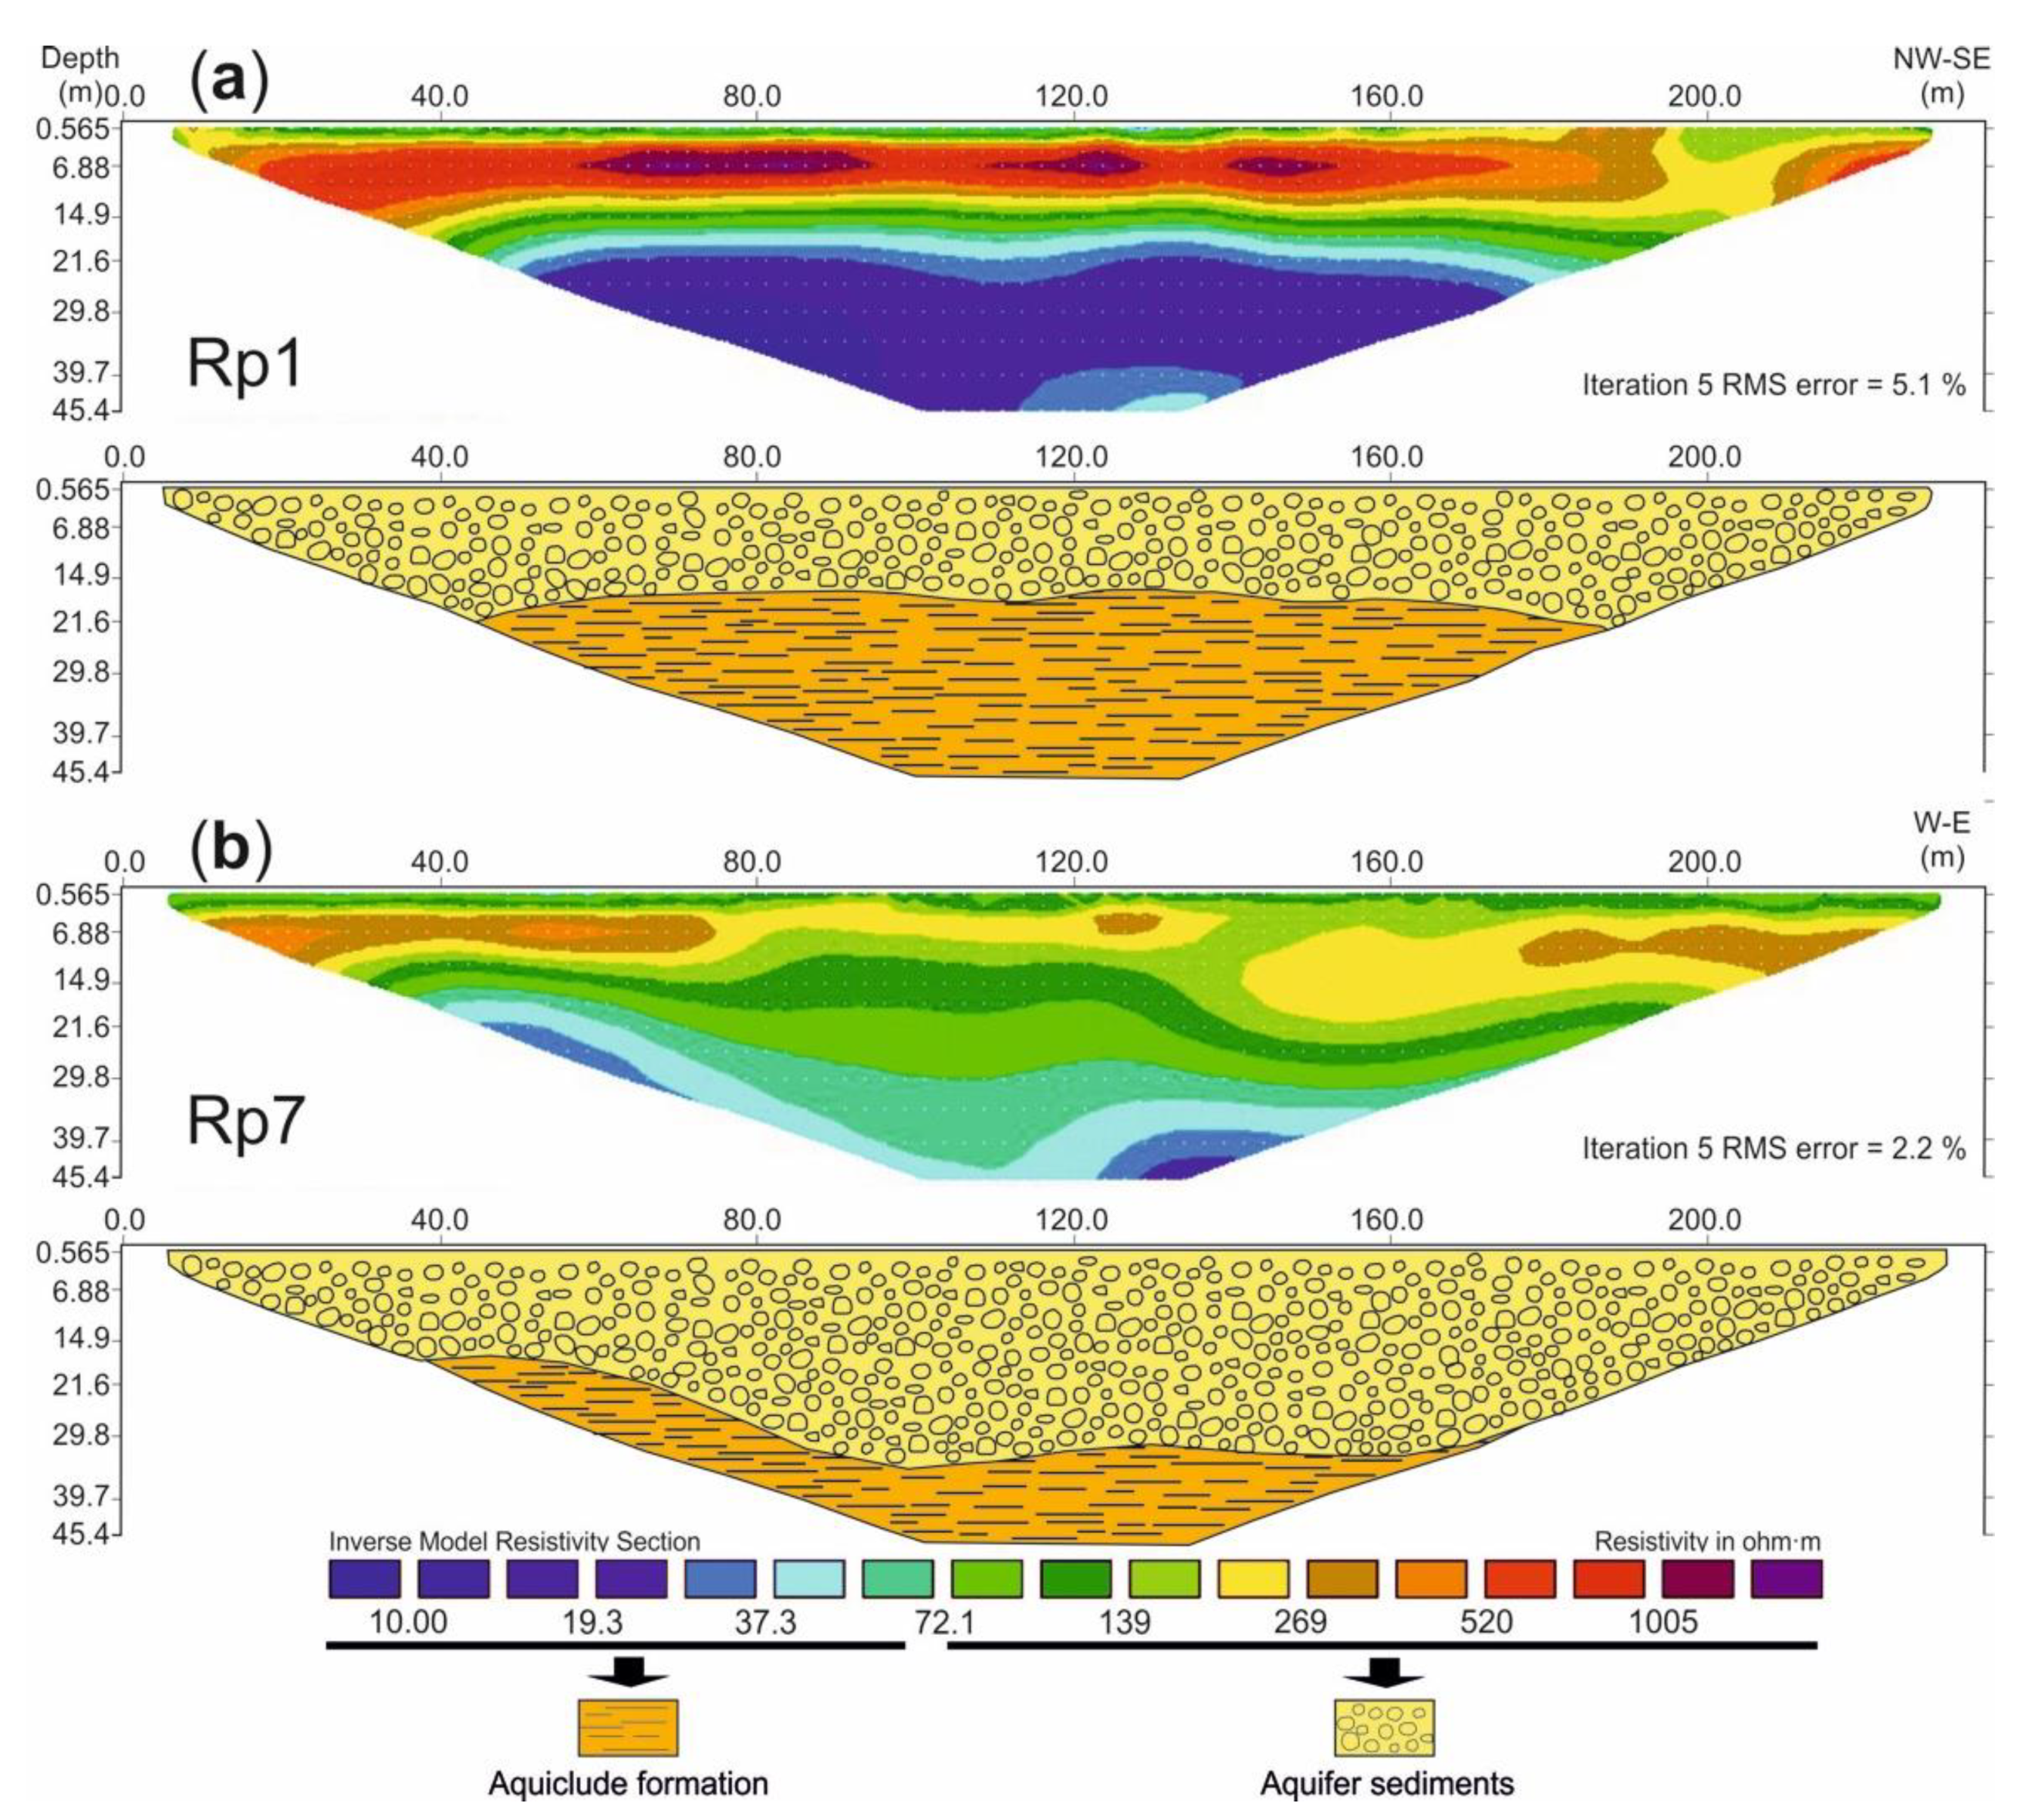
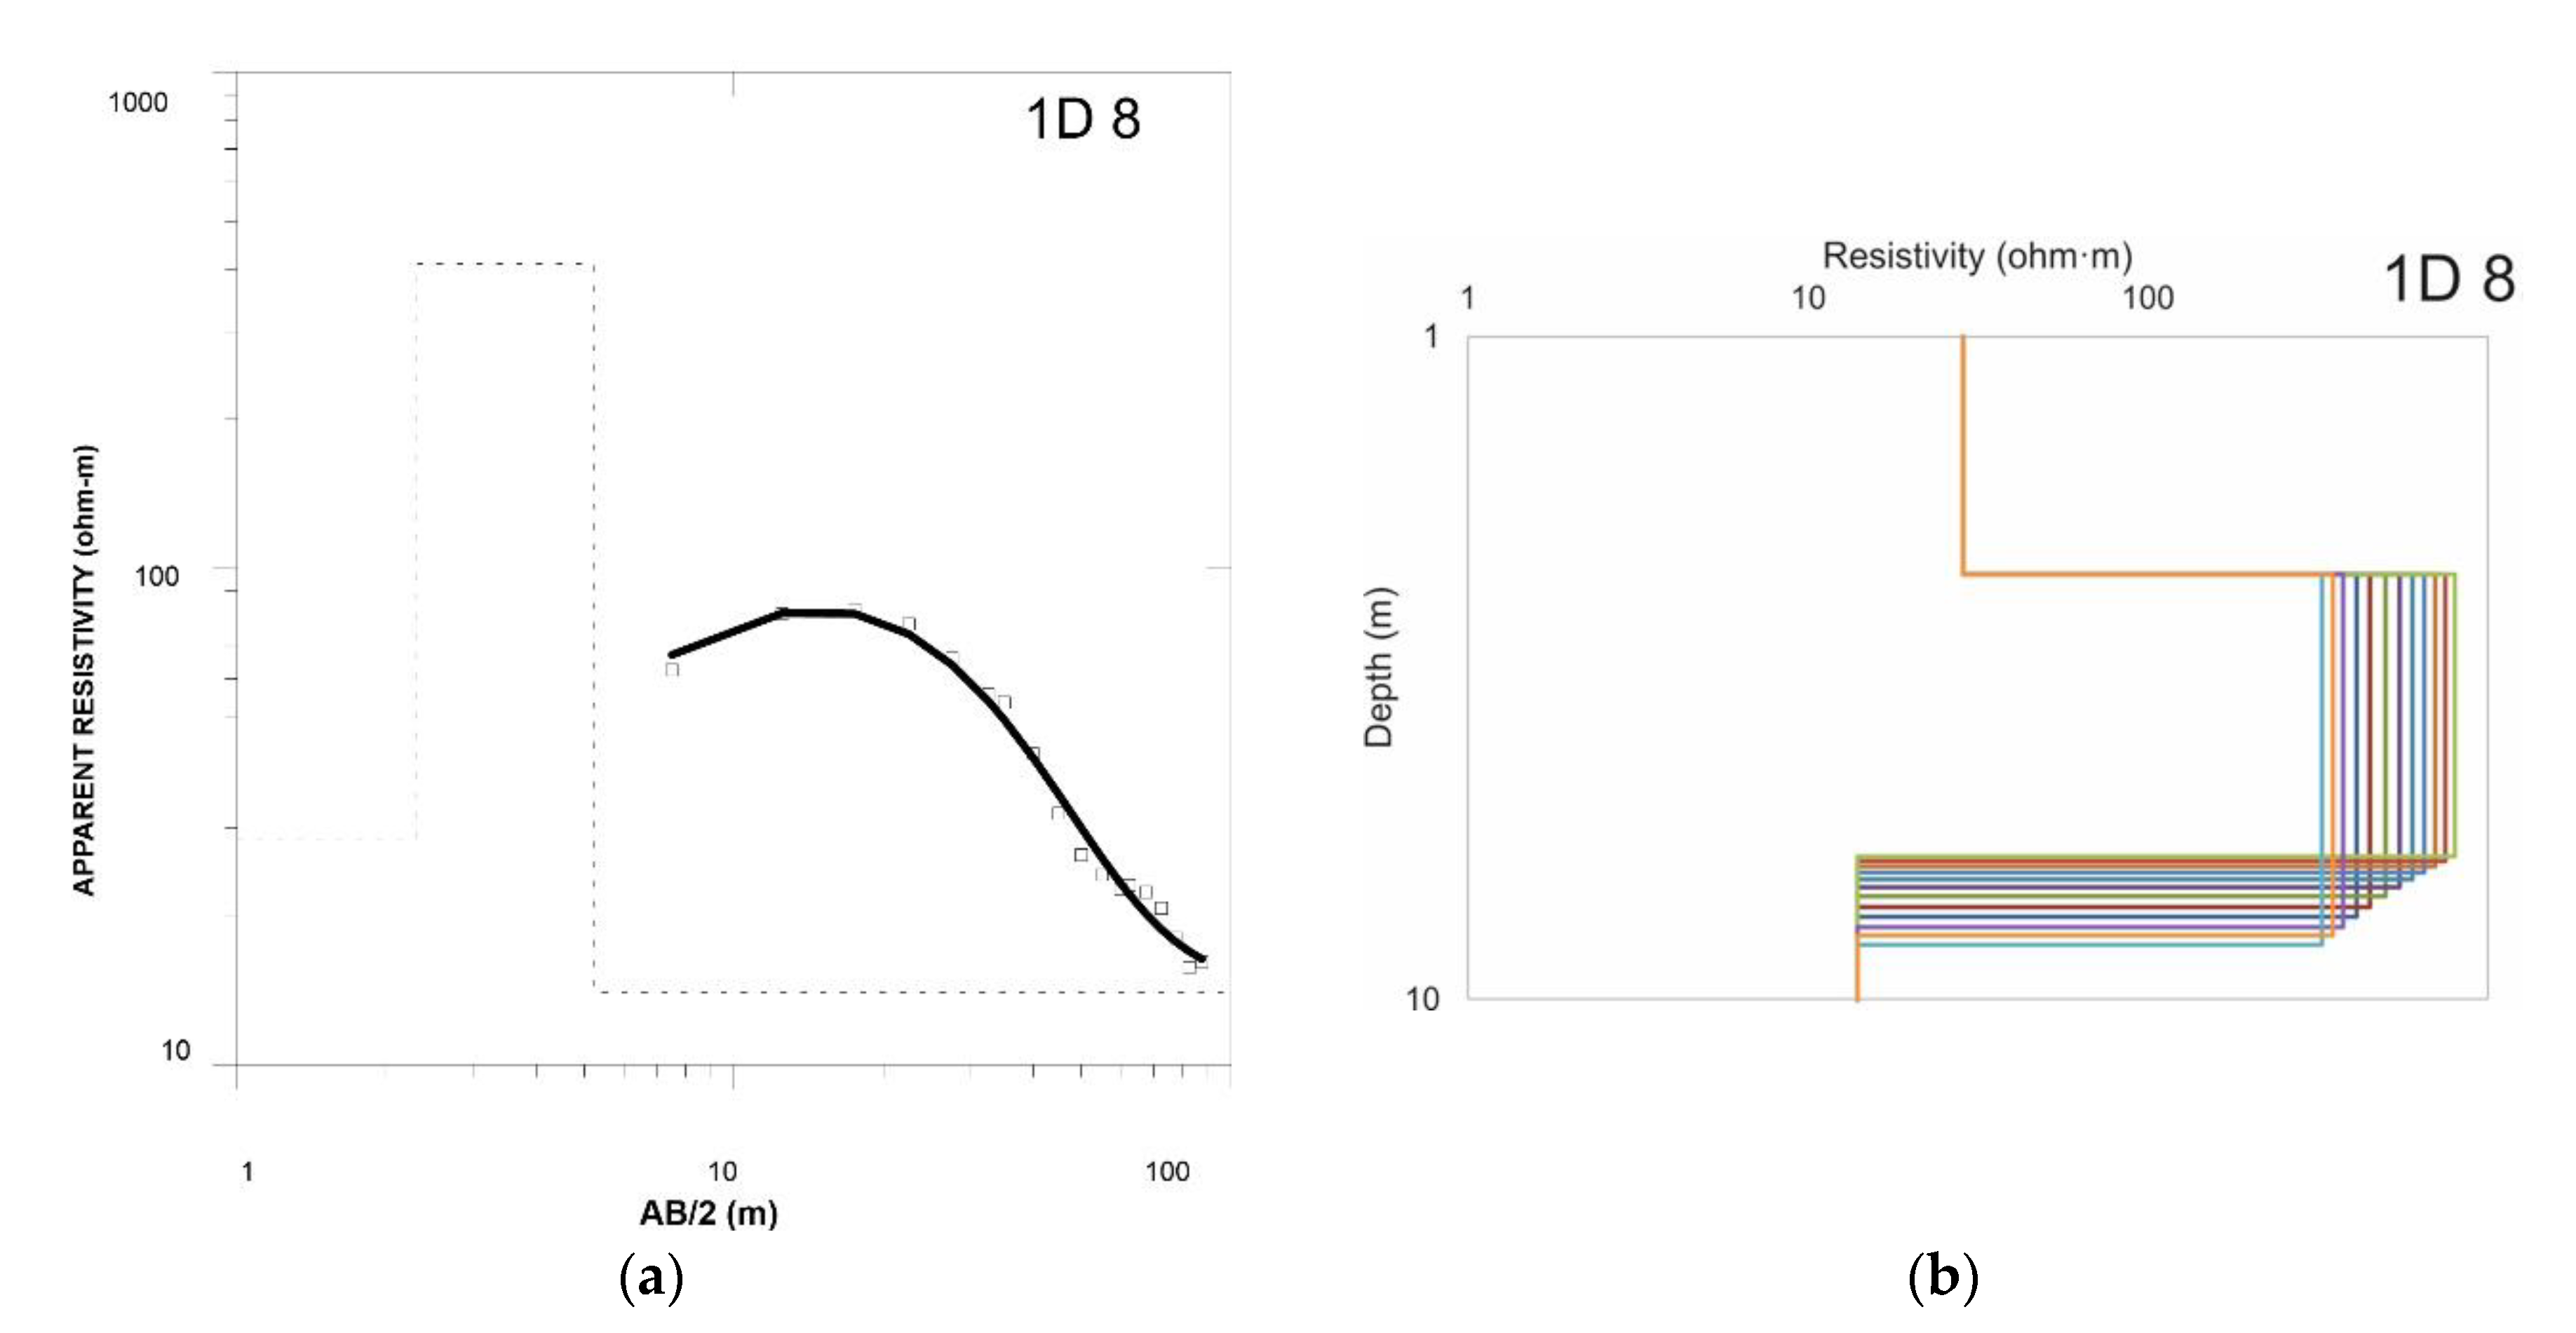
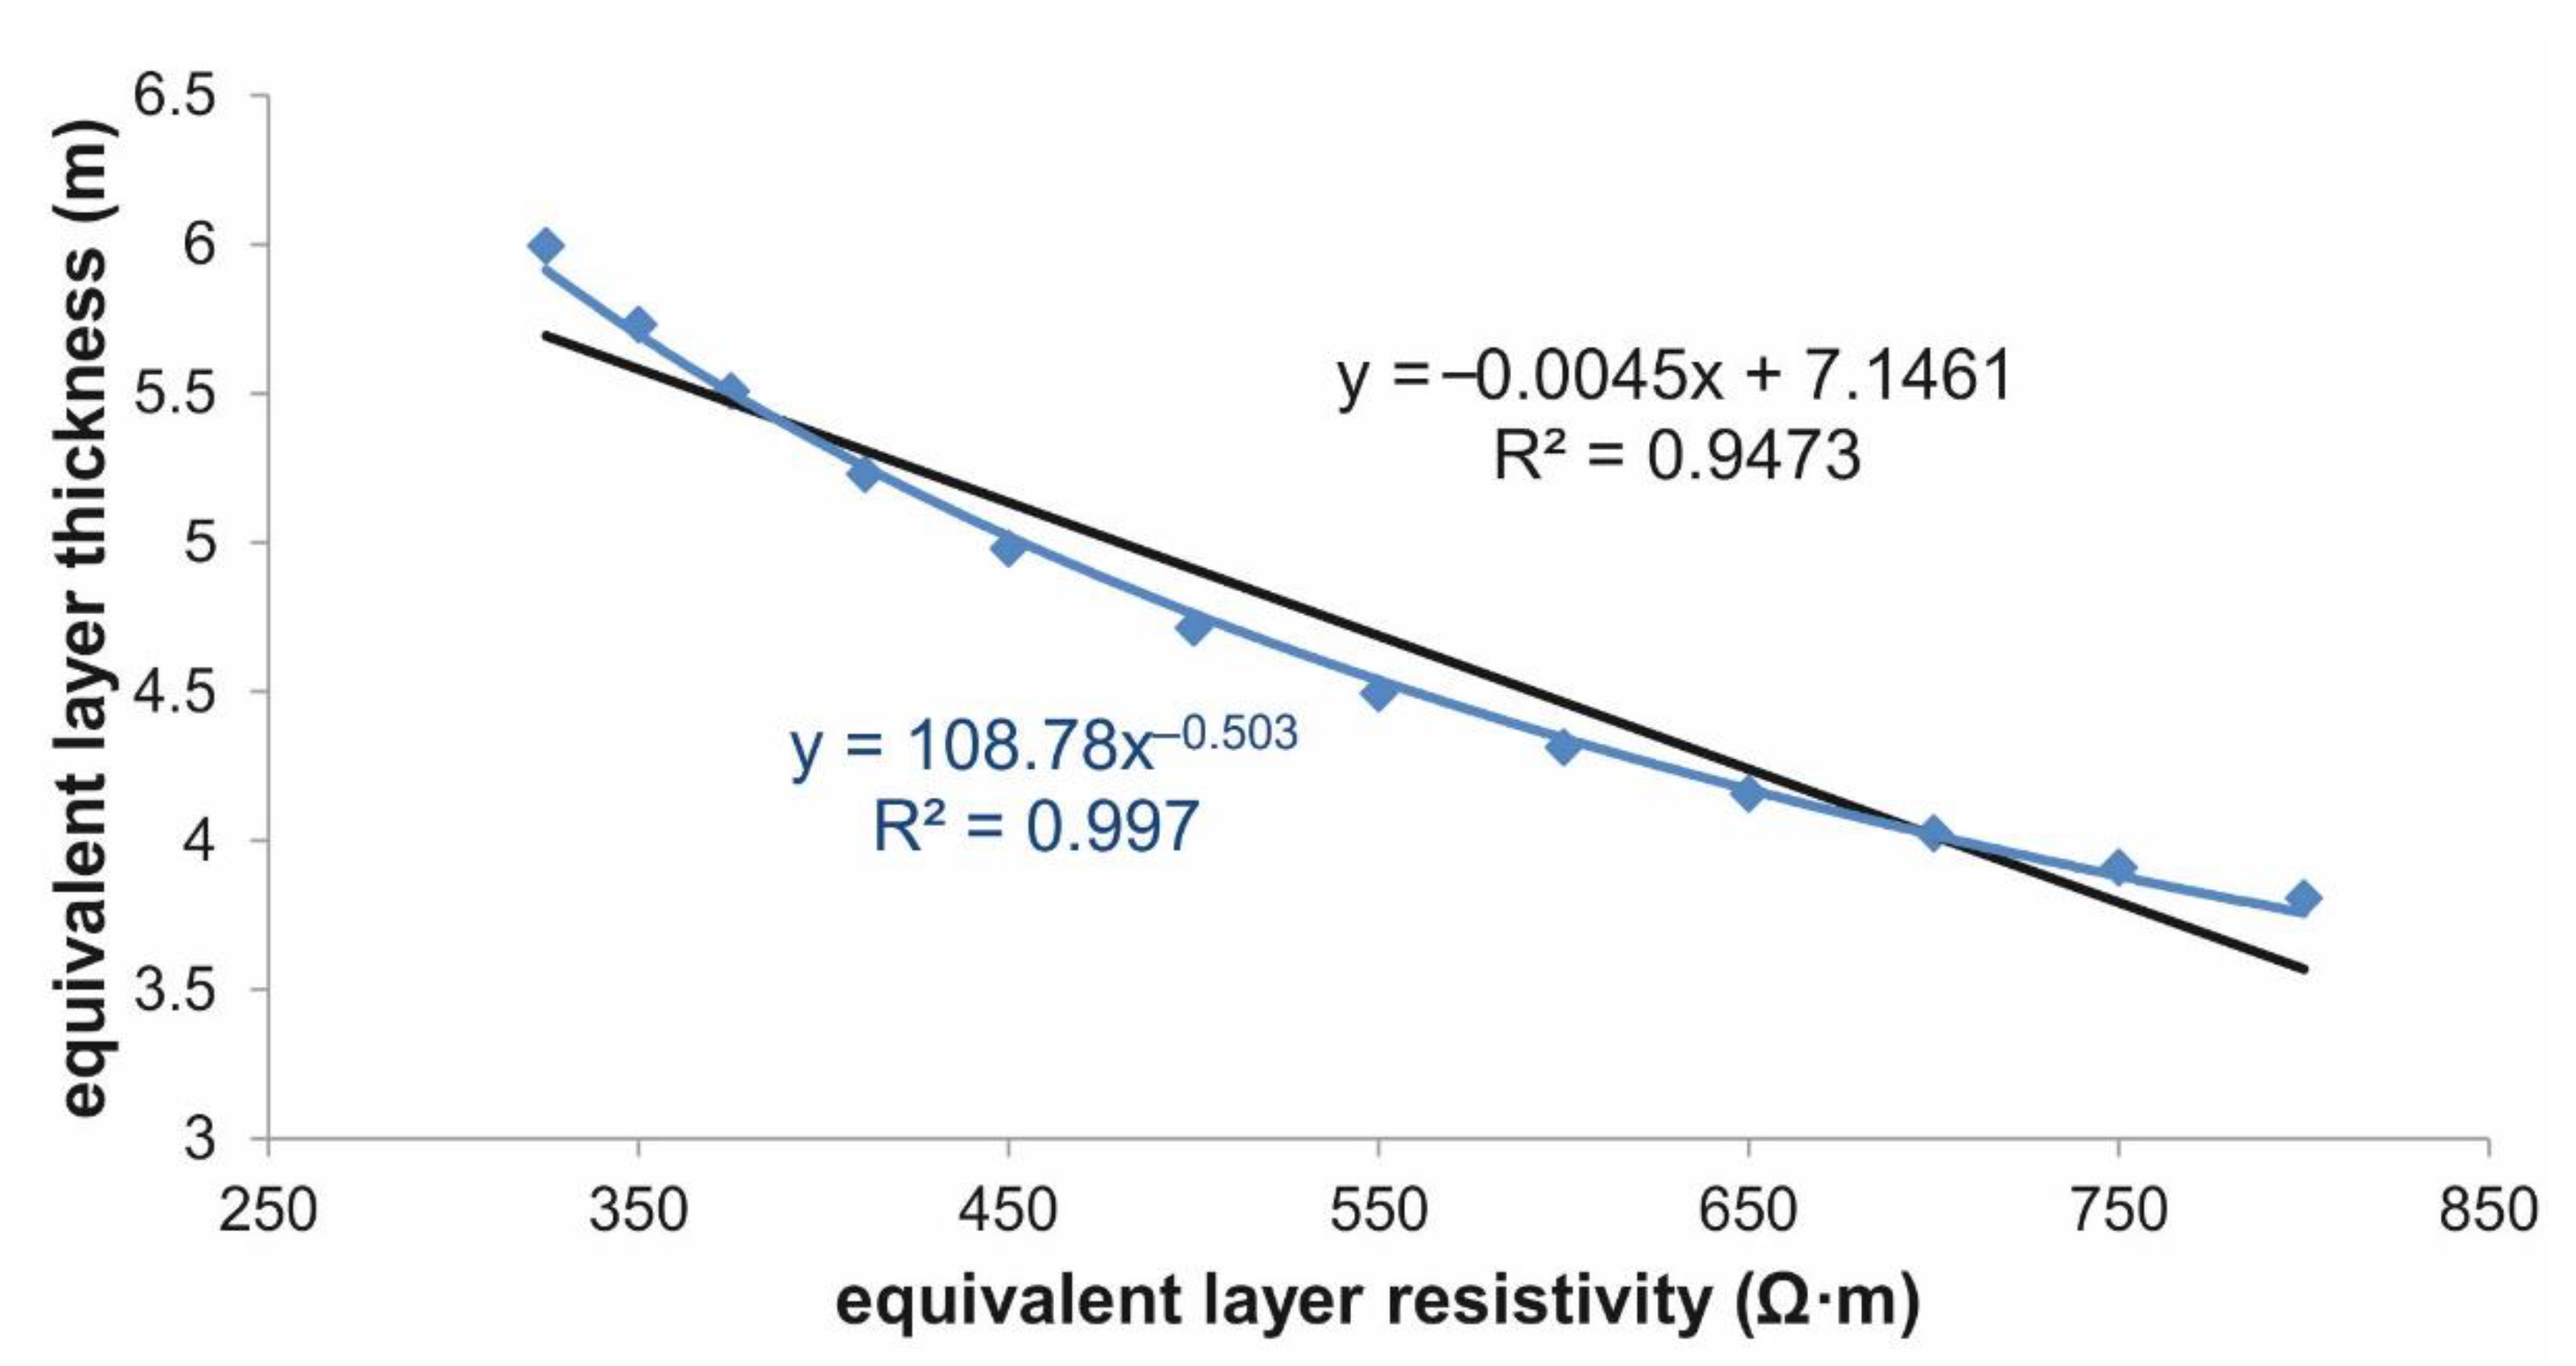
4.1. Geophysical Characterization of the Saturated Zone (SZ)
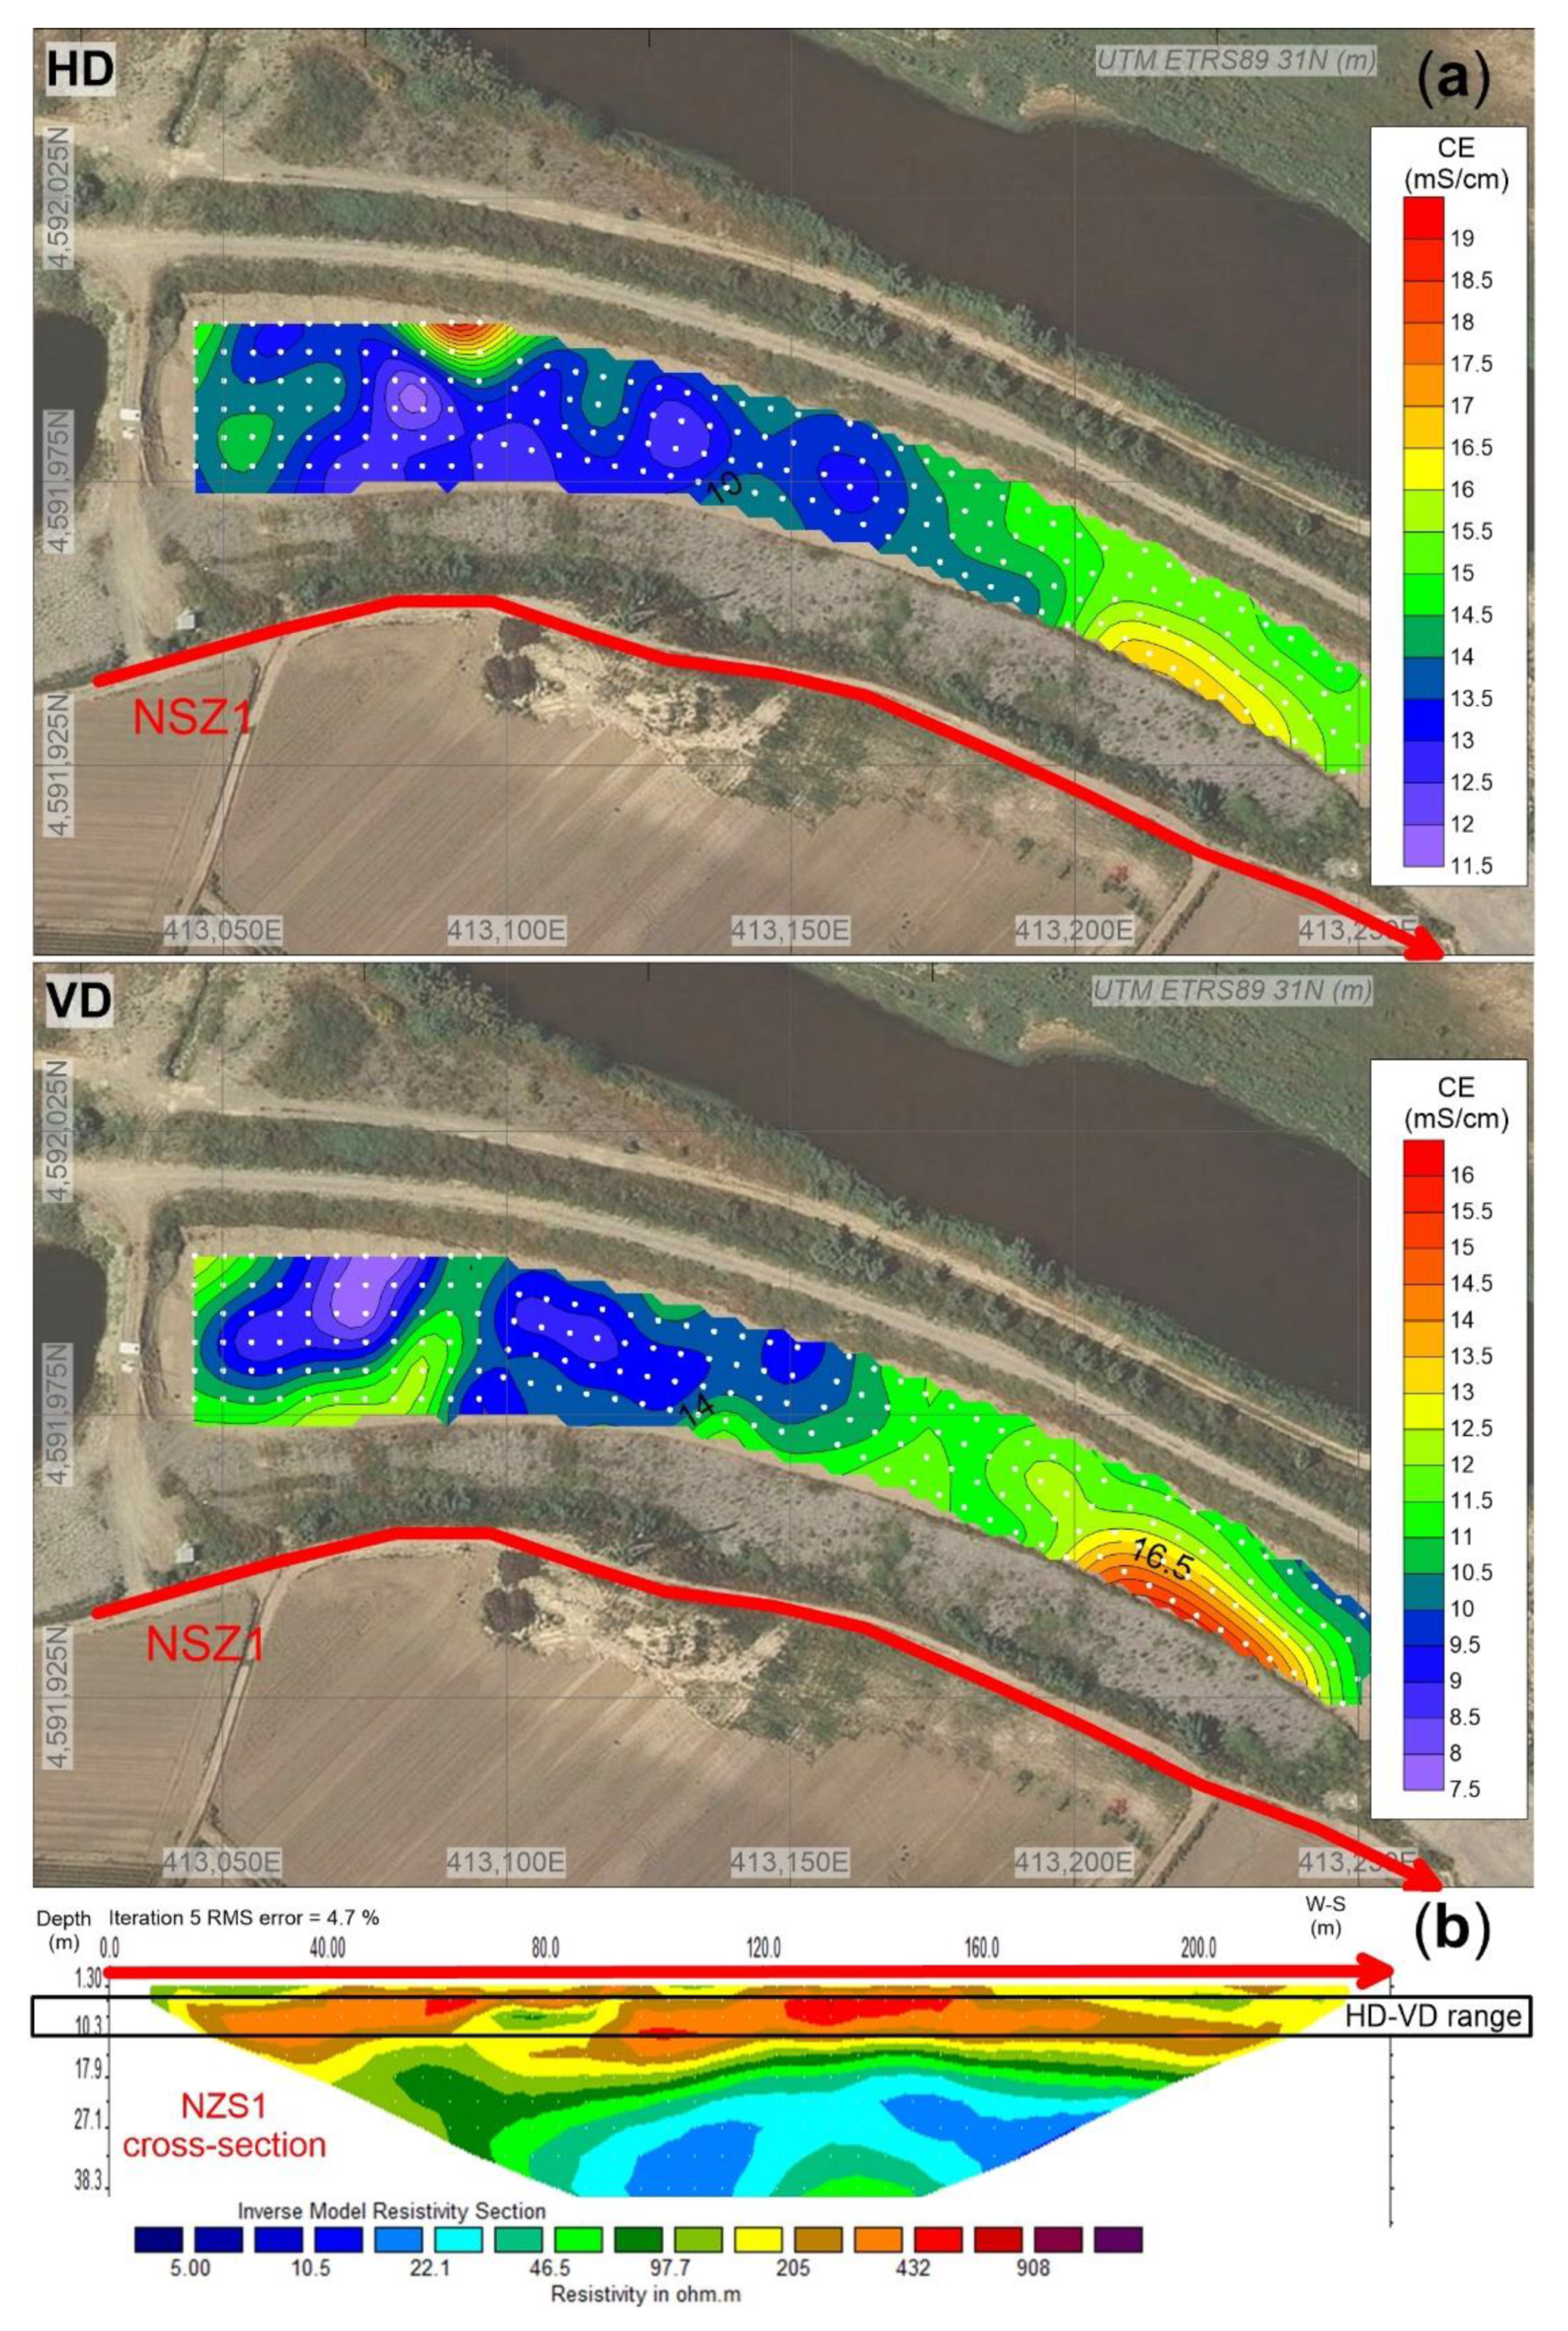
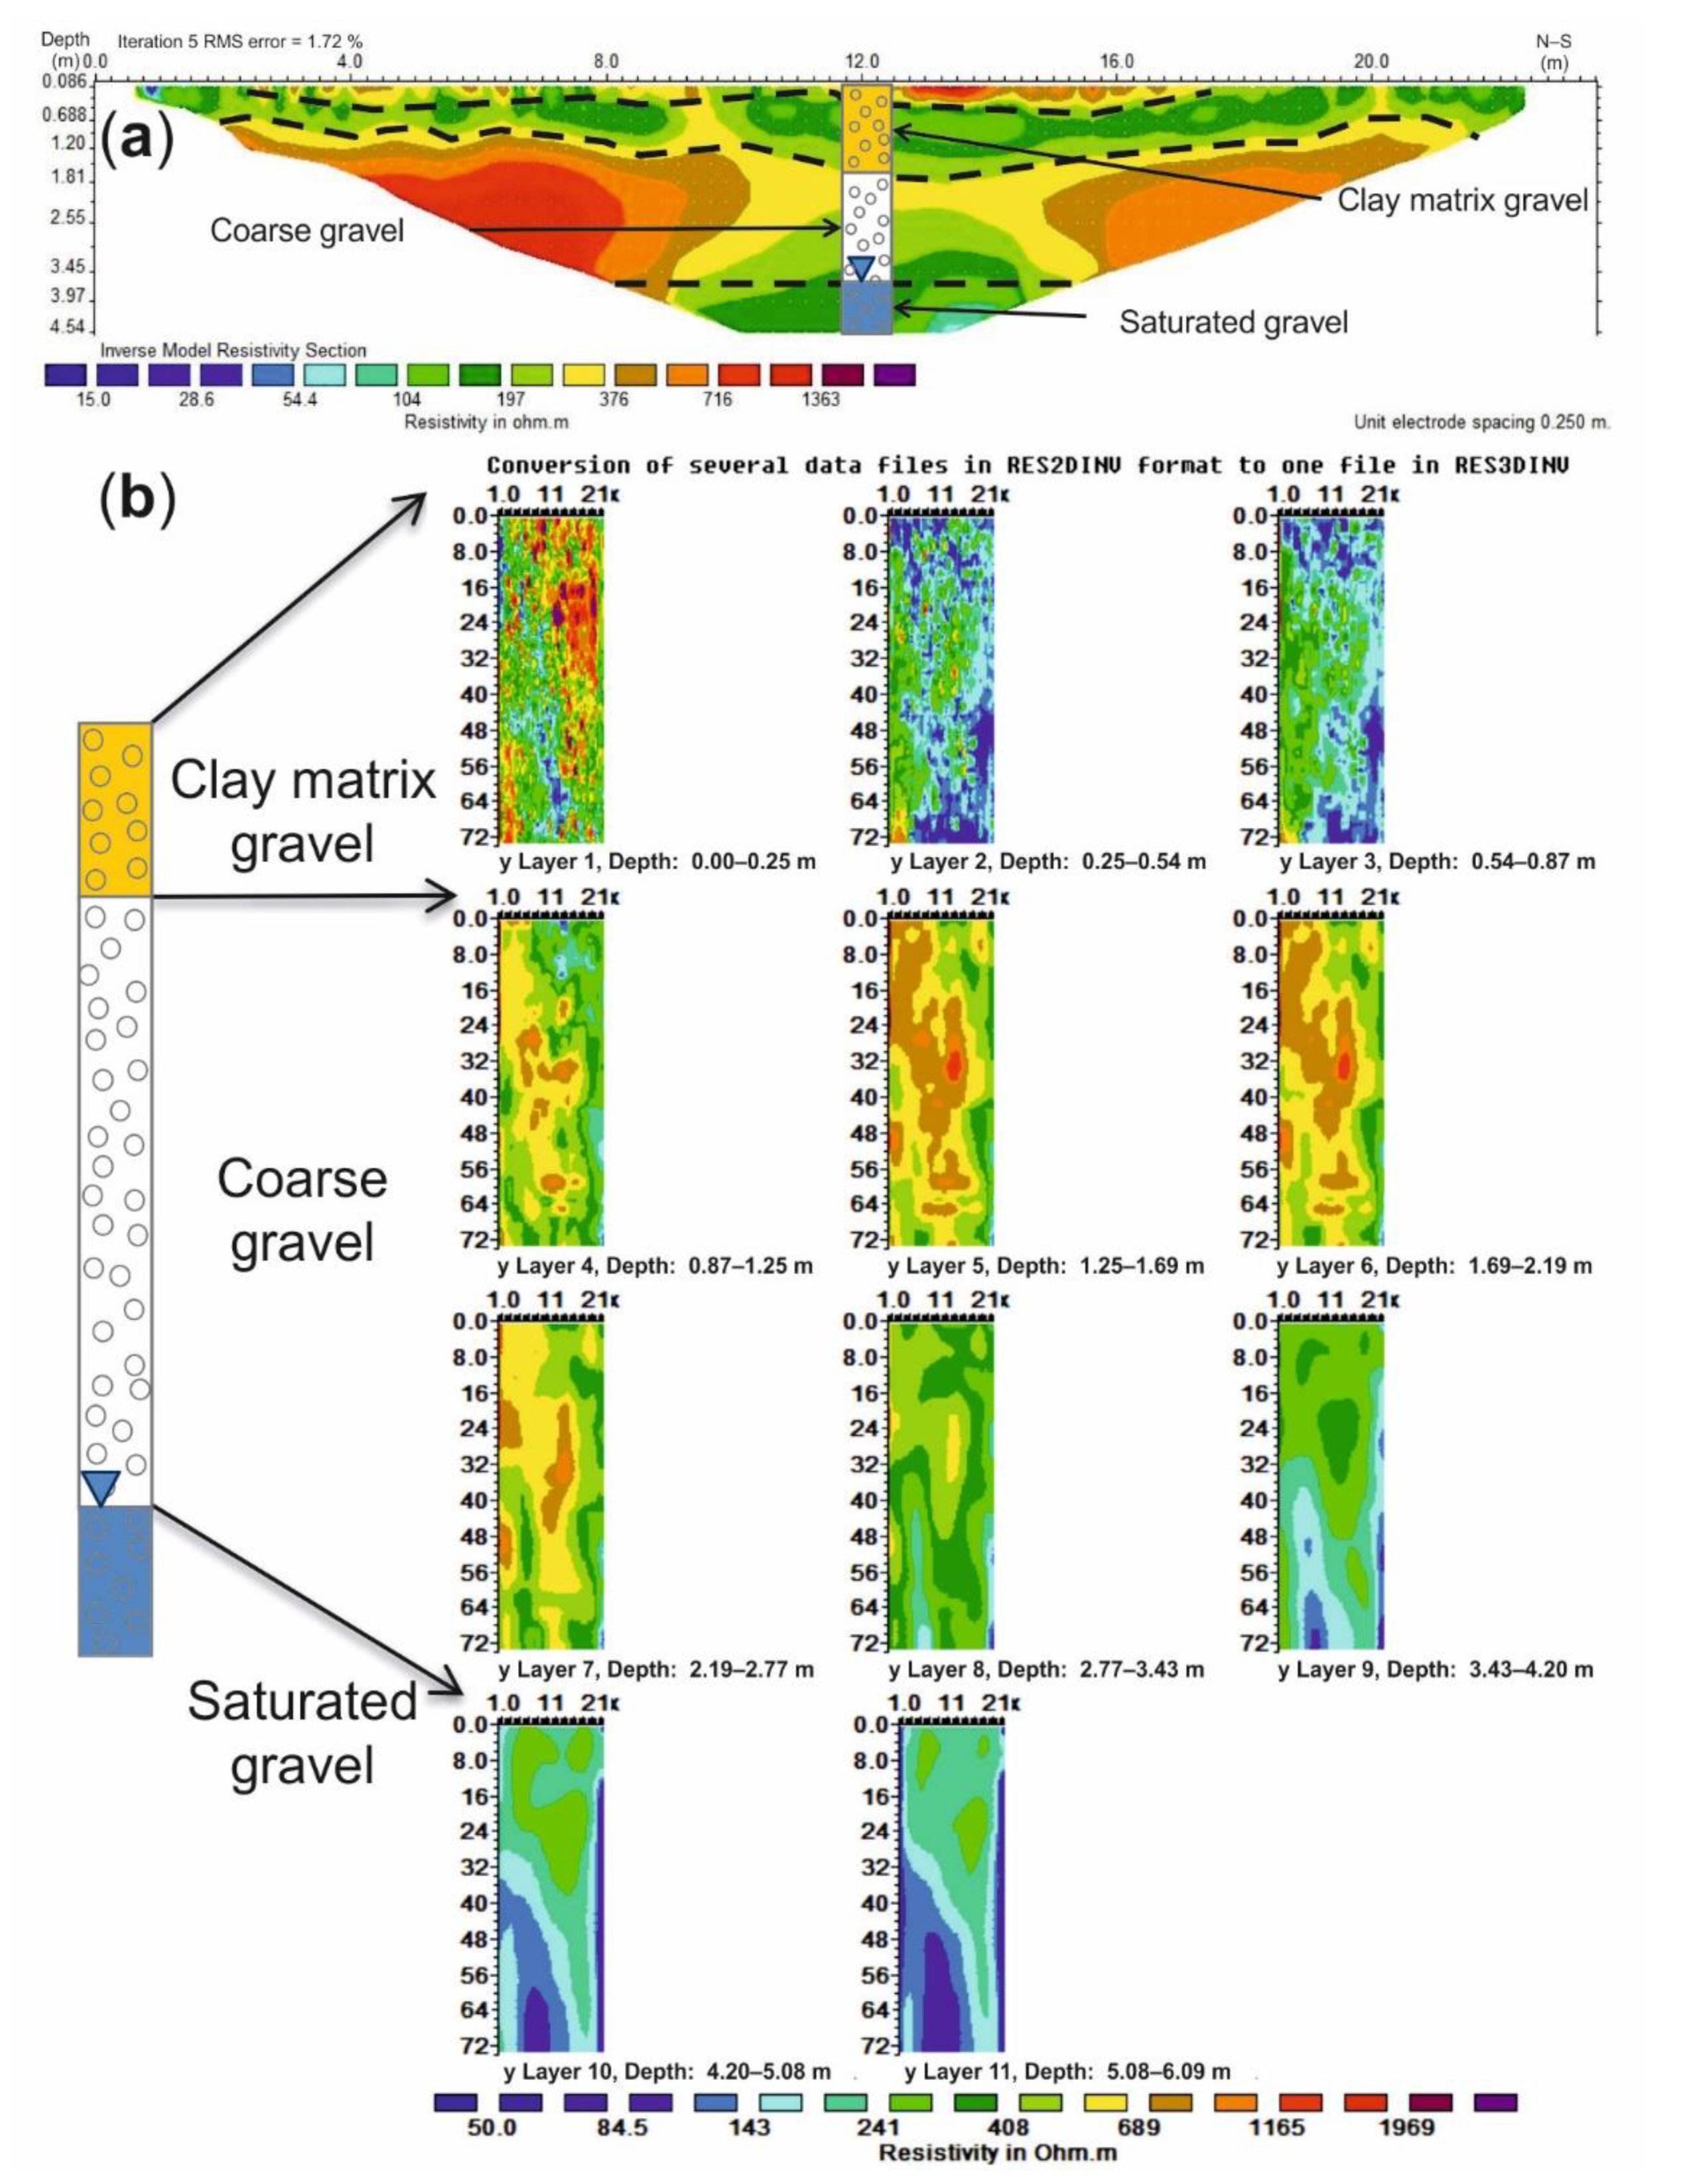
4.2. Geophysical Characterization of the Non-Saturated Zone (NSZ)
- A discontinuous layer with low values located between 0 and 1.5 m deep
- A layer with relatively high resistivity between 0.6 and 3 m deep
- A layer with lower resistivity values located at the bottom of all the cross-sections
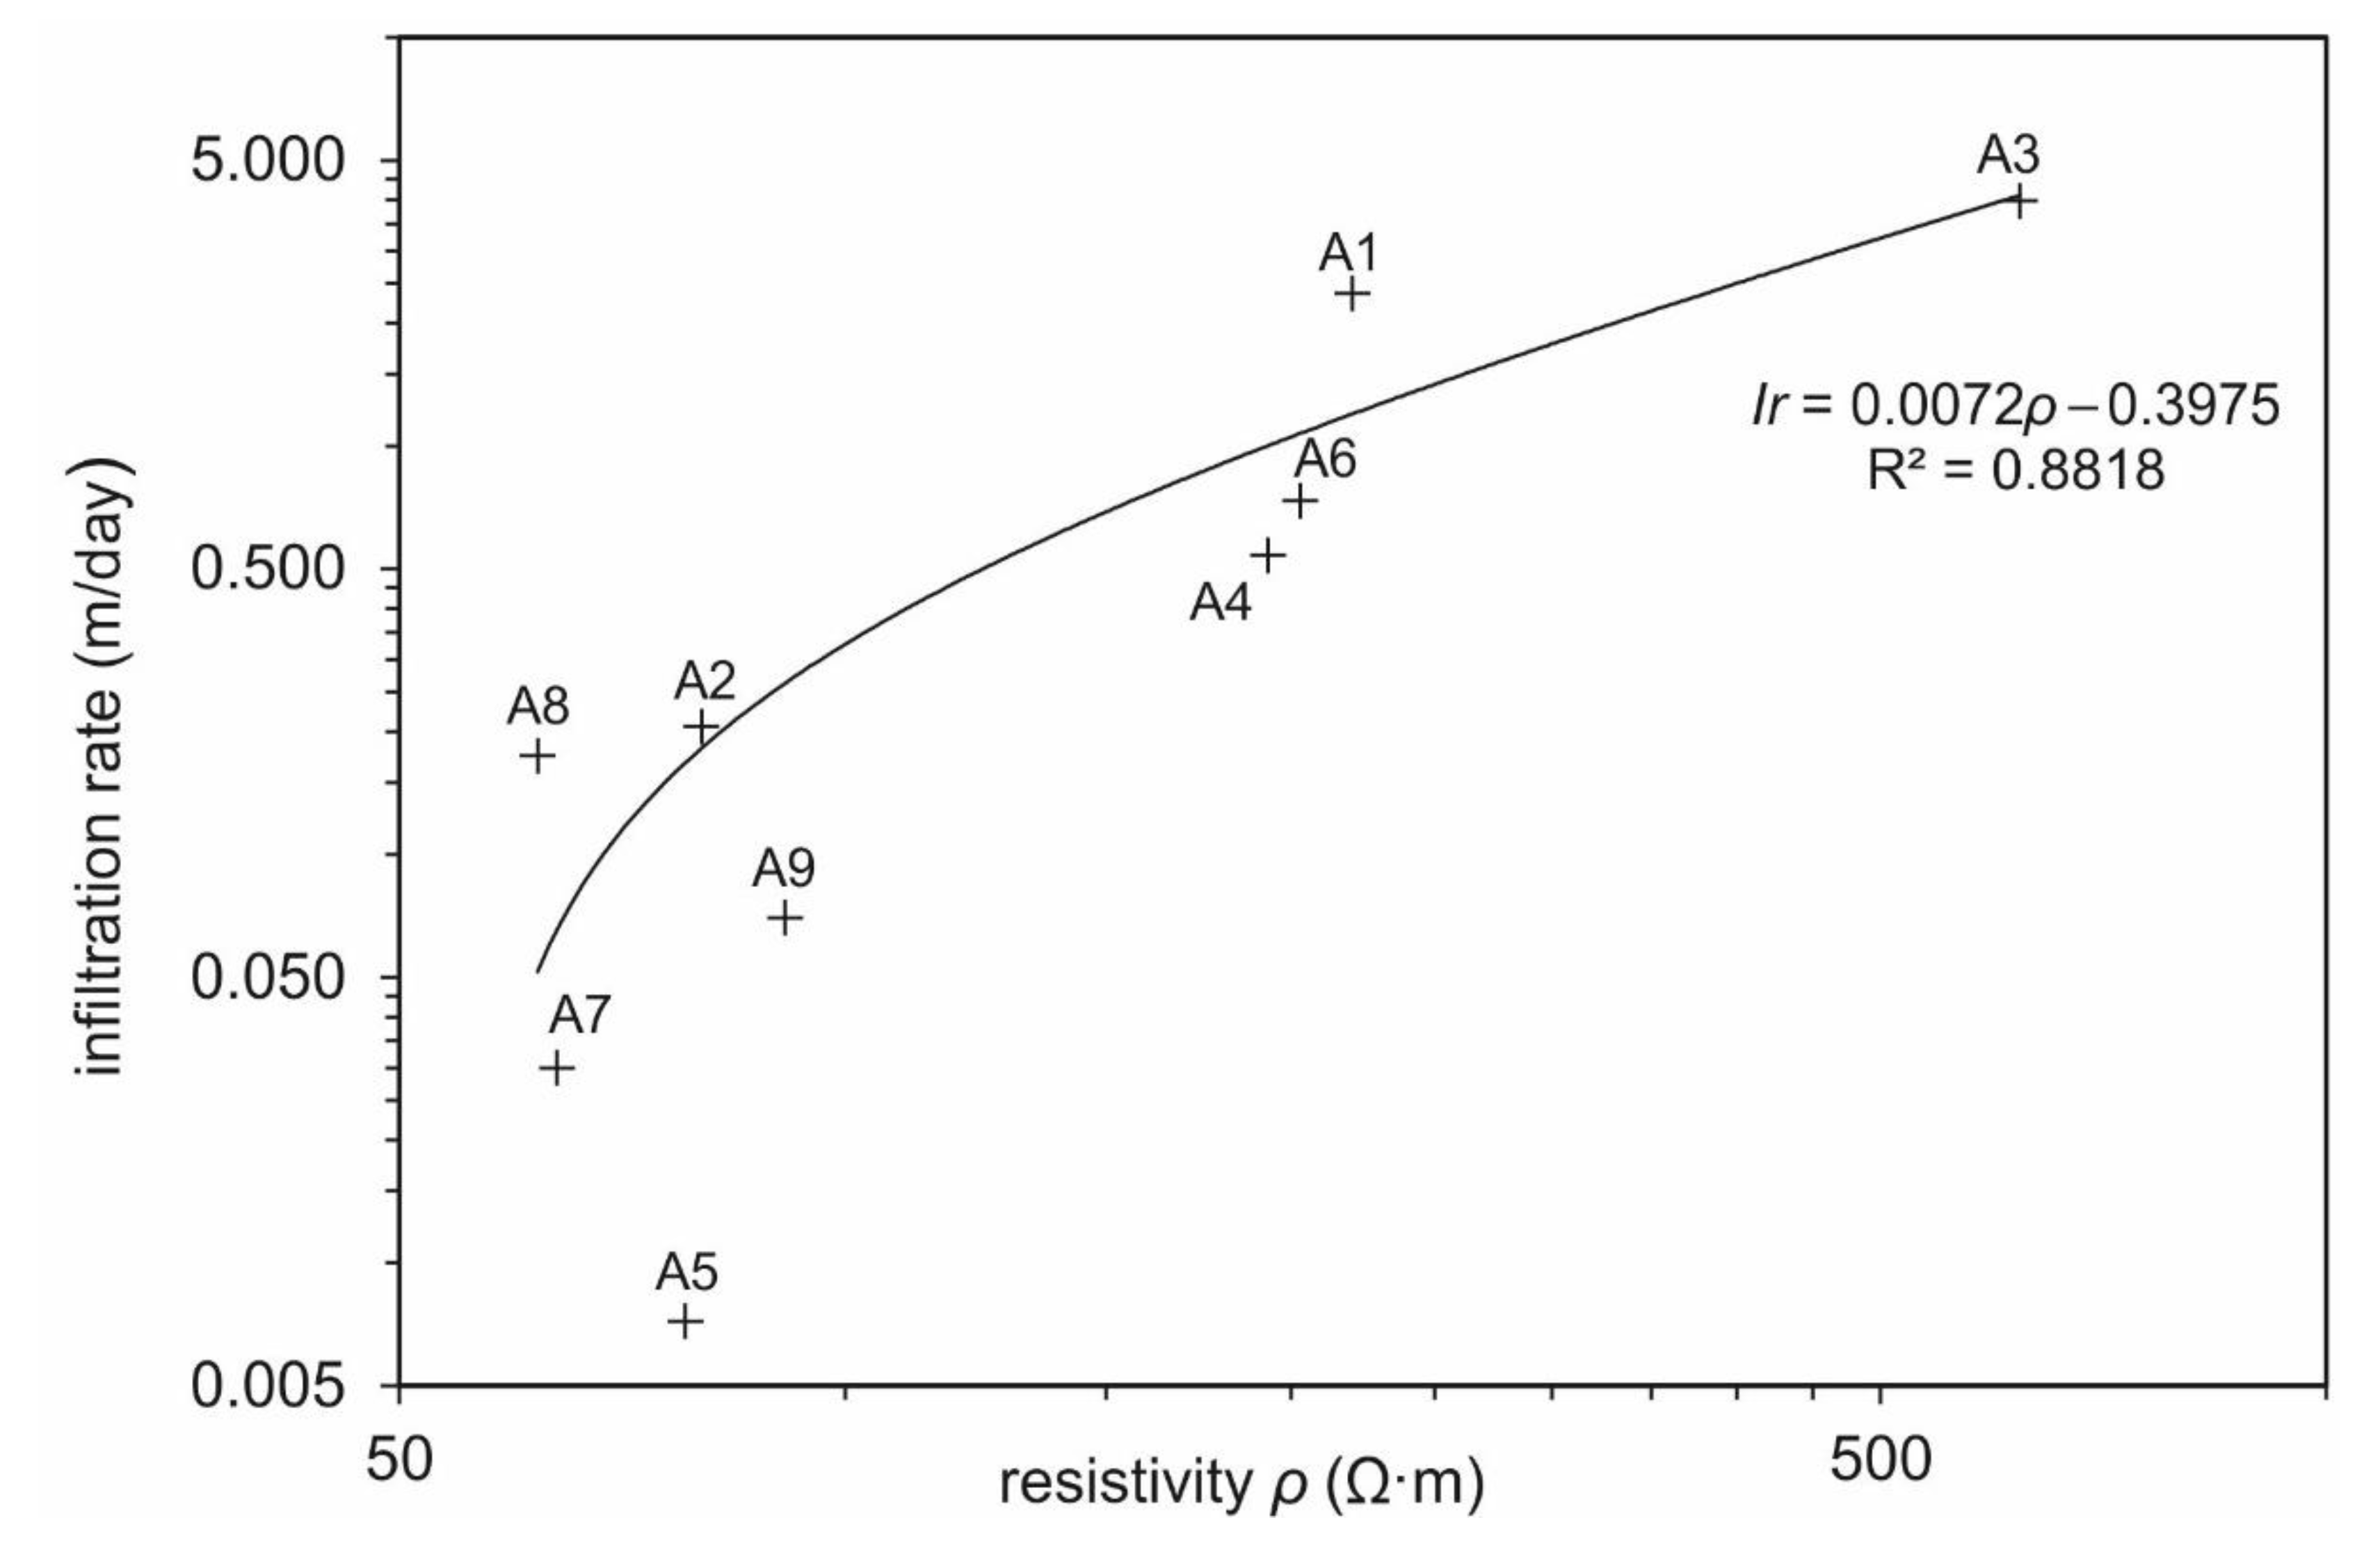
4.3. Infiltration Rate
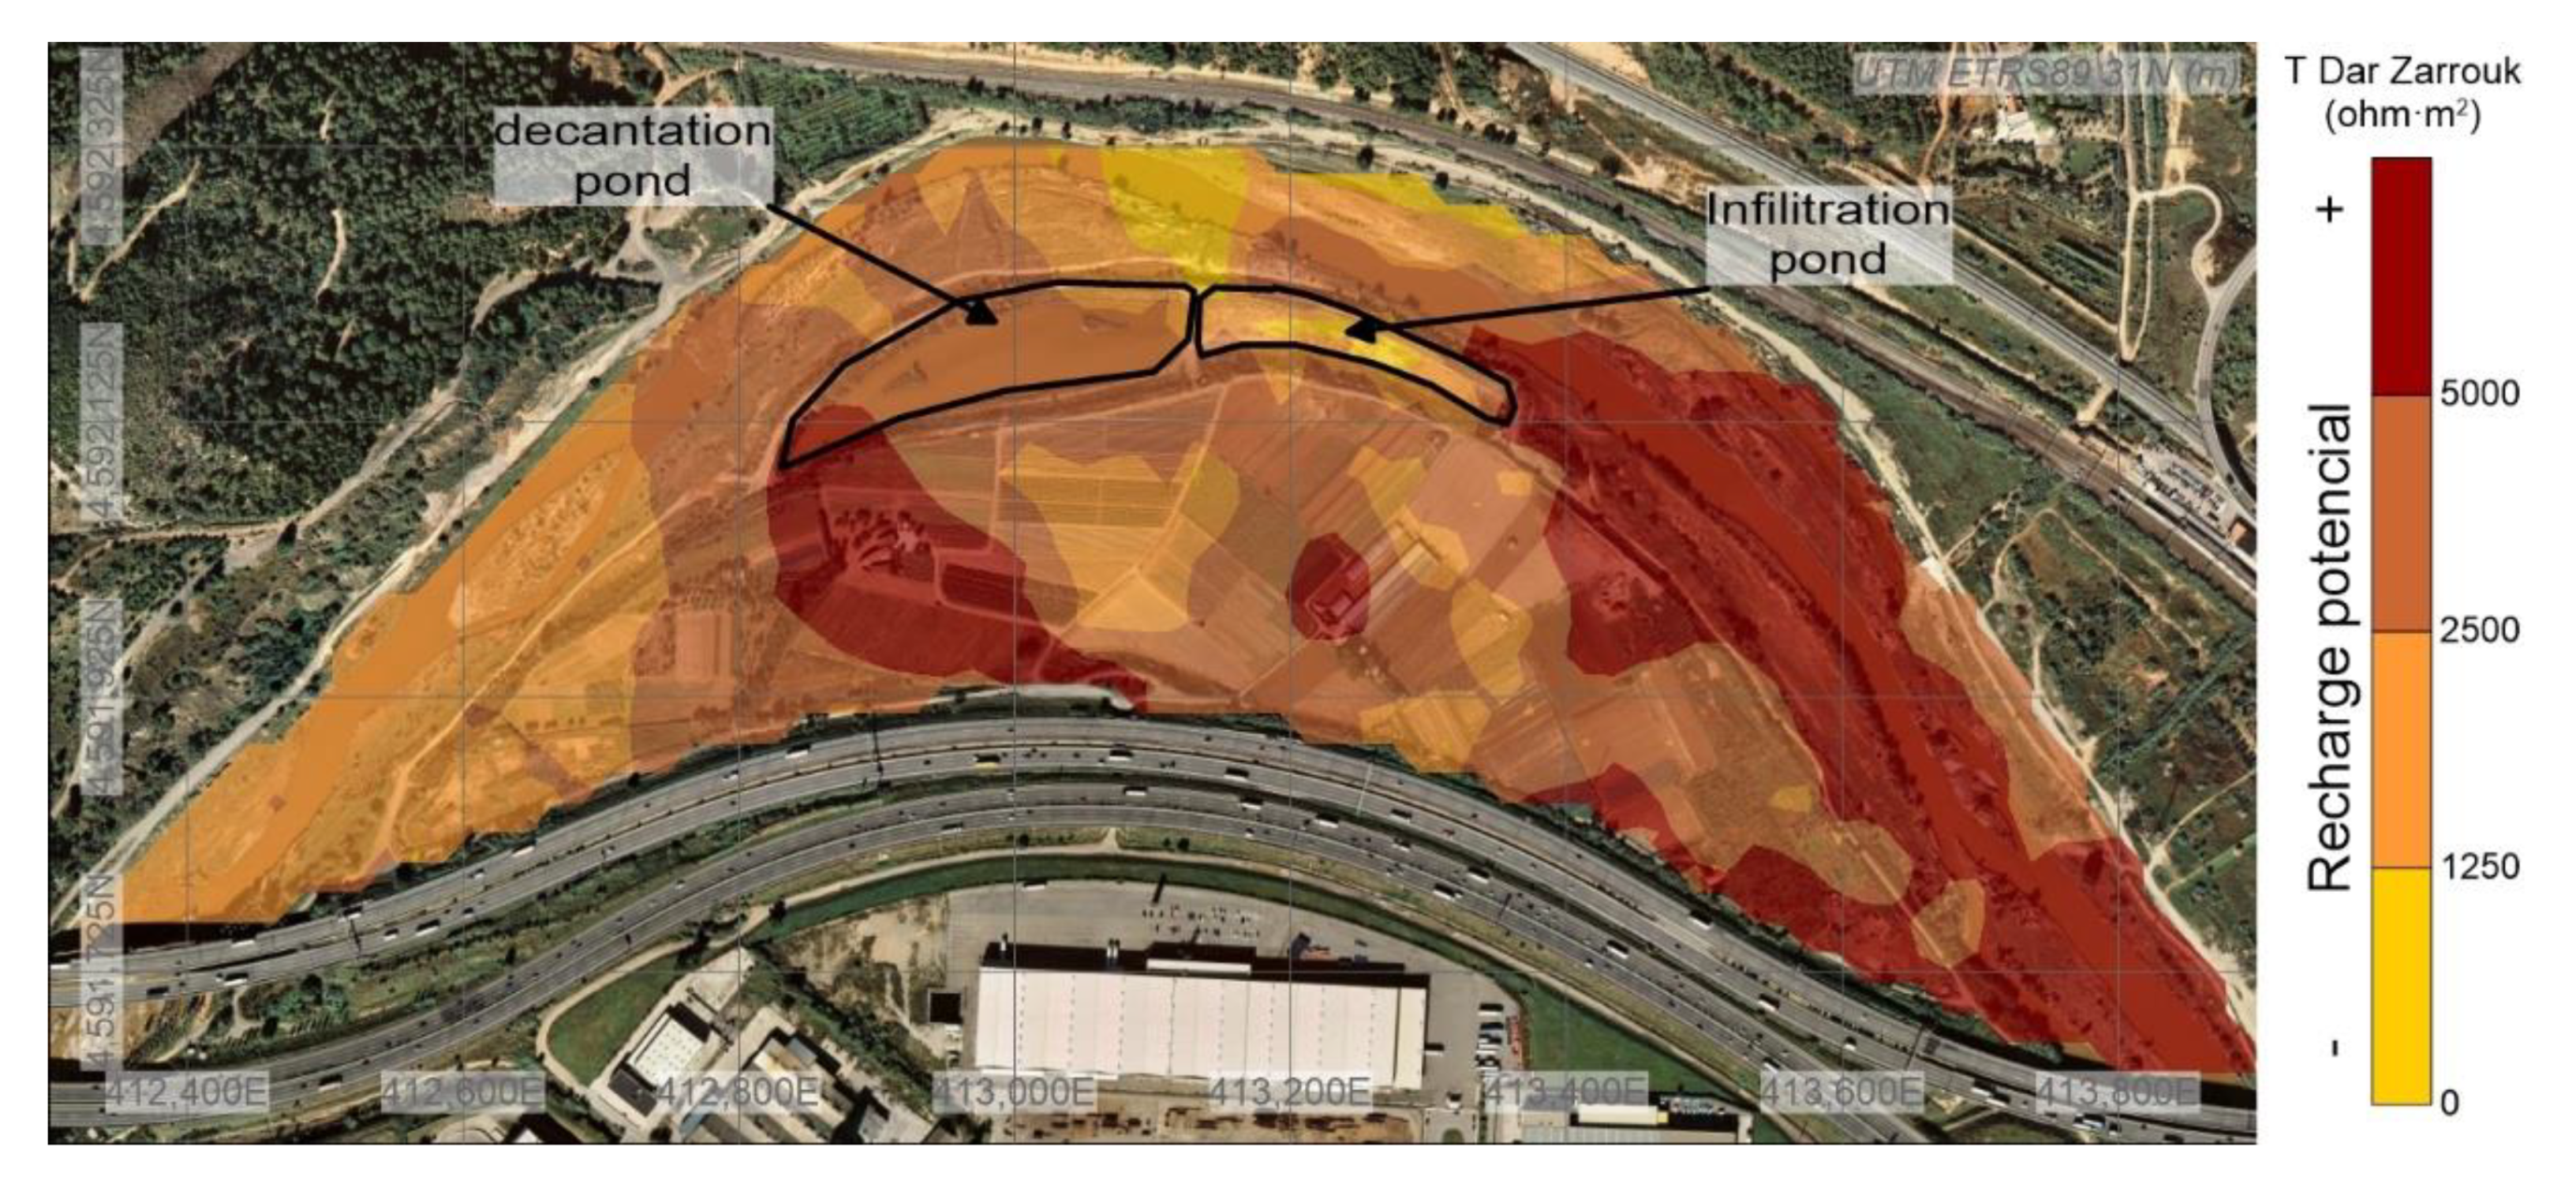
4.4. Assessment of Recharge Potential
5. Discussion
5.1. Recharge Pond Management
5.2. Aquifer Recharge Potential Areas
6. Conclusions
Author Contributions
Funding
Acknowledgments
Conflicts of Interest
References
- Quintana, J.; de la Cal, A.; Boleda, M.R. Monitoring the complex occurrence of pesticides in the Llobregat basin, natural and drinking waters in Barcelona metropolitan area (Catalonia, NE Spain) by a validated multi-residue online analytical method. Sci. Total Environ. 2019, 692, 952–965. [Google Scholar] [CrossRef]
- Fuentes, I.; Vervoort, R.W. Site suitability and water availability for a managed aquifer recharge project in the Namoi basin, Australia. J. Hydrol. Reg. Stud. 2020, 27, 100657. [Google Scholar] [CrossRef]
- Bouwer, H. Artificial recharge of groundwater: Hydrogeology and engineering. Hydrogeol. J. 2002, 10, 121–142. [Google Scholar] [CrossRef]
- Casanova, J.; Devau, N.; Pettenati, M. Managed Aquifer Recharge: An Overview of Issues and Options. In Integrated Groundwater Management: Concepts, Approaches and Challenges; Jakeman, A.J., Barreteau, O., Hunt, R.J., Rinaudo, J.-D., Ross, A., Eds.; Springer International Publishing: Cham, Switzerland, 2016; pp. 413–434. ISBN 978-3-319-23576-9. [Google Scholar]
- De Vries, J.; Simmers, I. Groundwater recharge: An overview of processes and challenges. Hydrogeol. J. 2002, 10, 5–17. [Google Scholar] [CrossRef]
- Hernández, M.; Tobella, J.; Ortuño, F.; Armenter, J.L. Aquifer recharge for securing water resources: The experience in Llobregat river. Water Sci. Technol. 2011, 63, 220–226. [Google Scholar] [CrossRef]
- De Carlo, L.; Caputo, M.C.; Masciale, R.; Vurro, M.; Portoghese, I. Monitoring the drainage efficiency of infiltration trenches in fractured and karstified limestone via time-lapse hydrogeophysical approach. Water 2020, 12, 2009. [Google Scholar] [CrossRef]
- Pedretti, D.; Barahona-Palomo, M.; Bolster, D.; Fernàndez-Garcia, D.; Sanchez-Vila, X.; Tartakovsky, D.M. Probabilistic analysis of maintenance and operation of artificial recharge ponds. Adv. Water Resour. 2012, 36, 23–35. [Google Scholar] [CrossRef]
- Mawer, C.; Parsekian, A.; Pidlisecky, A.; Knight, R. Characterizing Heterogeneity in Infiltration Rates During Managed Aquifer Recharge. Groundwater 2016, 54, 818–829. [Google Scholar] [CrossRef]
- Agarwal, R.; Garg, P.K. Remote Sensing and GIS Based Groundwater Potential & Recharge Zones Mapping Using Multi-Criteria Decision Making Technique. Water Resour. Manag. 2016, 30, 243–260. [Google Scholar]
- Singh, S.K.; Zeddies, M.; Shankar, U.; Griffiths, G.A. Potential groundwater recharge zones within New Zealand. Geosci. Front. 2019, 10, 1065–1072. [Google Scholar] [CrossRef]
- Arshad, A.; Zhang, Z.; Zhang, W.; Dilawar, A. Mapping favorable groundwater potential recharge zones using a GIS-based analytical hierarchical process and probability frequency ratio model: A case study from an agro-urban region of Pakistan. Geosci. Front. 2020, 11. [Google Scholar] [CrossRef]
- Yeh, H.F.; Cheng, Y.S.; Lin, H.I.; Lee, C.H. Mapping groundwater recharge potential zone using a GIS approach in Hualian River, Taiwan. Sustain. Environ. Res. 2016, 26, 33–43. [Google Scholar] [CrossRef]
- Gelhar, L. Stochastic Subsurface Hydrology; Pearson College Div.: New York, NY, USA, 1993. [Google Scholar]
- Ezzedine, S.; Rubin, Y.; Chen, J. Bayesian Method for hydrogeological site characterization using borehole and geophysical survey data: Theory and application to the Lawrence Livermore National Laboratory Superfund Site. Water Resour. Res. 1999, 35, 2671–2683. [Google Scholar] [CrossRef]
- Hubbard, S.S.; Peterson, J.E.; Majer, E.L.; Zawislanski, P.T.; Williams, K.H.; Roberts, J.; Wobber, F. Estimation of permeable pathways and water content using tomographic radar data. Lead. Edge 1997, 16, 1623. [Google Scholar] [CrossRef]
- Chen, J.; Hubbard, S.; Rubin, Y. Estimating the hydraulic conductivity at the south oyster site from geophysical tomographic data using Bayesian Techniques based on the normal linear regression model. Water Resour. Res. 2001, 37, 1603–1613. [Google Scholar] [CrossRef]
- Hubbard, S.; Rubin, Y. Introduction to Hydrogeophysics. In Hydrogeophysics SE-1; Rubin, Y., Hubbard, S., Eds.; Water Science and Technology Library; Springer: Dordrecht, The Netherlands, 2005; Volume 50, pp. 3–21. ISBN 978-1-4020-3101-4. [Google Scholar]
- Dietrich, P.; Leven, C. Direct push-technologies. In Groundwater Geophysics SE-12; Kirsch, R., Ed.; Springer: Berlin/Heidelberg, Germany, 2009; pp. 347–366. ISBN 978-3-540-88404-0. [Google Scholar]
- Daily, W.; Ramirez, A.; LaBrecque, D.; Nitao, J. Electrical resistivity tomography of vadose water movement. Water Resour. Res. 1992, 28, 1429–1442. [Google Scholar] [CrossRef]
- Binley, A.; Henry-Poulter, S.; Shaw, B. Examination of Solute Transport in an Undisturbed Soil Column Using Electrical Resistance Tomography. Water Resour. Res. 1996, 32, 763–769. [Google Scholar] [CrossRef]
- Michot, D.; Benderitter, Y.; Dorigny, A.; Nicoullaud, B.; King, D.; Tabbagh, A. Spatial and temporal monitoring of soil water content with an irrigated corn crop cover using surface electrical resistivity tomography. Water Resour. Res. 2003, 39, 1138. [Google Scholar] [CrossRef]
- Mitchell, V.R. Informed Electrical Resistivity Imaging for Monitoring Infiltration Dynamics in the Near Surface; Stanford University: Stanford, CA, USA, 2010. [Google Scholar]
- Revil, A.; Karaoulis, M.; Johnson, T.; Kemna, A. Review: Some low-frequency electrical methods for subsurface characterization and monitoring in hydrogeology. Hydrogeol. J. 2012, 20, 617–658. [Google Scholar] [CrossRef]
- Binley, A.; Hubbard, S.S.; Huisman, J.A.; Revil, A.; Robinson, D.A.; Singha, K.; Slater, L.D. The emergence of hydrogeophysics for improved understanding of subsurface processes over multiple scales. Water Resour. Res. 2015, 51, 3837–3866. [Google Scholar] [CrossRef]
- Calamita, G.; Perrone, A.; Brocca, L.; Onorati, B.; Manfreda, S. Field test of a multi-frequency electromagnetic induction sensor for soil moisture monitoring in southern Italy test sites. J. Hydrol. 2015, 529, 316–329. [Google Scholar] [CrossRef]
- Perri, M.T.; De Vita, P.; Masciale, R.; Portoghese, I.; Chirico, G.B.; Cassiani, G. Time-lapse Mise-á-la-Masse measurements and modeling for tracer test monitoring in a shallow aquifer. J. Hydrol. 2018, 561, 461–477. [Google Scholar] [CrossRef]
- Mawer, C.; Kitanidis, P.; Pidlisecky, A.; Knight, R. Electrical Resistivity for Characterization and Infiltration Monitoring beneath a Managed Aquifer Recharge Pond. Vadose Zone J. 2013, 12, 1–20. [Google Scholar] [CrossRef]
- Haaken, K.; Furman, A.; Weisbrod, N.; Kemna, A. Time-Lapse Electrical Imaging of Water Infiltration in the Context of Soil Aquifer Treatment. Vadose Zone J. 2016, 15, 1–12. [Google Scholar] [CrossRef]
- Sendrós, A.; Himi, M.; Lovera, R.; Rivero, L.; Garcia-Artigas, R.; Urruela, A.; Casas, A.; Garcia-Artigas, R.; Urruela, A.; Casas, A. Electrical resistivity tomography monitoring of two managed aquifer recharge ponds in the alluvial aquifer of the Llobregat River (Barcelona, Spain). Near Surf. Geophys. 2020, 18, 353–368. [Google Scholar] [CrossRef]
- Vogelgesang, J.A.; Holt, N.; Schilling, K.E.; Gannon, M.; Tassier-Surine, S. Using high-resolution electrical resistivity to estimate hydraulic conductivity and improve characterization of alluvial aquifers. J. Hydrol. 2020, 580, 123992. [Google Scholar] [CrossRef]
- Sauvin, G.; Lecomte, I.; Bazin, S.; Heureux, L.; Vanneste, M.; Solberg, I.; Dalsegg, E. Towards geophysical and geotechnical integration for quick-clay mapping in Norway. Near Surf. Geophys. 2013, 11, 613–623. [Google Scholar] [CrossRef]
- Sabater, S.; Ginebreda, A.; Barceló, D. The Llobregat The Story of a Polluted Mediterranean River; Sabater, S., Ginebreda, A., Barceló, D., Eds.; Springer: Berlin/Heidelberg, Germany, 2012; ISBN 9783642309380. [Google Scholar]
- Nowinski, J.D.; Cardenas, M.B.; Lightbody, A.F. Evolution of hydraulic conductivity in the floodplain of a meandering river due to hyporheic transport of fine materials. Geophys. Res. Lett. 2011, 38, 2–6. [Google Scholar] [CrossRef]
- ICGC. Mapa Hidrogeològic del Tram Baix del Llobregat i el seu Delta 1:30 000; ICGC: Barcelona, Spain, 2006. [Google Scholar]
- ACA. Massa d’Aigua 38. Cubeta de Sant Andreu i Vall Baixa del Llobregat; ACA: Barcelona, Spain, 2004. [Google Scholar]
- SMC. Climatologia. El Vallès Occidental; Departament de Medi Ambient i Habitatge, Generalitat de Catalunya: Barcelona, Spain, 2014. [Google Scholar]
- Martorana, R.; Fiandaca, G.; Casas Ponsati, A.; Cosentino, P.L. Comparative tests on different multi-electrode arrays using models in near-surface geophysics. J. Geophys. Eng. 2009, 6, 1–20. [Google Scholar] [CrossRef]
- Loke, M.H. RES2DINV. In Rapid 2-D Resistivity & IP Inversion Using the Least-Squares Method; Geotomo Software Sdn Bhd: Penang, Malasya, 2019. [Google Scholar]
- Loke, M.H. RES3DINV. In Rapid 3-D Resistivity & IP Inversion Using the Least-Squares Method; Geotomo Software Sdn Bhd: Penang, Malasya, 2019. [Google Scholar]
- ERTLab 3d Electrical Resistivity Tomography Software; Multi-Phase Technologies, LLC: Sparks, NV, USA, 2006.
- Loke, M.H.; Barker, R.D. Rapid least-squares inversion of apparent resistivity pseudosections by a quasi-Newton method. Geophys. Prospect. 1996, 44, 131–152. [Google Scholar] [CrossRef]
- Ellis, R.G.; Oldenburg, D.W. Applied geophysical inversion. Geophys. J. Int. 1994, 116, 5–11. [Google Scholar] [CrossRef]
- McNeill, J.D. Applications of Transient Electromagnetic Techniques; Geonics Limited: Toronto, ON, Canada, 1980; p. 17. [Google Scholar]
- Custodio, E.; Llamas, M.R. Hidrología Subterránea, 2nd ed.; Omega: Barcelona, Spain, 2001; Volume I, ISBN 978-84-282-0447-7. [Google Scholar]
- ASTM (American Society for Testing and Materials). D3385-03: Standard Test Method for Infiltration Rate of Soils in Field Using Double-Ring Infiltrometer; ASTM: Washington, DC, USA, 2003. [Google Scholar]
- Ronayne, M.J.; Houghton, T.B.; Stednick, J.D. Field characterization of hydraulic conductivity in a heterogeneous alpine glacial till. J. Hydrol. 2012, 458, 103–109. [Google Scholar] [CrossRef]
- Hantush, M.M. Aquifer transmissivity. In Encyclopedia of Water Science; Stewart, B.A., Howell, T.A., Eds.; Marcel Dekker Incorporated: New York, NY, USA, 2003; pp. 26–29. ISBN 0-8247-42419. [Google Scholar]
- Singh, A.; Panda, S.N.; Kumar, K.S.; Sharma, C.S. Artificial groundwater recharge zones mapping using remote sensing and gis: A case study in Indian Punjab. Environ. Manage. 2013, 52, 61–71. [Google Scholar] [CrossRef]
- Sandoval, J.A.; Tiburan, C.L. Identification of potential artificial groundwater recharge sites in Mount Makiling Forest Reserve, Philippines using GIS and Analytical Hierarchy Process. Appl. Geogr. 2019, 105, 73–85. [Google Scholar] [CrossRef]
- Koefoed, O. An analysis of equivalence in resistivity sounding. Geophys. Prospect. 1969, 17, 327–335. [Google Scholar] [CrossRef]
- Maillet, R. The fundamental equations of electrical prospecting. Geophysics 1947, 12, 529–556. [Google Scholar] [CrossRef]
- Henriet, J.P. Direct applications of the Dar Zarrouk parameters in ground water surveys. Geophys. Prospect. 1976, 24, 344–353. [Google Scholar] [CrossRef]
- Niwas, S.; Singhal, D.C. Estimation of aquifer transmissivity from Dar-Zarrouk parameters in porous media. J. Hydrol. 1981, 50, 393–399. [Google Scholar] [CrossRef]
- Ward, S.H. Resistivity and Induced Polarization Methods. In Geotechnical and Environmental Geophysics; Society of Exploration Geophysicists: Washington, DC, USA, 1991; Volume I, pp. 147–190. [Google Scholar]
- Batte, A.G.; Barifaijo, E.; Kiberu, J.M.; Kawule, W.; Muwanga, A.; Owor, M.; Kisekulo, J. Correlation of Geoelectric Data with Aquifer Parameters to Delineate the Groundwater Potential of Hard rock Terrain in Central Uganda. Pure Appl. Geophys. 2010, 167, 1549–1559. [Google Scholar] [CrossRef]
- Soupios, P.; Kouli, M.; Vallianatos, F.; Vafidis, A.; Stavroulakis, G. Estimation of aquifer hydraulic parameters from surficial geophysical methods: A case study of Keritis Basin in Chania (Crete–Greece). J. Hydrol. 2007, 338, 122–131. [Google Scholar] [CrossRef]
- Oyeyemi, K.D.; Aizebeokhai, A.P.; Adagunodo, T.A.; Olofinnade, O.M.; Sanuade, O.A.; Olaojo, A.A. Subsoil characterization using geoelectrical and geotechnical investigations: Implications for foundation studies. Int. J. Civ. Eng. Technol. 2017, 8, 302–314. [Google Scholar]
- Carlson, R.E.; Foley, T.A. Interpolation of track data with radial basis methods. Comput. Math. Appl. 1992, 24, 27–34. [Google Scholar] [CrossRef]
- Cousin, I.; Besson, A.; Bourennane, H.; Pasquier, C.; Nicoullaud, B.; King, D.; Richard, G. From spatial-continuous electrical resistivity measurements to the soil hydraulic functioning at the field scale. Comptes Rendus Geosci. 2009, 341, 859–867. [Google Scholar] [CrossRef]
- Ross, A.; Hasnain, S. Factors affecting the cost of managed aquifer recharge (MAR) schemes. Sustain. Water Resour. Manag. 2018, 4, 179–190. [Google Scholar] [CrossRef]
- Perdomo, S.; Kruse, E.E.; Ainchil, J.E. Estimation of hydraulic parameters using electrical resistivity tomography (ERT) and empirical laws in a semi-confined aquifer. Near Surf. Geophys. 2018, 16, 627–641. [Google Scholar] [CrossRef]
- Interpex. RESIX-PLUS. In User Manual Resitivity Data Interpretation Software; Interpex Limited: Golden, CO, USA, 1993. [Google Scholar]
- Casas, A.; Himi, M.; Diaz, Y.; Pinto, V.; Font, X.; Tapias, J.C. Assessing aquifer vulnerability to pollutants by electrical resistivity tomography (ERT) at a nitrate vulnerable zone in NE Spain. Environ. Geol. 2008, 54, 515–520. [Google Scholar] [CrossRef]
- Gupta, G.; Patil, S.N.; Padmane, S.T.; Erram, V.C.; Mahajan, S.H. Geoelectric investigation to delineate groundwater potential and recharge zones in Suki river basin, north Maharashtra. J. Earth Syst. Sci. 2015, 124, 1487–1501. [Google Scholar] [CrossRef]


| Type | Number of Acquisitions | Dimension (m) | Electrode Distance (m) | Date | Objective | Zone |
|---|---|---|---|---|---|---|
| 2D ERT 1 | 2 | 235 | 5 | July 2010 | SZ 2 | Recharge pond |
| 3D ERT 3 | 1 | 40 × 30 | 5 | July 2010 | SZ | Recharge pond |
| FDEM 4 | 300 | 200 × 15 | 5 (point) | February 2011 | NSZ 5 | Recharge pond |
| 2D ERT | 1 | 235 | 5 | March 2011 | NSZ | Recharge pond margin |
| 2D ERT | 38 | 23.5 | 0.5 | March 2011 | NSZ | Recharge pond |
| 2D ERT | 11 | 47 | 1 | March 2011 | NSZ | Recharge pond |
| 2D ERT | 9 | 23.5 | 0.5 | 2011–2013 | Infiltration rate | Cubeta de Sant Andreu |
| 2D ERT | 23 | 137.5 and 235 | 2.5 and 5 | 2012–2013 | Aquifer Recharge Potential | Meander of Ca n’Albareda |
| ID | Date | Hydrogeological Unit |
|---|---|---|
| A1 | March 2012 | Gravel, sand and silt (Qac3) |
| A2 | March 2012 | Gravel, sand and clay (Qto) |
| A3 | June 2011 | Recharge pond (It1) |
| A4 | July 2011 | Recharge pond (It2) |
| A5 | May 2012 | Gravel, sand, silt and clay (Qt1) |
| A6 | May 2012 | Gravel, sand and silt (Qt2) |
| A7 | January 2013 | Gravel, sand, silt and clay (Qt1) |
| A8 | March 2012 | Gravel, sand and silt (Qt3) |
| A9 | January 2013 | Gravel, sand and silt (Qac3) |
Publisher’s Note: MDPI stays neutral with regard to jurisdictional claims in published maps and institutional affiliations. |
© 2020 by the authors. Licensee MDPI, Basel, Switzerland. This article is an open access article distributed under the terms and conditions of the Creative Commons Attribution (CC BY) license (http://creativecommons.org/licenses/by/4.0/).
Share and Cite
Sendrós, A.; Himi, M.; Lovera, R.; Rivero, L.; Garcia-Artigas, R.; Urruela, A.; Casas, A. Geophysical Characterization of Hydraulic Properties around a Managed Aquifer Recharge System over the Llobregat River Alluvial Aquifer (Barcelona Metropolitan Area). Water 2020, 12, 3455. https://doi.org/10.3390/w12123455
Sendrós A, Himi M, Lovera R, Rivero L, Garcia-Artigas R, Urruela A, Casas A. Geophysical Characterization of Hydraulic Properties around a Managed Aquifer Recharge System over the Llobregat River Alluvial Aquifer (Barcelona Metropolitan Area). Water. 2020; 12(12):3455. https://doi.org/10.3390/w12123455
Chicago/Turabian StyleSendrós, Alex, Mahjoub Himi, Raúl Lovera, Lluís Rivero, Ruben Garcia-Artigas, Aritz Urruela, and Albert Casas. 2020. "Geophysical Characterization of Hydraulic Properties around a Managed Aquifer Recharge System over the Llobregat River Alluvial Aquifer (Barcelona Metropolitan Area)" Water 12, no. 12: 3455. https://doi.org/10.3390/w12123455
APA StyleSendrós, A., Himi, M., Lovera, R., Rivero, L., Garcia-Artigas, R., Urruela, A., & Casas, A. (2020). Geophysical Characterization of Hydraulic Properties around a Managed Aquifer Recharge System over the Llobregat River Alluvial Aquifer (Barcelona Metropolitan Area). Water, 12(12), 3455. https://doi.org/10.3390/w12123455