Article

Revisiting Soil Aquifer Treatment: Improving Biodegradation and Filtration Efficiency Using a Highly Porous Material

Zuckerberg Institute for Water Research (ZIWR), The Jacob Blaustein Institutes for Desert Research (BIDR), Ben-Gurion University of the Negev, Be'er Sheva 8499000, Israel
*
Authors to whom correspondence should be addressed.
Water 2020, 12(12), 3593; https://doi.org/10.3390/w12123593
Submission received: 25 November 2020 / Revised: 14 December 2020 / Accepted: 15 December 2020 / Published: 21 December 2020

Abstract

:
Soil aquifer treatment (SAT) is an established and sustainable wastewater treatment approach for water reuse that has been gaining increased attention in various countries around the world. Increasing volumes of domestic wastewater and escalating real estate prices around urban areas emphasize the urgent need to maximize the treatment efficiency by revisiting the SAT setup. In this study, a novel approach was examined to increase biodegradation rates and improve the quality of SAT topsoil effluent. Experiments with midscale, custom-made columns were carried out with sand collected from an operational SAT and a highly permeable natural material with high internal porosity, tuff, which was maturated (i.e., buried in the SAT infiltration basin) for 3 months. The filtration efficiency, biodegradation rates of organic material, microbial diversity, and outflow quality were compared between the operational SAT sand and the tuff using state-of-the-art approaches. The results of this study indicate that biodegradation rates (9.2 µg C g−1d−1) and filtration efficiency were up to 2.5-fold higher within the tuff than the SAT sand. Furthermore, the biofilm community was markedly different between the two media, giving additional insights into the bacterial phyla responsible for biodegradation. The results highlight the advantage of using highly porous material to enhance the SAT filtration efficiency without extending the topsoil volume. Hence, infusing a permeable medium, comprising highly porous material, into the SAT topsoil could offer a simple approach to upgrade an already advantageous SAT in both developed and developing countries.

1. Introduction

The increasing demand for freshwater and over-withdrawal of groundwater to accommodate the growing population, as well as modern consumption patterns, demonstrate the urgent need for significant water reuse [1,2]. Wastewater (WW) recycling for agricultural irrigation is applied worldwide as a sustainable freshwater alternative, since it reduces the pressure on potable water sources [3]. Soil aquifer treatment (SAT) is a type of managed aquifer recharge approach that has been gaining increased attention as a sustainable technology for WW reuse in various countries around the world [4,5]. SAT is typically designed to remove residual contaminants from treated WW, producing the high quality effluent [6]. Ultimately, the reclaimed water is used for a variety of applications, including groundwater recharge, agricultural and landscape irrigation, and recreation (e.g., rivers and lakes), as well as for aquacultural and industrial purposes [7]. Compared to other WW purification technologies, SAT has several significant advantages, including: (1) A robust filter for most municipal contaminants; (2) a low-tech approach; (3) minimal energy requirements; and (4) a sustainable reservoir of freshwater with minimal evaporation losses [4].
In a conventional SAT setup, the effluent from the WW treatment plant is intermittently discharged for additional filtration through designated infiltration basins [8]. Flooding and drying cycles are crucial to the SAT operation as they enable the top soil aeration, thus maintaining steady infiltration rates. During this treatment process, the effluent percolates through the vadose zone while organic and inorganic contaminants are removed, mainly via filtration, biodegradation, and adsorption [9,10]. These processes are most effective in the upper layer of the vadose zone, which contains higher concentrations of the oxygen used for bacterial metabolism [11]. Biodegradation occurs mainly within the top meter of the SAT system, by bacterial biofilms attached to the media [12,13], as well as through bacterivores and grazers that can be found in the pore water [14,15]. Processes and parameters that govern biodegradation efficiency include residence time, hydraulic loading rate, and microbial activity, which is linked to the soil redox potential [4,16]. The SAT effluent is then drawn, via recovery wells, after a residence time that ranges from a few months to a year in the unsaturated zone and the aquifer [5,17].
Over the past 30 years, Israel has been using SAT technology as a tertiary WW treatment. The Shafdan WW treatment plant (https://www.igudan.org.il/home-en/about-us/) reclaims about 140 million m3 of municipal WW per year for unrestricted agricultural irrigation [18,19,20]. In the Shafdan SAT, the secondary WW effluent infiltrates into the coastal aquifer through a 25–35-m sandy unsaturated system [21]. However, increasing WW volumes and escalating real estate prices around urban areas highlight the need to re-engineer the SAT process and maximize the recharge capacity without sacrificing the effluent quality [22]. Therefore, efforts are being made to maximize the percolation flux by: (1) Studying the spatiotemporal infiltration dynamics across the ponds using hydro-geophysical tools [23]; (2) releasing air which is entrapped below the wetting front [24]; (3) improving tillage technologies to effectively break the biocrust and maintain high infiltration rates in the ponds [25]; and (4) improving the SAT management by optimizing the length of the wetting and drying cycles.
However, one of the greatest challenges is to retain or even improve water quality, while increasing the percolation flux (thus, attaining a shorter residence time for microbial activity). Enhancing biodegradation rates was previously achieved using various porous materials for different applications, such as biofilters and bio-reactors [26], as well as storm water infiltration systems [27] and small constructed wetlands [28]. Yet, there is currently no information on the applications and implications of using highly porous material to enhance the SAT biodegradation efficiency, which has distinct operating conditions and inflow chemistry.
Experiments were carried out here to test the implications of replacing the SAT sandy topsoil with a highly porous natural material to substantially enhance the biodegradation rates and removal efficiency of an operational SAT. The research was done in intermediate scale columns by comparing the tuff, a porous medium produced naturally during volcanic eruptions, to sandy soil often found in SAT infiltration basins. The results and insights of this research point to the potential benefit of using porous tuff to substantially increase SAT biodegradation rates and filtration efficiency.

2. Materials and Methods

2.1. Experimental Design and Sediment Collection

Medium to coarse (3–5 mm) volcanic tuff (Tuff Merom Golan Co.) was placed in mesh bags and buried in the SAT infiltration pond (Shafdan, Israel) for 3 months to mature, namely to establish a natural microbial community on the media prior to the initiation of each experiment (Figure 1A). During the maturation period, the infiltration pond was routinely operated, namely undergoing 12–24-h cycles of flooding to a water level of 35–60 cm with an average infiltration flux of 1 m3 m−2 d−1. The wetting cycles were followed by 24–72-h drying periods before the next wetting cycle. The buried bags containing tuff and SAT-sand (silica) were collected from the same area and depth in the infiltration pond 24 h before the commencement of each column experiment.
All the experiments were performed with ~300 L of secondary effluent WW taken from the same pond where the media (tuff and sand) were collected from. Prior to each experiment, the effluent was sterilized (autoclaved at 121 °C for 30 min) and used as inflow for all the columns (Table 2). Bacterial abundance (BA) was measured from the sterilized effluent by flow cytometry before the addition to the columns to ensure that no microbes were added with the inflow, thus ensuring that only the biodegradation efficiency of the bacteria attached to the sand was tested. Four column replicates (for each medium) were performed in May, August, and November 2018. The secondary effluent temperatures during May, August, and November were 25, 30.2, and 23.4 °C, respectively, while pH ranged from 7.2–7.6 for all sampling times. Details on the biochemical characteristics of the media and WW secondary effluent, which was used as inflow for the experiments, are provided in Table 1 and Table 2, respectively.
Tuff and SAT-sand (1600 cm3) were packed in Perspex® columns (40 cm in length and 10 cm in diameter) over 2 cm of sterile silica-sand to minimize clogging of the effluent port. The perimeter of every column was covered with aluminum foil to minimize the photosynthetic activity (Figure S1). The secondary effluent WW flux through the columns was set to 1 m3 m−2 d−1 for 48 h, according to the operation of the Shafdan SAT, using a set of peristaltic pumps (Masterflex, Call-Parmer). The outflow sub-samples (100 mL) from each column replicate were collected at the end of each experiment for BA, total organic carbon (TOC), and total nitrogen (TN). Media samples were collected concomitantly from the center of each column (~10 cm deep) for bacterial production (BP), bacterial respiration (BR), BA, TOC/TN, scanning electron microscopy (SEM), and bacterial diversity. The same analyses, as described above for the outflow, were also performed on the TWW taken from the SAT basin (inflow solution). The above analyses were done at the commencement of each experiment (T0) and after 48 h (Tfinal). Details on each analytical method are provided below.

2.2. Analytical Methods

2.2.1. Bacterial Production Rates (BP)

These production rates (i.e., carbon assimilation rates) were measured using the [4,5-3H]-leucine (Perkin Elmer USA, specific activity 123.8 Ci mmol−1) incorporation method as previously described by [29], followed by centrifugation. Further details are provided in the Supporting Information.

2.2.2. Bacterial Respiration Rates (BR)

Media were collected (~24 g) and overflowed with sterile secondary effluent in 50-mL falcon tubes. Dissolved oxygen (DO) concentrations were measured immediately (T0) (YSI ProODO, OH, USA). At the end of the incubation (T12h), DO was measured for T12. Finally, the samples were dried in an oven (105 °C) for 24 h and weighed to normalize the resulting values to a gram of the medium. BR in the outflow was measured in a similar way to the above without the addition of media or secondary effluent. The BR rate was calculated according to the following Equation (1):
BR = DO   T 0 DO   T 12 Δ T
Oxygen respiration levels were converted into carbon consumption, assuming a respiratory quotient (RQ) of 1 [30] and further expressed as μg C g−1d−1.

2.2.3. Bacterial Carbon Demand (BCD)

BCD represents the overall carbon utilization taking place within the respective effluent and medium [31]. BCD was calculated as the sum of BP and BR according to [32].

2.2.4. Bacterial Abundance (BA)

Microbes associated with the media were suspended in sterile secondary effluent and removed via probe-sonication (Q Sonica Sonicator). The removed supernatant was then fixed with glutaraldehyde (50% in H2O, specially purified, Si Aldrich), incubated at room temperature for 10 min, and stored at −80 °C. Prior to the analysis with an Attune NxT acoustic focusing flow cytometer (Life technologies), samples were thawed in a 37 °C water bath and diluted with phosphate buffered saline (PBS). Further details on the staining technique and flow cytometry method are provided in the Supporting Information (Figure S2).

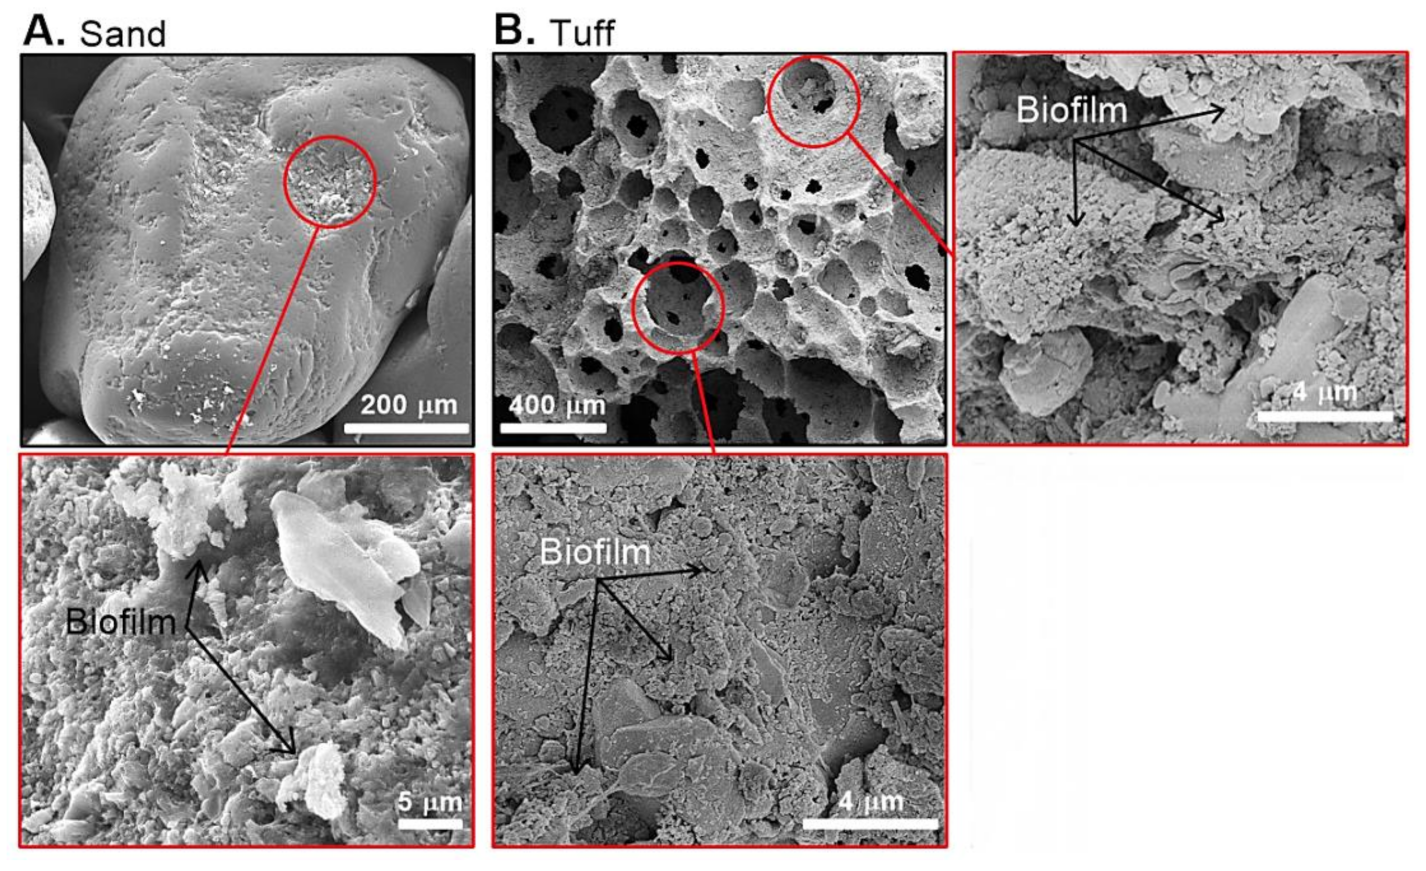
2.2.5. Scanning Electron Microscopy (SEM) Imaging

A few grains of each medium (~1 g) were collected from the center of the column, placed in sterile Eppendorf tubes, immediately covered with 2.5% glutaraldehyde in a wash buffer (0.1 M Cacodylate, 0.1% CaCl2, pH 7.2), and stored at 4 °C overnight until SEM preparation. Samples were stained and dehydrated for SEM according to [33]. Briefly, fixed samples were washed three times with a wash buffer, and then, bacterial cells were stained with osmium tetroxide (1% OsO4, 1.5% KFeCN in double distilled water (DDW)) for 4 h. After three rinses with DDW, the samples were dehydrated with sequential 10-min immersions in increasing concentrations of acetone (50 to 100%). When dry, the samples were coated with 20 nm of gold. Sand and tuff grains were examined with a FEI Verios 400 L high resolution SEM.

2.2.6. Total Organic Carbon (TOC) and Total Nitrogen (TN) Concentrations

Media were first collected (~3 g), supplemented with 10 mL of sterile secondary effluent in a sterile 15-mL falcon tube, and probe-sonicated for 60 s (CL-188 QSonica). The supernatant (5 mL) was transferred to another sterile 15-mL falcon tube, spiked with HCl (20 μL), and stored at 4 °C. The media were dried in an oven (105 °C) and weighed to allow normalization to the gram. Prior to the analysis, the supernatant (1 mL) was diluted with sterile water (9 mL). Five mL were placed in a glass vial and analyzed with a Certipur TOC standard solution (Analytikjena multi N/C 2100S analyzer). The standard curve profiles are provided in the Supporting Information. A similar analysis was performed on the TWW inflow.

2.2.7. Surface Area Analysis

Media samples (~0.1 g) were collected and dried at 121 °C to remove any contaminants from the grain pores. The dried samples were then analyzed using a NOVAtouch LX gas sorption analyzer (Quantachrome Instruments) for the BET surface area and pore size analysis of both the silica sand and tuff.

2.2.8. DNA Extraction and Community Analysis

Media samples (~1 g) were probe-sonicated (CL-188, QSONICA) for 1 min within a 1-mL lysis buffer (EDTA 0.5 M pH 8, sucrose, and Tris-HCl pH 8) and incubated with lysozyme (4.8 mg mL−1) for 30 min at 37 °C. Next, the samples were incubated for 1 h at 55 °C with sodium dodecyl sulfate (SDS, 1%) and proteinase K (2 mg mL−1). The samples were then purified with phenol pH 8 and then with phenol: Chloroform: IAA according to [34]. The DNA was kept at −80 °C for further analysis in RNAase DNAase free water.
DNA samples were sequenced by the Illumina MiSeq platform (Hy Laboratories Ltd., Israel). Briefly, sequence libraries were generated by amplifying the V4 region of the 16S rRNA gene by 515F and 806R (Earth Microbiome Project), followed by Fluidigm Access Array Primers for Illumina index sequences. PCR products were cleaned by AMPure beads. The new libraries were quantified by Qubit, while the size was determined by the Tapestation analysis. Libraries were then sequenced on an Illumina Miseq with the V2 kit for 500 cycles (250 × 2, paired end reads). The data analysis was performed using the CLC Bio Genomics Workbench and Microbial Module.

2.3. Statistical Analysis

All measurements from each experiment and between the experiments were compared using an analysis of variance (ANOVA) followed by Tukey and Fisher LSD post hoc tests (p < 0.05). Prior to analyses, the normality of distribution and homogeneity of variance were tested with the Shapiro Wilk test. All analyses were performed using the Microsoft XLSTAT software.

3. Results and Discussion

3.1. Improving SAT Biodegradation Efficiency Using Tuff as a Natural Bacterial Carrier

The topsoil profile of the Shafdan infiltration ponds mainly includes quartz-rich silica sand grains (diameter of ~1 mm), which have a limited surface area (~0.5 m2 g−1) for biofilm development (Figure 2A). In contrast, the tuff used here is highly porous with a surface area of ~8 m2 g−1 and cavity diameters ranging from 20 to 300 µm (Figure 2B). In addition, following a three-month maturation period in the infiltration pond, the buried tuff was found to be heavily colonized by diverse microbial phyla (details are provided below). Compared to the SAT-sand, the tuff from the same depth within that infiltration pond was found to be extensively covered (on and within the pores) by microbial biofilms (Figure 2B).
The large surface area and material porosity (internal porosity relative to the volume of ~30%) enabled the tuff to harbor a greater microbial biomass (compared to SAT-sand), while the large grain size (3–5 mm) may have provided a higher water permeability. Additionally, previous studies have suggested that the iron-rich tuff (due to its volcanic origin) enhances the adhesion of negatively charged organic material (including bacteria) due to a net positive charge [35]. The tuff’s high internal porosity may also increase the nutrient adsorption compared to the sand [36,37], thus supporting bacterial growth. It was previously reported that bacteria colonized the tuff almost immediately after natural water passed through the media [35]. However, it should be stressed that it may take several months to establish a mature and diverse microbial community on the tuff grains. Therefore, a maturation period in an operational infiltration pond is critical to allow the development of a native biofilm community, before testing the biodegradation efficiency of any new medium, including the tuff.

3.2. Biodegradation Related to the Tuff or Sand: From Bacterial Activity to Cell Abundance

The biodegradation and adsorption that occur in the SAT topsoil are mostly related (directly and indirectly) to bacterial abundance and microbial activity of cells, which are often in a biofilm state [38]. Compared to the SAT sand, carbon assimilation rates (measured as BP) were significantly higher (7.5-fold) for bacteria associated with the maturated tuff (Figure 3A) during all of the experimental campaigns (Table 1). Although a higher BP was detected from the tuff media compared to the SAT sand, rates were seasonally varied (Table 1). In this study, BP was measured to estimate the biodegradation rates of organic matter by bacterial biofilms associated with the sand and tuff [39,40,41]. Differently than the redox potential [42,43], BP focuses specifically on the breakdown and anabolic assimilation of organic carbon into cell structures. The average assimilation rates measured from the bacteria associated with the tuff, compared to the sand, were most likely due to the enhanced buildup of bacterial biomass on and within the porous structure of the tuff, as previously shown for other biofilters [35,44,45]. The highest BP rates were measured from the bacteria associated with both the tuff and sand during May (2.11 and 0.37 µg C g−1d−1, respectively). However, the greatest difference in BP rates between the two media was found to be in August (Table 1). Previous reports indicated that soil and water temperatures impact the microbial activity, as well as the redox conditions in the SAT topsoil [46,47]. Higher temperatures, as well as longer daylight hours, were shown to increase the redox potential within the microbial consortia in the infiltration basin topsoil [19]. Here, it was demonstrated that the highest microbial activity (measured as BP rates) of the biofilms associated with the tuff and sand was during the spring (May), when the water temperature was mild (~25° C). Differently than November, the high bacterial numbers attached to the media and the mild temperatures in the spring likely led to the high bacterial activity, since the chemical characteristics of the inflow were not significantly different (Table 1).
BR was also found to be significantly higher (2-fold) for bacteria associated with the tuff than with the sand (Figure 3B). BR represents the catabolic process in which molecules are broken down into their subunits, oxidized (under aerobic conditions), and released in the form of energy-rich compounds [30]. BR rates, similarly, to BP, varied between the experiments conducted in May, August, and November (Table 1). The highest BR rates were measured in tuff-associated bacteria in November (9.5 µg C g−1d−1) and sand-associated bacteria in August (3.7 µg C g−1d−1). Nonetheless, in those growing on the secondary effluent that infiltrated through the media, the overall BR trend was relatively consistent between the sand and tuff in May (2-fold), August (2-fold), and November (3-fold).
Combining both anabolic (BP) and catabolic (BR) reactions provides insights into the total organic carbon that was utilized by the bacterial community, which is often expressed as bacterial carbon demand (BCD) [29]. The bacterial consortium associated with the tuff had a significantly higher BCD (2.5-fold) than that associated with the sand (Figure 3C, Table 1). These results indicate that the organic consumption by the biofilm that colonized the tuff was substantially higher than that in the sand. Therefore, it can be assumed that less media volume (i.e., smaller areal footprint for the SAT infiltration basin) will be needed to biodegrade the organic material found in the secondary WW effluent inflow.
In contrast to the results for BP, those for BA indicated that the heterotrophic biomass values in the sand and maturated tuff were similar (Figure 3D). Therefore, it is surmised that the similarities in BA between the tuff and the sand were due to differences in the cell extraction process from the two media. Bacterial removal from the tuff and sand was performed via physicochemical processes (i.e., Ca+2 chelator and a short probe-sonication) to breakdown the extracellular matrix of the biofilm, and agitate and remove the attached cells from the grain surfaces [29,48]. Nonetheless, SEM imaging indicated that after 20 s of probe-sonication, the sand grains appeared almost bare, namely that all of the bacteria were removed from the surface (Figure S3A,B). In contrast, the deep pores and crevices of the tuff grains were extensively covered with bacterial biomass, after only 60 s of probe-sonication (Figure S3C,D). Removing and counting bacteria from solid surfaces using different physicochemical methods is challenging since the cells must be removed without damaging their structural integrity [49]. Hence, long durations of sonication or any other aggressive extraction methods cannot be used. Yet, according to the SEM images, it is clear that far more bacteria, as well as organic material, were attached to the tuff surface than to the sand (Figure S3).
The TOC concentration that was extracted from the maturated tuff was lower (up to 60%) than that from the sand in May and August, yet it was 50% higher in November (Table 1). The extracted TOC from the sand was highest in May (33.8 µg C g−1), while the highest TOC extracted from the tuff was detected in November (45.5 µg C g−1). Similarly, TN extracted from the tuff was lower (up to 47%) than that from the sand in May and August. However, for both media, the lowest TN concentrations were measured in mid-summer (August, ~3 µg N g−1). Although higher biodegradation rates are expected for the tuff-associated biofilm (according to the BCD), it can be surmised that the lower TOC and TN values from the tuff were the result of extraction efficiency from the porous media (Figure S3). These results indicate the strong attachment of cells (as part of the TOC) within the tuff pore structure and the difficulties in biomass removal, compared to the sand.

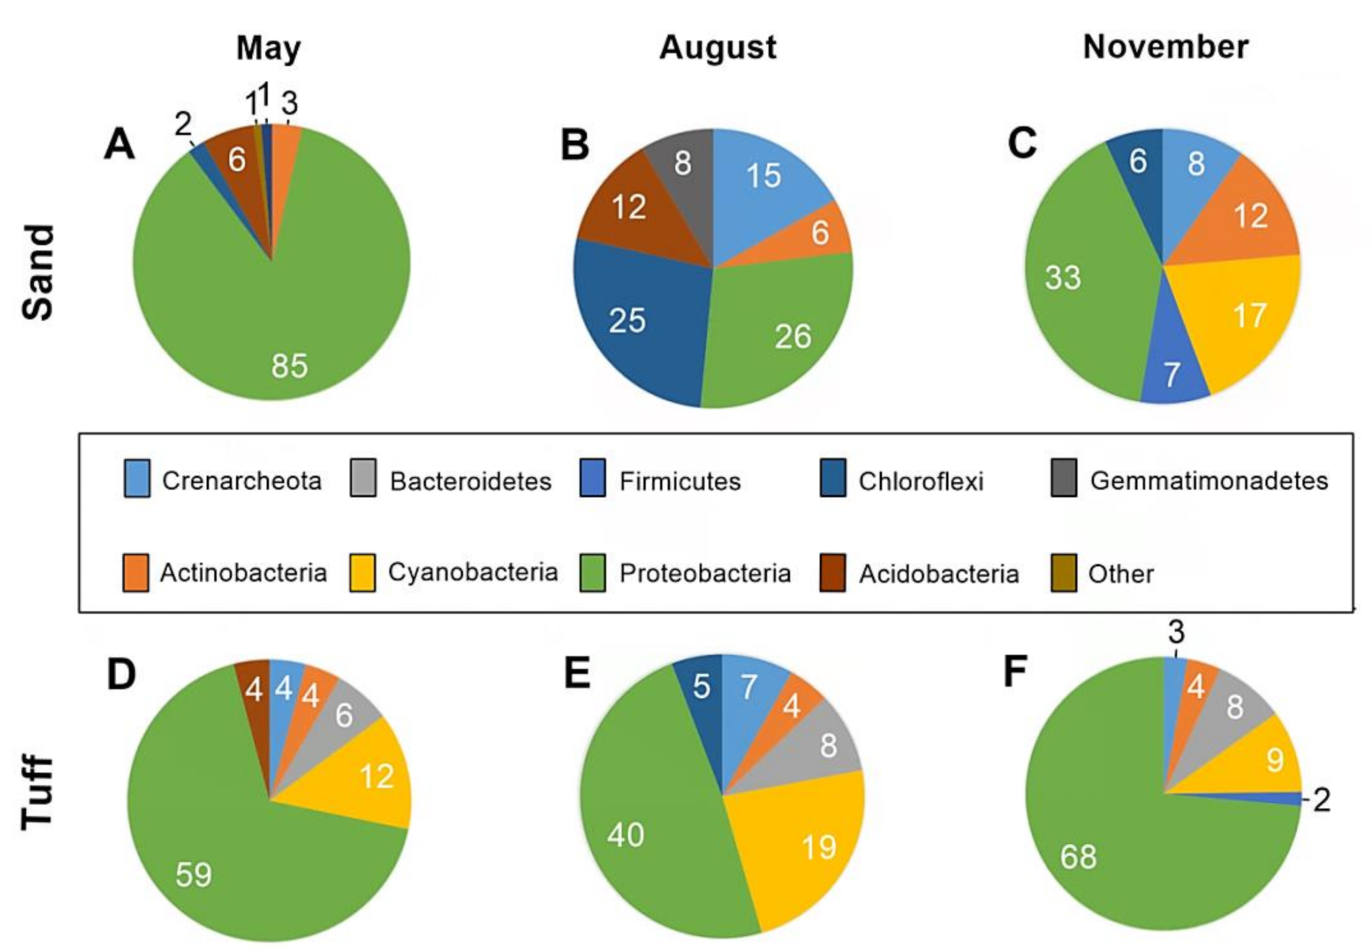
3.3. Bacterial Diversity Associated with the Sand and Maturated Tuff

The phyla that were most abundant (1% of the total operational taxonomic units, OTU) in each sample are presented to highlight the main differences in the community composition attached to the different samples (Figure 4). The results of this study demonstrate the different bacterial communities associated with the same medium during the three sampling periods (Figure 4A–C and Figure 4D–F ). Similarly to other reports [50,51,52], the microbial diversity associated with the SAT media changed throughout the year due to different abiotic variables (e.g., temperature, salinity, pH). Interestingly, the bacterial community associated with the silica sand was markedly different than that attached to the tuff media, regardless of the abiotic conditions in the immediate environment (Figure 4A–C vs. Figure 4D–F).
Proteobacteria was found to prevail on the tuff in all of the experiments (Figure 4). These four Proteobacterial classes (Alpha, Beta, Delta, and Gamma) were included in this phylum. Alphaproteobacteria constituted an average of 44% of the Proteobacterial population throughout all of these samples. Some of the species were related to phototrophic bacteria, which are known to survive in anoxic environments while also being able to undergo nitrification, an important step in the WW treatment. In contrast, heterotrophic Gamma- and Betaproteobacteria obtain their energy via the oxidization of various chemical bonds of organic compounds [53] and are known to act as primary ammonia-oxidizing bacteria under aerobic conditions [54]. Gamma- and Betaproteobacteria made up an additional ~25% of the Proteobacterial population since the SAT infiltration ponds were often saturated with organic matter in the uppermost meter of the soil profile. Although highly abundant, it is unlikely that Proteobacteria were responsible for the differences in biodegradation rates between the tuff and sand, as the OTU percentage of this phylum was similar in both media.
Apart from Proteobacteria, studies have reported that the most abundant phyla often found in the soil of wetlands that treat wastewater are Firmicutes, Actinobacteria, Bacteroidetes, Chloroflexi, and Cyanobacteria [15,55,56,57,58]. This bacterial diversity is highly similar to the biofilm communities found in the SAT sand and tuff (Figure 4A–C). However, one variation between the sand and tuff was that Actinobacteria, Chloroflexi, and Acidobacteria were either minimally present or completely absent in the tuff throughout the three experiments. In contrast, Bacteroidetes were solely found within the tuff throughout the different experiments. Bacteroidetes contain microbes that inhabit a variety of ecosystems, ranging from strictly aerobic to anaerobic, and are generally not one of the most abundant bacterial phyla found in soils [59]. Flavobacteriaceae, a prominent aerobic class of Bacteroidetes, was abundant in the tuff. Their maximum growth rate occurs at temperatures between 20 and 30 °C, and they specialize in degrading organic matter [60]. It is likely that the conditions found in the uppermost meter of the infiltration pond and the high organic matter content that was present within the tuff pores support maximal growth rates for Bacteroidetes.
Cyanobacteria, in addition to Proteobacteria, were found to be highly abundant (9–19% of OTU) on the tuff samples compared to the sand (not found on the sand except for November, 17%). The most identified species of Cyanobacteria was related to Rivularia sp., accounting for 13% of the entire phylum. Former studies have indicated that Cyanobacteria can be used as a bio-indicator for water quality [61]. According to Mateo et al., the identification of Rivularia sp. indicated low phosphorous concentrations and better water quality [62]. Similarly, it is suggested that the WW effluent percolating through the tuff possibly contained lower phosphorous concentrations and had better water quality than the SAT sand.
Based on the above-mentioned data, we stress that despite being exposed to similar operational conditions (i.e., similar hydraulic loading rate/municipal secondary effluent) and taken from similar depths of the same infiltration pond, the community structures of the tuff and the sand were clearly different. These differences are attributed to the properties of the porous material, which caused distinct bacterial community structures to grow, likely due to the different water quality levels after percolation through the respective medium. Although site-specific, these results suggest that the tuff bolsters the growth of distinct bacterial communities with potentially better biodegradation rates than the SAT sand.

3.4. Water Quality of Sand and Tuff Filtrate

BA, TOC, and TN concentrations were measured from the column outflow as a proxy for water quality. The average bacterial concentrations following tuff filtration were ~25% lower than in the sand outflow. Similarly, the average TOC and TN concentrations were 20 and 24% lower, respectively, in the tuff outflow than in the sand outflow (see Table 2). In addition, the filtration efficiency of BA, TOC, and TN was calculated according to the following equation:
Filtration   efficiency   % =   X T 0 X TF X T 0 × 100
where X(T0) refers to the BA, TOC, and TN concentrations in the secondary effluent WW sampled from the SAT pond, which served as the feed solution (inflow) to the overall experiment. Concurrently, X(TF) refers to the BA, TOC, and TN concentrations of the collected outflow after percolation at an inflow flux of 1 m3 m−2 d−1 (values are shown in Table 2). The removal of total bacteria (ΔBA) from the WW feedwater was 2.5-fold greater after percolation through the tuff than the sand (Figure 5A). Moreover, it has been found that bacterial numbers were often higher in the sand effluent than the feedwater, leading to a negative ΔBA. These data indicate that the tuff not only settled more bacteria, but also had less bacterial detachment, leading to lower BA values in the outflow. This is in accordance with previous studies showing that biofilms in infiltration systems enhance the biomass removal by providing additional adsorption sites for both pathogens and other organic matter [12,35,63,64]. Differently, the higher BA measured in the sand outflow was likely due to the greater bacterial detachment rates from the sand than from the tuff (Figure 2). In contrast to the rough, the furrowed surface of the tuff (Figure 2), the shear forces of percolating feedwater lead to a higher detachment of cells from biofilms that grow on the SAT sand.
The TOC filtration efficiency (ΔTOC) was found to be significantly greater (1.5-fold) following percolation through the tuff than the sand (Figure 5B). Similarly, the TN removal (ΔTN) was 44% greater following percolation through the tuff than the sand yet did not statistically differ between the two media (Figure 5C). Previous studies have shown that the SAT TOC removal efficiency may reach up to 90%, with an average retention time of a few months to a year while percolating through 25–40 m of sand dunes and further horizontal flow within the aquifer [17,19,20,65]. It was found that the TOC removal through a 20-cm sand column with a retention time of ~70 min was about 16.5%. It should be stressed that under similar hydraulic conditions, the tuff columns removed an average of 35%. Since the main mechanism of TOC removal in the SAT topsoil is biodegradation [8,12], the TOC removal efficiency in the tuff was linked to the high measured bacterial activity (i.e., BP and BR rates) (shown in Table 1).
The results of this study also indicate that the SAT sand removed between 10 and 13% of TN, while the tuff removed 13% in November and 61% in May (no data was available for the August experiment). Regardless of the different nitrogen species (no information is available), the residual nitrogen in the outflow provides an additional indication of water quality. It is suggested that the lower TN concentrations in the outflow were directly related to the greater activity of bacterial biofilms associated with the tuff than with the sand. More research is needed to quantitatively compare the tuff and SAT sand with regard to the residual concentrations and related removal efficiencies of the different nitrogen species.

4. Conclusions

Increasing volumes of domestic WW, high demand for land, and escalating real estate prices in urban areas highlight the need to maximize the recharge capacity of SAT systems, without extending their physical footprint or harming the water quality. The tuff medium that was matured in the SAT infiltration basin harbored more bacterial biomass, which was subsequently more active (BCD of 2.5-fold), than the silica sand currently used in the SAT infiltration basins. The enhanced activity in the tuff leads to a higher (1.5-fold) filtration efficiency without sacrificing the outflow quality compared to the natural SAT sand. The results of this study suggest that replacing and/or amending the SAT topsoil with a highly permeable medium comprising a super-porous material, such as tuff, significantly improves the biodegradation efficiency of organic material found in the secondary effluent WW that infiltrates through SAT. Nonetheless, future research should address alternative approaches to enhance the percolation fluxes and utilize the higher biodegradation rates using tuff media.
Considering all of the above, this research indicates that using tuff can significantly improve the treatment of municipal WW with high organic matter concentrations. The trends reported here indicate that using tuff as SAT topsoil could provide an eminent upgrade to the already advantageous SAT system or other managed aquifer recharge (MAR) approaches for developed and developing countries.

Supplementary Materials

The following are available online at https://www.mdpi.com/2073-4441/12/12/3593/s1. Here, we include the details on the column experiments’ design and setup (Figure S1). Further information on bacterial production (BP) and bacterial abundance (BA) analyses, i.e., flow cytometry and SEM (Figures S2 and S3), is also provided.

Author Contributions

The manuscript was written through the contributions of all authors. All authors have read and agreed to the published version of the manuscript.

Funding

This work was supported by the Israel-U.S. Collaborative Water-Energy Research Center (CoWERC), via the Binational Industrial Research and Development Foundation (BIRD) Energy Center grant EC-15.

Acknowledgments

We gratefully acknowledge the Regina Foundation for supporting this project. Our thanks also go to Roxana Golan of Ben-Gurion University for her SEM expertise. In addition, we would like to thank Raz Amir for all of his technical support and Ido Negev of Mekorot, Israel for his cooperation and insights with regard to the Shafdan SAT system.

Conflicts of Interest

We declare that there is no conflict of interest and that all co-authors have seen and approved the current version for submission.

References

  1. Kookana, R.S.; Drechsel, P.; Jamwal, P.; Vanderzalm, J. Urbanisation and emerging economies: Issues and potential solutions for water and food security. Sci. Total Environ. 2020, 732, 139057. [Google Scholar] [CrossRef] [PubMed]
  2. McDonald, R.I.; Green, P.; Balk, D.; Fekete, B.M.; Revenga, C.; Todd, M.; Montgomery, M. Urban growth, climate change, and freshwater availability. Proc. Natl. Acad. Sci. USA 2011, 108, 6312–6317. [Google Scholar] [CrossRef] [PubMed] [Green Version]
  3. Jaramillo, F.; Restrepo, I. Wastewater reuse in agriculture: A review about its limitations and benefits. Sustainability 2017, 10, 1734. [Google Scholar] [CrossRef] [Green Version]
  4. Sharma, S.K.; Kennedy, M.D. International biodeterioration & biodegradation soil aquifer treatment for wastewater treatment and reuse. Int. Biodeterior. Biodegrad. 2017, 119, 671–677. [Google Scholar]
  5. Dillon, P.; Stuyfzand, P.; Grischek, T.; Lluria, M.; Pyne, R.D.G.; Jain, R.C.; Bear, J.; Schwarz, J.; Wang, W.; Fernandez, E.; et al. Sixty years of global progress in managed aquifer recharge. Hydrogeol. J. 2019, 27, 1–30. [Google Scholar] [CrossRef] [Green Version]
  6. Hermes, N.; Jewell, K.S.; Schulz, M.; Müller, J.; Hübner, U.; Wick, A.; Drewes, J.E.; Ternes, T.A. Elucidation of removal processes in sequential biofiltration (SBF) and soil aquifer treatment (SAT) by analysis of a broad range of trace organic chemicals (TOrCs) and their transformation products (TPs). Water Res. 2019, 163, 114857. [Google Scholar] [CrossRef]
  7. Huertas, E.; Salgot, M.; Hollender, J.; Weber, S.; Dott, W.; Khan, S.; Schäfer, A.; Messalem, R.; Bis, B.; Aharoni, A.; et al. Key objectives for water reuse concepts. Desalination 2008, 218, 120–131. [Google Scholar] [CrossRef]
  8. Amy, G.; Drewes, J. Soil aquifer treatment (SAT) as a natural and sustainable wastewater reclamation/reuse technology: Fate of wastewater effluent organic matter (EfoM) and trace organic compounds. Environ. Monit. Assess. 2007, 129, 19–26. [Google Scholar] [CrossRef]
  9. Fox, P.; Narayanaswamy, K.; Genz, A.; Drewes, J.E. Water quality transformations during soil aquifer treatment at the mesa northwest water reclamation. Water Sci. Technol. 2001, 40, 343–350. [Google Scholar] [CrossRef]
  10. Drewes, J.E.; Quanrud, D.M.; Amy, G.L.; Westerhoff, P.K. Character of organic matter in soil-aquifer treatment systems. J. Environ. Eng. 2006, 132, 1447–1458. [Google Scholar] [CrossRef]
  11. Icekson-Tal, N.; Avraham, O.; Sack, J.; Cikurel, H. Water reuse in Israel-the dan region project: Evaluation of water quality and reliability of plant’s operation. Water Sci. Technol. Water Supply 2003, 3, 231–237. [Google Scholar] [CrossRef]
  12. Abel, C.D.T.; Sharma, S.K.; Malolo, Y.N.; Maeng, S.K.; Kennedy, M.D.; Amy, G.L. Attenuation of bulk organic matter, nutrients (N and P), and pathogen indicators during soil passage: Effect of temperature and redox conditions in simulated soil aquifer treatment (SAT). Water Air Soil Pollut. 2012, 223, 5205–5220. [Google Scholar] [CrossRef]
  13. Lin, C.; Shacahr, Y.; Banin, A. Heavy metal retention and partitioning in a large-scale soil-aquifer treatment (SAT) system used for wastewater reclamation. Chemosphere 2004, 57, 1047–1058. [Google Scholar] [CrossRef] [PubMed]
  14. Novarino, G.; Warren, A.; Butler, H.; Lambourne, G.; Boxshall, A.; Bateman, J.; Kinner, N.E.; Harvey, R.W.; Mosse, R.A.; Teltsch, B. Protistan communities in aquifers: A review. FEMS Microbiol. Rev. 1997, 20, 261–275. [Google Scholar] [CrossRef]
  15. Lang, X.; Chen, X.; Xu, A.; Song, Z.; Wang, X.; Wang, H. Variation of bacterial and archaeal community structures in a full-scale constructed wetlands for wastewater treatment. Hindawi 2018, 2018, 1–12. [Google Scholar] [CrossRef]
  16. Regnery, J.; Gerba, C.P.; Dickenson, E.R.V.; Drewes, J.E. The importance of key attenuation factors for microbial and chemical contaminants during managed aquifer recharge: A review. Crit. Rev. Environ. Sci. Technol. 2017, 47, 1409–1452. [Google Scholar] [CrossRef]
  17. Oren, O.; Gavrieli, I.; Burg, A.; Guttman, J.; Lazar, B. Manganese mobilization and enrichment during soil aquifer treatment (SAT) of effluents, the dan region sewage reclamation project (Shafdan), Israel. Environ. Sci. Technol. 2007, 41, 766–772. [Google Scholar] [CrossRef]
  18. Arye, G.; Dror, I.; Berkowitz, B. Fate and transport of carbamazepine in soil aquifer treatment (SAT) infiltration basin soils. Chemosphere 2011, 82, 244–252. [Google Scholar] [CrossRef]
  19. Goren, O.; Burg, A.; Gavrieli, I.; Negev, I.; Guttman, J.; Kraitzer, T.; Kloppmann, W.; Lazar, B. Biogeochemical processes in infiltration basins and their impact on the recharging effluent, the soil aquifer treatment (SAT) system of the Shafdan plant, Israel. Appl. Geochem. 2014, 48, 58–69. [Google Scholar] [CrossRef]
  20. Lakretz, A.; Mamane, H.; Cikurel, H.; Avisar, D.; Gelman, E.; Zucker, I. The role of soil aquifer treatment (SAT) for effective removal of organic matter, trace organic compounds and microorganisms from secondary effluents pre-treated by ozone. Ozone Sci. Eng. 2017, 39, 385–394. [Google Scholar] [CrossRef]
  21. Aharoni, A.; Cikurel, H.; Jeke, M.; Ernst, M. Improved SAT Processes for All-Purpose Water Production from Secondary Effluents. In Proceedings of the Poster Presentation, Switch Project Final Conference, “The Future of Urban Water: Solutions for Livable and Resilient Cities”, Paris, France, 24−26 January 2011; pp. 24–26. [Google Scholar]
  22. Ben Moshe, S.; Weisbrod, N.; Barquero, F.; Sallwey, J.; Orgad, O.; Furman, A. On the role of operational dynamics in biogeochemical efficiency of a soil aquifer treatment system. Hydrol. Earth Syst. Sci. 2020, 24. [Google Scholar] [CrossRef] [Green Version]
  23. Haaken, K.; Furman, A.; Weisbrod, N.; Kemna, A. Time-lapse electrical imaging of water infiltration in the context of soil aquifer treatment. Vadose Zone J. 2016, 15, 1–12. [Google Scholar] [CrossRef]
  24. Mizrahi, G.; Furman, A.; Weisbrod, N. Infiltration under confined air conditions: Impact of inclined soil surface. Vadose Zone J. 2016, 15, 1–8. [Google Scholar] [CrossRef]
  25. Negev, I.; Shechter, T.; Shtrasler, L.; Rozenbach, H.; Livne, A. The effect of soil tillage equipment on the recharge capacity of infiltration ponds. Water 2020, 12, 541. [Google Scholar] [CrossRef] [Green Version]
  26. Hrenovic, J.; Kovacevic, D.; Ivankovic, T.; Tibljas, D. Selective immobilization of Acinetobacter junii on the natural zeolitized tuff in municipal wastewater. Colloids Surf. B Biointerfaces 2011, 88, 208–214. [Google Scholar] [CrossRef] [PubMed]
  27. Grebel, J.E.; Mohanty, S.K.; Torkelson, A.A.; Boehm, A.B.; Higgins, C.P.; Maxwell, R.M.; Nelson, K.L.; Sedlak, D.L. Engineered infiltration systems for urban stormwater reclamation. Environ. Eng. Sci. 2013, 30, 437–454. [Google Scholar] [CrossRef]
  28. Gross, A.; Sklarz, M.Y.; Yakirevich, A.; Soares, M.I.M. Small scale recirculating vertical flow constructed wetland (RVFCW) for the treatment and reuse of wastewater. Water Sci. Technol. 2008, 58, 487–494. [Google Scholar] [CrossRef]
  29. Frank, H.; Fussmann, K.E.; Rahav, E.; Bar-Zeev, E. Chronic effects of brine discharge from large-scale seawater reverse osmosis desalination facilities on benthic bacteria. Water Res. 2019, 151, 478–487. [Google Scholar] [CrossRef]
  30. Del Giorgio, P.A.; Cole, J.J. Bacterial growth efficiency in natural aquatic systems. Annu. Rev. Ecol. Syst. 1998, 29, 503–541. [Google Scholar] [CrossRef] [Green Version]
  31. Lønborg, C.; Martínez-García, S.; Teira, E. Bacterial carbon demand and growth efficiency in a coastal upwelling system. Aquat. Microb. Ecol. 2011, 63, 183–191. [Google Scholar] [CrossRef] [Green Version]
  32. Bar-Zeev, E.; Rahav, E. Microbial metabolism of transparent exopolymer particles during the summer months along a eutrophic estuary system. Front. Microbiol. 2015, 6, 403. [Google Scholar] [CrossRef] [PubMed] [Green Version]
  33. Gamliel, H. Optimum fixation conditions may allow air drying of soft biological specimens with minimum cell shrinkage and maximum preservation of surface features. Scanning Electron. Microsc. 1985, Pt 4, 1649–1664. [Google Scholar]
  34. Bar-Zeev, E.; Yogev, T.; Man-Aharonovich, D.; Kress, N.; Herut, B.; Béjà, O.; Berman-Frank, I. Seasonal dynamics of the endosymbiotic, nitrogen-fixing cyanobacterium Richelia intracellularis in the eastern Mediterranean Sea. ISME J. 2008, 2, 911–923. [Google Scholar] [CrossRef] [PubMed]
  35. Bar-Zeev, E.; Belkin, N.; Liberman, B.; Berman-Franka, I.; Berman, T. Bioflocculation: Chemical free, pre-treatment technology for the desalination industry. Water Res. 2013, 47, 3093–3102. [Google Scholar] [CrossRef] [PubMed]
  36. Heiken, G. Tuffs: Their Properties, Uses, Hydrology, and Resources; Geological Society of America: Boulder, CO, USA, 2006; p. 48. [Google Scholar]
  37. Story, S.; Amy, P.S.; Bishop, C.W.; Colwell, F.S. Bacterial transport in volcanic tuff cores under saturated flow conditions. Geomicrobiol. J. 1995, 13, 249–264. [Google Scholar] [CrossRef]
  38. Essandoh, H.M.K.; Tizaoui, C.; Mohamed, M.H.A.; Amy, G.; Brdjanovic, D. Soil aquifer treatment of artificial wastewater under saturated conditions. Water Res. 2011, 45, 4211–4226. [Google Scholar] [CrossRef] [PubMed]
  39. Simon, M.; Azam, F. Protein content and protein synthesis rates of planktonic marine bacteria. Mar. Ecol. Prog. Ser. 1989, 51, 201–213. [Google Scholar] [CrossRef]
  40. Smith, D.C.; Azam, F. A simple, economical method for measuring bacterial protein synthesis rates in seawater using 3H-leucine 1. Mar. Microb. Food Webs 1992, 6, 107–114. [Google Scholar]
  41. Kirchman, D. Measuring bacterial biomass production and growth rates from leucine incorporation in natural aquatic environments. Methods Microbiol. 2001, 30, 227–237. [Google Scholar]
  42. Fiedler, S.; Vepraskas, M.J.; Richardson, J.L. Soil redox potential: Importance, field measurements, and observations. Adv. Agron. 2007, 94, 1–54. [Google Scholar]
  43. Eshel, G.; Banin, A. Feasibility study of long-term continuous field measurement of soil redox potential. Commun. Soil Sci. Plant Anal. 2002, 33, 695–709. [Google Scholar] [CrossRef]
  44. Sabbah, I.; Baransi, K.; Massalha, N.; Dawas, A.; Saadi, I.; Nejidat, A. Efficient ammonia removal from wastewater by a microbial biofilm in tuff-based intermittent biofilters. Ecol. Eng. 2013, 53, 354–360. [Google Scholar] [CrossRef]
  45. Or, D.; Smets, B.F.; Wraith, J.M.; Dechesne, A.; Friedman, S.P. Physical constraints affecting bacterial habitats and activity in unsaturated porous media—A review. Adv. Water Resour. 2007, 30, 1505–1527. [Google Scholar] [CrossRef]
  46. Carrera, J.; Vicent, T.; Lafuente, F.J. Influence of temperature on denitrification of an industrial high-strength nitrogen wastewater in a two-sludge system. Water SA 2003, 29, 11–16. [Google Scholar] [CrossRef] [Green Version]
  47. Olivie-Lauquet, G.; Gruau, G.; Dia, A.; Riou, C.; Jaffrezic, A.; Henin, O. Release of trace elements in wetlands: Role of seasonal variability. Water Res. 2001, 35, 943–952. [Google Scholar] [CrossRef]
  48. Danovaro, R. Methods for the Study of Deep-Sea Sediments, Their Functioning and Biodiversity; CRC Press: Boca Raton, FL, USA, 2009. [Google Scholar]
  49. Svendsen, E.; Dahle, S.W.; Hagemann, A.; Birkevold, J.; Delacroix, S.; Andersen, A.B. Effect of ultrasonic cavitation on small and large organisms for water disinfection during fish transport. Aquac. Res. 2018, 49, 1166–1175. [Google Scholar] [CrossRef] [Green Version]
  50. Rudrashetti, A.P.; Jadeja, N.B.; Gandhi, D.; Juwarkar, A. Microbial population shift caused by sulfamethoxazole in engineered-soil aquifer treatment (e-SAT) system. World J. Microbiol. Biotechnol. 2017, 33, 1–13. [Google Scholar] [CrossRef]
  51. He, K.; Asada, Y.; Echigo, S.; Itoh, S.; He, K. Biodegradation of pharmaceuticals and personal care products in the sequential combination of activated sludge treatment and soil aquifer treatment combination of activated sludge treatment and soil aquifer treatment. Environ. Technol. 2020, 41, 378–388. [Google Scholar] [CrossRef]
  52. Faulwetter, J.L.; Gagnon, V.; Sundberg, C.; Chazarenc, F.; Burr, M.D.; Brisson, J.; Camper, A.K.; Stein, O.R. Microbial processes influencing performance of treatment wetlands: A review. Ecol. Eng. 2009, 35, 987–1004. [Google Scholar] [CrossRef]
  53. Kersters, K.; Vos, P.D.E.; Gillis, M.; Swings, J.; Vandamme, P. Introduction to the Proteobacteria. In The Prokaryotes: A Handbook on the Biology of Bacteria; Springer: Berlin/Heidelberg, Germany, 2006; pp. 3–37. [Google Scholar]
  54. Wagner, M. Phylogeny of all recognized species of ammonia oxidizers based on comparative 16S rRNA and amoA sequence analysis: Implications for molecular diversity surveys. Society 2000, 66, 5368–5382. [Google Scholar]
  55. Guo, Y.; Gong, H.; Guo, X. Rhizosphere bacterial community of Typha angustifolia and water quality in a river wetland supplied with reclaimed water. Appl. Microbiol. Biotechnol. 2015, 99, 2883–2893. [Google Scholar] [CrossRef] [PubMed]
  56. Cao, Q.; Wang, H.; Chen, X.; Wang, R.; Liu, J. Composition and distribution of microbial communities in natural river wetlands and corresponding constructed wetlands. Ecol. Eng. 2017, 98, 40–48. [Google Scholar] [CrossRef]
  57. Rampadarath, S.; Bandhoa, K.; Puchooa, D.; Jeewon, R.; Bal, S. Early bacterial biofilm colonizers in the coastal waters of Mauritius. Electron. J. Biotechnol. 2017, 29, 13–21. [Google Scholar] [CrossRef]
  58. Zhang, J.; Wang, Q.; Fan, J.; Xie, H.; Liu, C.; Liang, S.; Hu, Z.; Yang, Z.; Zhao, C. Comparisons of microbial abundance and community among different plant species in constructed wetlands in summer. Ecol. Eng. 2015, 82, 376–380. [Google Scholar] [CrossRef]
  59. Wolińska, A.; Kuźniar, A.; Zielenkiewicz, U.; Izak, D.; Szafranek-Nakonieczna, A.; Banach, A.; Błaszczyk, M. Bacteroidetes as a sensitive biological indicator of agricultural soil usage revealed by a culture-independent approach. Appl. Soil Ecol. 2017, 119, 128–137. [Google Scholar] [CrossRef]
  60. Bernardet, J.-F.; Bowman, J.P. Proteobacteria: Delta and Epsilon Subclasses. Deeply Rooting Bacteria. In The Prokaryotes: A Handbook on the Biology of Bacteria; Dworkin, M., Falkow, S., Rosenberg, E., Schleifer, K.H., Stackebrandt, E., Eds.; Springer: New York, NY, USA, 2006; pp. 481–531. [Google Scholar]
  61. Douterelo, I.; Perona, E.; Mateo, P. Use of cyanobacteria to assess water quality in running waters. Environ. Pollut. 2004, 127, 377–384. [Google Scholar] [CrossRef]
  62. Mateo, P.; Berrendero, E.; Perona, E.; Loza, V.; Whitton, B.A. Phosphatase activities of cyanobacteria as indicators of nutrient status in a Pyrenees River. Hydrobiologia 2010, 652, 255–268. [Google Scholar] [CrossRef]
  63. Ausland, G.; Stevik, T.K.; Hanssen, J.F.; Køhler, J.C.; Jenssen, P.D. Intermittent filtration of wastewater-removal of fecal coliforms and fecal Streptococci. Water Res. 2002, 36, 3507–3516. [Google Scholar] [CrossRef]
  64. Liu, Y.; Yang, C.H.; Li, J. Adhesion and retention of a bacterial phytopathogen Erwinia chrysanthemi in biofilm-coated porous media. Environ. Sci. Technol. 2008, 42, 159–165. [Google Scholar] [CrossRef]
  65. Elkayam, R.; Michail, M.; Mienis, O.; Kraitzer, T.; Tal, N.; Lev, O. Soil aquifer treatment as disinfection unit. J. Environ. Eng. 2015, 141, 05015001. [Google Scholar] [CrossRef]
Figure 1. Experimental microcosm schematics. Maturated media samples (tuff or sand) were excavated (30 cm deep) from an infiltration pond (A) and placed in transparent Perspex® columns. Concurrently, the secondary effluent was collected from an adjacent infiltration pond (B) and added to the columns. The content overview and respective amounts of the media placed in each column are depicted in the enlarged column (C). Quadruplicates of maturated tuff (D) and sand (E) were tested after 48 h (Table 1) of sterile secondary WW inflow at a flux similar to that measured in the Shafdan Soil aquifer treatment (SAT) (1 m3 m−2 d−1). The outflow following media filtration (50 mL) was collected and analyzed to determine the overall water quality (F). A summary of the experimental design that highlights the different analyses performed at each stage is provided in (G). The various analytical methods and where the samples were taken from are also depicted.
Water 12 03593 g001
Figure 2. Scanning electron microscope images showing the biofilm presence on a sand grain surface (A) and within the canals of a tuff grain (B). All images were taken prior to any sonication.
Water 12 03593 g002
Figure 3. Average values of (A) bacterial production (BP), (B) bacterial respiration (BR), (C) bacterial carbon demand (BCD), and (D) the mass of total bacteria, which were measured from three independent column experiments conducted in May, August, and November 2018. Asterisks indicate a statistically significant difference between measurements from the sand and the maturated tuff (p < 0.01, n = 12). It is surmised that the large standard deviations were due to the large differences in values per experiment due to seasonal changes.
Water 12 03593 g003
Figure 4. Community structures of the six most abundant phyla that constituted the biofilms associated with the sand and the tuff grains, during the three sampling periods. Analysis in community structure during the different sampling months collected from the sand (AC) and tuff (DF). All the numbers represent the percent operational taxonomic units (OTU) out of the total abundance.
Water 12 03593 g004
Figure 5. Overall average removal of (A) bacterial abundance (BA), (B) total organic carbon (TOC), and (C) total nitrogen (TN) found within the secondary effluent inflow and after undergoing percolation (Δ) through ~30 cm of SAT sand and maturated tuff, respectively. Data are shown as the difference of T0–T48 (h) and exclude the August experiment. Asterisks indicate a statistically significant difference between measurements from the sand and the maturated tuff (p < 0.01, n = 12).
Water 12 03593 g005
Table 1. Microbial and organic analysis of sand and tuff media. Numbers are shown as averages (with corresponding standard deviations, STDV) of each quadruplicate set.
Method and MediumUnitsMayAugustNovember
BP sandµg C g−1 d−10.4 ± 0.20.01 ± <0.0010.01 ± <0.001
BP tuffµg C g−1 d−12.1 ± 0.40.6 ± 0.10.1 ± 0.04
BR sandµg C g−1 d−12.93 ± 0.23.67 ± 0.23.45 ± 0.6
BR tuffµg C g−1 d−15.30 ± 1.78.17 ± 0.59.51 ± 0.5
BCD sandµg C g−1 d−13.30 ± 0.13.67 ± 0.23.46 ± 0.6
BCD tuffµg C g−1 d−17.41 ± 0.88.73 ± 0.59.61 ± 0.5
BA attached to sandHet. × 108 Bac g−136 ± 5.52.0 1.9 ± 0.5
BA attached to tuffHet. × 108 Bac g−135 ±3.13.7 ± 0.30.5 ± 0.2
TOC sandµg C g−133.8 ± 16.331.6 ± 17.122.8 ± 10.7
TOC tuffµg C g−116.8 ± 7.811.6 ± 0.145.5 ± 18.3
TN sandµg N g−119.2 ± 13.73.2 ± 1.118.6 ± 16.4
TN tuffµg N g−110.4 ± 8.93.5 ± 0.210.3 ± 1.9
Table 2. Water quality results of the secondary effluent wastewater (WW) inflow and the outflow after 48 h of percolation through the columns of media. Numbers are shown as averages (with STDV) of each quadruplicate set.
Organic MaterialUnitsMayNovember
TOC in the inflowmg L−114.6 ± 014.0 ± 0
TOC in sand effluent mg L−112.2 ± 0.211.6 ± 0.91
TOC in tuff effluentmg L−18.68 ± 1.59.86 ± 0.13
TN in the inflowmg L−17.50 ± 06.80 ± 0
TN in sand effluentmg L−16.47 ± 0.316.10 ± 0.33
TN in tuff effluentmg L−12.87 ± 0.985.92 ± 0.16
BA in the inflowHet. Bac × 109 L−13.2 ± 0.13 2.1 ± 0
BA in sand effluentHet. Bac × 109 L−13.6 ± 0.23 1.8 ± 0.68
BA in tuff effluentHet. Bac × 109 L−11.9 ± 0.651.3 ± 0.24
Publisher’s Note: MDPI stays neutral with regard to jurisdictional claims in published maps and institutional affiliations.

