Application of Irrigation Water Quality Indices and Multivariate Statistical Techniques for Surface Water Quality Assessments in the Northern Nile Delta, Egypt


 ,
,  ,
,  ,
,  and
and 
Abstract
1. Introduction
2. Material and Methods
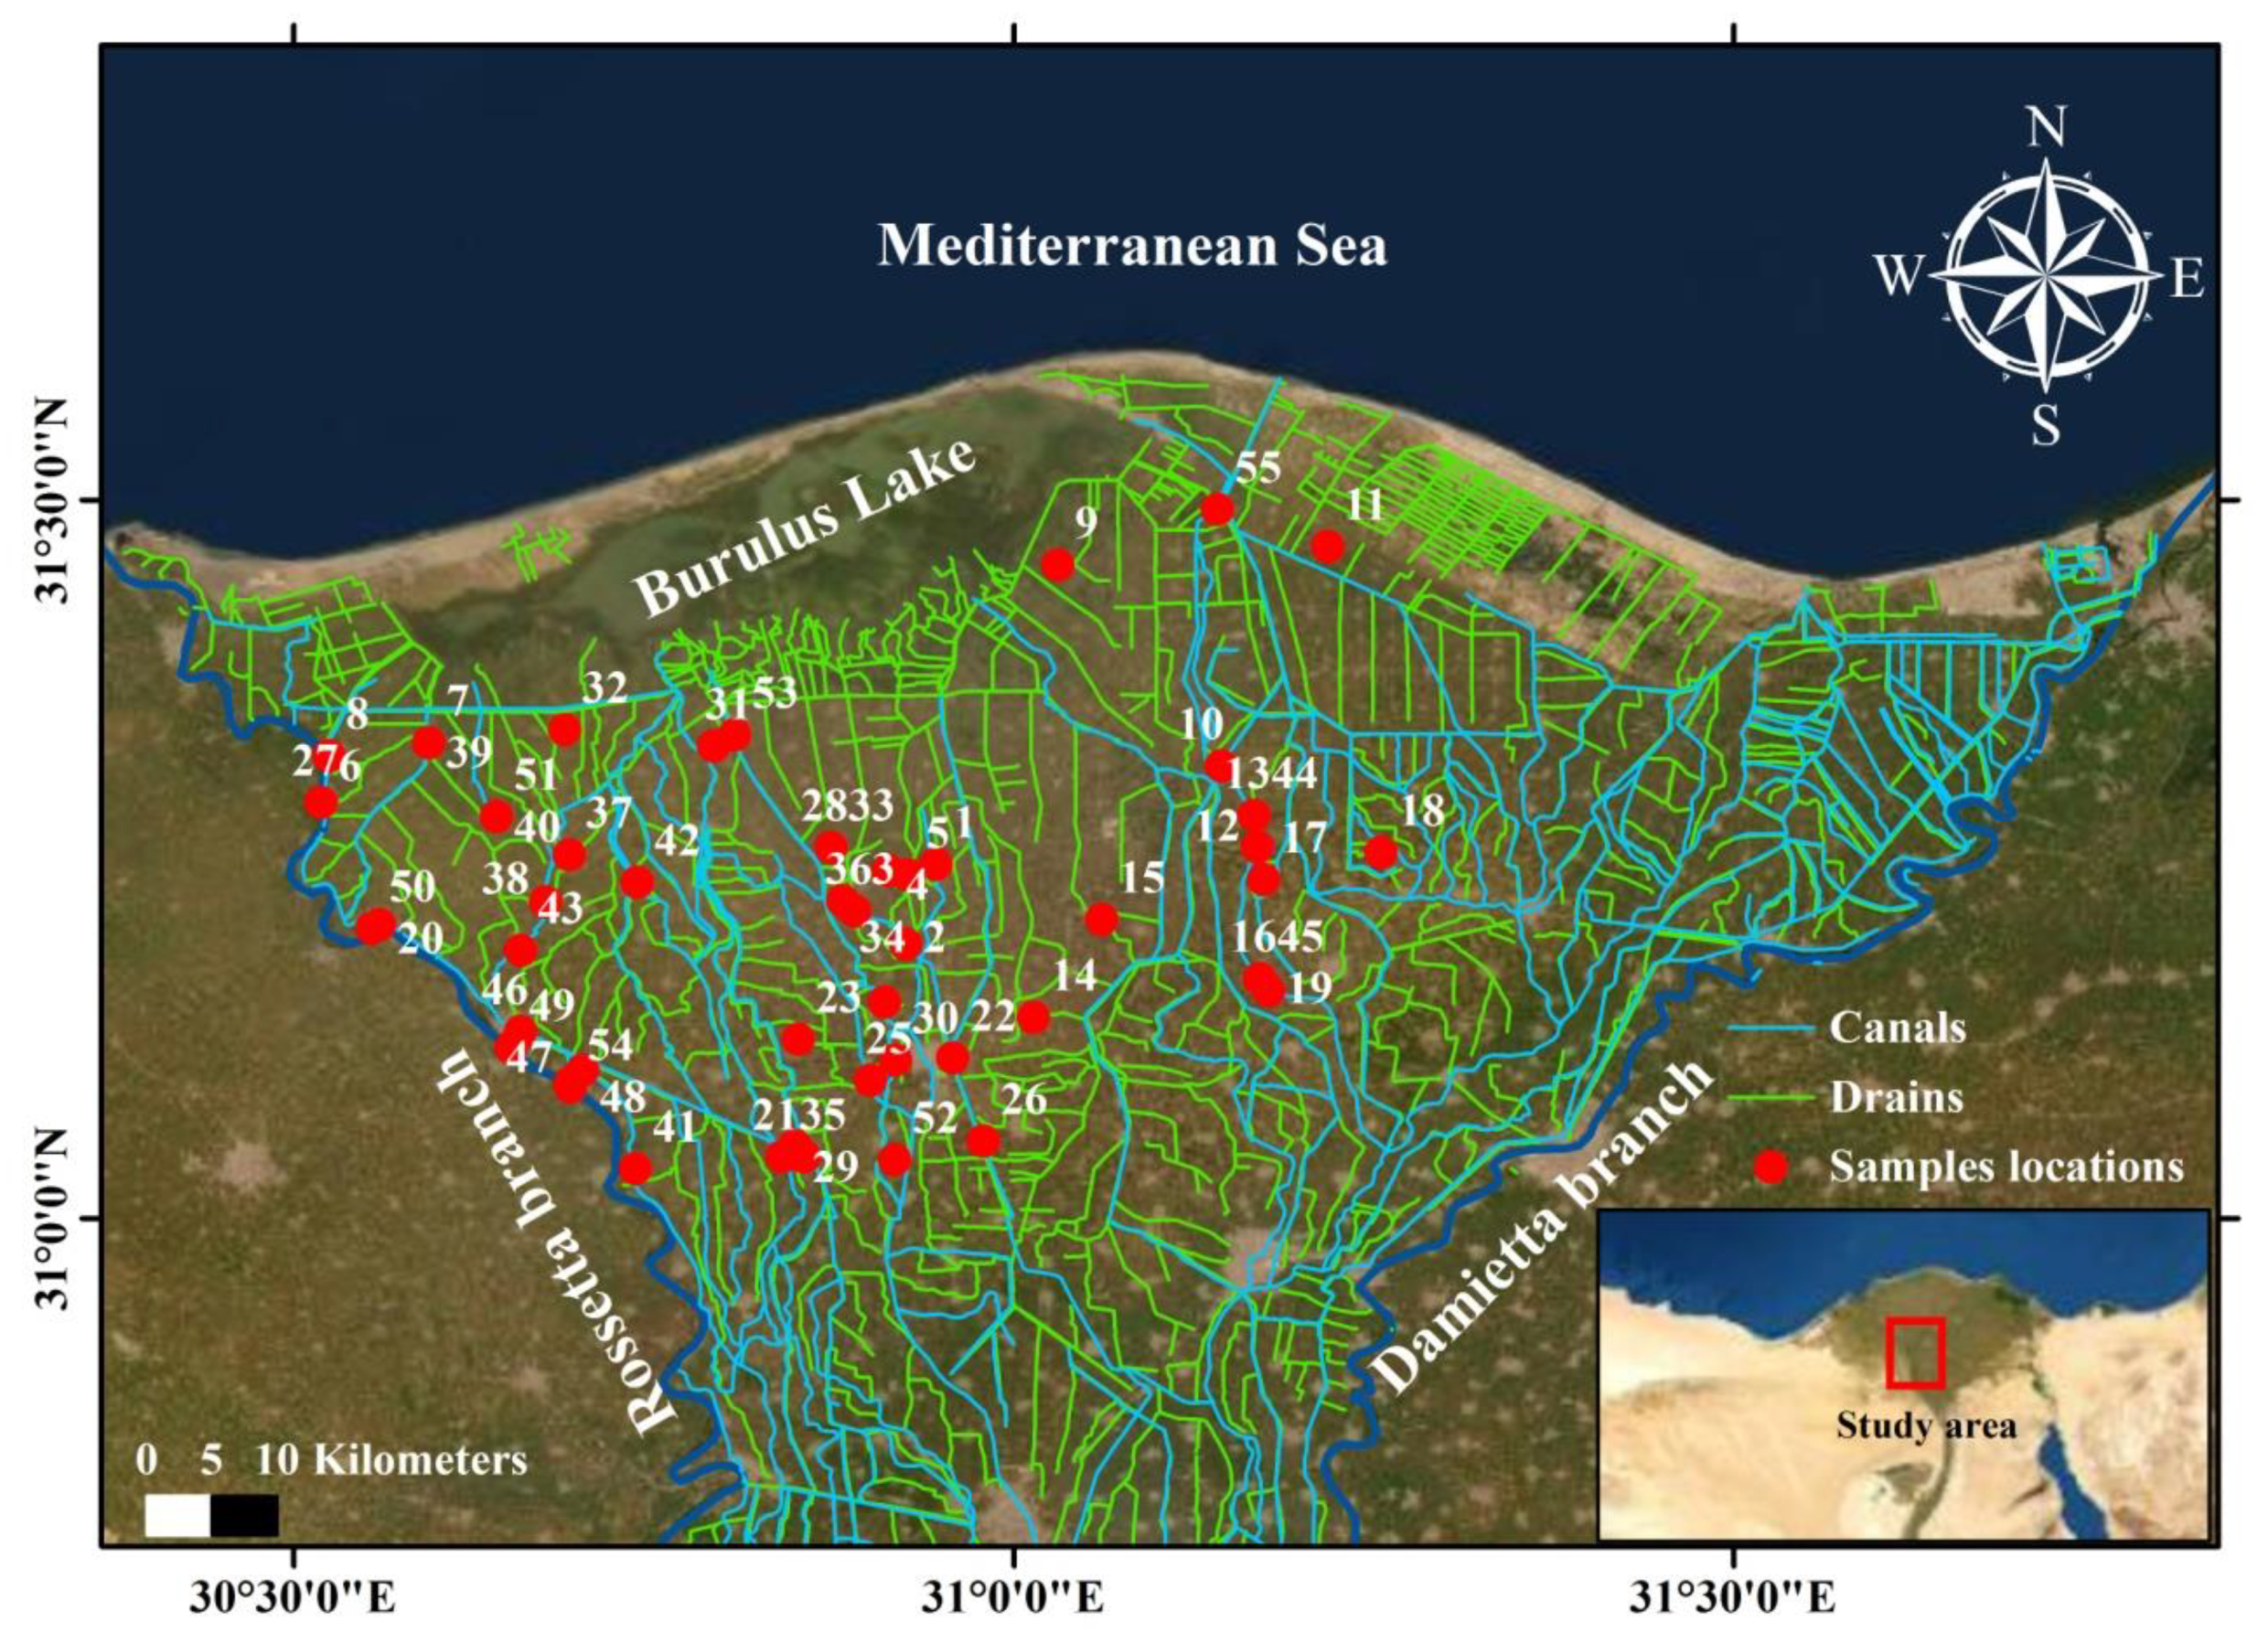
2.1. Sampling and Analyses
2.2. Water Quality Indices (WQIs)
2.2.1. Indexing Approach
2.3. Data Analysis
3. Results and Discussion
3.1. Physicochemical Parameters and Water Facies
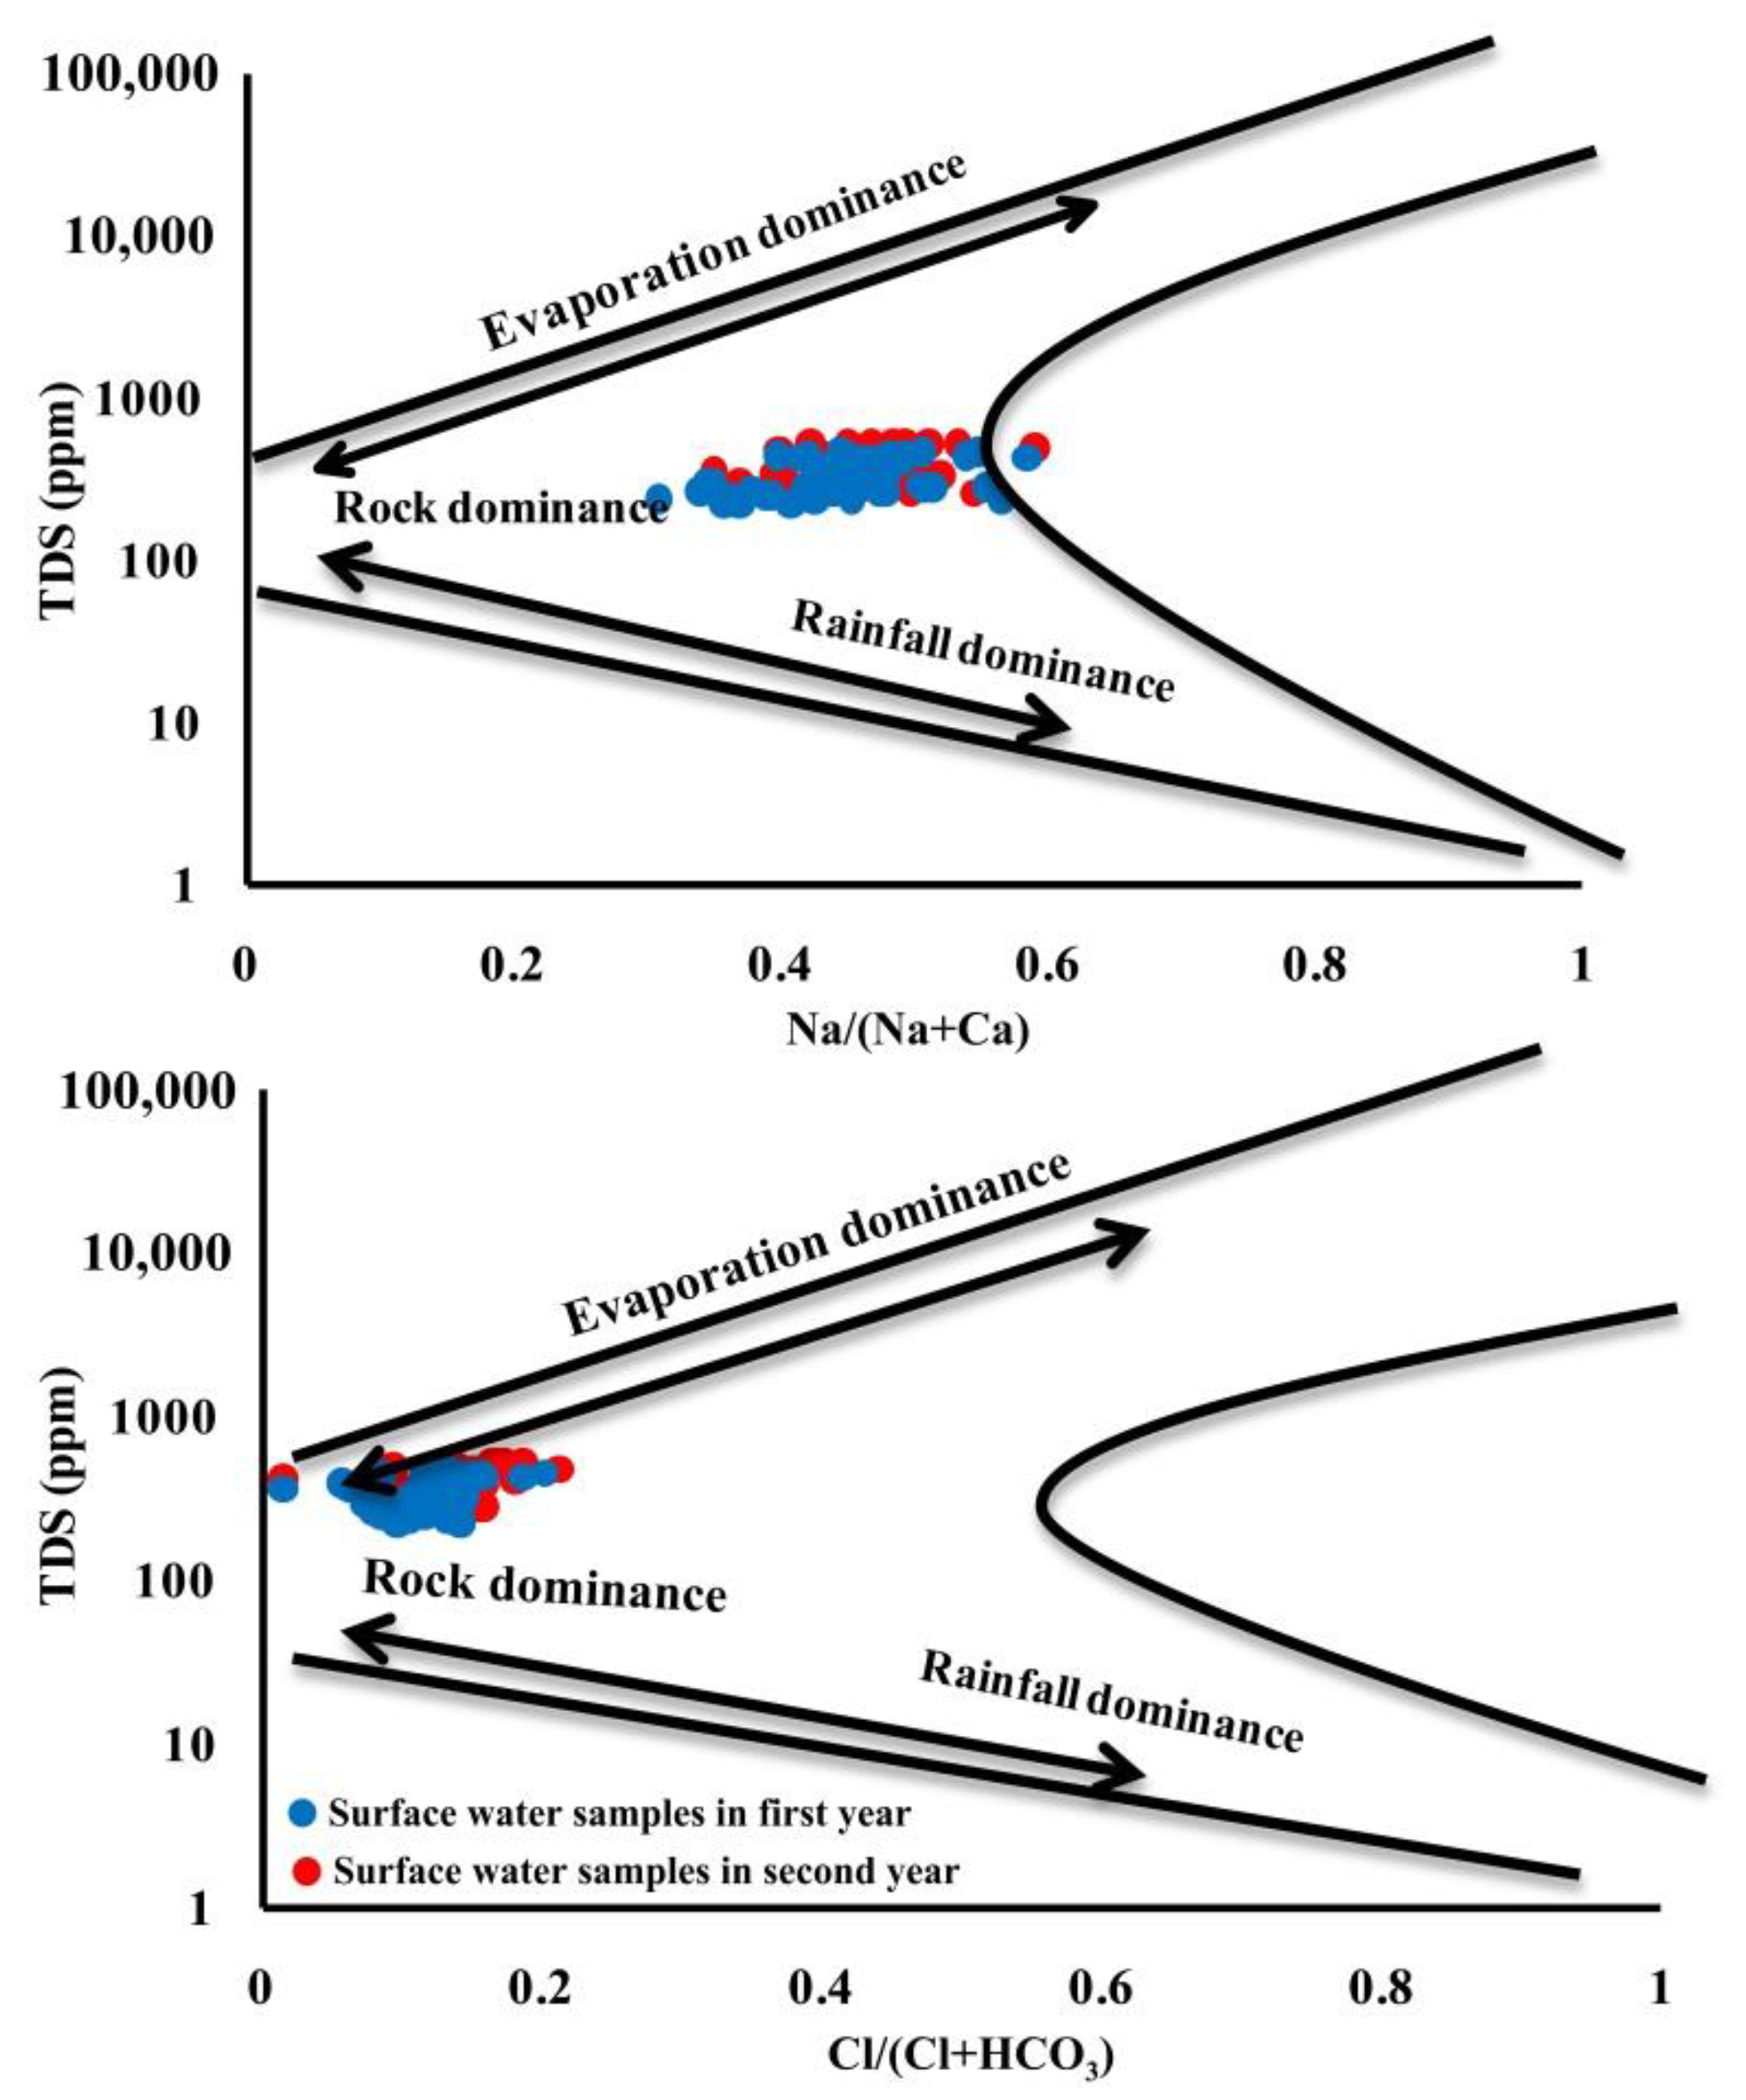
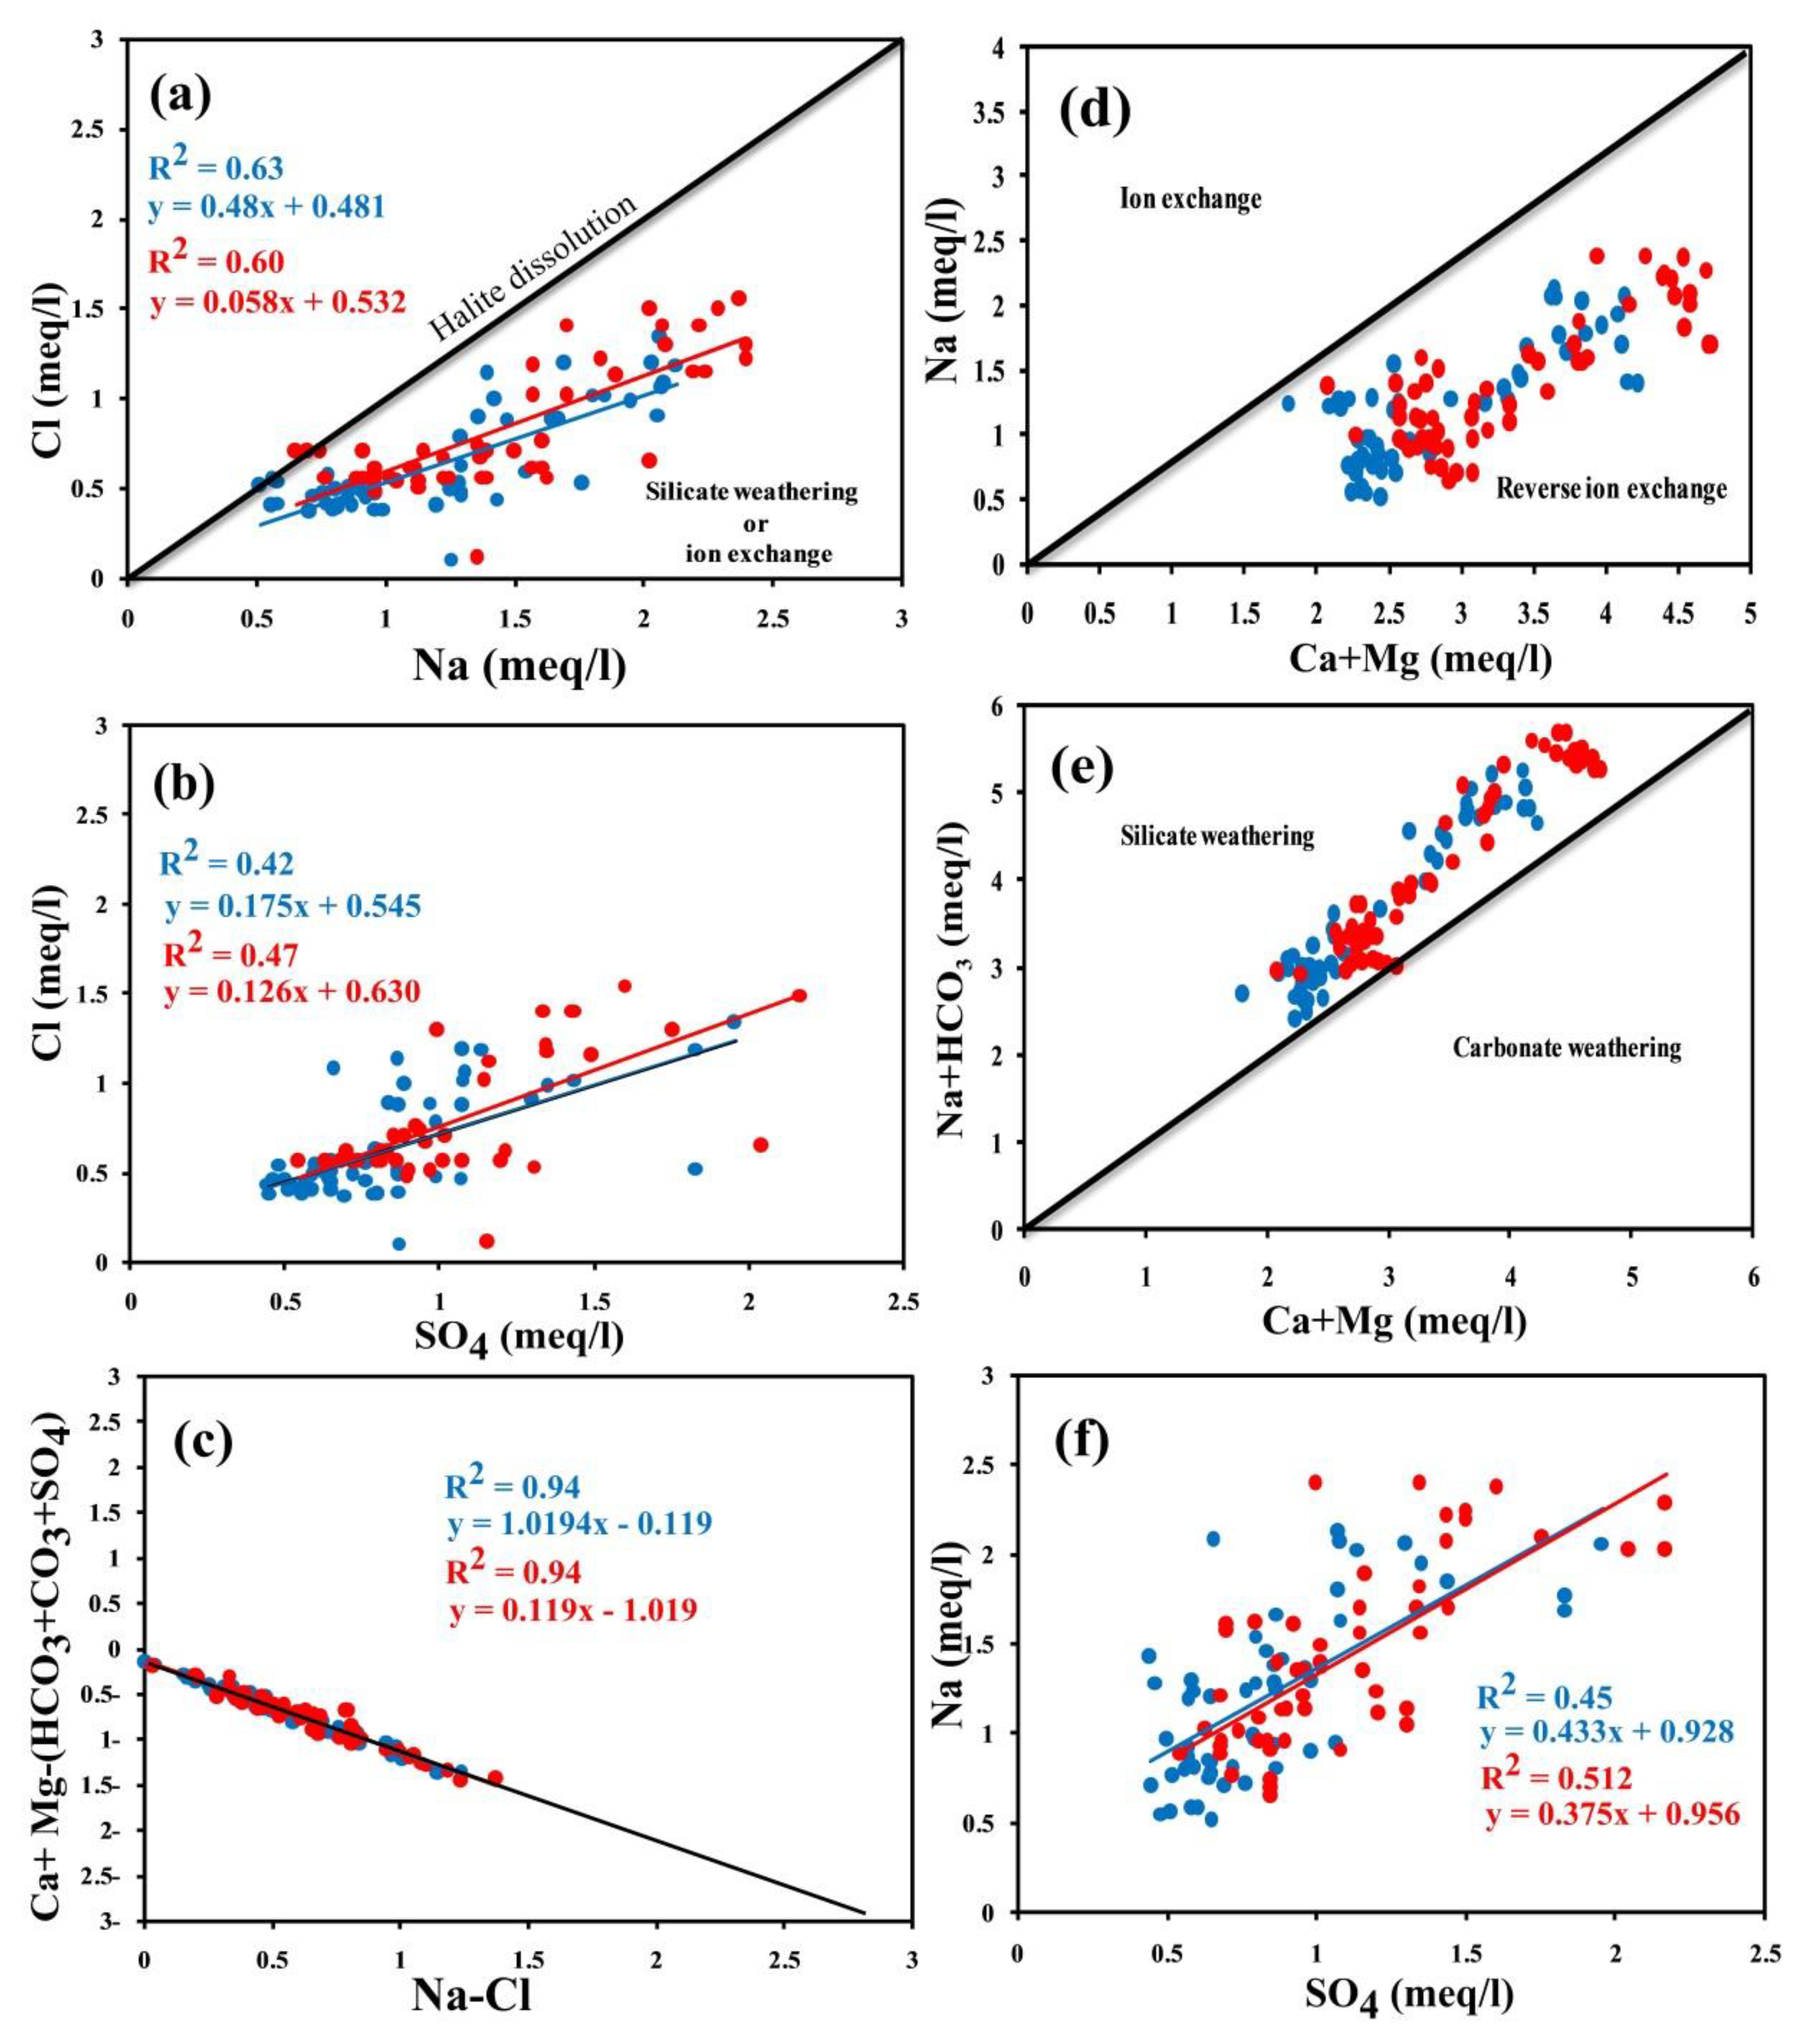
3.2. Geochemical Controlling Mechanisms
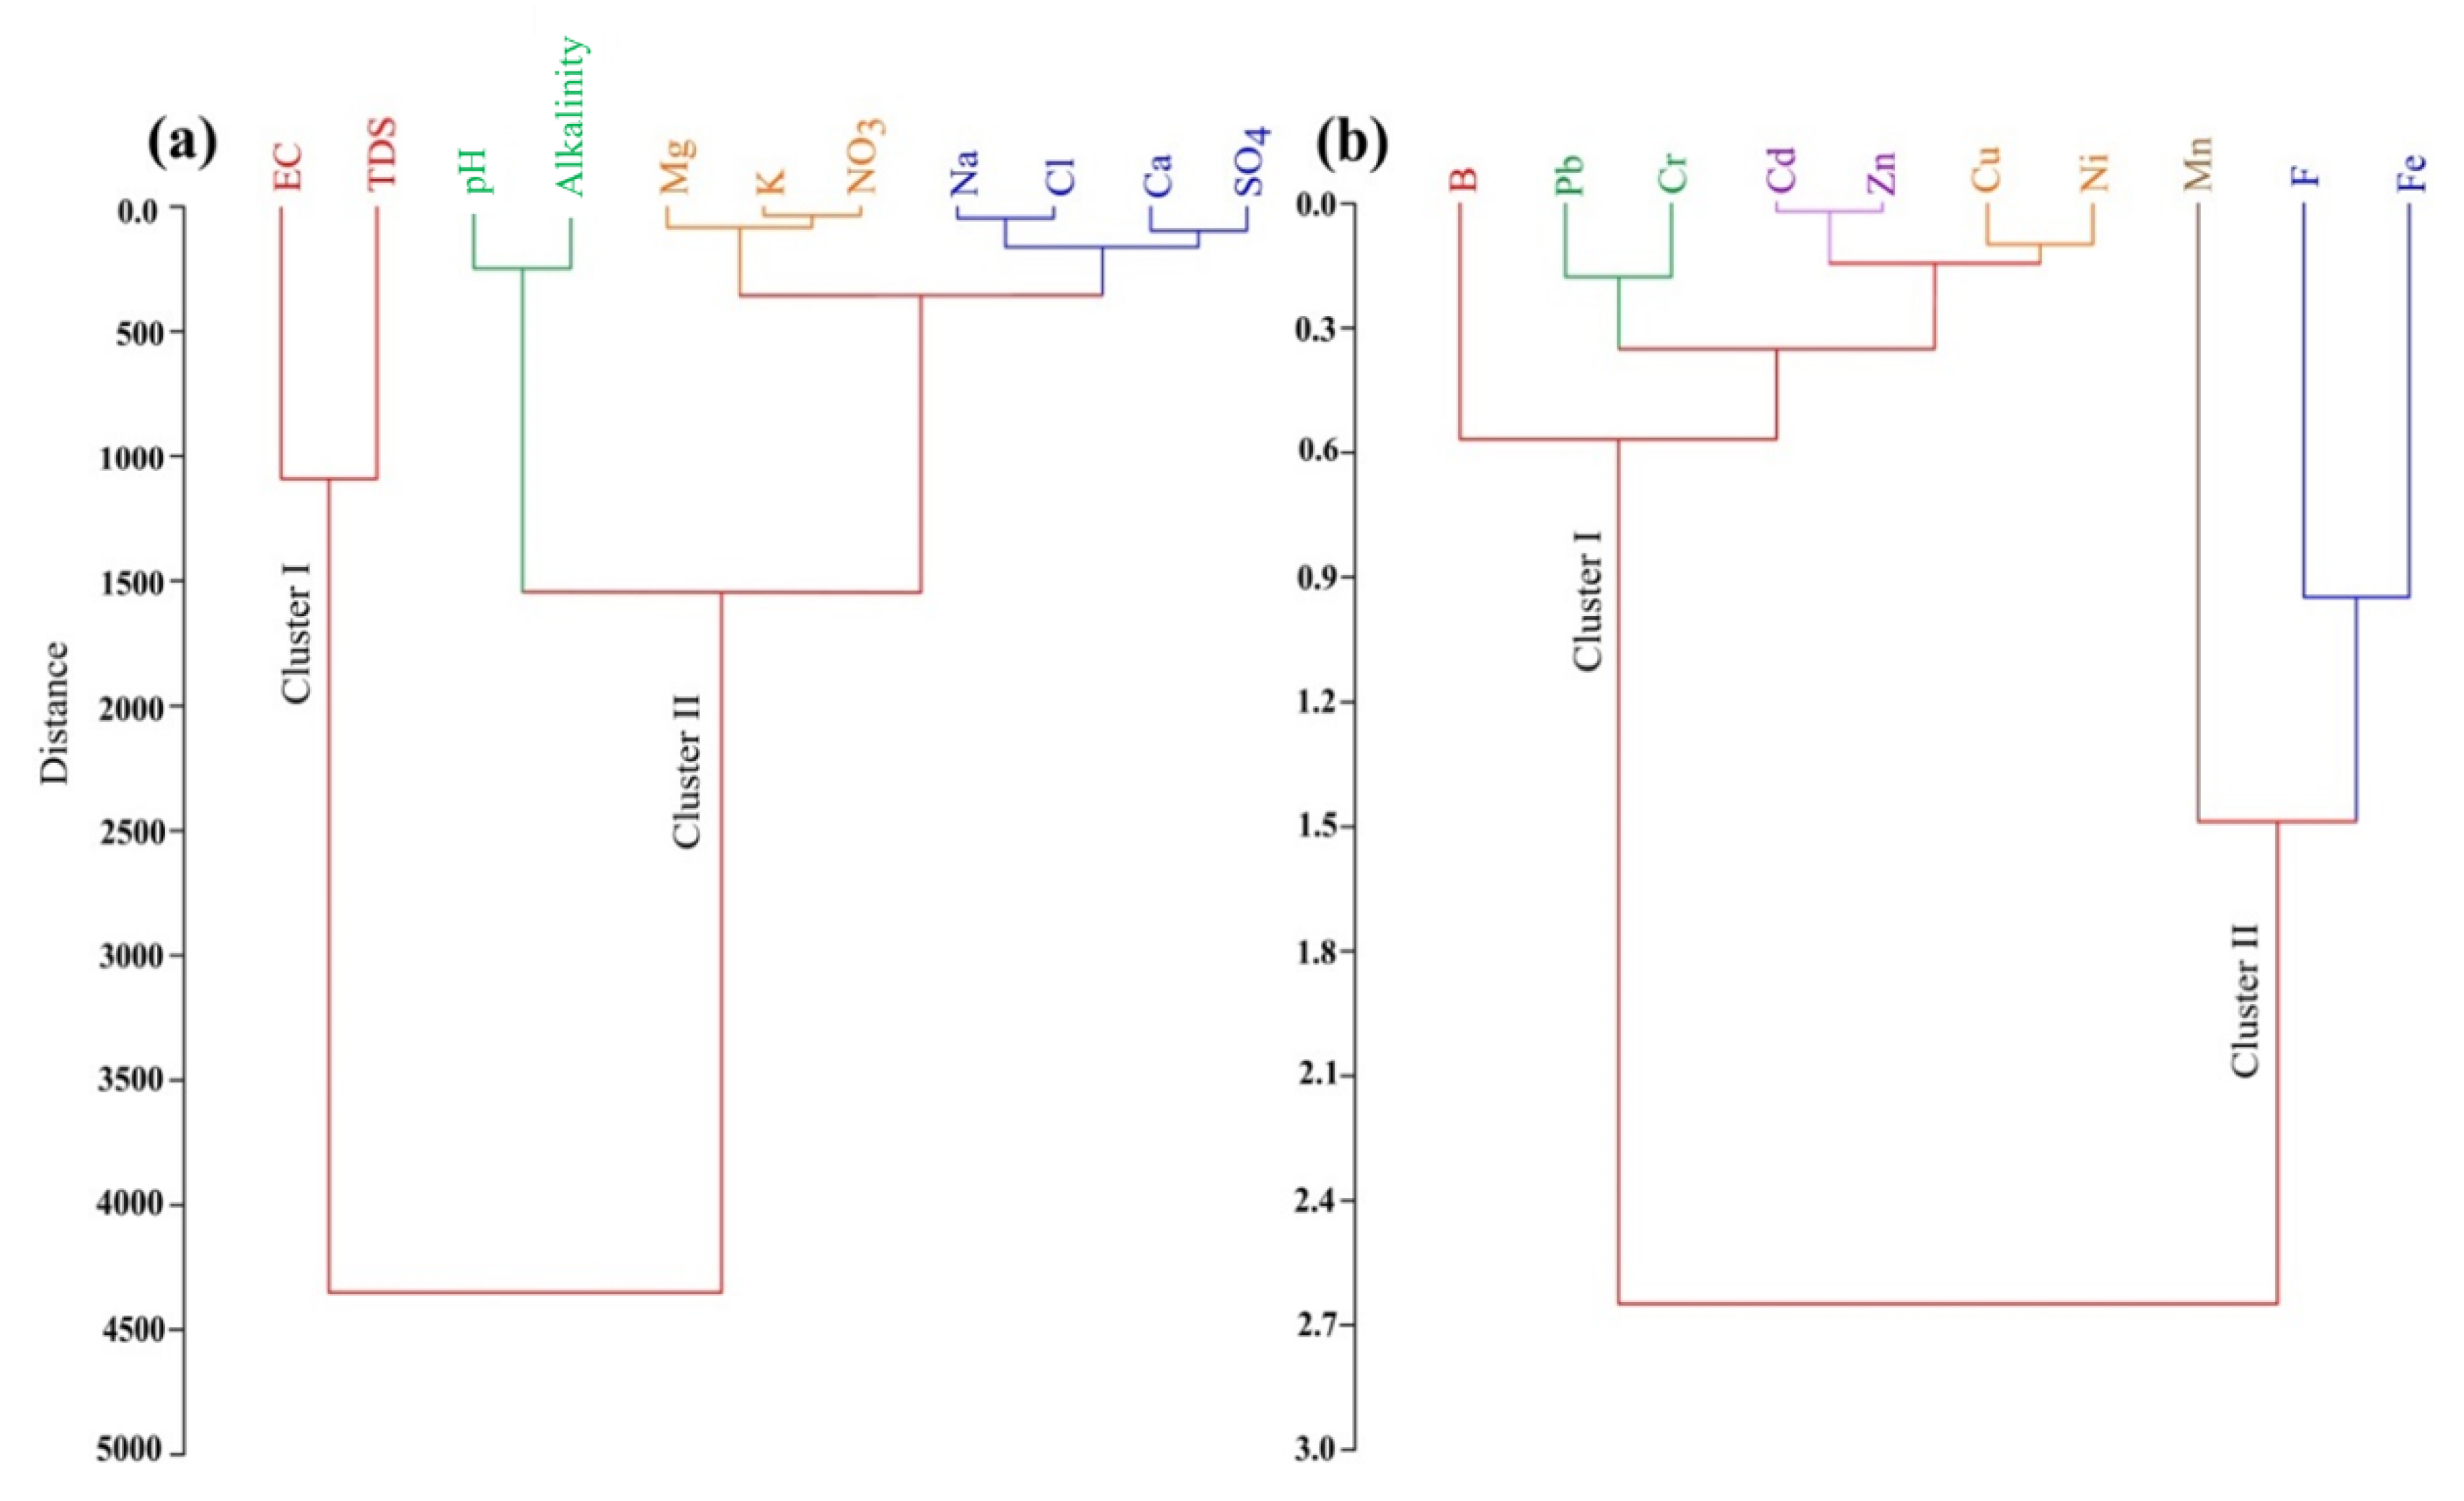
3.3. Cluster Analysis
3.4. Water Quality Assessment for Irrigation
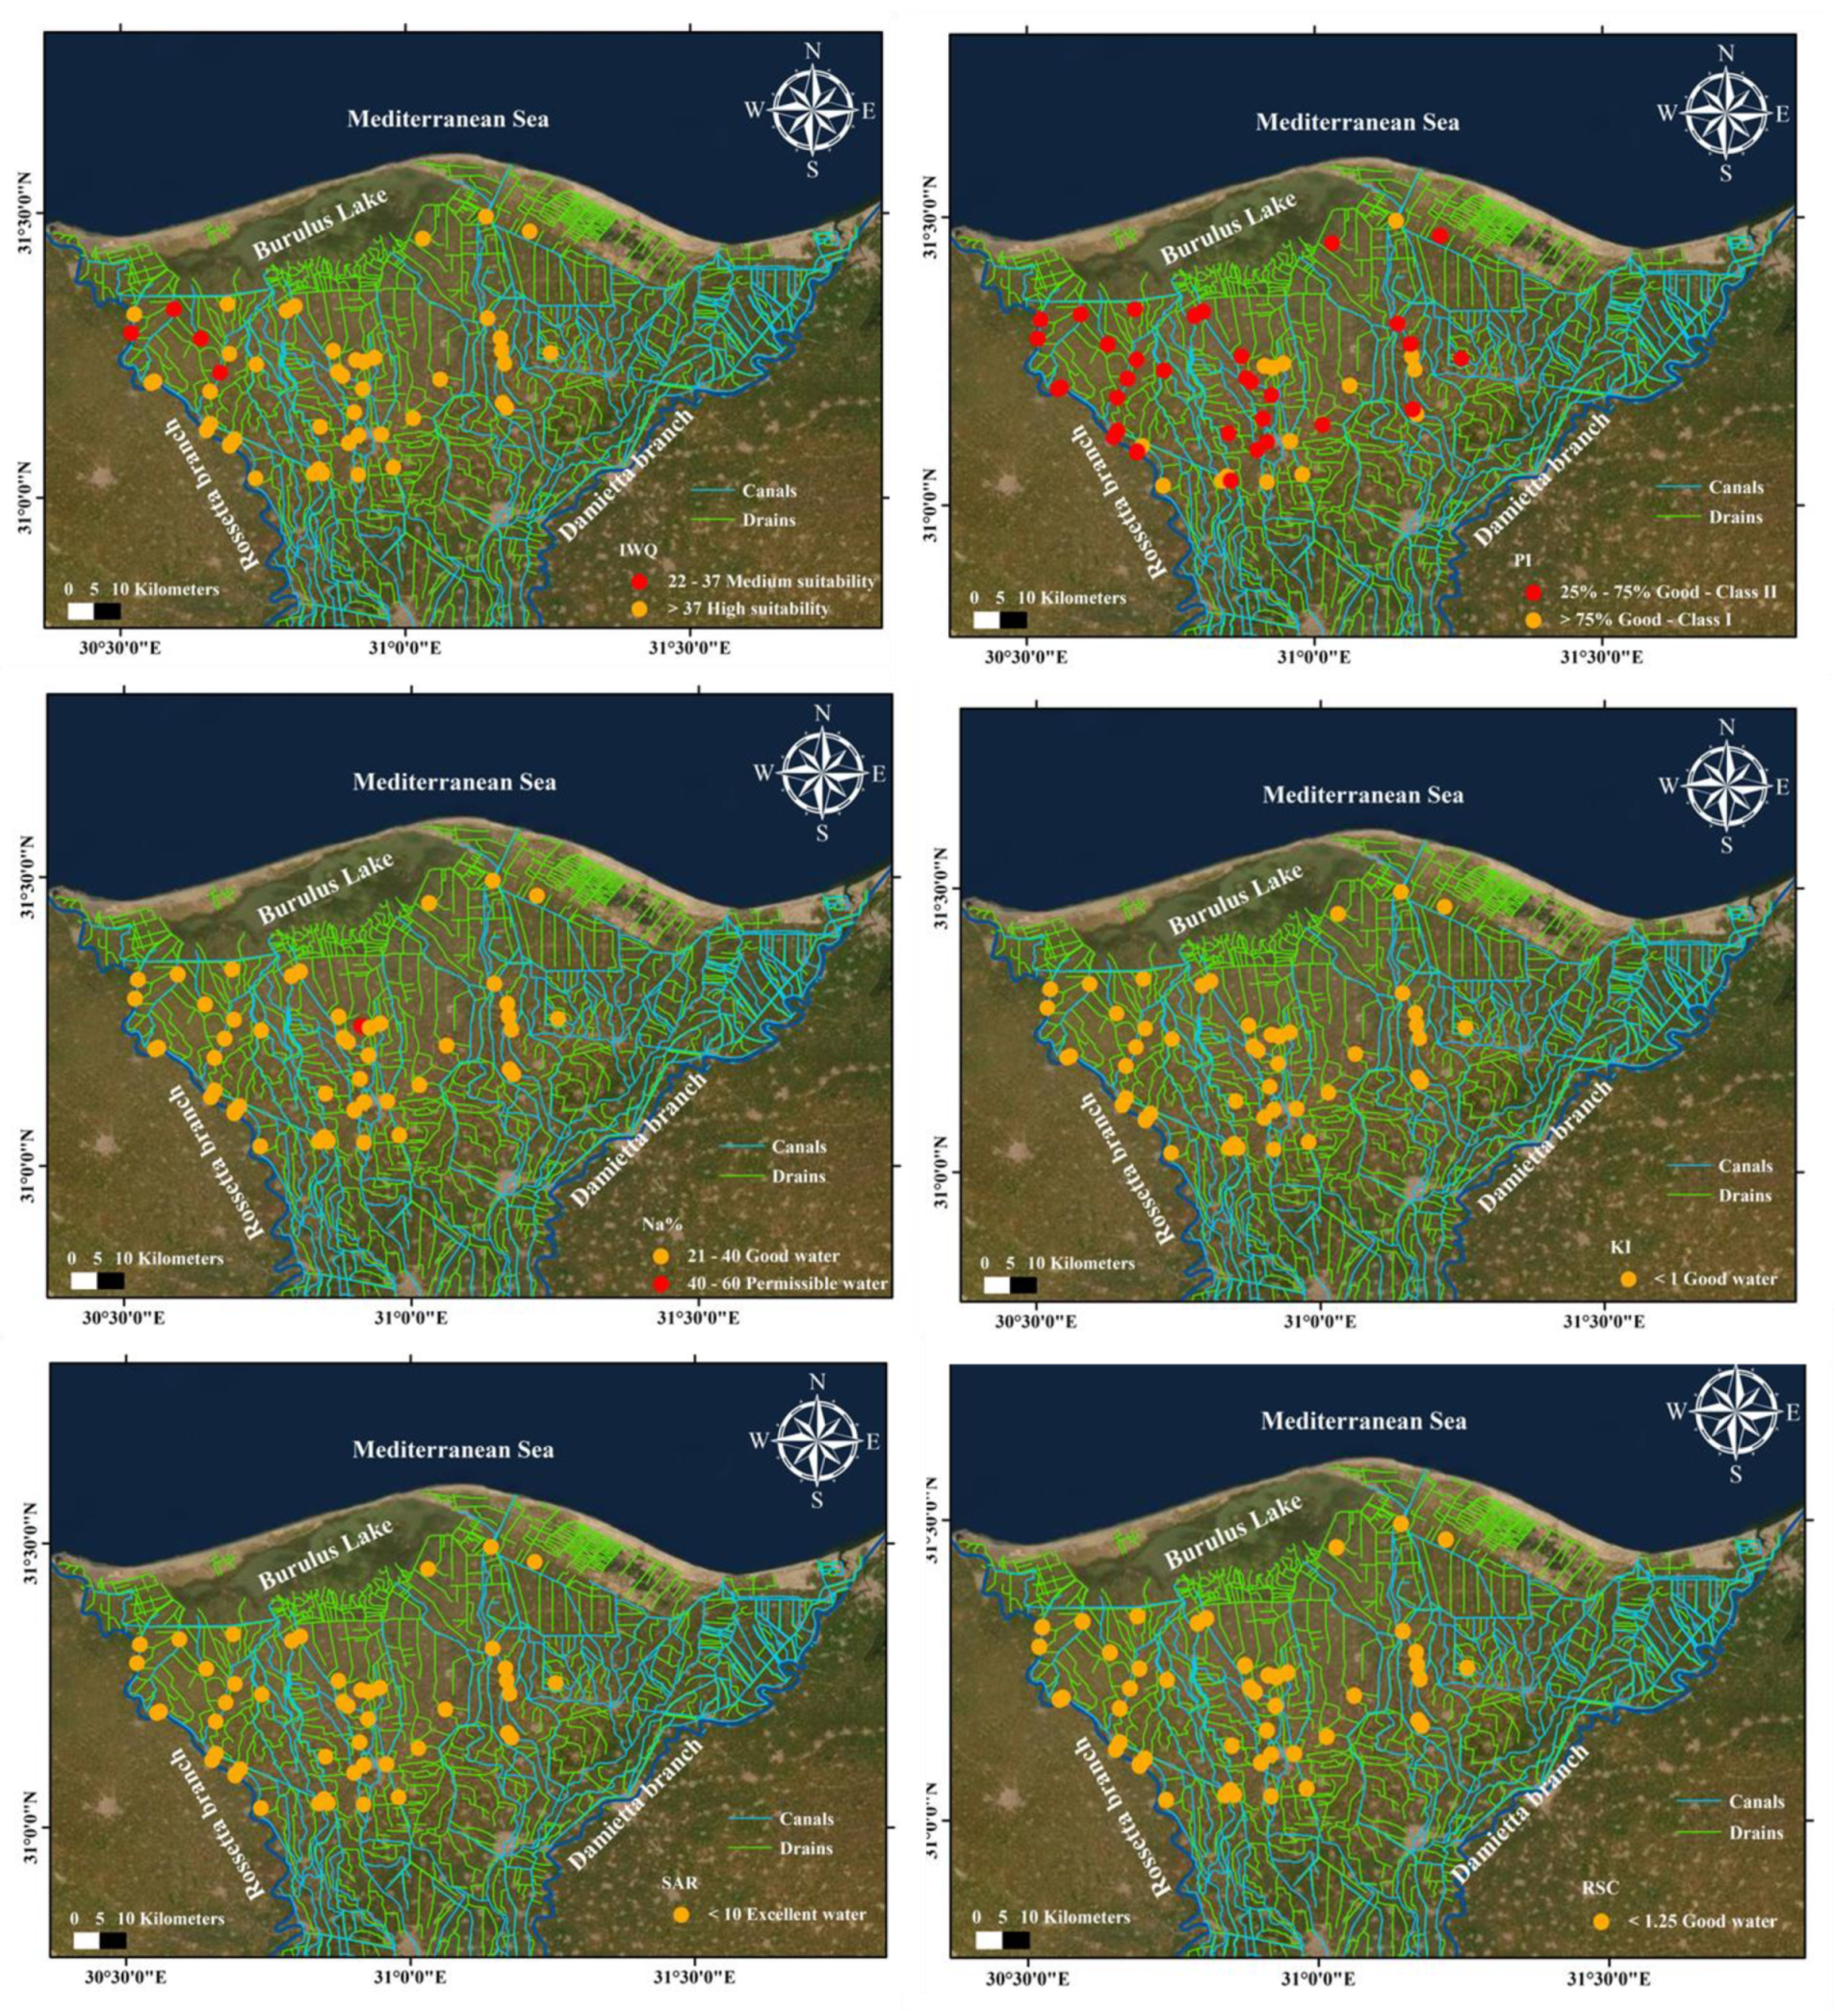
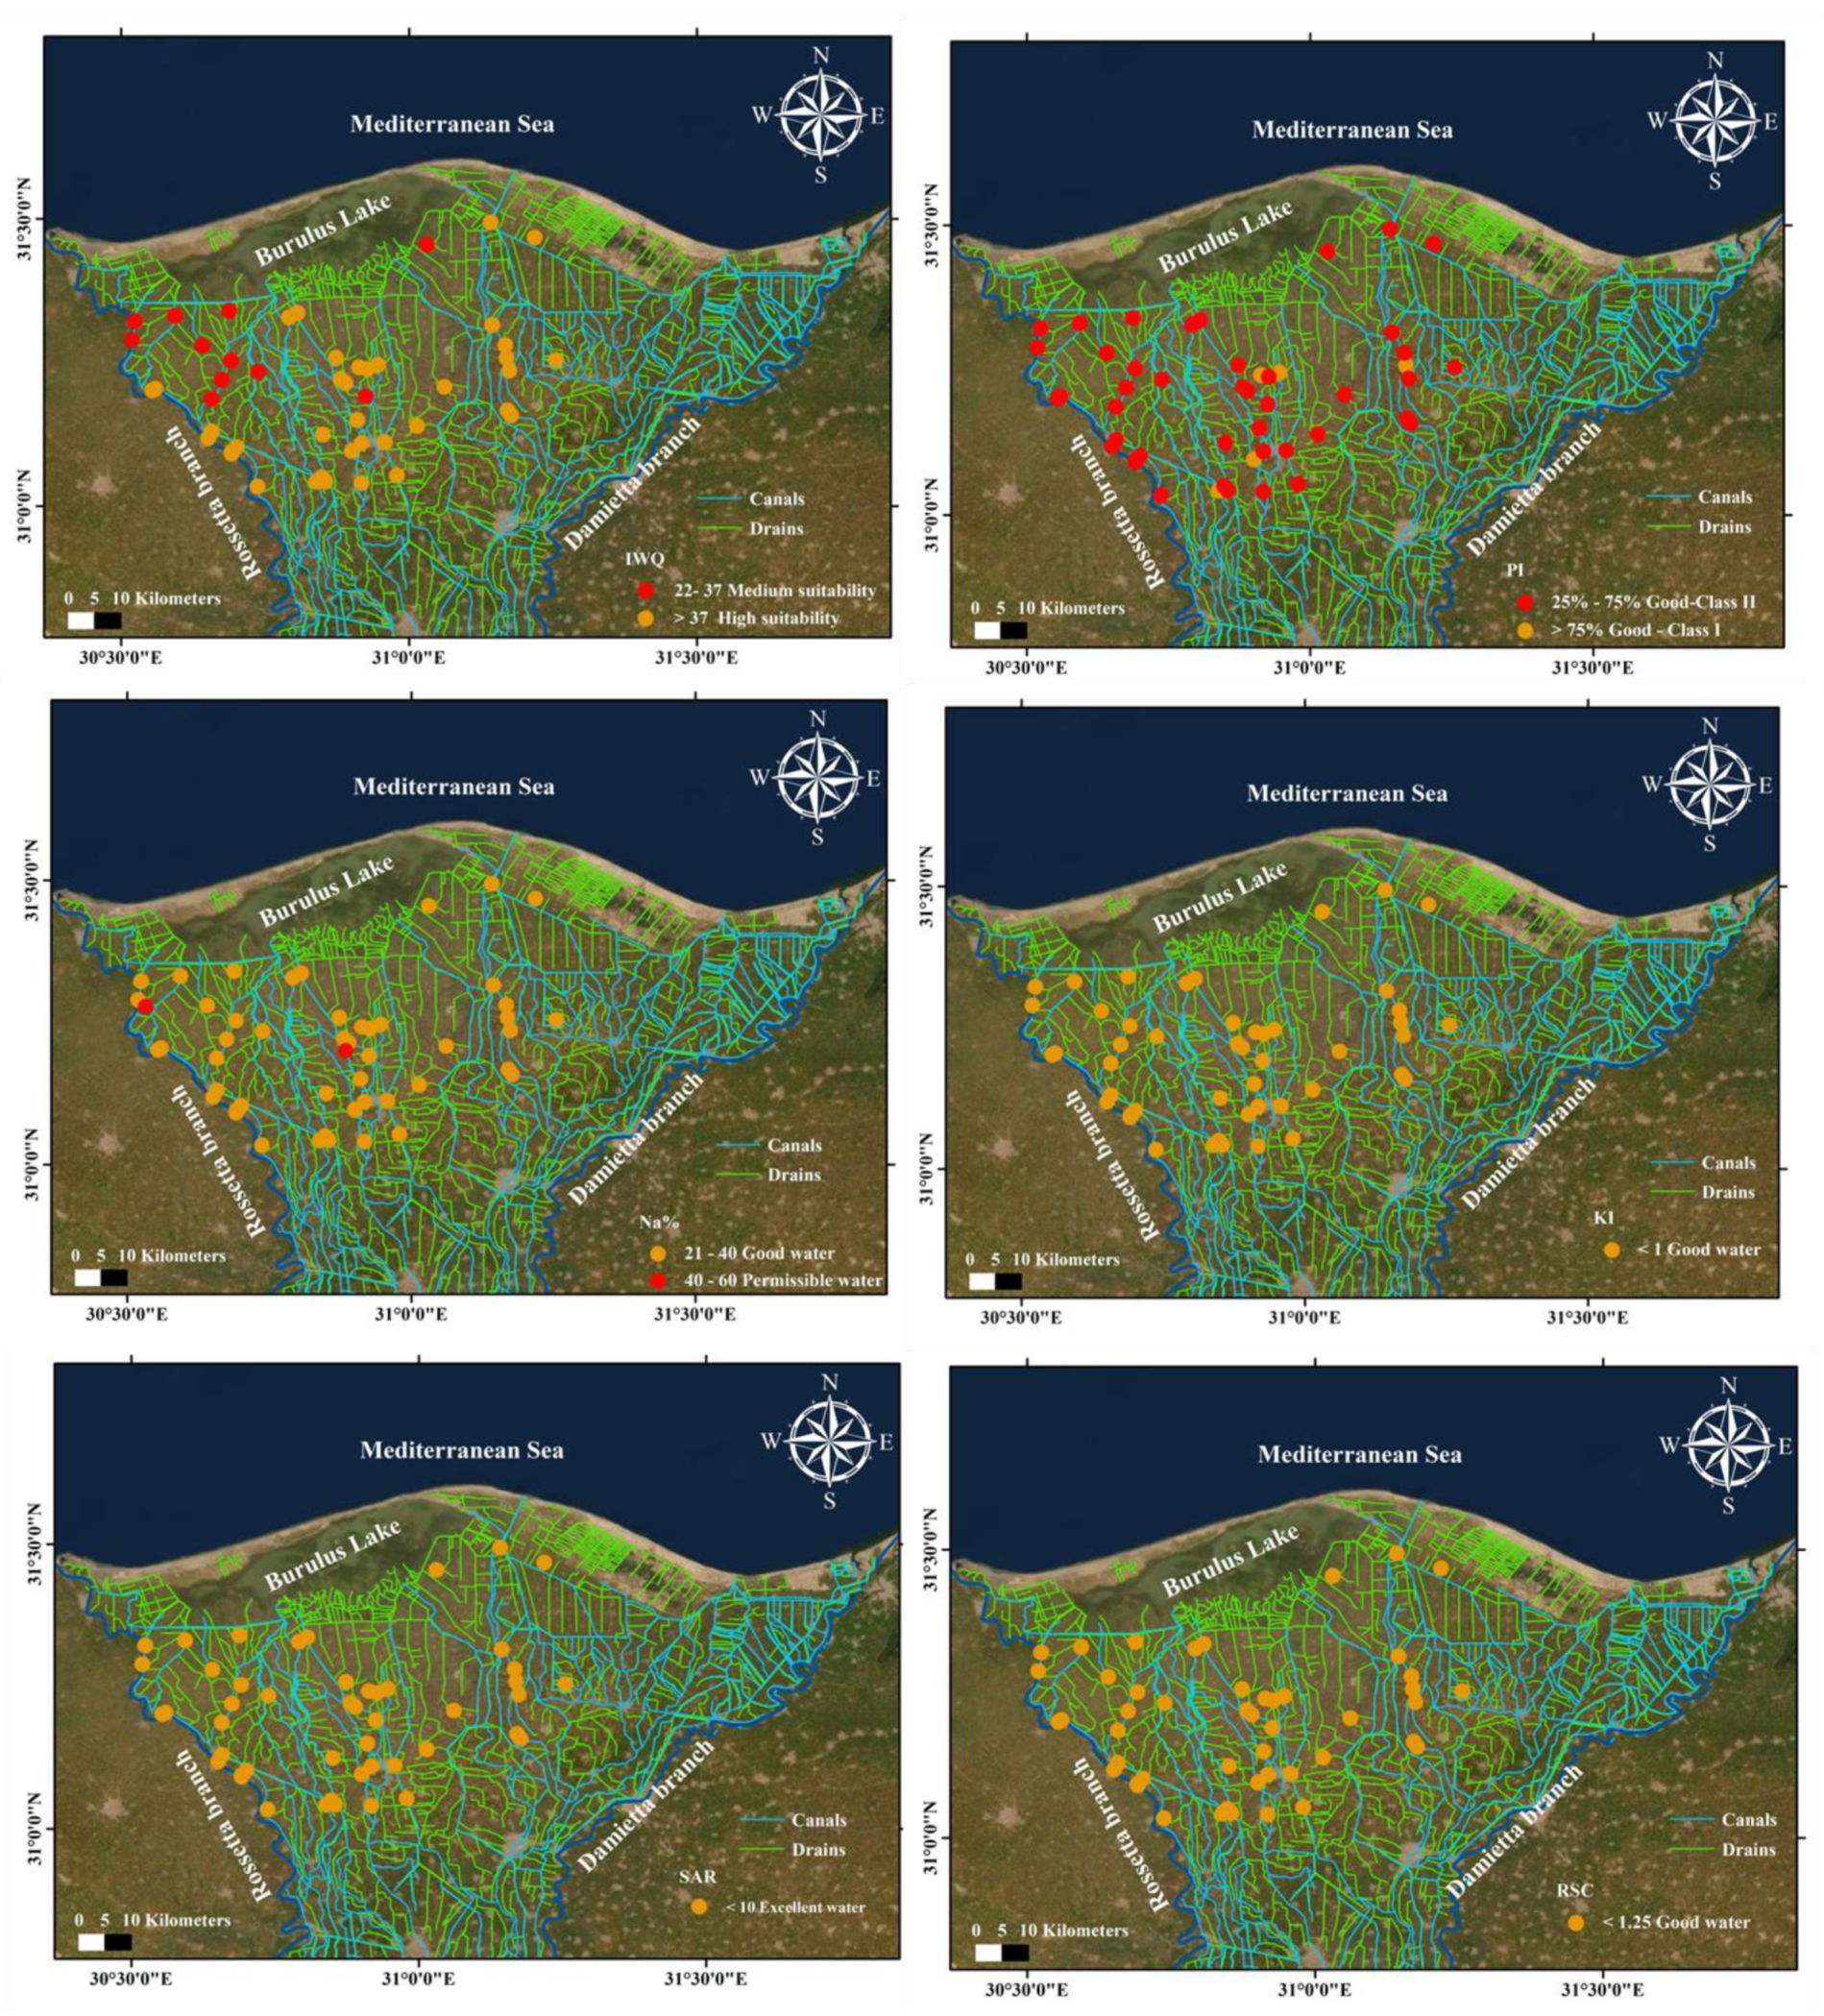
3.4.1. Irrigation Water Quality (IWQ)
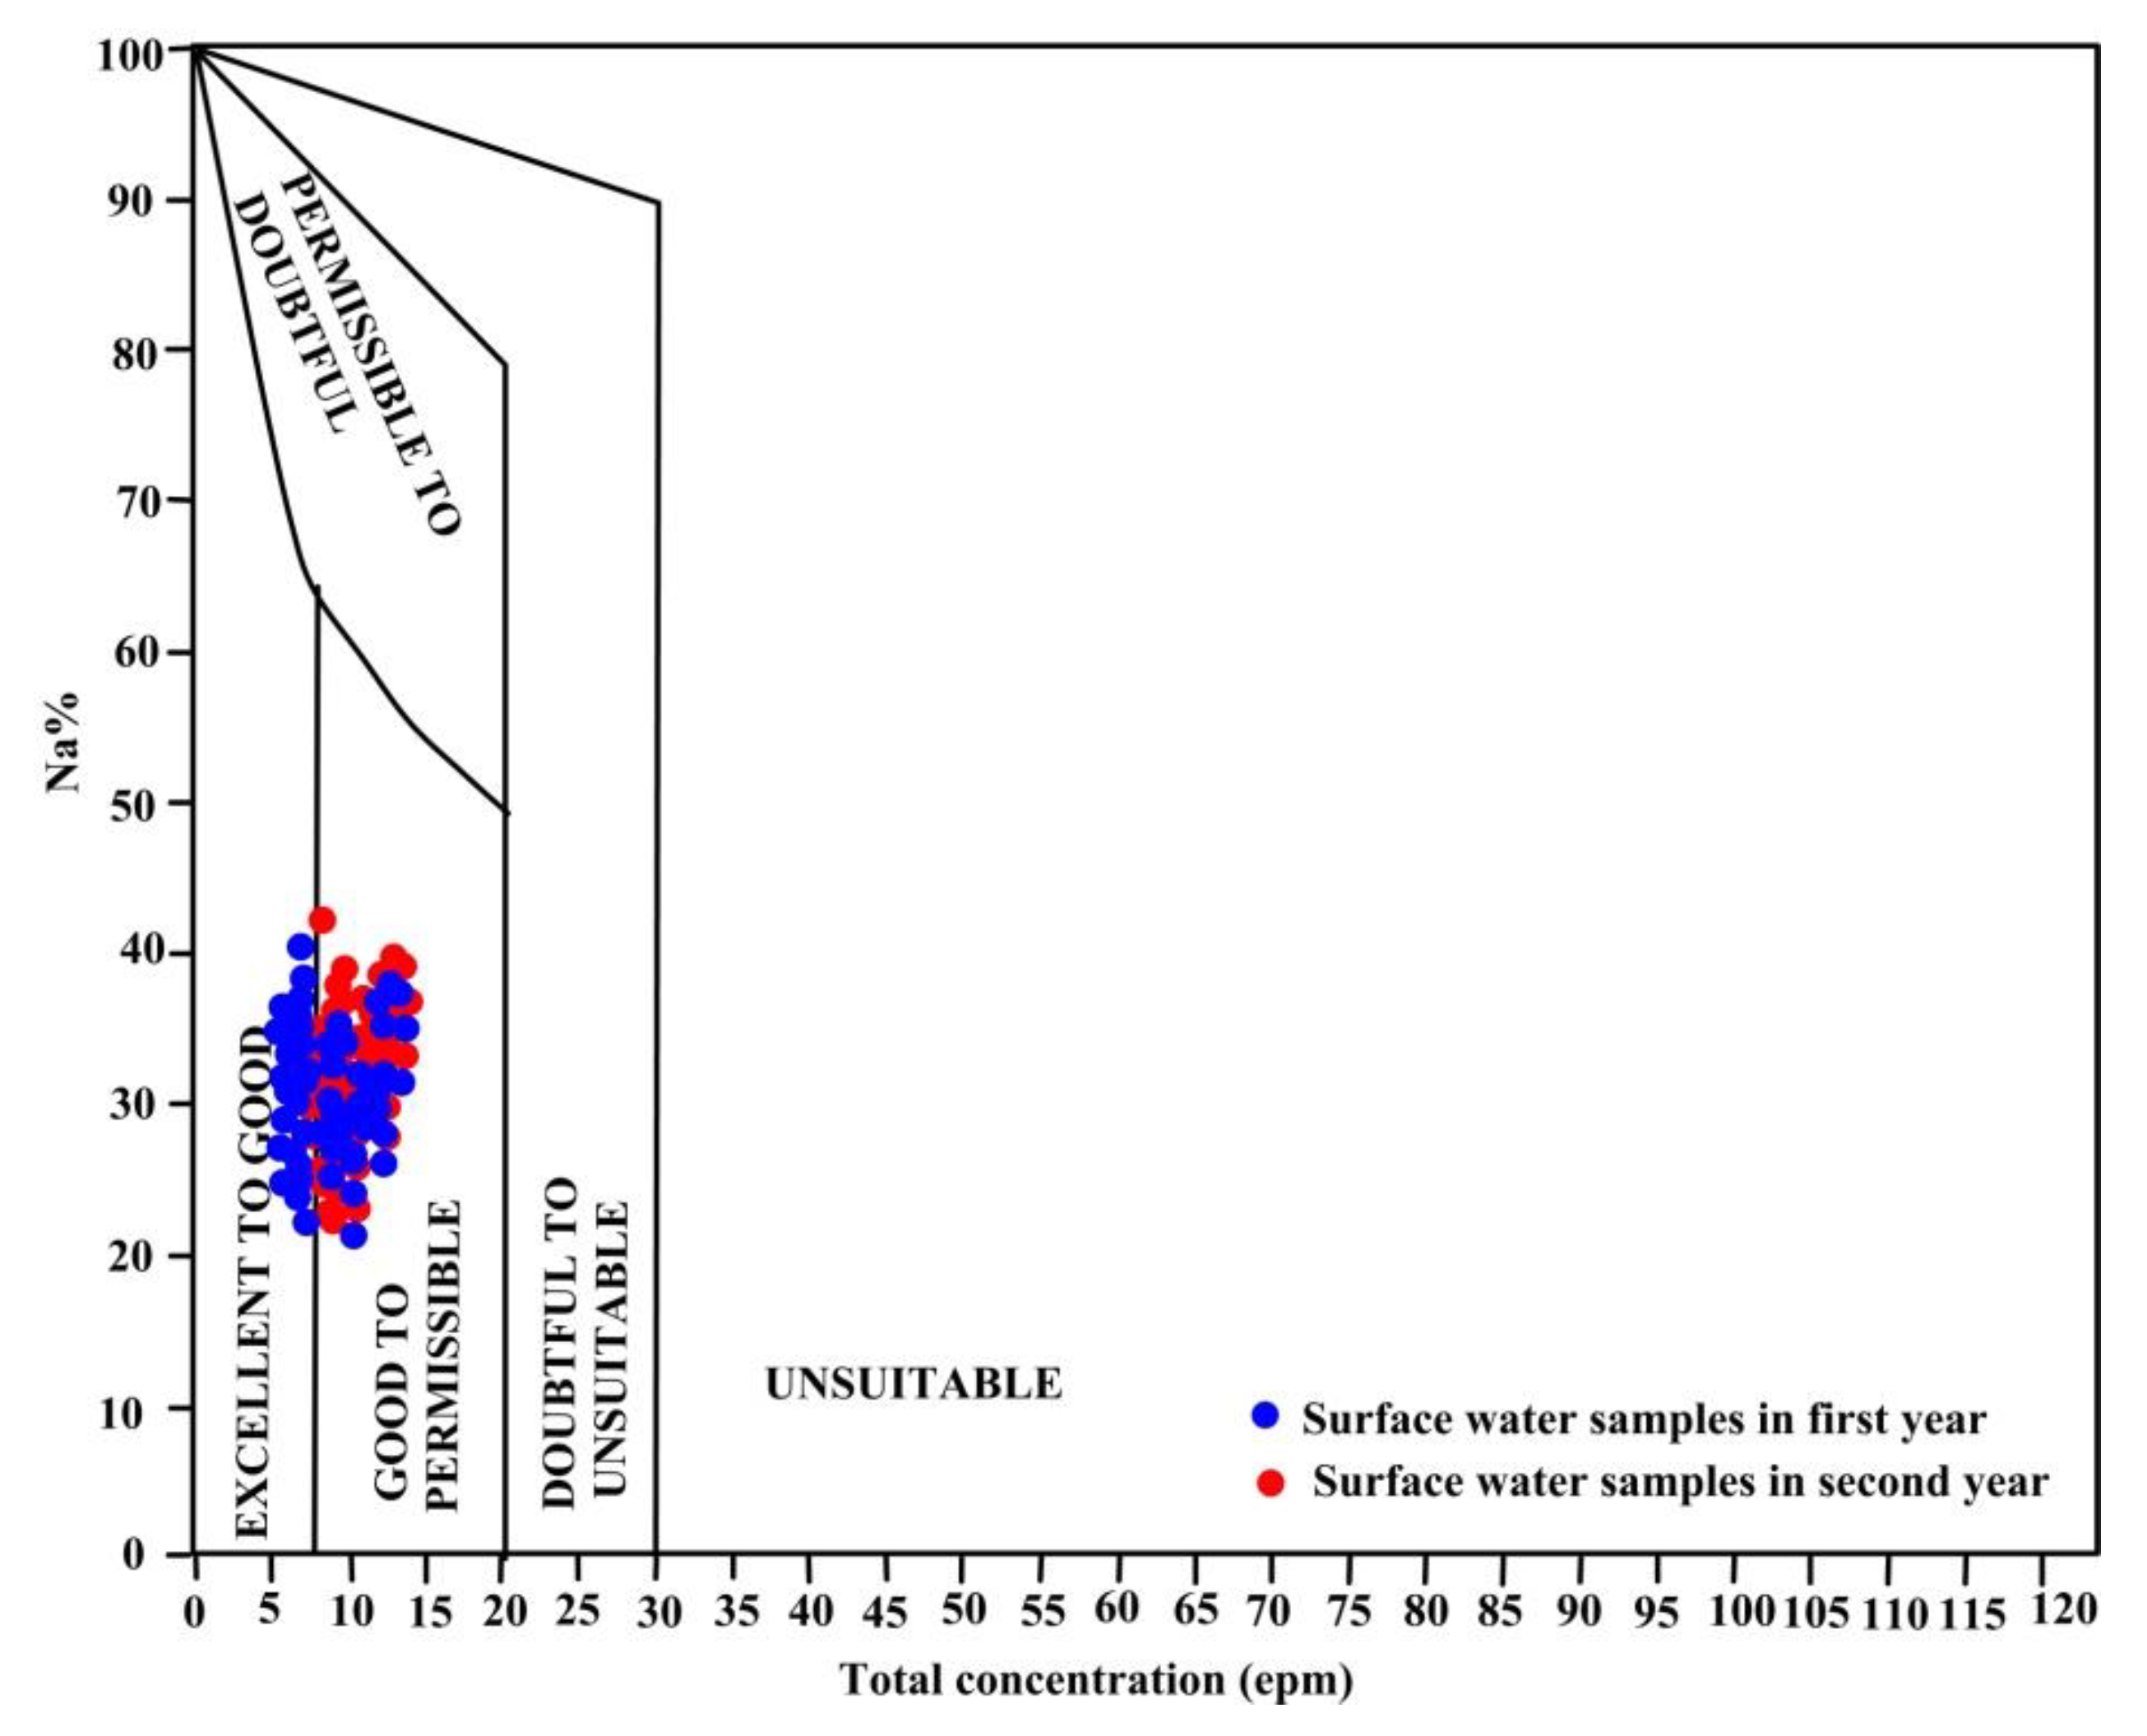
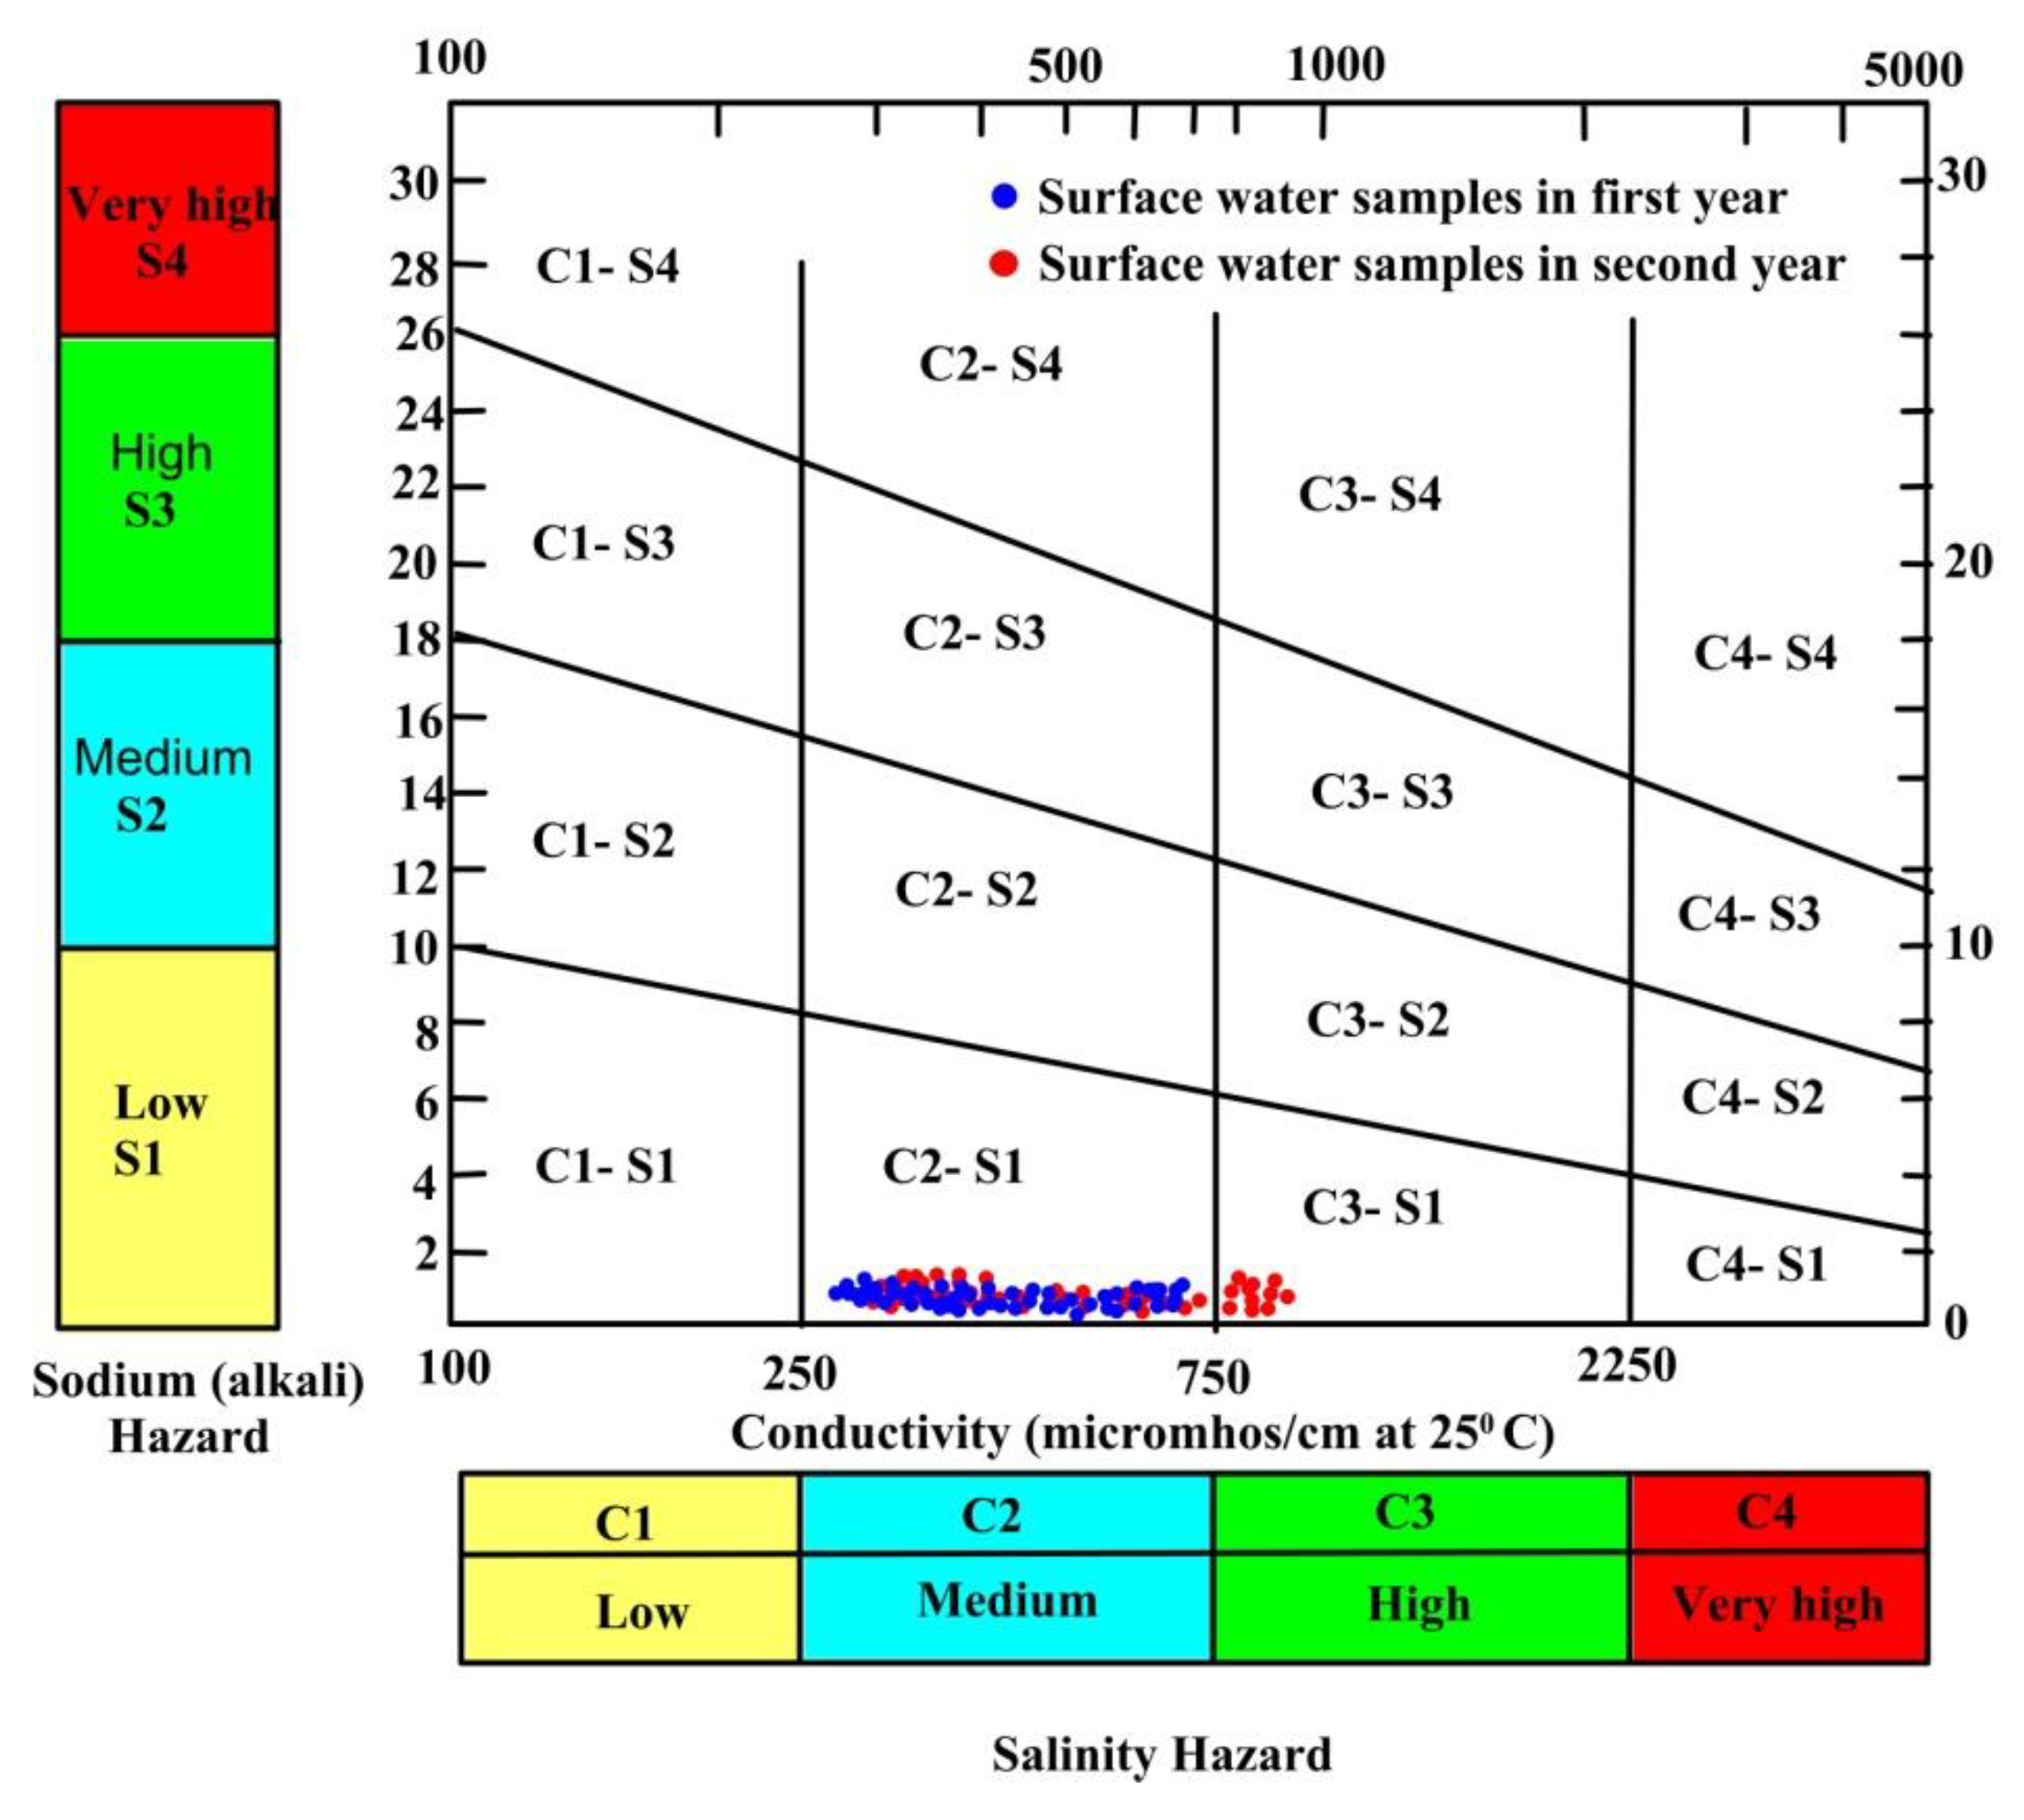
3.4.2. Sodium Percentage
3.4.3. Sodium Absorption Ratio
3.4.4. Permeability Index
3.4.5. Kelley Index
3.4.6. Residual Sodium Carbonate
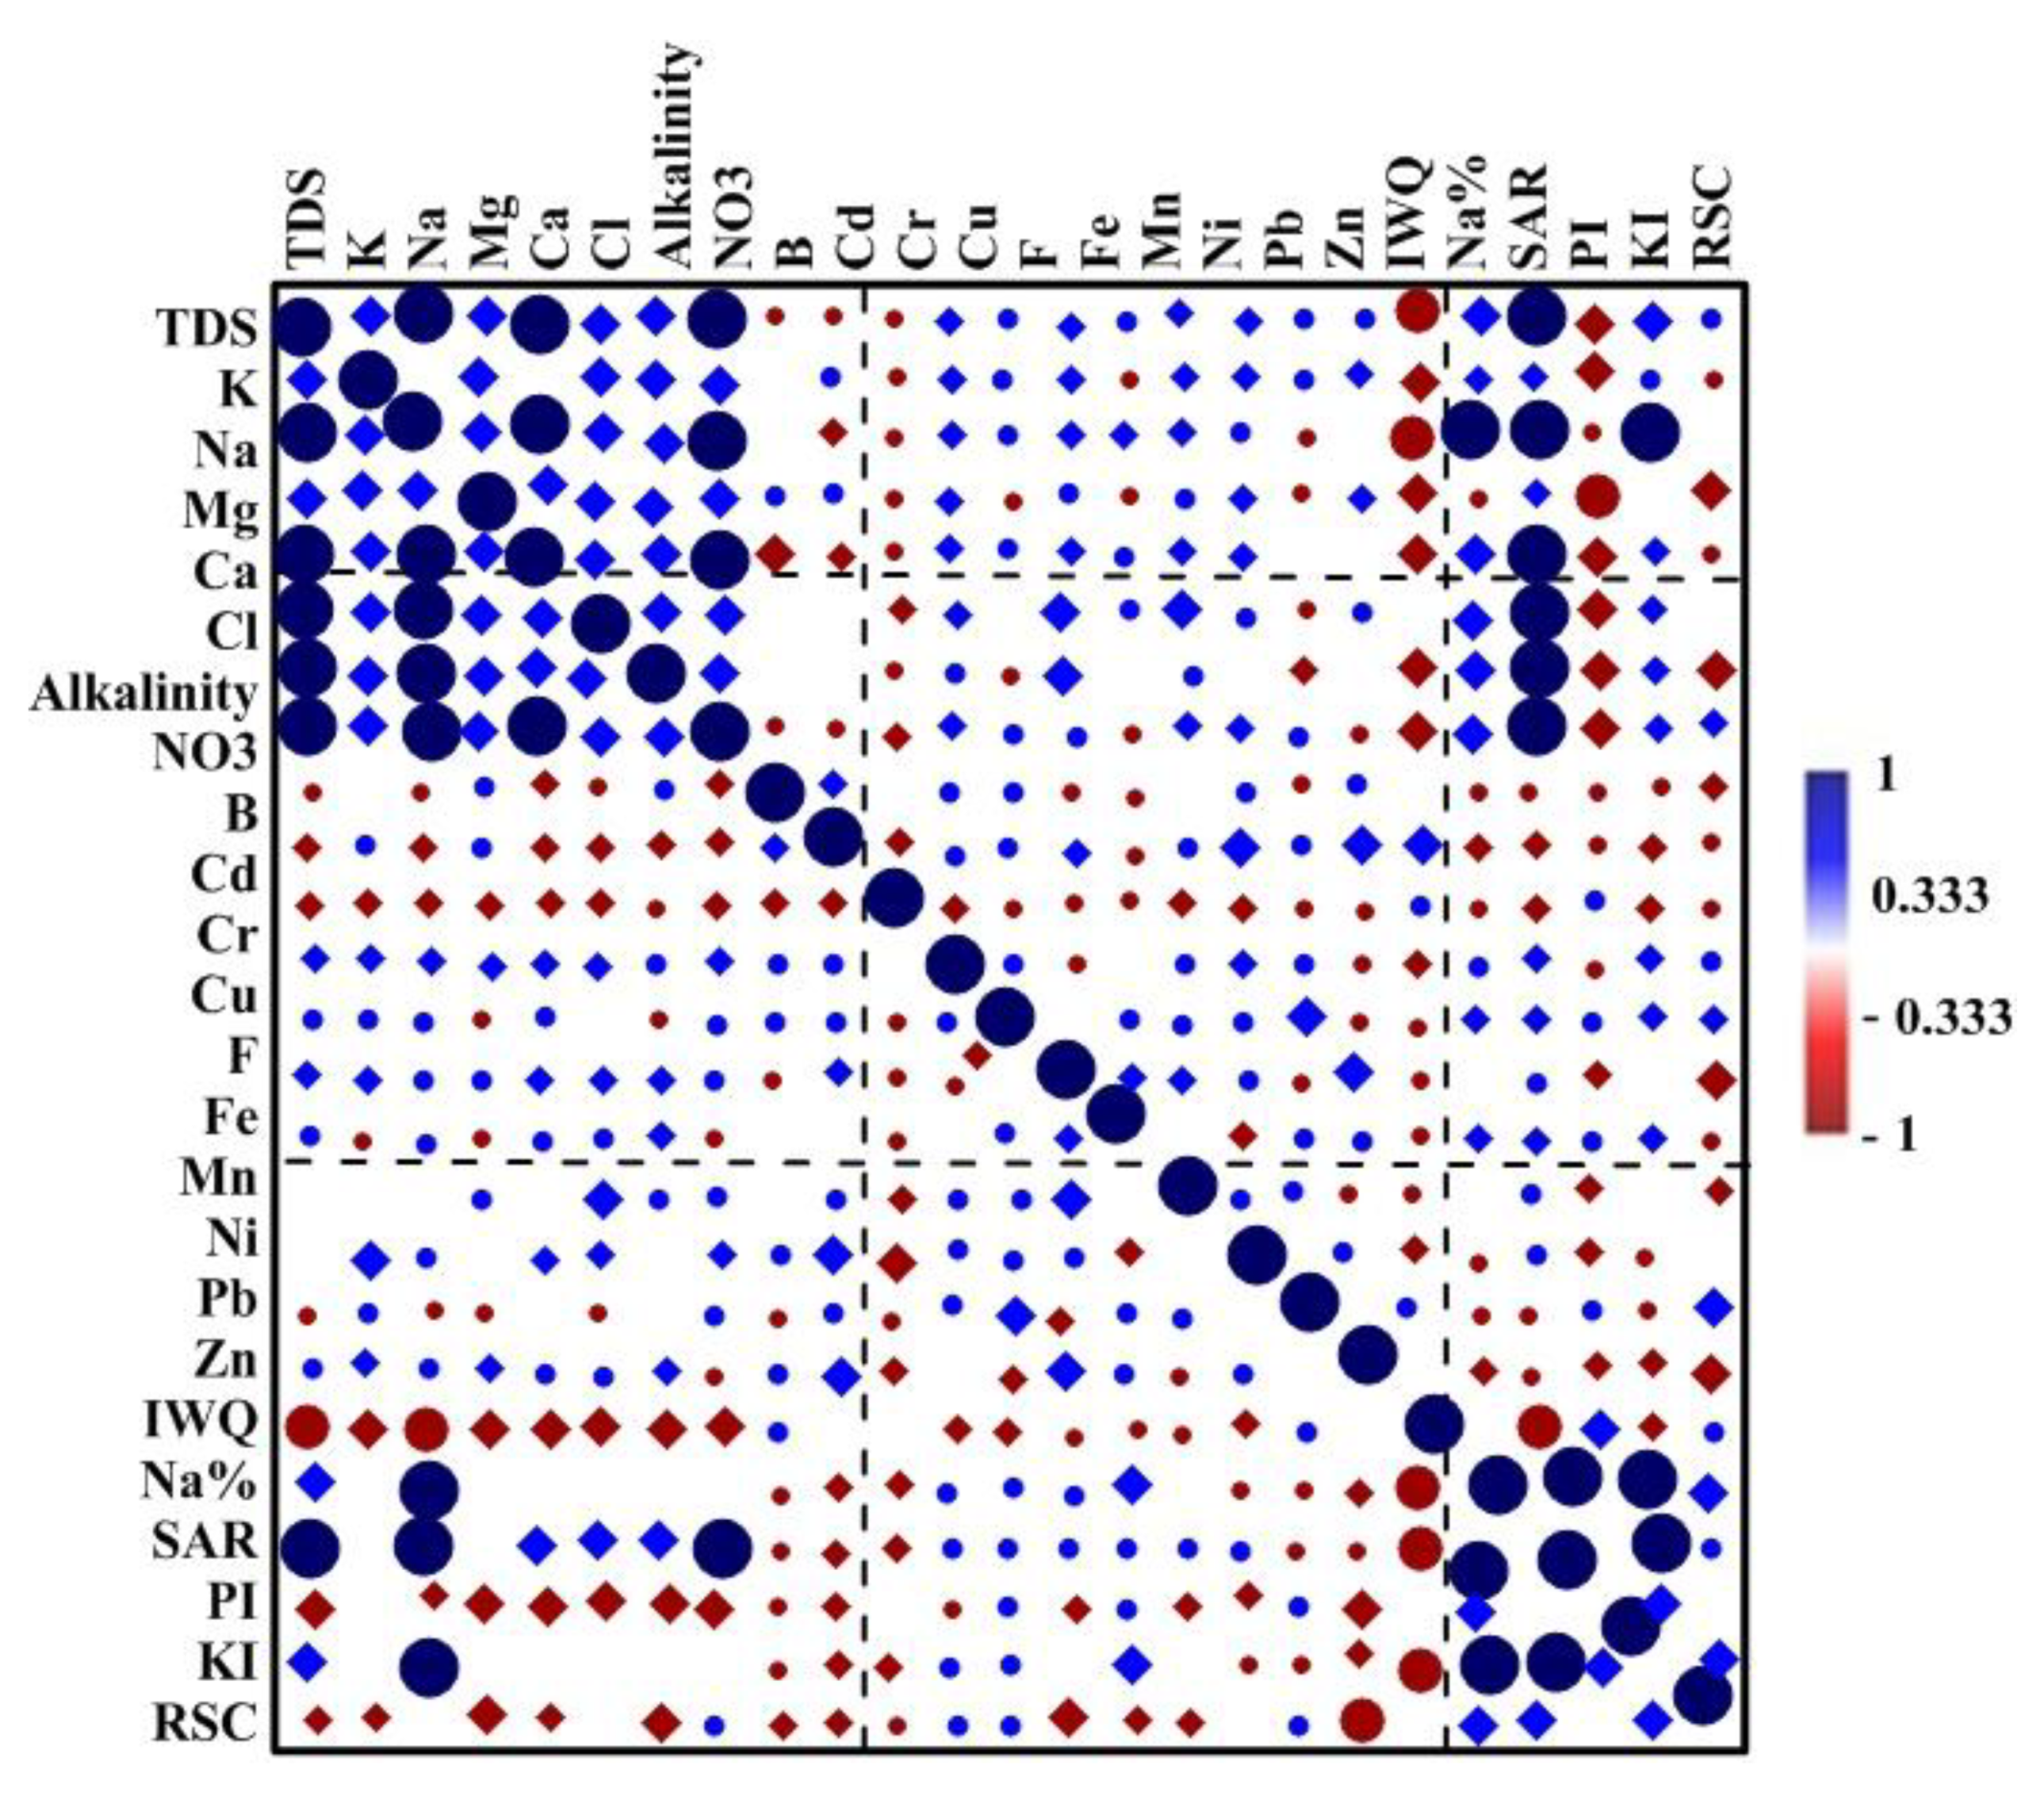
3.5. Correlation Coefficient of the Relationship between WQIs with Respect to the Physicochemical Parameters
3.6. Multivariate Statistical Analysis
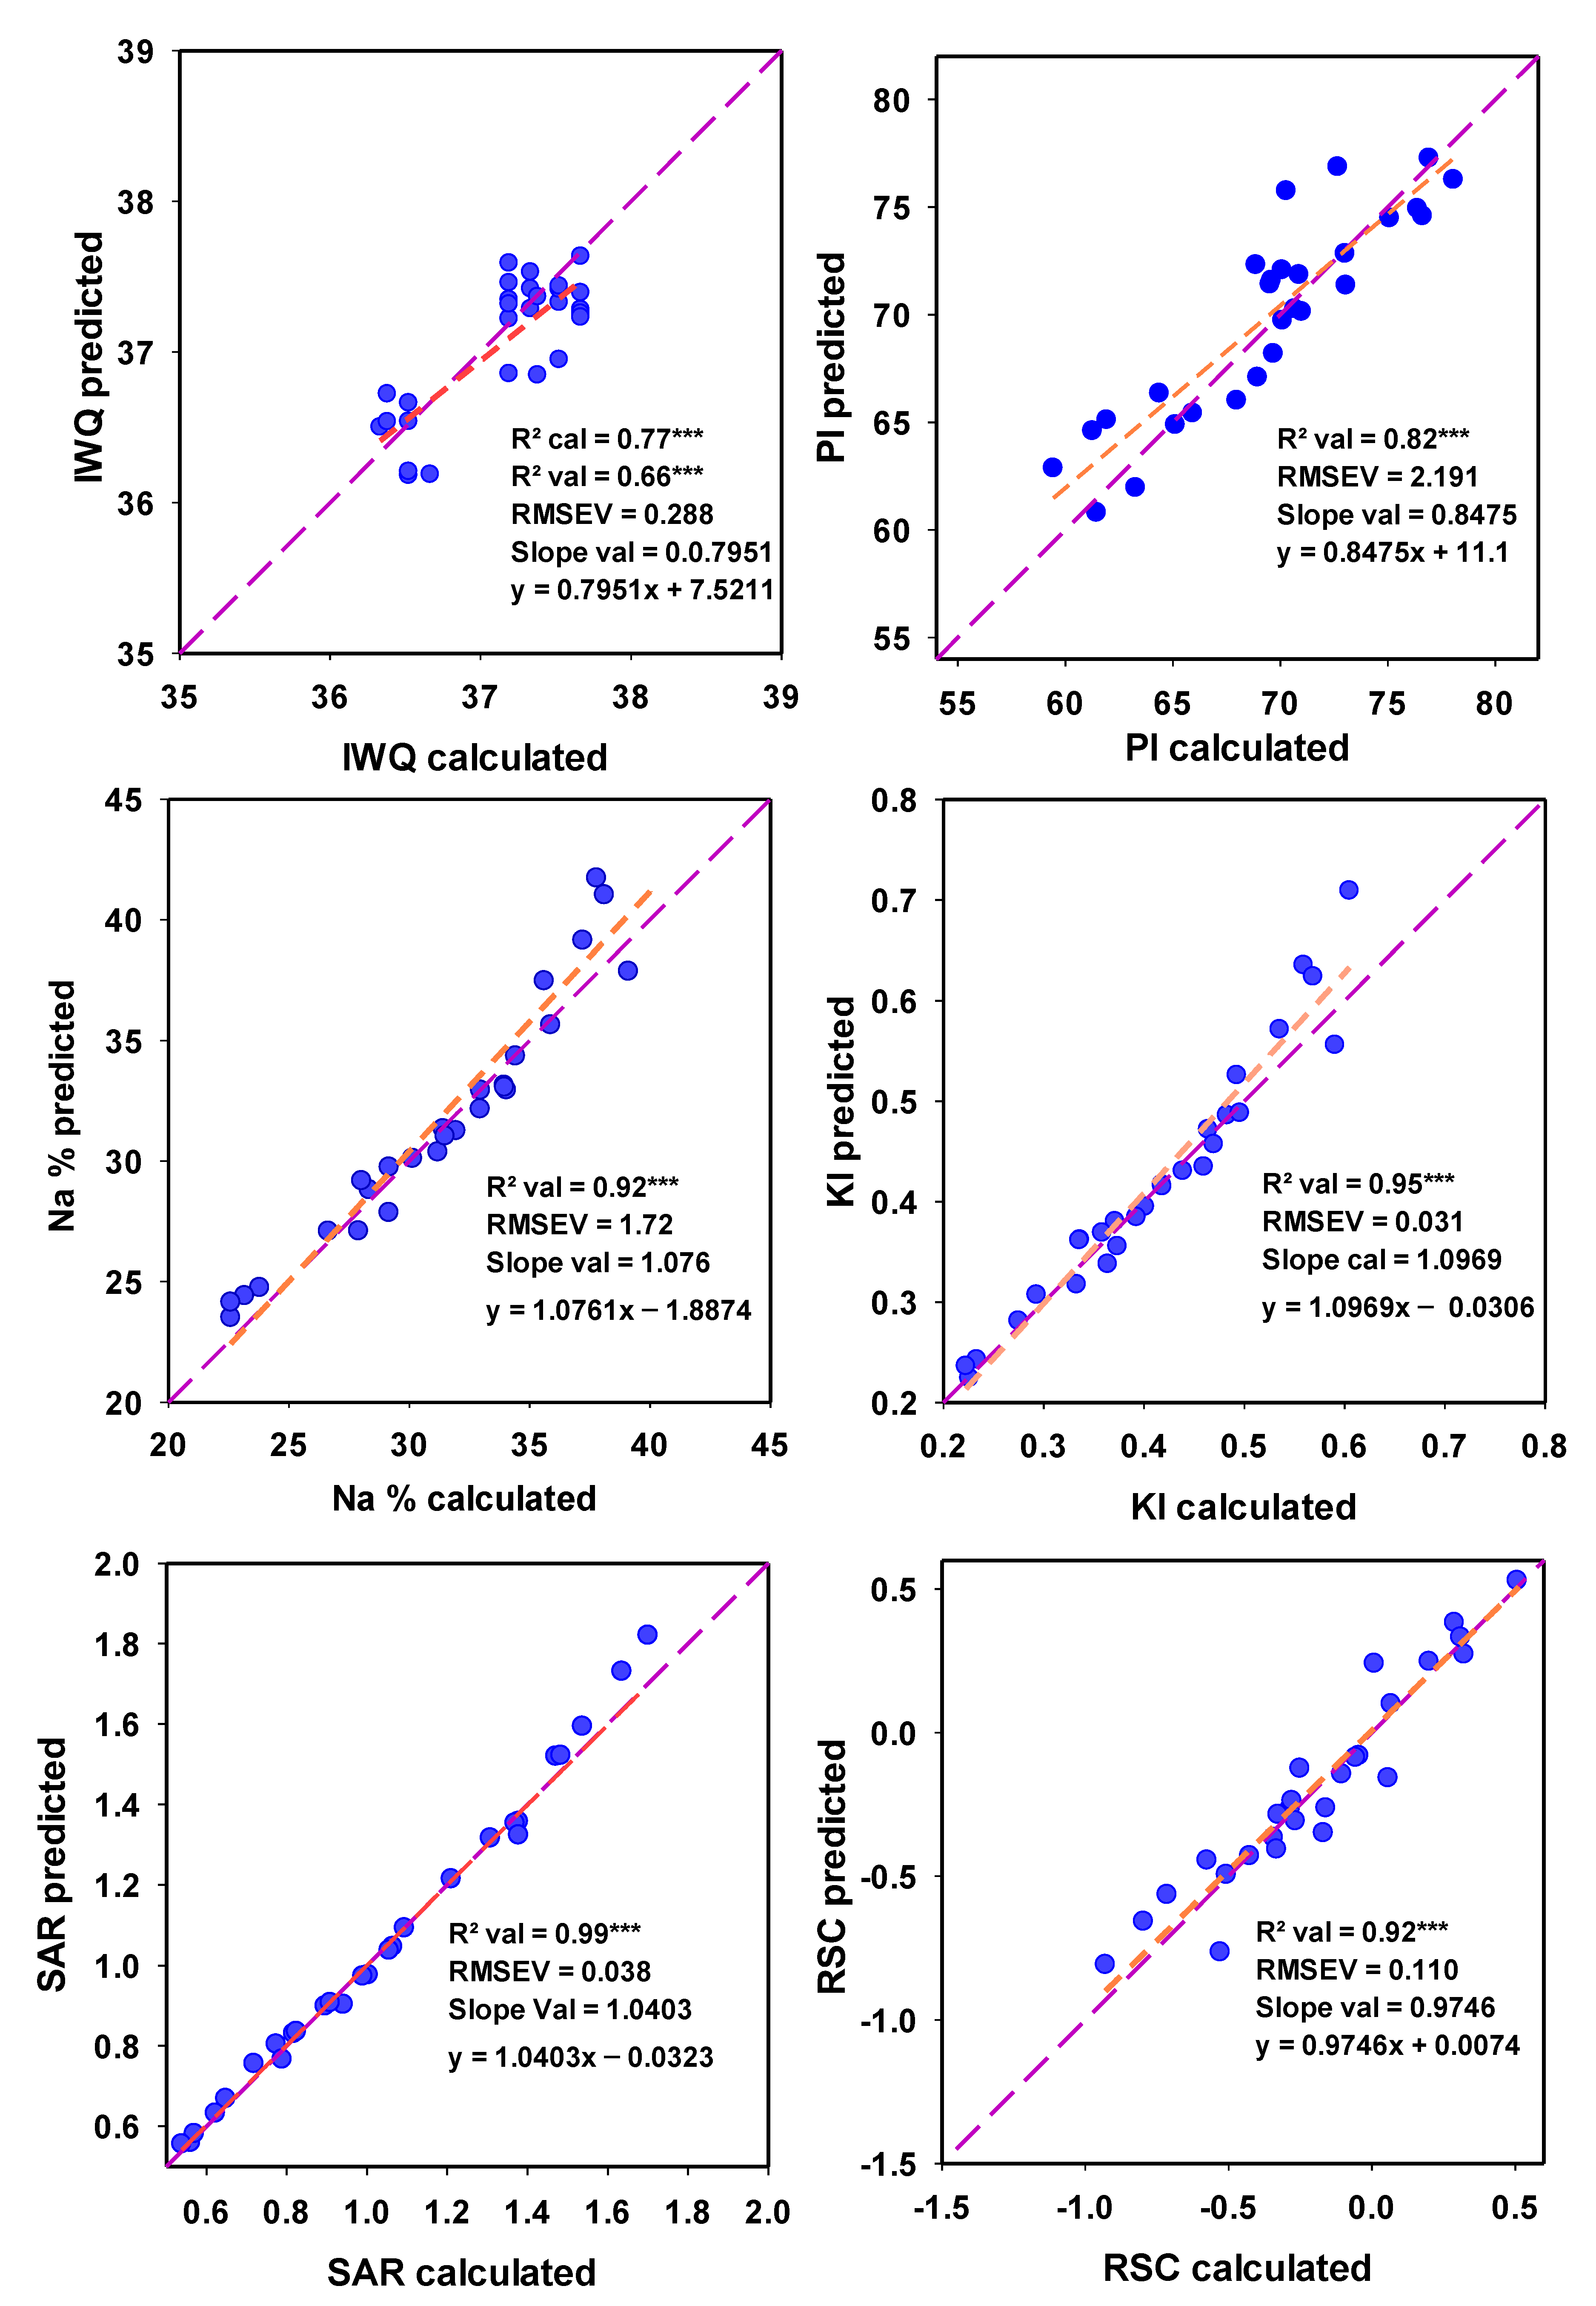
3.6.1. Using Principal Component Regression and Support Vector Machine Regression to Predict WQIs for Irrigation
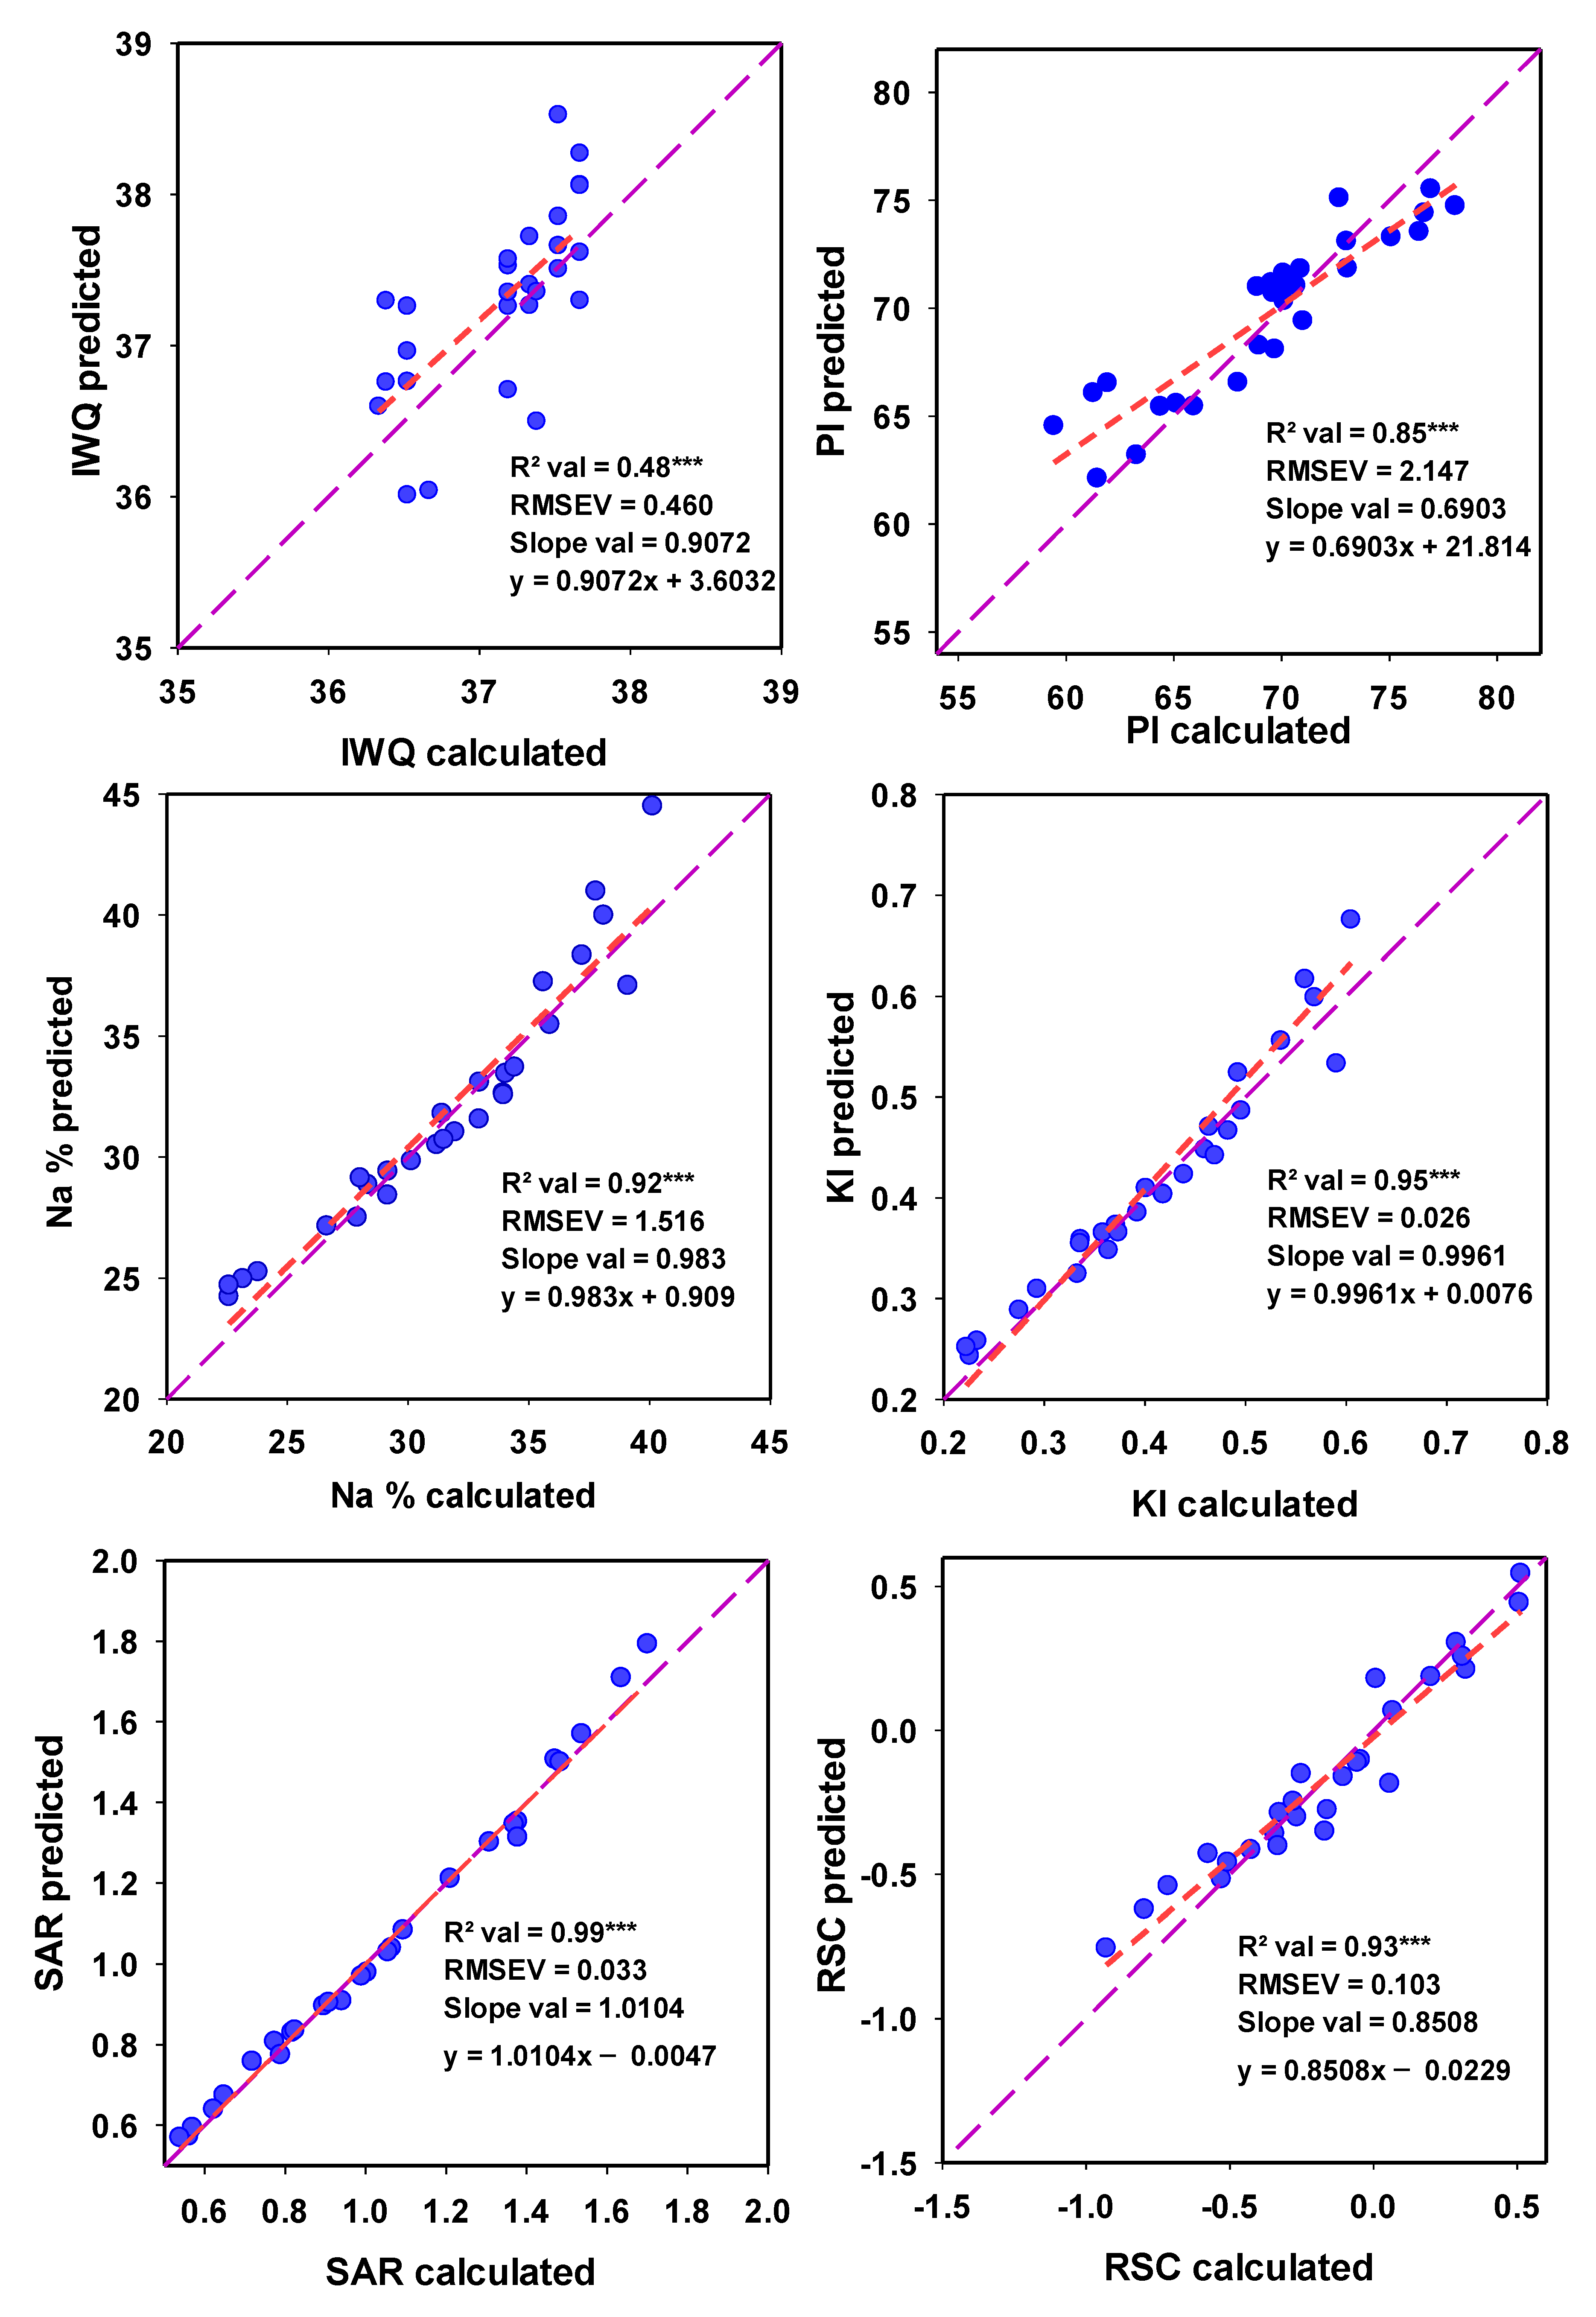
3.6.2. Using Stepwise Multiple Linear Regressions to Predict WQIs for Irrigation
4. Conclusions
Supplementary Materials
Author Contributions
Funding
Conflicts of Interest
References
- El-Hendawy, S.; Al-Suhaibani, N.; Elsayed, S.; Hassan, W.M.; Dewir, Y.H.; Refay, Y.; Abdella, K.A. Potential of the existing and novel spectral reflectance indices for estimating the leaf water status and grain yield of spring wheat exposed to different irrigation rates. Agric. Water Manag. 2019, 217, 356–373. [Google Scholar] [CrossRef]
- Khalifa, M.R.; Rabie, A.; Youssef, S.M.; El-Henawy, A.S. Evaluation of available sources of irrigation water at North Delta and its effect on soil salt storage under some field crops; Scientific Symposium on “Problems of Soils and Waters in Dakahlia and Damietta Governorates”. Mansoura Univ. Mansoura Egypt 2003, 18, 43–52. [Google Scholar]
- Mohamed, E.S.; Abu-Hashim, M.; Belal, A.A.A. Sustainable Indicators in Arid Region: Case Study-Egypt. In The Handbook of Environmental Chemistry; Springer Science and Business Media LLC: Berlin/Heidelberg, Germany, 2018; pp. 273–293. [Google Scholar]
- Kawy, W.A.M.A. Using GIS modeling to assess the agricultural sustainability in Kafr El-Sheikh Governorate, Nile Delta, Egypt. Arab. J. Geosci. 2018, 6, 733–747. [Google Scholar] [CrossRef]
- Mohamed, E.S.; Belal, A.; Shalaby, A. Impacts of soil sealing on potential agriculture in Egypt using remote sensing and GIS techniques. Eurasian Soil Sci. 2015, 48, 1159–1169. [Google Scholar] [CrossRef]
- Aminiyan, M.M.; Aminiyan, F.M.; Heydariyan, A. Study on hydrochemical characterization and annual changes of surface water quality for agricultural and drinking purposes in semi-arid area. Sustain. Water Resour. Manag. 2016, 2, 473–487. [Google Scholar] [CrossRef]
- El-Bouraie, M.M.; El-Barbary, A.A.; Yehia, M.M.; Motawea, E.A. Heavy metal concentrations in surface river water and bed sediments at Nile Delta in Egypt. Suo 2010, 61, 1–12. [Google Scholar]
- Gibbs, R.J. Mechanisms controlling world water chemistry. Science 1970, 170, 10881. [Google Scholar] [CrossRef]
- Gad, M.; El Osta, M. Geochemical controlling mechanisms and quality of the groundwater resources in El Fayoum Depression, Egypt. Arab. J. Geosci. 2020, 13, 861. [Google Scholar] [CrossRef]
- Shakeri, A.; Ghoreyshinia, S.; Mehrabi, B. Surface and groundwater quality in Taftan geothermal field, SE Iran. Water Qual. Expo. Health 2014, 7, 205–218. [Google Scholar] [CrossRef]
- Zhang, B.; Song, X.; Zhang, Y.; Han, D.; Tang, C.; Yu, Y.; Ma, Y. Hydrochemical characteristics and water quality assessment of surface water and groundwater in Songnen Plain, Northeast China. Water Res. 2012, 46, 2737–2748. [Google Scholar] [CrossRef]
- Mondal, N.C.; Singh, V.P. Hydrochemical analysis of salinization for a tannery belt in Southern. India J. Hydrol. 2011, 405, 235–247. [Google Scholar] [CrossRef]
- Sarwade, D.V.; Nandakumar, M.V.; Kesari, M.P.; Mondal, N.C.; Singh, V.S.; Singh, B. Evaluation of sea water ingress into an Indian Attoll. Environ. Geol. 2007, 52, 1475–1483. [Google Scholar] [CrossRef]
- Saxena, V.K.; Singh, V.S.; Mondal, N.C.; Jain, S.C. Use of chemical parameters to delineation fresh ground water resources in Potharlanka Island, India. Environ. Geol. 2003, 44, 516–521. [Google Scholar] [CrossRef]
- Zhang, W.; Ma, L.; Abuduwaili, J.; Ge, Y.; Issanova, G.; Saparov, G. Hydrochemical characteristics and irrigation suitability of surface water in the Syr Darya River, Kazakhstan. Environ. Monit. Assess. 2019, 191, 572. [Google Scholar] [CrossRef]
- Gad, M.; El-Hattab, M. Integration of water pollution indices and DRASTIC model for assessment of groundwater quality in El Fayoum Depression, Western Desert, Egypt. J. Afr. Earth Sci. 2019, 158, 103554. [Google Scholar] [CrossRef]
- Jalali, M. Salinization of groundwater in arid and semiarid zones: An example from Tajarak, Western Iran. Environ. Geol. 2007, 52, 1133–1149. [Google Scholar] [CrossRef]
- Mondal, N.C.; Singh, V.P.; Singh, V.S. Hydrochemical characteristic of coastal aquifer from Tuticorin, Tamilnadu, India. Environ. Monit. Assess. 2011, 175, 531–550. [Google Scholar] [CrossRef]
- Singh, S.; Ghosh, N.C.; Gurjar, S.; Krishan, G.; Kumar, S.; Berwal, P. Index-based assessment of suitability of water quality for irrigation purpose under Indian conditions. Environ. Monit. Assess. 2018, 190, 29. [Google Scholar] [CrossRef]
- Hussein, H.A.; Ricka, A.; Kuchovsky, T.; El Osta, M.M. Groundwater hydrochemistry and origin in the south-eastern part of Wadi El Natrun, Egypt. Arab. J. Geosci. 2017, 10, 170–184. [Google Scholar] [CrossRef]
- US Salinity Laboratory (USSL). Diagnosis and Improvement of Saline and Alkaline Soils; Department of Agriculture: Washington, DC, USA, 1954.
- Wilcox, L.V. Classification and Use of Irrigation Waters; U.S. Department of Agriculture: Washington, DC, USA, 1955.
- Singh, G.; Rishi1, M.S.; Arora, N.K. Integrated GIS-based modelling approach for irrigation water quality suitability zonation in parts of Satluj River Basin, Bist Doab region, North India. SN Appl. Sci. 2019, 1, 1438. [Google Scholar] [CrossRef]
- Horton, R. An Index Number System for RatingWater Quality. J. Water Pollut. Control Fed. 1965, 37, 300–306. [Google Scholar]
- Haase, J.; Stringuini, M.; Silva, M.; Rodrigues, M.; Koch, S. Qualidade das aguas superficiais do litoral norte e médio do Rio Grande do Sul. In Proceedings of the 22 Congresso Brasileiro de Engenharia Sanitaria e Ambiental, Joinville, Brazil, 14–19 September 2003; Volume 17, pp. 1–33. [Google Scholar]
- Arslan, B.; Akün, E. Management, contamination and quality evaluation of groundwater in North Cyprus. Agric. Water Manag. 2019, 222, 1–11. [Google Scholar] [CrossRef]
- Kawoa, N.S.; Karuppannanb, S. Groundwater quality assessment using water quality index and GIS technique in Modjo River Basin, central Ethiopia. J. Afr. Earth Sci. 2018, 147, 300–311. [Google Scholar] [CrossRef]
- Salem, Z.E.; Elsaiedy, G.; ElNahrawy, A. Assessment of the groundwater quality for drinking and irrigation purposes in the central Nile Delta region, Egypt. In The Handbook of Environmental Chemistry; Springer: Cham, Switzerland, 2019; Volume 73, pp. 647–684. [Google Scholar]
- Shil, S.; Singh, U.K.; Mehta, P. Water quality assessment of a tropical river using water quality index (WQI), multivariate statistical techniques and GIS. Appl. Water Sci. 2019, 9, 168. [Google Scholar] [CrossRef]
- Boyacioglu, H. Development of a water quality index based on a European classification scheme. Water SA 2007, 33, 101–106. [Google Scholar] [CrossRef]
- Khalil, B.; Ouarda, T.; St-Hilaire, A. Estimation of water quality characteristics at ungauged sites using artificial neural networks and canonical correlation analysis. J. Hydrol. 2011, 405, 277–287. [Google Scholar] [CrossRef]
- Regmi, R.K.; Mishra, B.K.; Masago, Y.; Luo, P.; Toyozumi-Kojima, A.; Jalilov, S. Applying a water quality index model to assess the water quality of the major rivers in the Kathmandu Valley, Nepal. Environ. Monit. Assess. 2017, 189, 382. [Google Scholar] [CrossRef]
- Chukwuma, C.E.; Chukwuma, C.G.; Uba, I.J.; Orakwe, C.L.; Ogbu, N.K. Irrigation water quality index assessment of Ele River in parts of Anambra State of Nigeria. Int. J. Curr. Res. 2016, 4, 1–6. [Google Scholar] [CrossRef]
- Sener, S.; Sener, E.; Davraz, A. Evaluation of water quality using water quality index (WQI) method and GIS in Aksu River (SW-Turkey). Sci. Total Environ. 2017, 584, 131–144. [Google Scholar] [CrossRef]
- Wang, X.; Zhang, F.; Ding, J. Evaluation of water quality based on a machine learning algorithm and water quality index for the Ebinur Lake Watershed, China. Sci. Rep. 2017, 7, 12858. [Google Scholar] [CrossRef]
- Ayers, R.S.; Westcot, D.W. Water Quality for Agriculture: FAO Irrigation and Drainage Paper; FAO: Rome, Italy, 1985. [Google Scholar]
- Dutta, S.; Dwivedi, A.; Kumar, M.S. Use of water quality index and multivariate statistical techniques for the assessment of spatial variations in water quality of a small river. Environ. Monit. Assess. 2018, 190, 718. [Google Scholar] [CrossRef] [PubMed]
- Elumalai, V.; Nethononda, V.G.; Manivannan, V.; Rajmohan, N.; Li, P.; Elango, L. Groundwater quality assessment and application of multivariate statistical analysis in Luvuvhu catchment, Limpopo, South Africa. J. Afr. Earth Sci. 2020, 171, 103967. [Google Scholar] [CrossRef]
- Kamtchueng, B.T.; Fantong, W.Y.; Wirmvem, M.J. Hydrogeochemistry and quality of surface water and groundwater in the vicinity of Lake Monoun, West Cameroon: Approach from multivariate statistical analysis and stable isotopic characterization. Environ Monit Assess. 2016, 188, 524. [Google Scholar] [CrossRef] [PubMed]
- Rakotondrabe, F.; Ngoupayou, J.R.; Mfonka, Z. Water quality assessment in the Betare-Oya gold mining area (East-Cameroon): Multivariate statistical analysis approach. Sci. Total Environ. 2018, 610, 831–844. [Google Scholar] [CrossRef] [PubMed]
- Li, P.; Tian, R.; Liu, R. Solute geochemistry and multivariate analysis of water quality in the GuohuaPhosphorite Mine, Guizhou Province, China. Expo. Health 2019, 11, 81–94. [Google Scholar] [CrossRef]
- Yidana, S.M.; Bawoyobie, P.; Sakyi, P.; Fynn, O.F. Evolutionary analysis of groundwater flow: Application of multivariate statistical analysis to hydrochemical data in the Densu Basin, Ghana. J. Afr. Earth Sci. 2018, 138, 167–176. [Google Scholar] [CrossRef]
- Nnorom, I.C.; Ewuzie, U.; Eze, S.O. Multivariate statistical approach and water quality assessment of natural springs and other drinking water sources in Southeastern Nigeria. Heliyon 2019, 5, 01123. [Google Scholar] [CrossRef]
- Busico, G.; Kazakis, N.; Cuoco, E.; Colombani, N.; Tedesco, D.; Voudouris, K.; Mastrocicco, M. A novel hybrid method of specific vulnerability to anthropogenic pollution using multivariate statistical and regression analyses. Water Res. 2020, 171, 115386. [Google Scholar] [CrossRef]
- Gorai, A.K.; Hasni, S.A.; Iqbal, J. Prediction of ground water quality index to assess suitability for drinking purposes using fuzzy rule-based approach. Appl. Water Sci. 2016, 6, 393–405. [Google Scholar] [CrossRef]
- Sahu, M.; Mahapatra, S.S.; Sahu, H.; Patel, R.K. Prediction of Water Quality Index Using Neuro Fuzzy Inference System. Water Qual. Expo. Health 2011, 3, 175–191. [Google Scholar] [CrossRef]
- Darwishe, H.; El Khattabi, J.; Chaaban, F.; Louche, B.; Masson, E.; Carlier, E. Prediction and control of nitrate concentrations in groundwater by implementing a model based on GIS and artificial neural networks (ANN). Environ. Earth Sci. 2017, 76, 649. [Google Scholar] [CrossRef]
- Gad, M.; El-Hendawy, S.; Al-Suhaibani, N.; Tahir, M.U.; Mubushar, M.; Elsayed, S. Combining hydrogeochemical characterization and a hyperspectral reflectance tool for assessing quality and suitability of two groundwater resources for irrigation in Egypt. Water 2020, 12, 2169. [Google Scholar] [CrossRef]
- El Hamidi, M.J.; Larabi, A.; Faouzi, M.; Souissi, M. Spatial distribution of regionalized variables on reservoirs and groundwater resources based on geostatistical analysis using GIS: Case of Rmel-Oulad Ogbane aquifers (Larache, NW Morocco). Arab. J. Geosci. 2018, 11, 104. [Google Scholar] [CrossRef]
- Ahmad, S.; Ghani, M.M.I. Stepwise multiple regression method to forecast fish landing. Procedia Soc. Behav. Sci. 2010, 8, 549–554. [Google Scholar]
- Elsayed, S.; El-Gozayer, K.; Allam, A.; Schmidhalter, U. Passive reflectance sensing using regression and multivariate analysis to estimate biochemical parameters of different fruits kinds. Sci. Hortic. 2019, 243, 21–33. [Google Scholar] [CrossRef]
- Fan, L.L.; Zhao, J.L.; Xu, X.G.; Liang, D.; Yang, G.J.; Feng, H.K.; Yang, H.; Wang, Y.; Chen, G.; Wei, P. Hyperspectral-based estimation of leaf nitrogen content in corn using optimal selection of multiple spectral variables. Sensors 2019, 19, 2898. [Google Scholar] [CrossRef]
- Elsayed, S.; Elhewity, M.; Ibrahim, H.H.; Dewir, Y.H.; Migdadi, H.M.; Schmidhalter, U. Thermal imaging and passive reflectance sensing to estimate the water status and grain yield of wheat under different irrigation regimes. Agric. Water Manag. 2017, 189, 98–110. [Google Scholar] [CrossRef]
- Feng, M.; Guo, X.; Wang, C.; Yang, W.; Shi, C.; Ding, G.; Zhang, X.; Xiao, L.; Zhang, M.; Song, X. Monitoring and evaluation in freeze stress of winter wheat (Triticumaestivum L.) through canopy hyper-spectrum reflectance and multiple statistical analysis. Ecol. Indic. 2018, 84, 290–297. [Google Scholar] [CrossRef]
- Wang, J.; Liu, G.; Liu, H.; Lam, P.K. Multivariate statistical evaluation of dissolved trace elements and a water quality assessment in the middle reaches of Huaihe River, Anhui, China. Sci. Total Environ. 2017, 583, 421–431. [Google Scholar] [CrossRef]
- Wei, L.; Huang, C.; Zhong, Y.; Wang, Z.; Hu, X.; Lin, L. Inland waters suspended solids concentration retrieval based on PSO-LSSVM for UAV-borne hyperspectral remote sensing imagery. Remote Sens. 2019, 11, 1455. [Google Scholar] [CrossRef]
- Viscarra Rossel, R.; Behrens, T. Using data mining to model and interpret soil diffuse reflectance spectra. Geoderma 2010, 158, 46–54. [Google Scholar] [CrossRef]
- Walczak, B.; Massart, D.L. The radial basis functions-Partial least squares approach as a flexible non-linear regression technique. Anal. Chim. Acta 1996, 331, 177–185. [Google Scholar] [CrossRef]
- Field, A.P. Discovering Statistics Using IBM SPSS Statistics; Sage Publication: London, UK, 2009. [Google Scholar]
- Mustapha, A.; Aris, Z.A. Multivariate statistical analysis and environmental modeling of heavy metals pollution by industries. Pol. J. Environ. Stud. 2012, 21, 1359–1367. [Google Scholar]
- Pallant, J. SPSS Survival Manual: A Step by Step Guide to Data Analysis Using SPSS for Windows Version 15; Open University Press: Berkshire, UK, 2007; p. 165. [Google Scholar]
- Chen, J.; Lu, J. Effects of land use, topography and socio-economic factors on river water quality in a mountainous watershed with intensive agricultural production in East China. PLoS ONE 2014, 9, e102714. [Google Scholar] [CrossRef] [PubMed]
- Venables, W.N.; Ripley, B.D. Modern Applied Statistics with S, 4th ed.; Springer: New York, NY, USA, 2002. [Google Scholar]
- APHA. Standard Methods for the Examination of Water and Wastewater; American Public Health Association: Washington, DC, USA, 2012. [Google Scholar]
- Cude, C.G. Oregon water quality index a tool for evaluating water quality management effectiveness. J. Am. Water Resour. Assoc. 2001, 37, 125–137. [Google Scholar] [CrossRef]
- Simsek, C.; Gunduz, O. IWQ index: A GIS-integrated technique to assess irrigation water quality. Environ. Monit. Assess. 2007, 128, 277–300. [Google Scholar] [CrossRef]
- Todd, D.K. Groundwater Hydrology; Wiley: New York, NY, USA, 1980. [Google Scholar]
- Richards, L.A. Diagnosis and Improvement of Saline and Alkali Soils; U.S. Department of Agriculture: Washington, DC, USA, 1954.
- Doneen, L.D. Notes on Water Quality in Agriculture; Department of Water Science and Engineering, University of California: California, CA, USA, 1964. [Google Scholar]
- Kelley, W.P. Permissible composition and concentration of irrigated waters. Proc. Am. Soc. Civ. Eng. 1940, 66, 607–613. [Google Scholar]
- Gad, M.; Elsayed, S.; Moghanm, F.S.; Almarshadi, M.H.; Alshammari, A.S.; Khedher, K.M.; Eid, E.M.; Hussein, H. Combining Water Quality Indices and Multivariate Modeling to Assess Surface Water Quality in the Northern Nile Delta, Egypt. Water 2020, 12, 2142. [Google Scholar] [CrossRef]
- Vasques, G.M.; Grunwald, S.; Sickman, J.O. Comparison of multivariate methods for inferential modeling of soil carbon using visible/near-infrared spectra. Geoderma 2008, 146, 14–25. [Google Scholar] [CrossRef]
- FAO. Water Quality Guidelines for Agriculture, Surface Irrigation and Drainage; FAO: Rome, Italy, 1985. [Google Scholar]
- Vetrimurugan, E.; Elango, L. Seasonal and spatial variation in magnesium and chloride concentration in groundwater of deltaic regions of Kumbakonam, Nannilam and Karaikal, Tamil Nadu. Indian J. Environ. Prot. 2007, 27, 987–995. [Google Scholar]
- El-Bana, T.A. Agro-Ecological Assessment of Land and Water Resources Norther Nile Delta: A Case Study in Kafr El-Sheikh Governorate. Master’s Thesis, Alexandria University, Alexandria, Egypt, 2003. [Google Scholar]
- El-Bana, T.A.; Gaber, H.M.; Bahnassy, M.H.; Suliman, A.S. Quality assessment of water resources in Northern Nile Delta: A case study in Kafr El-Sheikh Governorate. Egypt. J. Soil Sci. 2006, 46, 409–423. [Google Scholar]
- Srinivasamoorthy, K.; Chidambaram, S.; Prasanna, M.V.; Vasanthavihar, M.; Peter, J.; Anandhan, P. Identification of major sources controlling groundwater chemistry from a hard rock terrain—A case study from Mettur taluk, Salem district, Tamil Nadu, India. J. Earth Syst. Sci. 2008, 117, 49–58. [Google Scholar] [CrossRef]
- Obeidatt, A.; Alawneh, M. Hydrochemistry and groundwater quality assessment in Mafraq Province, Jordan. Open Access Libr. J. 2019, 6, 1–10. [Google Scholar] [CrossRef]
- Subrahmanyam, K.; Yadaiah, P. Assessment of the impact of industrial effluents on water quality in Patancheru and environs, Medak district, Andhra Pradesh, India. Hydrogeol. J. 2001, 9, 297–312. [Google Scholar] [CrossRef]
- Masoud, A.H.; El-Fakharany, I.I.; Abd El-Razik, M.A.S. Monitoring of some agrochemical pollutants in surface water in Kafr El-Sheikh Governorate. J. Pest. Cont. Environ. Sci. 2007, 15, 21–41. [Google Scholar]
- Avila, P.F.; Oliveira, J.S.; da Silva, E.F.; Fonseca, E.C. Geochemical signatures and mechanisms of trace elements dispersion in the area of the Vale das Gatas mine (Northern Portugal). J. Geochem. Explor. 2005, 85, 17–29. [Google Scholar] [CrossRef]
- Khan, M.Y.; Gani, K.M.; Chakrapani, G.J. Spatial and temporal variations of physicochemical and heavy metal pollution in Ramganga River—A tributary of River Ganges, India. Environ. Earth Sci. 2017, 76, 231. [Google Scholar] [CrossRef]
- Purushothman, P.; Rao, M.S.; Kumar, B.; Rawat, Y.S.; Krishan, G.; Gupta, S.; Marwah, S.; Bhatia, A.K.; Kaushik, Y.B.; Angurala, M.P.; et al. Drinking and irrigation water quality in Jalandhar and Kapurthala Districts, Punjab, India: Using hydrochemistry. Int. J. Earth Sci. Eng. 2012, 5, 1599–1608. [Google Scholar]
- Saleh, A.; Al-Ruwaih, F.; Shehata, M. Hydrogeochemical processes operating within the main aquifers of Kuwait. J. Arid Environ. 1999, 42, 195–209. [Google Scholar] [CrossRef]
- Sundaray, S.K.; Nayak, B.B.; Bhatta, D. Environmental studies on river water quality with reference to suitability for agricultural purposes: Mahanadi river estuarine system, India—A case study. Environ. Monit. Assess. 2009, 155, 227–243. [Google Scholar] [CrossRef]
- Srinivasamoorthy, K.; Gopinath, M.; Chidambaram, S.; Vasanthavigar, M.; Sarma, V.S. Hydrochemical characterization and quality appraisal of groundwater from Pungar sub basin, Tamilnadu, India. J. King Saud Uni. Sci. 2014, 26, 37–52. [Google Scholar] [CrossRef]
- Subramani, T.; Elango, L.; Damodarasamy, S.R. Groundwater quality and its suitability for drinking and agricultural use in Chithar River Basin, Tamil Nadu, India. Environ. Geol. 2005, 47, 1099–1110. [Google Scholar] [CrossRef]
- Suarez, D.L.; Wood, J.D.; Lesch, S.M. Effect of SAR on water infiltration under a sequential rain-irrigation management system. Agric. Water Manag. 2006, 86, 150–164. [Google Scholar] [CrossRef]
- Tiwari, T.N.; Manzoor, A. River pollution in Kathmandu valley (Nepal) suitability of river water for irrigation. Indian J. Environ. Prot. 1988, 8, 269–274. [Google Scholar]
- Arumugam, K.; Elangovan, K. Hydrochemical characteristics and groundwater quality assessment in Tirupur Region, Coimbatore District, Tamil Nadu, India. Environ. Geol. 2009, 58, 1509–1520. [Google Scholar] [CrossRef]
- Kelley, W.P. Alkali soils: Their Formation, Properties and Reclamation; Reinhold: New York, NY, USA, 1951. [Google Scholar]
- Kumar, M.; Kumari, K.; Ramanathan, A.; Saxena, R. A comparative evaluation of groundwater suitability for irrigation and drinking purposes in two intensively cultivated districts of Punjab, India. Environ. Geol. 2007, 53, 553–574. [Google Scholar] [CrossRef]
- Hem, J.D. Study and interpretation of the chemical characteristics of natural water. USGS Water Supply Paper 1995, 264, 117–120. [Google Scholar]
- Ravikumar, P.; Somashekar, R.K.; Angami, M. Hydrochemistry and evaluation of groundwater suitability for irrigation and drinking purposes in the Markandeya River basin, Belgaum District, Karnataka State, India. Environ. Monit. Assess. 2011, 173, 459–487. [Google Scholar] [CrossRef]
- Sudhakar, A.; Narsimha, A. Suitability and assessment of groundwater for irrigation purpose: A case study of Kushaiguda area, Ranga Reddy district, Andhra Pradesh, India. Adv. Appl. Sci. Res. 2013, 4, 75–81. [Google Scholar]
- Ahmed, U.; Mumtaz, R.; Anwar, H.; Shah, A.A.; Irfan, R.; García-Nieto, J. Efficient water quality prediction using supervised machine learning. Water 2019, 11, 2210. [Google Scholar] [CrossRef]
- Chen, W.B.; Liu, W.C. Water quality modeling in reservoirs using multivariate linear regression and two neural network models. Adv. Artif. Neural Syst. 2015, 2015, 521721. [Google Scholar] [CrossRef][Green Version]
- Wang, Y.; Yuan, Y.; Pan, Y.; Fan, Z. Modeling daily and monthly water quality indicators in a canal using a hybrid wavelet-based support vector regression structure. Water 2020, 12, 1476. [Google Scholar] [CrossRef]


| Water Quality Indices (WQIs) | Formula | References |
|---|---|---|
| Irrigation Water Quality | [66] | |
| Sodium Percentage * | Na% = [(Na+ + K+)/(Ca2+ + Mg2+ + Na+ + K+)] × 100 | [67] |
| Sodium Absorption Ratio * | [68] | |
| Permeability Index * | [69] | |
| Kelley Index * | KI= Na+/(Ca2+ + Mg2+) | [70] |
| Residual Sodium Carbonate * | RSC = [(Alkalinity) − (Ca2+ + Mg2+)] | [68] |
| Parameters | Range | Mean ± Standard Error | ||
|---|---|---|---|---|
| First Year | Second Year | First Year | Second Year | |
| pH | 7.1–8.5 | 7.2–8.7 | 7.81 ± 0.03 | 8.00 ± 0.29 |
| TDS | 214.2–460.6 | 260.0–506.0 | 314.43 ± 11.17 | 359.71 ± 88.90 |
| EC | 334.7–719.7 | 406.0–791.0 | 491.31 ± 17.45 | 562.09 ± 138.87 |
| K+ | 3.1–9.5 | 4.5–11.2 | 6.01 ± 0.24 | 7.39 ± 1.98 |
| Na+ | 11.8–48.9 | 15.0–55.0 | 27.91 ± 1.46 | 32.51 ± 11.56 |
| Mg2+ | 6.3–23.8 | 8.1–25.0 | 14.22 ± 0.54 | 16.97 ± 4.27 |
| Ca2+ | 18.4–58.6 | 22.6–64.6 | 34.31 ± 1.31 | 39.56 ± 10.98 |
| Cl− | 3.8–47.6 | 4.0–55.0 | 22.46 ± 1.37 | 28.80 ± 12.21 |
| SO42− | 21.4–93.9 | 26.2–104.1 | 40.31 ± 2.20 | 52.10 ± 18.06 |
| Alkalinity | 110.7–254.2 | 118.0–278.3 | 169.18 ± 5.91 | 184.29 ± 44.59 |
| NO3− | 0.5–4.3 | 0.8–4.4 | 1.46 ± 0.07 | 1.51 ± 0.58 |
| F− | 0.11–0.68 | 0.10–0.70 | 0.270 ± 0.02 | 0.265 ± 0.168 |
| B | 0.01- 0.40 | 0.01–0.20 | 0.10 ± 0.01 | 0.07 ± 0.04 |
| Cd | 0.0002–0.0310 | 0.0001–0.0009 | 0.005 ± 0.001 | 0.001 ± 0.000 |
| Cr | 0.003–0.310 | 0.005–0.100 | 0.050 ± 0.007 | 0.047 ± 0.020 |
| Cu | 0.001–0.020 | 0.001–0.030 | 0.008 ± 0.0005 | 0.009 ± 0.005 |
| Fe | 0.04–1.17 | 0.05–0.70 | 0.220 ± 0.02 | 0.206 ± 0.157 |
| Mn | 0.01–0.43 | 0.01–0.45 | 0.090 ± 0.01 | 0.105 ± 0.087 |
| Ni | 0.001–0.040 | 0.001–0.050 | 0.010 ± 0.001 | 0.017 ± 0.017 |
| Pb | 0.001–0.310 | 0.001–0.090 | 0.04 ± 0.012 | 0.021 ± 0.019 |
| Zn | 0.001–0.210 | 0.001–0.008 | 0.02 ± 0.007 | 0.003 ± 0.002 |
| Hazard Group | Weight | Parameter | Range | Rating | Suitability | Samples (%) | |
|---|---|---|---|---|---|---|---|
| First Year | Second Year | ||||||
| Salinity hazard | 5 | Electrical conductivity (µS/cm) | EC < 700 | 3 | High | 93% | 71% |
| 700 ≤ EC ≤ 3000 | 2 | Medium | 7% | 29% | |||
| EC > 3000 | 1 | Low | Nil | Nil | |||
| Infiltration and permeability hazard | 4 | Electrical conductivity (µS/cm) with Sodium Adsorption Ratio | (See Table S3 for details) | 3 | High | 93% | 71% |
| 2 | Medium | 7% | 29% | ||||
| 1 | Low | Nil | Nil | ||||
| Specific ion toxicity | 3 | Sodium Absorption Ratio (-) | SAR < 3.0 | 3 | High | 100% | 100% |
| 3.0 ≤ SAR ≤ 9.0 | 2 | Medium | Nil | Nil | |||
| SAR > 9.0 | 1 | Low | Nil | Nil | |||
| Chloride (mg/L) | Cl− < 140 | 3 | High | 100% | 100% | ||
| 140 ≤ Cl− ≤ 350 | 2 | Medium | Nil | Nil | |||
| Cl− > 350 | 1 | Low | Nil | Nil | |||
| Trace element toxicity | 2 | B, Cd, Cr, Cu, Fe, Mn, Ni, Pb and Zn (mg/L) | (See Table S4 for details) | 3 | High | 100% | 100% |
| 2 | Medium | Nil | Nil | ||||
| 1 | Low | Nil | Nil | ||||
| Miscellaneous effects to sensitive crops | 1 | Nitrate Nitrogen (mg/L) | NO3− < 5.0 | 3 | High | 100% | 100% |
| 5.0 ≤ NO3− ≤ 30.0 | 2 | Medium | Nil | Nil | |||
| NO3− > 30.0 | 1 | Low | Nil | Nil | |||
| Alkalinity (mg/L) | Alkalinity < 90 | 3 | High | Nil | Nil | ||
| 90 ≤ alkalinity ≤ 500 | 2 | Medium | 100% | 100% | |||
| Alkalinity > 500 | 1 | Low | Nil | Nil | |||
| pH | 7.0 ≤ pH ≤ 8.0 | 3 | High | 75% | 62% | ||
| 6.5 ≤ pH < 7.0 and 8.0 < pH ≤ 8.5 | 2 | Medium | 25% | 33% | |||
| pH < 6.5 or pH > 8.5 | 1 | Low | Nil | 4% | |||
| IWQIs | IWQ | Na% | SAR | PI | KI | RSC |
|---|---|---|---|---|---|---|
| The first year (n = 55) | ||||||
| Minimum | 36.33 | 22.20 | 0.46 | 60.12 | 0.20 | −1.14 |
| Maximum | 37.66 | 43.20 | 1.57 | 85.58 | 0.69 | 0.64 |
| Mean | 37.34 | 31.57 | 0.99 | 71.81 | 0.41 | −0.11 |
| Standard deviation | 0.29 | 5.09 | 0.30 | 5.42 | 0.11 | 0.33 |
| The second year (n = 55) | ||||||
| Minimum | 36.00 | 22.58 | 0.53 | 58.59 | 0.22 | −1.47 |
| Maximum | 37.66 | 42.14 | 1.70 | 80.77 | 0.65 | 0.40 |
| Mean | 37.16 | 31.75 | 1.07 | 67.52 | 0.41 | −0.35 |
| Standard deviation | 0.46 | 4.48 | 0.29 | 4.99 | 0.09 | 0.39 |
| Data across two years (n = 110) | ||||||
| Minimum | 36.33 | 22.20 | 0.46 | 58.59 | 0.20 | −1.47 |
| Maximum | 37.66 | 43.20 | 1.70 | 85.58 | 0.69 | 0.64 |
| Mean | 37.26 | 31.67 | 1.04 | 69.67 | 0.41 | −0.23 |
| Standard deviation | 0.30 | 5.10 | 0.30 | 5.42 | 0.11 | 0.33 |
| Water Quality Indices | Range | Water Class | Samples (%) | |
|---|---|---|---|---|
| First Year | Second Year | |||
| Irrigation Water Quality (IWQ) | <22 | Low | Nil | Nil |
| 22–37 | Medium | 11% (6 samples) | 25% (14 samples) | |
| >37 | High | 89% (49 samples) | 75% (41 samples) | |
| Sodium Percentage (Na%) | <20 | Excellent | Nil | Nil |
| 20–40 | Good | 96% (53 samples) | 96% (53 samples) | |
| 40–60 | Permissible | 4% (2 samples) | 4% (2 samples) | |
| 60–80 | Doubtful | Nil | Nil | |
| >80 | Unsuitable | Nil | Nil | |
| Sodium Absorption Ratio (SAR) | <10 | Excellent | 100% (55 samples) | 100% (55 samples) |
| 10–18 | Good/safe | Nil | Nil | |
| 18–26 | Doubtful/moderate | Nil | Nil | |
| >26 | Unsuitable | Nil | Nil | |
| Permeability Index (PI) | >75% | Good-Class I | 29% (16 samples) | 9% (5 samples) |
| 25%–75% | Good-Class II | 71% (39 samples) | 91% (50 samples) | |
| <25% | Unsuitable-Class III | Nil | Nil | |
| Kelley Index (KI) | <1 | Good | 100% (55 samples) | 100% (55 samples) |
| >1 | Unsuitable | Nil | Nil | |
| Residual Sodium Carbonate (RSC) | <1.25 | Good | 100% (55 samples) | 100% (55 samples) |
| 1.25–2.5 | Doubtful | Nil | Nil | |
| >2.5 | Unsuitable | Nil | Nil | |
| IWQIs | PCs | Calibration Dataset Based on PCR | |||
| R2cal | RMSECal | Equationcal | Slopecal | ||
| IWQ | 6 | 0.85 *** | 0.178 | y = 0.8529x + 5.4691 | 0.8529 |
| Na% | 4 | 0.90 *** | 1.470 | y = 0.9016x + 3.1012 | 0.9016 |
| SAR | 3 | 0.98 *** | 0.037 | y = 0.9828x + 0.0176 | 0.9828 |
| PI | 4 | 0.88 *** | 2.956 | y = 0.8836x + 8.1029 | 0.8836 |
| KI | 3 | 0.91 *** | 0.031 | y = 0.905x + 0.0391 | 0.905 |
| RSC | 3 | 0.93 *** | 0.097 | y = 0.9323x − 0.0172 | 0.9323 |
| IWQIs | Calibration Dataset Based on SVMR | ||||
| R2cal | RMSECal | Equationcal | Slopecal | ||
| IWQ | 0.93 *** | 0.299 | y = 1.0371x − 1.4053 | 1.0371 | |
| Na% | 0.90 *** | 1.581 | y = 0.808x + 5.9624 | 0.8080 | |
| SAR | 0.98 *** | 0.038 | y = 0.9545x + 0.0437 | 0.9545 | |
| PI | 0.88 *** | 2.325 | y = 0.7728x + 15.705 | 0.7728 | |
| KI | 0.90 *** | 0.034 | y = 0.8062x + 0.0768 | 0.8062 | |
| RSC | 0.93 *** | 0.119 | y = 0.8306x − 0.0493 | 0.8306 | |
| Model No. | Calibration Models | Validation Models | |||
|---|---|---|---|---|---|
| Calibration Equations | R2cal | R2val | RMSEval | Slopeval | |
| IWQ | |||||
| 1 | IWQ = 38.919 − 0.005 × (TDS) | 0.71 *** | 0.66 *** | 0.29 | 0.85 |
| 2 | IWQ = 38.697 − 0.007 × (TDS) + 0.026 × (Ca2+) | 0.77 *** | 0.66 *** | 0.26 | 0.62 |
| Na% | |||||
| 1 | Na% = 23.023 + 0.286 × (Na+) | 0.43 ** | 0.72 *** | 2.68 | 0.74 |
| 2 | Na% = 23.66 + 0.361 × (Na+) − 0.107 × (Mg2+) | 0.51 *** | 0.79 *** | 2.30 | 0.74 |
| 3 | Na% = 32.339 + 0.722 × (Na+) − 0.423 × (Mg2+) − 0.43 × (Ca2+) | 0.88 *** | 0.92 *** | 1.71 | 0.79 |
| 4 | Na% = 31.391 + 0.718 × (Na+) − 0.452 × (Mg2+) − 0.452 × (Ca2+) + 0.361 × (K+) | 0.90 *** | 0.93 *** | 1.70 | 1.08 |
| SAR | |||||
| 1 | SAR = 0.285 + 0.025 × (Na+) | 0.90 *** | 0.95 *** | 0.07 | 0.93 |
| 2 | SAR = 0.303 + 0.027 × (Na+) − 0.003 × (Mg2+) | 0.91 *** | 0.97 *** | 0.06 | 0.93 |
| 3 | SAR = 0.528 + 0.036 × (Na+) − 0.011 × (Mg2+) − 0.011 × (Ca2+) | 0.98 *** | 0.99 *** | 0.04 | 1.04 |
| PI | |||||
| 1 | PI = 75.56 − 0.223 × (Mg2+) | 0.32 ** | 0.27 ** | 4.34 | 0.37 |
| 2 | PI = 85.973 − 0.341 × (Mg2+) − 0.285 × (Ca2+) | 0.57 *** | 0.27 * | 4.57 | 0.45 |
| 3 | PI = 88.65 2− 0.656 × (Mg2+) − 0.61 × (Ca2+) + 0.427 × (Na+) | 0.82 *** | 0.62 *** | 3.15 | 0.77 |
| 4 | PI = 86.711 − 0.822 × (Mg2+) − 0.802 × (Ca2+) + 0.419 × (Na+) + 0.074 × (Alkalinity) | 0.88 *** | 0.86 *** | 2.38 | 0.79 |
| KI | |||||
| 1 | KI = 0.226 + 0.006 × (Na+) | 0.44 ** | 0.73 *** | 0.06 | 0.62 |
| 2 | KI = 0.241 + 0.008 × (Na+) − 0.002 × (Mg2+) | 0.53 *** | 0.82 *** | 0.05 | 0.75 |
| 3 | KI = 0.426 + 0.016 × (Na+) − 0.009 × (Mg2+) − 0.009 × (Ca2+) | 0.90 *** | 0.95 *** | 0.04 | 1.14 |
| RSC | |||||
| 1 | RSC = 0.023 − 0.011 × (Mg2+) | 0.16 | 0.03 | 0.40 | 0.08 |
| 2 | RSC = −0.42 − 0.015 × (Mg2+) + 0.003 × (Alkalinity) | 0.26 * | 0.30 ** | 0.33 | 0.28 |
| 3 | RSC = −0.141 − 0.059 × (Mg2+) + 0.017 × (Alkalinity) − 0.057 × (Ca2+) | 0.93 *** | 0.91 *** | 0.13 | 0.99 |
Publisher’s Note: MDPI stays neutral with regard to jurisdictional claims in published maps and institutional affiliations. |
© 2020 by the authors. Licensee MDPI, Basel, Switzerland. This article is an open access article distributed under the terms and conditions of the Creative Commons Attribution (CC BY) license (http://creativecommons.org/licenses/by/4.0/).
Share and Cite
Elsayed, S.; Hussein, H.; Moghanm, F.S.; Khedher, K.M.; Eid, E.M.; Gad, M. Application of Irrigation Water Quality Indices and Multivariate Statistical Techniques for Surface Water Quality Assessments in the Northern Nile Delta, Egypt. Water 2020, 12, 3300. https://doi.org/10.3390/w12123300
Elsayed S, Hussein H, Moghanm FS, Khedher KM, Eid EM, Gad M. Application of Irrigation Water Quality Indices and Multivariate Statistical Techniques for Surface Water Quality Assessments in the Northern Nile Delta, Egypt. Water. 2020; 12(12):3300. https://doi.org/10.3390/w12123300
Chicago/Turabian StyleElsayed, Salah, Hend Hussein, Farahat S. Moghanm, Khaled M. Khedher, Ebrahem M. Eid, and Mohamed Gad. 2020. "Application of Irrigation Water Quality Indices and Multivariate Statistical Techniques for Surface Water Quality Assessments in the Northern Nile Delta, Egypt" Water 12, no. 12: 3300. https://doi.org/10.3390/w12123300
APA StyleElsayed, S., Hussein, H., Moghanm, F. S., Khedher, K. M., Eid, E. M., & Gad, M. (2020). Application of Irrigation Water Quality Indices and Multivariate Statistical Techniques for Surface Water Quality Assessments in the Northern Nile Delta, Egypt. Water, 12(12), 3300. https://doi.org/10.3390/w12123300