Article

Removal of Polycyclic Aromatic Hydrocarbons (PAHs) from Produced Water by Ferrate (VI) Oxidation

by
Tahir Haneef
1,
Muhammad Raza Ul Mustafa
1,2,*,
Khamaruzaman Wan Yusof
1,
Mohamed Hasnain Isa
3,
Mohammed J.K. Bashir
4,
Mushtaq Ahmad
5 and
Muhammad Zafar
5
1
Department of Civil and Environmental Engineering, Universiti Teknologi PETRONAS, Seri Iskandar 32610, Perak, Malaysia
2
Centre for Urban Resource Sustainability, Institute of Self-Sustainable Building, Universiti Teknologi PETRONAS, Seri Iskandar 32610, Perak, Malaysia
3
Civil Engineering Programme, Faculty of Engineering, Universiti Teknologi Brunei, Tungku Highway, Gadong BE1410, Brunei
4
Department of Environmental Engineering, Faculty of Engineering and Green Technology (FEGT), Universiti Tunku Abdul Rahman, Kampar 31900, Perak, Malaysia
5
Department of Plant Sciences, Quaid-i-Azam University, Islamabad 45320, Pakistan
*
Author to whom correspondence should be addressed.
Water 2020, 12(11), 3132; https://doi.org/10.3390/w12113132
Submission received: 5 August 2020 / Revised: 16 September 2020 / Accepted: 21 September 2020 / Published: 9 November 2020
(This article belongs to the Special Issue Wastewater Treatment: Current and Future Techniques)

Abstract

:
Polycyclic aromatic hydrocarbons (PAHs) are mutagenic and carcinogenic contaminants made up of fused benzene rings. Their presence has been reported in several wastewater streams, including produced water (PW), which is the wastewater obtained during oil and gas extraction from onshore or offshore installations. In this study, ferrate (VI) oxidation was used for the first time for the treatment of 15 PAHs, with the total concentration of 1249.11 μg/L in the produced water sample. The operating parameters viz., ferrate (VI) dosage, pH, and contact time were optimized for maximum removal of PAHs and chemical oxygen demand (COD). Central composite design (CCD) based on response surface methodology (RSM) was used for optimization and modeling to evaluate the optimal values of operating parameters. PAH and COD removal percentages were selected as the dependent variables. The study showed that 89.73% of PAHs and 73.41% of COD were removed from PW at the optimal conditions of independent variables, i.e., ferrate (VI) concentration (19.35 mg/L), pH (7.1), and contact time (68.34 min). The high values of the coefficient of determination (R2) for PAH (96.50%) and COD (98.05%) removals show the accuracy and the suitability of the models. The results showed that ferrate (VI) oxidation was an efficient treatment method for the successful removal of PAHs and COD from PW. The study also revealed that RSM is an effective tool for the optimization of operating variables, which could significantly help to reduce the time and cost of experimentation.

1. Introduction

Polycyclic aromatic hydrocarbons (PAHs) are hazardous organic micropollutants that are colorless or pale-yellow and widely present in the ecosystem. Chemically, these micropollutants consist of two or more fused benzene rings [1]. All PAHs, both low and high molecular weight, are stable and resistant to biodegradation [2]. These compounds are generated by both anthropogenic (industrial discharge, waste incineration, and biomass burning) and natural sources (natural oil seeps, forest fires, and volcanic eruptions). PAHs can cause cancer (i.e., lung, bladder, and skin cancer) in human beings and also severe health problems in aquatic life by inhalation and ingestion even in very low concentrations (ng/L–μg/L) [1,3]. The United States Environmental Protection Agency (USEPA) has categorized 16 PAHs as priority micropollutants because of their mutagenic and carcinogenic effects [4]. Produced water (PW) is also one of the largest anthropogenic sources that contains a considerable amount of PAHs [2,5]. PW is a byproduct of oil and gas industries, which is generated during the oil and gas extraction process. Many studies have confirmed that acute and chronic toxicity of PW is mainly because of PAHs, phenols, and high amounts of COD [6]. Globally, the production of PW increases day by day, and its production has been reported to have reached up to 250 million barrels per day [7]. Moreover, almost 40% of PW is directly discharged into water bodies without any treatment [6]. The direct discharge of untreated PW into the environment contaminates surface and groundwater. Several treatment methods, such as volatilization, combined microfiltration and biological processes, chlorination, biochar adsorption, ozonation, electrodialysis, reverse osmosis, electrocoagulation, ion exchange, membrane-based technology, and conventional phase separation, have been employed for the treatment of PW [8,9]. Although more than 90% of organic pollutants removal from PW was attained by electrocoagulation, it is not cost-effective, produces a large amount of sludge, and consumes more energy [10]. Membrane-based technologies are efficient for PW treatment; however, these technologies have several problems such as membrane fouling, high energy consumption, and the lack of potential to degrade refractory organic pollutants [11]. Combined microfiltration and biological process reported almost 65% of COD removal from oilfield wastewater; however, it is also a time-consuming process [12]. More than 50% removal of total dissolved solids from PW was obtained by electrodialysis, but it utilized a large amount of energy to accomplish the treatment [13]. Constructed wetland is an efficient method for organic matter removal from PW, but its maintenance cost is very high [14]. Moreover, most of the techniques are very expensive. In many cases, they just transfer organic pollutants from one phase to another and cannot remove dissolved organic contaminants from PW. Some of the available technologies produce toxic byproducts that limit their practical use [15]. Therefore, it is imperative to explore economic and ecotechnological solutions for PAH reduction from PW.
Different materials/chemicals such as zeolites, metal oxides, and nanoparticles have been applied for the remediation of contaminants from water and wastewater [16]. In recent years, ferrate (VI) (Fe (VI)) with high valent iron (VI) has gained attention due to its high oxidation/reduction potential [17,18,19]. The Fe (VI) oxidation method is a promising technique due to its environment-friendly nature, low cost, and high efficiency for organic pollutant removal [20]. Surprisingly, Fe (VI) acts as a coagulant, disinfectant, and oxidizer at the same time. Fe (VI) is considered as one of the most efficient oxidants for the treatment of wastewater due to its strong oxidizing power [3]. The redox potential of the Fe (VI) ion in both acidic and neutral environments is higher than many other oxidizing agents, as shown in Table 1, making it a favorable oxidant for the treatment of wastewater [21]. In an acidic environment, Fe (VI)’s electrode potential is 2.20 V, and, in an alkaline medium, it is 0.72 V. However, the Fe (VI) cations’ structure can be modified by adjusting the pH value to control the oxidation activity, so as to achieve high selectivity [22]. Fe (VI) is a robust multifunctional oxidizer with a tetrahedral structure (FeO42−). Fe (VI) is converted into Fe3+ and Fe(OH)3 during disinfection and oxidation processes and acts as coagulant and oxidizer, as shown in Equations (1) and (2). Fe (VI) produces molecular oxygen during spontaneous oxidation, as shown in Equation (3) [23]. The reactivity of Fe (VI) with refractory organic and inorganic pollutants shows its usefulness for the removal of pollutants from industrial effluents [19,21].
FeO42− + 8H+ + 3e → Fe3+ + 4H2O
FeO42− + 4H2O + 3e → Fe(OH)3 + 5OH
2FeO42− + 5H2O → 2Fe3+ + 3/2O2 + 10OH
Response surface methodology (RSM) using Design-Expert software is a powerful statistical and mathematical tool that is commonly used for the systematic design and analysis of experiments. It provides optimization and validation of a system based on its statistical modeling. RSM is far better than the conventional one-factor-at-a-time optimization technique because it helps to reduce the vast amount of laboratory experimental work. Traditional methods are complicated, time-consuming, and expensive for multivariable experiments [24]. Moreover, the influence of multiple variables on responses during the optimization process can be studied in RSM [25]. It also addresses the interaction between different independent variables and can be practiced in multivariable analyses for the optimization of functional variables [24].
Various researchers have studied the application of Fe (VI) for remediation of different organic pollutants in several types of wastewater, such as municipal wastewater secondary effluent [18], oil sands process-affected water [26], fracturing wastewater [27], dyeing effluent [28], textile wastewater [29], coking wastewater [30], and tannery wastewater [31]. In addition, a few studies have explored the potential of Fe (VI) for the removal of just one or two PAHs from synthetic wastewater rather than from real wastewater, especially PW [22,30,32]. Guan et al. [22] investigated the separate removal of only three PAHs, i.e., phenanthrene, pyrene and naphthalene, from synthetic water using Fe (VI) oxidation. Li et al. [30] studied the potential of Fe (VI) for the removal of just one PAH (phenanthrene) in coking wastewater. Similarly, Tan et al. [32] evaluated the potential of Fe (VI) just for one PAH, i.e., phenanthrene removal in synthetic wastewater. Each PAH has different characteristics based on its number of benzene rings; each PAH may react differently against Fe (VI) oxidation. More studies are required to investigate the potential of Fe (VI) for combination of PAHs, especially priority PAHs in aqueous media, so that consistent performance is achieved. It appears from literature that, so far, no study has explored the application of Fe (VI) oxidation for 15 PAHs and COD removal from PW. Secondly, integrated optimization of 15 PAHs and COD removal using RSM is also yet to be explored. Therefore, understanding of the performance of Fe (VI) for combined PAH removal is important to fill the gap in the previous studies. The objectives of this study are (i) to evaluate the potential of Fe (VI) for PAHs and COD removal from PW and (ii) to optimize the independent parameters viz., Fe (VI) concentration, pH, and contact time using RSM.

2. Experimental Work

2.1. Materials/Chemicals

All chemicals used in this work were analytical grade and were utilized without purification. H2SO4 (95–98%) and NaOH (30% w/v) were purchased from R&M Chemicals Malaysia. Commercially available potassium Fe (VI) was purchased from NANO IRON (Židlochovice, Czech Republic) and utilized as received. Syringe filters (25 mm dia, cat. no. 6874–2504) by Whatman U.S.A. were used. PW samples were collected from an oil and gas exploration site in the South East Asia region and stored in cold storage at 4 °C in compliance with the standard protocol of the American Public Health Association (APHA) [33].

2.2. Fe(VI) Oxidation and GC-MS Analysis

For the oxidation process, a 500 mL glass beaker was used as a reactor. Aluminum foil was used to cover the reactor for shielding the water sample from light. The pH of PW was 8.2, and it was adjusted according to experimental requirements during the oxidation process using 1 M solutions of NaOH and H2SO4. The temperature and magnetic stirrer speed during the oxidation process were kept constant at 25 °C and 250 rpm, respectively. The reactor was positioned on a hot/magnetic plate, and a magnetic stirrer inside the reactor was used to blend reagent homogeneously in PW. The oxidation process was initiated by adding a measured quantity of Fe (VI) into the water sample. The oxidation process was performed for different contact times, varying from 10–120 min. The reaction was stopped after a pre-decided contact time by increasing the pH of the solution up to pH 12.0 with the help of a 1 M NaOH solution. The treated water sample was filtered using WhatmanTM filter paper. The filtered PW samples were utilized for COD and PAH analysis using HACH vial and gas chromatography–mass spectrometry (GC–MS), respectively. All the experiments were performed in triplicate, and average values were taken.
Polycyclic aromatic hydrocarbons in untreated and treated PW samples were quantified using GC–MS analysis. Liquid–liquid extraction (LLE) was performed before the GC–MS analysis to concentrate the PAHs present in PW samples. The USEPA 3510C LLE technique, with some modifications, was employed for PAH extraction. Methylene chloride (DCM) was used as a solvent extractor for PAH extraction in LLE. After the LLE, the samples were re-concentrated by a rotary evaporator. In the rotary evaporator, the pressure of the condenser was set at 789 bar, and bath temperature was held at 40 °C. The rotation of the receiving flask was set at 30 rpm. Then, a water sample was taken in the receiving flask and evaporated until the volume of the sample reached 1.0 to 0.5 mL. After that, the water sample was transferred into a GC–MS vial (1.5 mL) for GC–MS analysis. In GC–MS, a column of 30 m (Elite 5MS) with 0.25 mm inner diameter (ø) and 0.25 μm film thickness was used, while helium (He) gas was utilized as a transporter gas. The column temperature was raised from 60 to 175 °C (at 6 °C/min) and then raised up to 240 °C (at 3 °C/min) and then finally held at 300 °C for 7 min. Injector and transition line temperatures were 280 and 300 °C, respectively [34]. For PAH quantification, a standard solution with 16 PAHs (2000 mg/L concentration) was utilized. Equations (4) and (5) were applied to calculate percentage removal of COD and PAHs, respectively.
X   =   D i D f D i   ×   100  
where X shows the percentage of COD removal; Di and Df represent the concentration of COD before and after treatment, respectively.
Z   =   P i P f P i   ×   100
where Z represents the percentage of PAHs removal; Pi and Pf show the concentration of PAHs before and after treatment, respectively.

2.3. Development of Experimental Design Using RSM

Response surface methodology (RSM) is an efficient statistical and mathematical tool that is usually used for developing experimental designs. It optimizes the operating parameters and predicts the responses based on polynomial quadratic models. Furthermore, it also validates the interaction between independent and dependent variables. The entire process consists of four stages, i.e., (i) the experiment layout, (ii) the response selection by conducting experiments, (iii) the design of an RSM numerical model, and (iv) developed model testing for validation and optimization [35]. In RSM, the most effective and widely applied method for the development of experimental design is the central composite design (CCD) method [25]. This method helps to reduce the number of experiments and evaluate the interaction between the variables. The selection of data points in a two-level factorial design (i.e., CCD) includes minimum (−1), maximum (+1), and middle (0) points for all parameters [24]. A quadratic model (Equation (6)) developed by CCD is applied for response estimation [25].
Y =   β 0 +   β i x i +   β i i x i 2 +   β i j x i   x j
where Y indicates the responses (i.e., COD/PAHs removal); β0, βi, βii, and βij stand for the constant-coefficients, i.e., linear coefficients, quadratic coefficient, and interaction coefficient, respectively; xi and xj are independent parameters. The defined independent variables, with their codes and levels (low, medium, and high), are presented in Table 2. The values for the three independent parameters were carefully chosen by conducting preliminary tests after a comprehensive literature review [7,36,37].
The experimental design was developed using Design-Expert software (version 11). In CCD design, k, 2k, 2k, and n stand for the number of independent factors, the number of factorial experiments, the number of axial point experiments, and the number of center point experiments, respectively. The total number of tests can be determined using the formula (2k + 2k + n) [38]. Thus, a total of 20 experimental runs were designed by CCD based on three independent variables (k = 3), including 8 factorial point experiments, 6 axial point experiments, and 6 central point experiments (Table 3).

3. Results and Discussion

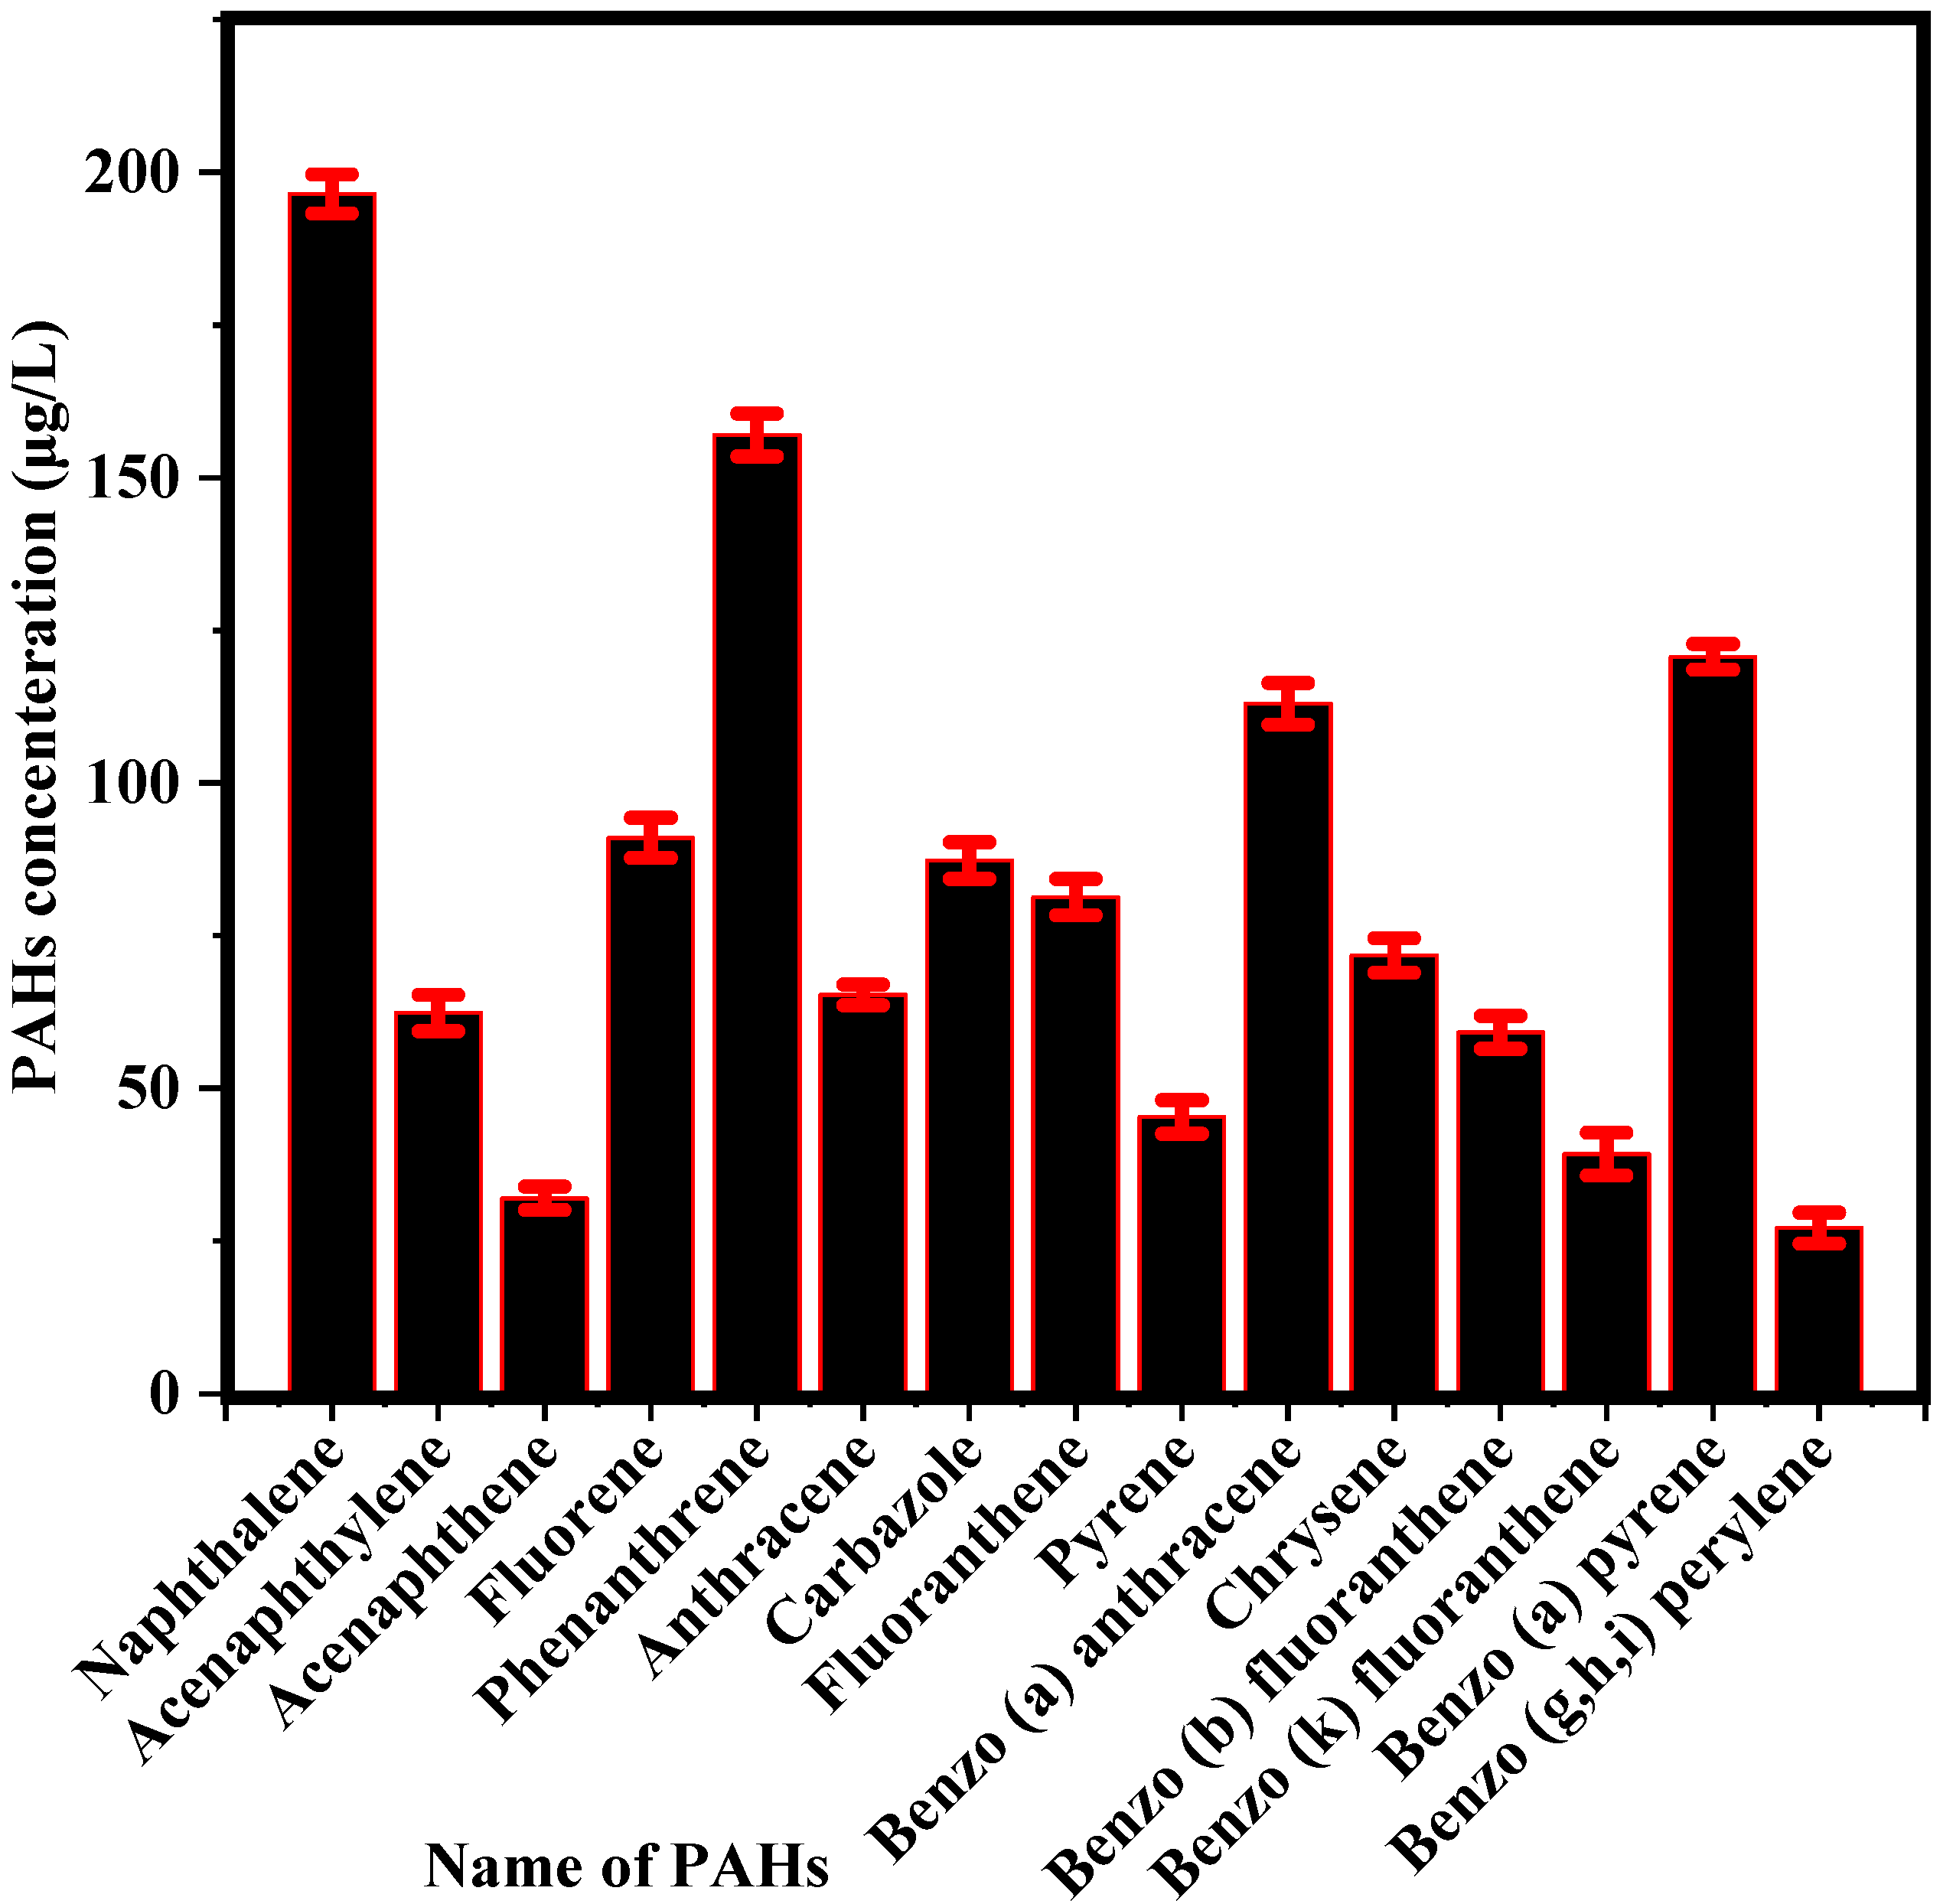
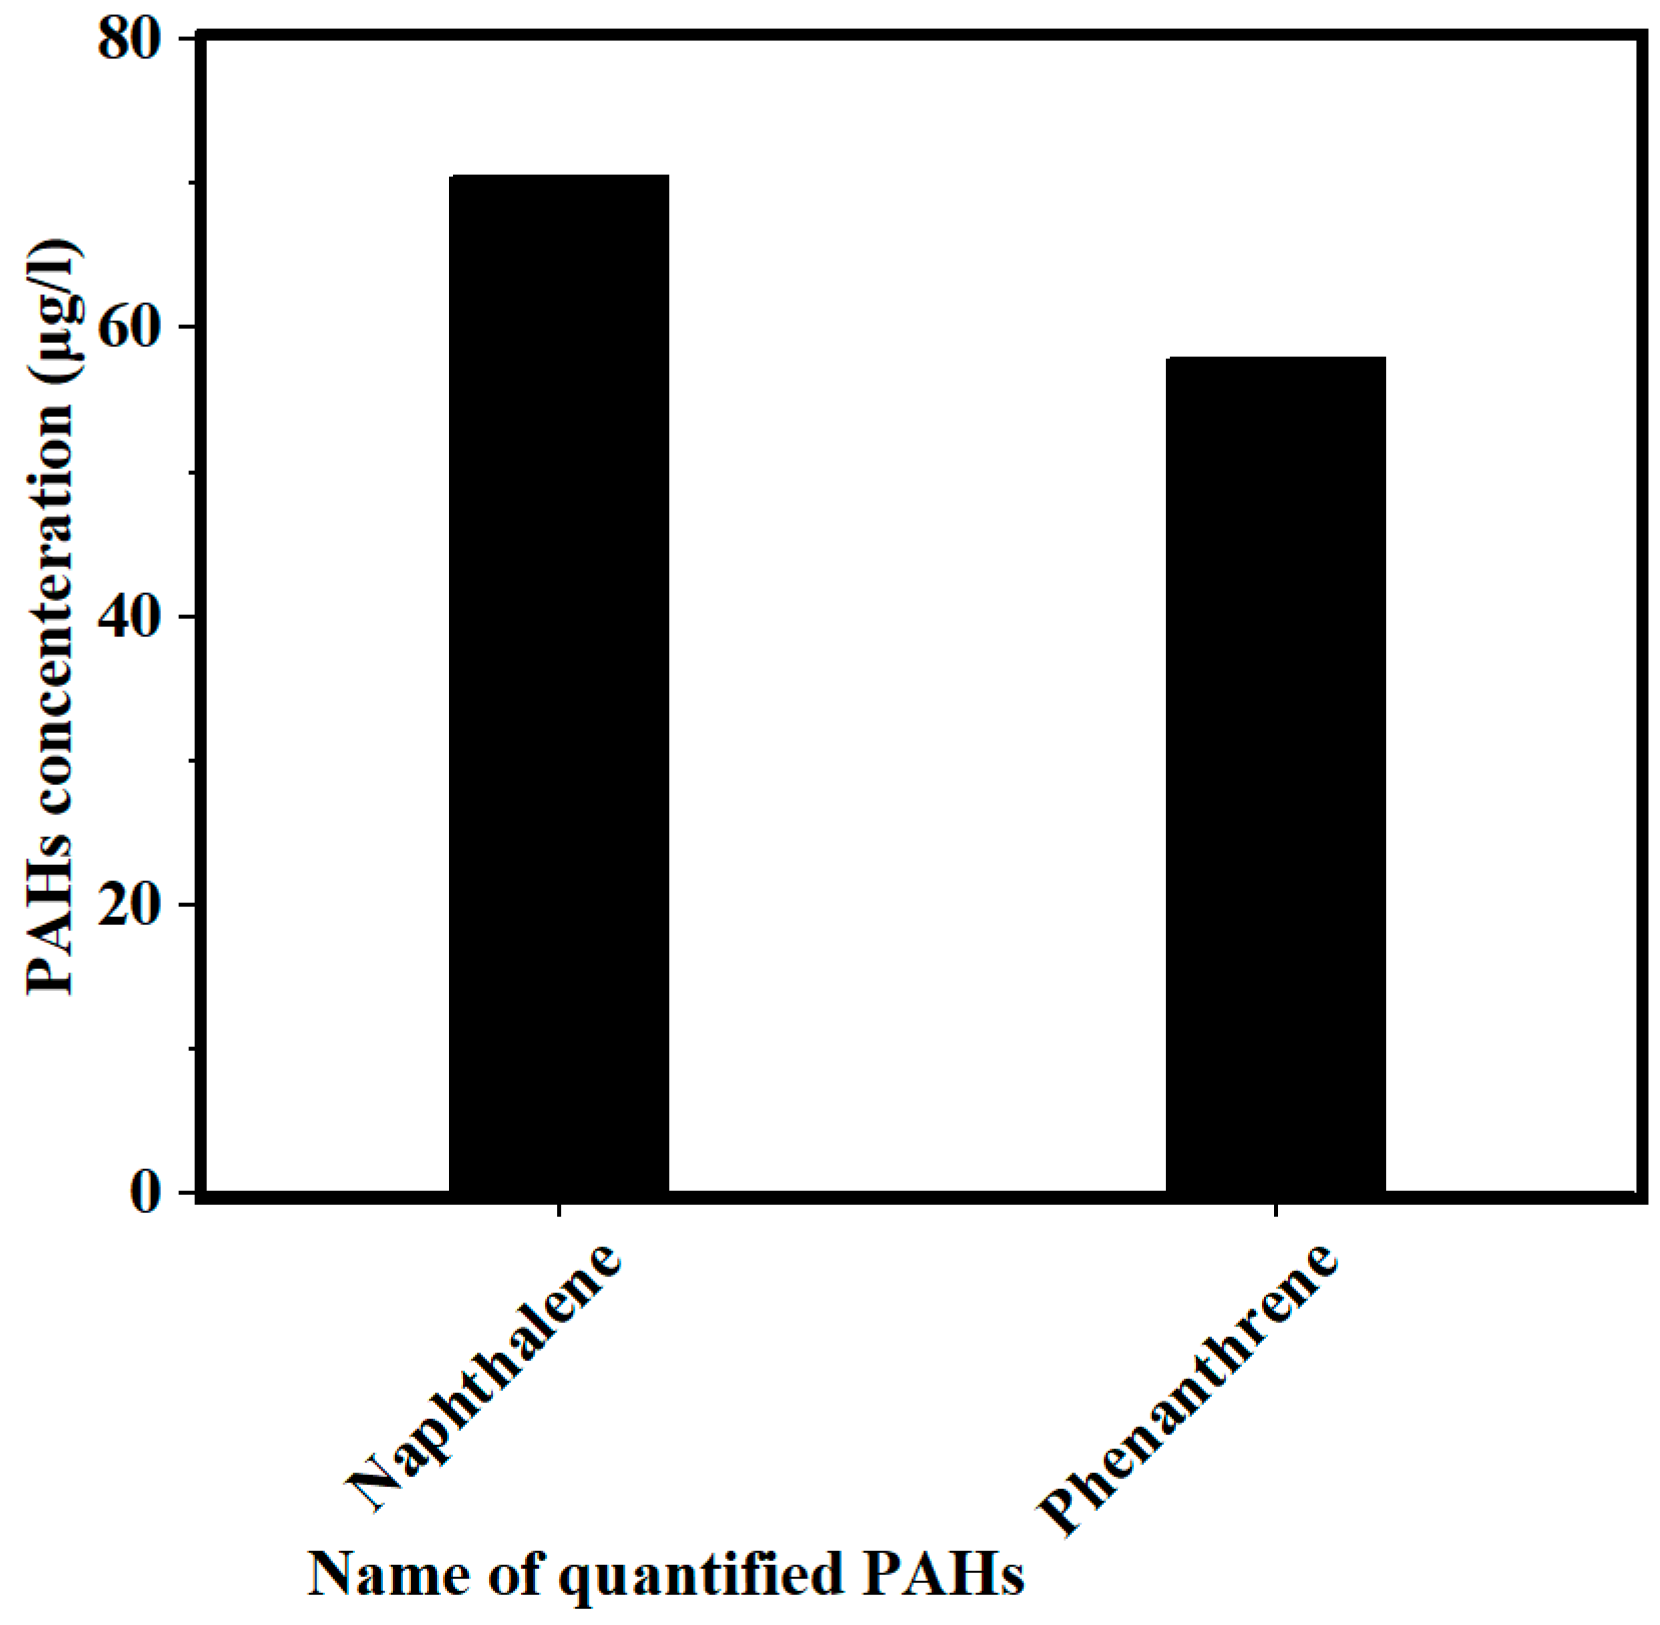
3.1. Concentration of PAHs and COD in PW

In PW, 15 PAHs were quantified via GC–MS analysis, with a total concentration of PAHs (ΣPAHs) of 1249.11 μg/L, as shown in Figure 1. It was noticed that the concentration of naphthalene (196.46 μg/L) was higher than the other PAH concentrations in PW, while benzo (g, h, i) perylene concentration (27.15 μg/L) was the lowest. Fluorene and carbazole were both 90.00 μg/L. In addition, the concentration of COD in PW was found to be 2213 mg/L. The high concentrations of COD and PAHs in PW indicate that PW contains a high amount of organic pollutants that needed to be removed before discharging PW into the environment.

3.2. Screening Batch Experiments

The screening experiments were conducted to study the impact of the three independent parameters: the concentration of Fe (VI) (A), pH (B), and contact time (C) on COD removal. Different ranges of these variables were examined for the oxidation process, as shown in Figure 2.
As shown in Figure 2a, various pH values were tested in the range of 3.0 to 10.0 at constant Fe (VI) concentration (20 mg/L) and contact time (60 min) for the removal of COD. Maximum COD reduction (68.0%) was obtained at pH 8.0. A rising trend of COD removal was observed from 35.3% to 68.0%, with an increase in pH value from 3.0−8.0. Moreover, a sudden decline in COD removal was noted as the pH value was increased beyond 8.0. It may have happened due to the generation of reactive byproducts at the higher pH, which adversely affected the COD removal and also affected the stability and oxidation potential of ferrate ions [39]. Subsequently, the COD removal reached 50.4% at pH 10.0. Moreover, after observing the effect of pH on COD removal, the pH range of 5.0 to 10.0 was chosen for further comprehensive analysis of PAHs and COD removal via RSM optimization.
Figure 2b shows the effect of different Fe (VI) concentrations (1 to 35 mg/L) at constant pH (8.0) and contact time (60 min) on COD removal. The highest COD reduction (70.2%) was attained at 25 mg/L of Fe (VI) concentration. An increasing trend of COD removal was observed from 29.0% to 70.2% with an increase in the concentration of Fe (VI) from 1 to 25 mg/L. However, a sudden decline in COD removal efficiency was noticed as the concentration of Fe (VI) was increased beyond 25 mg/L. It appeared that as the concentration of Fe (VI) was increased, more Fe3+ ions were generated, which may have raised Fe (VI) decomposition instead of organic pollutant decomposition and adversely affected the COD removal [40]. Subsequently, the COD removal at 35 mg/L of Fe (VI) concentration was reduced to 49.9%. After examining the impact of Fe (VI) concentration on COD removal, the Fe (VI) concentration range of 10 to 30 mg/L was selected for the optimization process.
As presented in Figure 2c, different contact times from 10 to 120 min were used for COD removal at constant pH (8.0) and Fe (VI) concentration (25 mg/L). The peak removal of COD (70.9%) was achieved at 50 min of contact time. A rising trend for COD removal was noticed from 38.0% to 70.9% with an increase of contact time from 10 to 50 min. COD removal remained constant, and no further change was observed after the contact time of 50 min. Thus, the contact time range of 10 to 90 min was adopted for optimization analysis using RSM.
The ranges of independent variables obtained via preliminary experiments were used for RSM optimization. The values of these three independent variables were used as minimum and maximum in the Design-Expert software (CCD/RSM) for both PAHs and COD removal. PAHs are organic compounds that are also part of COD, so the same values (ranges) of independent variables attained from the screening test can also be used for the optimization study of PAHs and COD via CCD.

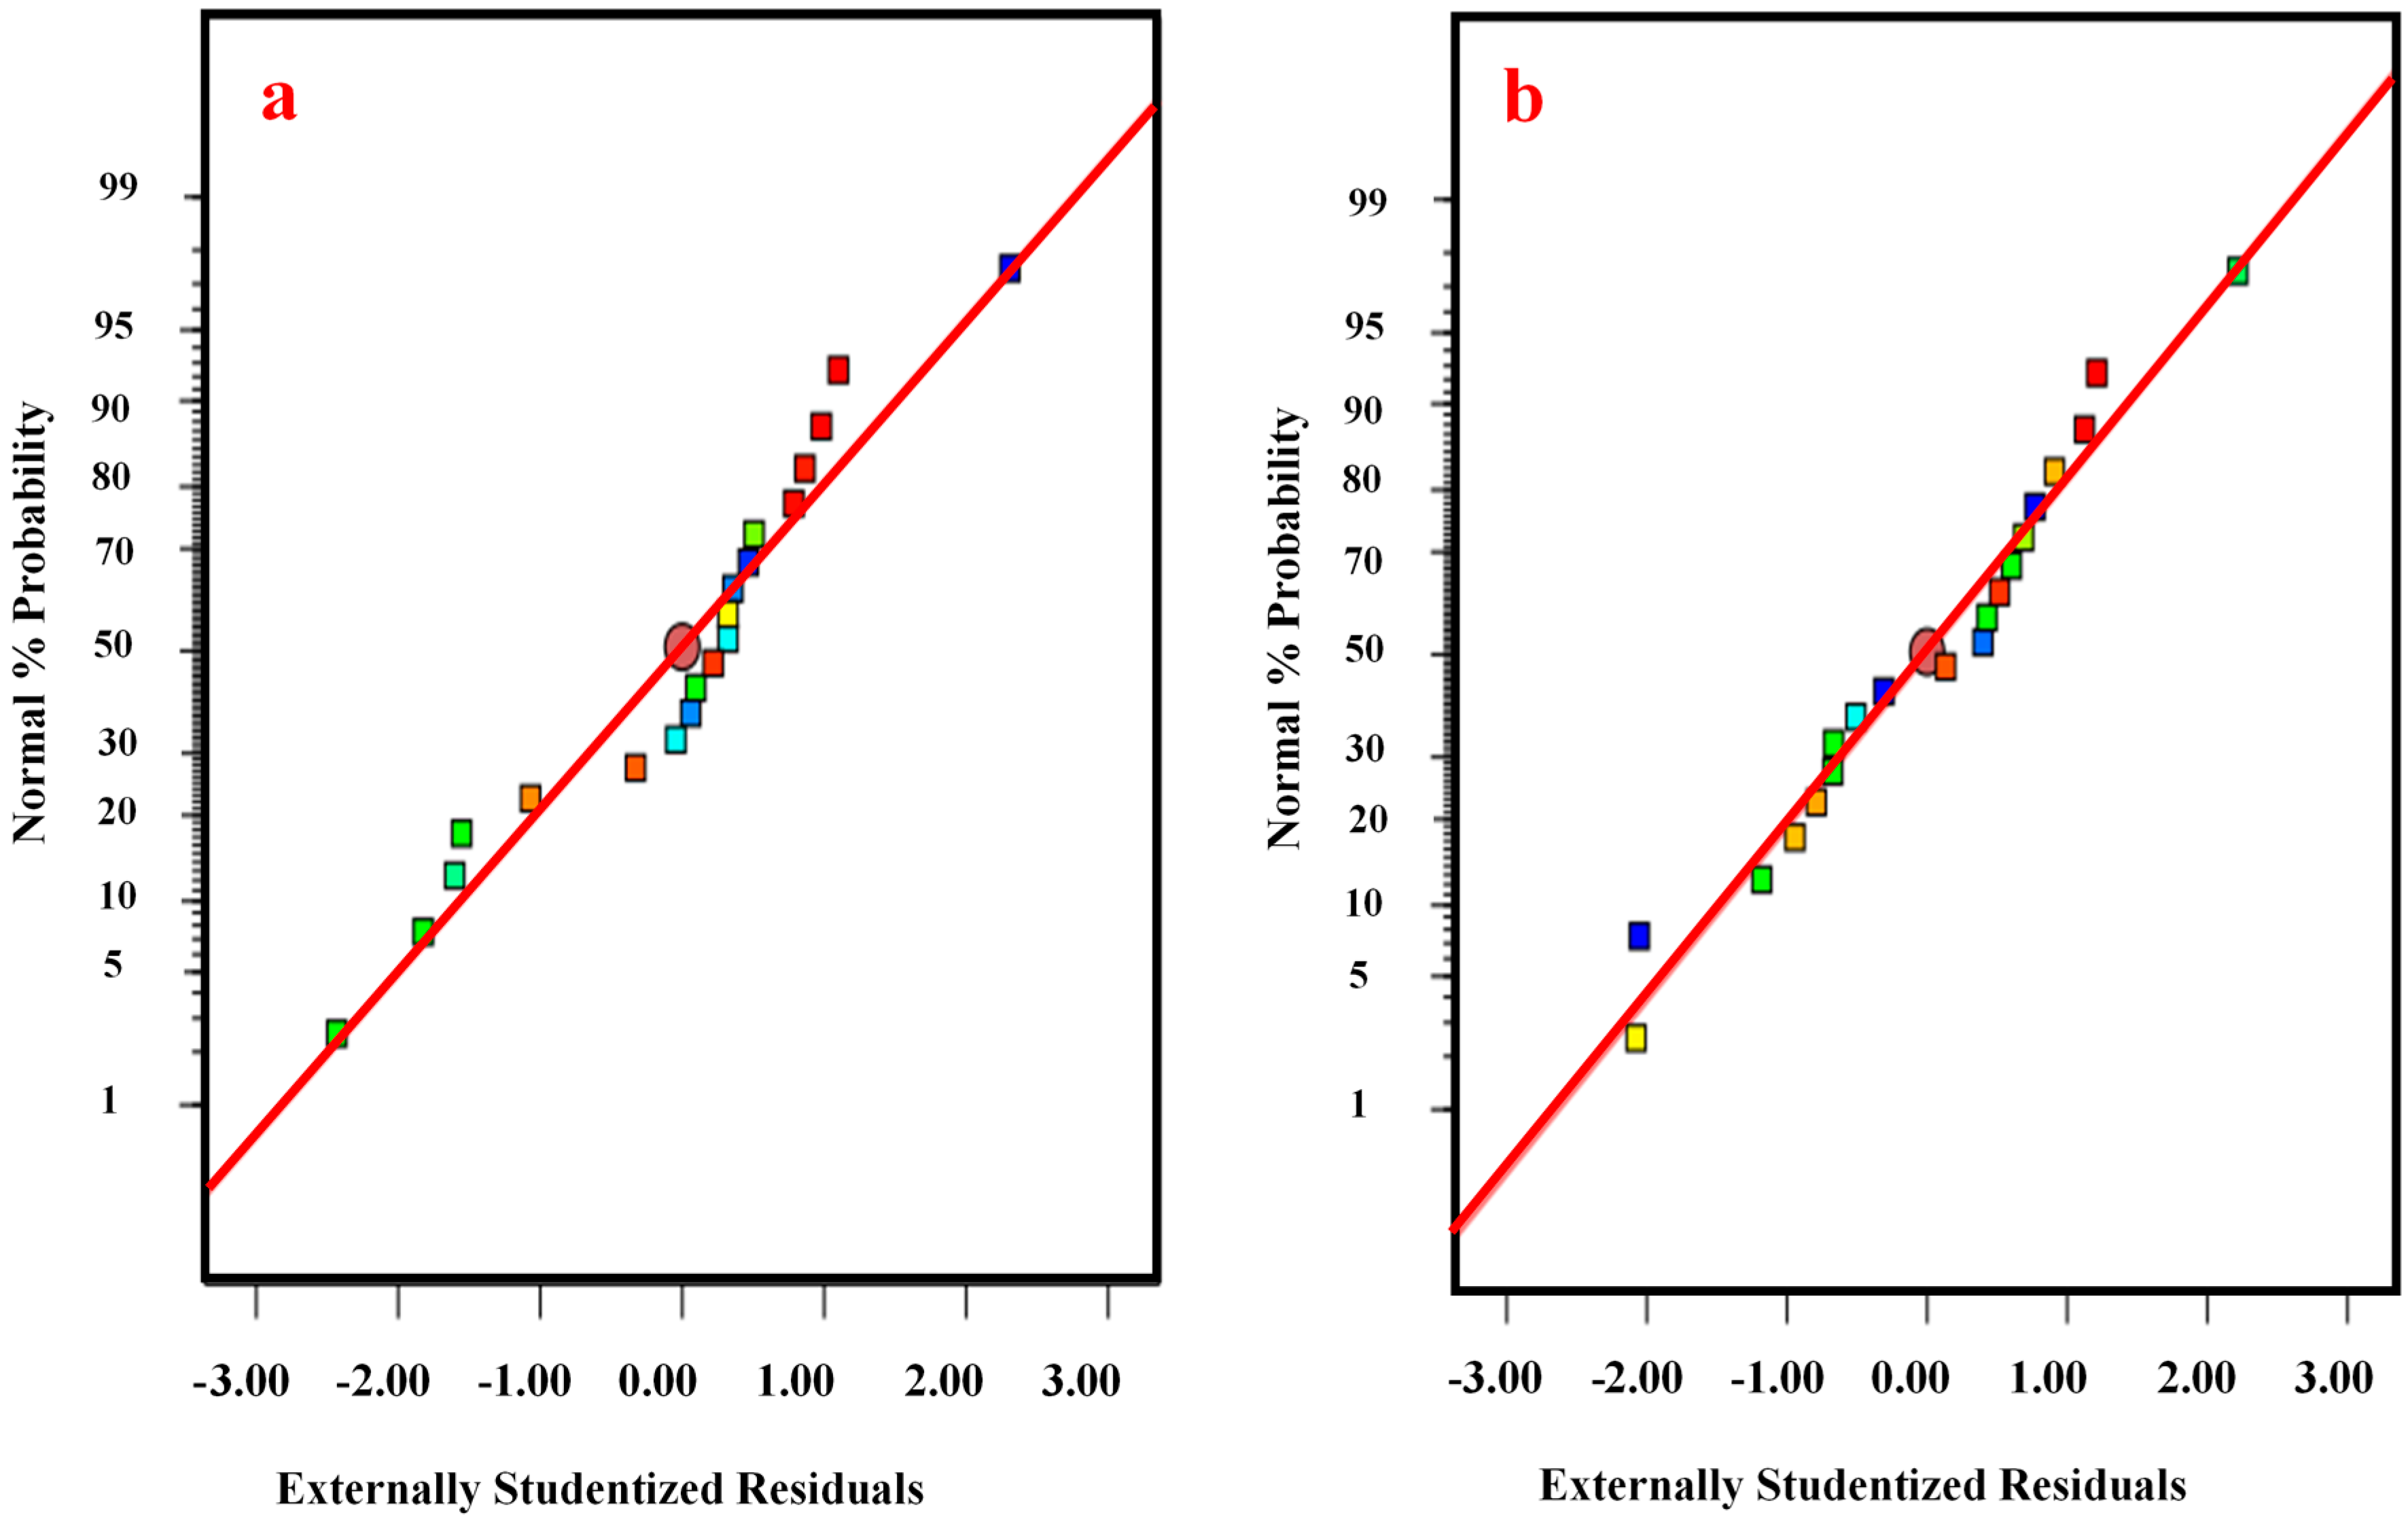
3.3. Analysis of Variance (ANOVA)

Analysis of variance (ANOVA) results obtained from CCD based on a second-order model (Equation (6)) were used to evaluate the adequacy and significance of the models, as shown in Table 4 and Table 5. The significance of the models was determined based on p-values and F-values of coefficient terms. From Table 4, it can be noticed that the F-value and p-value of the model for COD removal were 55.95 and 0.001, respectively, which indicated that the model was significant and could be utilized for COD removal optimization. Model terms, Fe (VI) concentration (A), pH (B), contact time (C), the two-level interaction of Fe (VI) concentration and pH (A × B), pH and contact time (B × C), and the quadratic effect of Fe (VI) concentration (A2), pH (B2), and contact time (C2) were significant. The lack of fit of the model was nonsignificant with a 0.211 p-value. In addition, the adequacy of a model can be verified by R-squared values (R2). The high value of R2 (98.05%) implied that the model could not describe only 1.95% of the overall sample variation. The value of adjusted R2 (96.30%) was also high, which illustrated that the model represented the system well. The high value of predicted R2 (89.23%) indicated that the current model was able to predict appropriate responses for new observations.
The F-value and p-value of the PAH model were 30.93 and less than 0.001, respectively, as shown in Table 5. These values showed that the model was significant and can be utilized for PAH removal optimization. Model terms, Fe (VI) concentration (A), pH (B), contact time (C), the two-level interaction of Fe (VI) concentration and pH (A × B), Fe(VI) concentration and contact time (A × C), and the quadratic effect of Fe (VI) concentration (A2), pH (B2), and contact time (C2) were significant. The lack of fit of the model was nonsignificant, with a 0.666 p-value. Moreover, the adequacy of the model can be evaluated by R squared (R2) values. The high value of R2 (96.53%) suggested that the model could not describe only 3.47% of the overall sample variation. The value of adjusted R2 (93.41%) was also high, which demonstrated the suitability of the model to describe the system. The high value of predicted R2 (79.72%) indicated that the model can predict appropriate responses for new observations. The quadratic models for COD and PAH removal are shown in Equations (7) and (8).
Y1 = 68.26 + 2.45A−2.60B + 5.26C + 2.37AB−2.00AC−3.00BC−15.33A2−11.28B2−5.58C2
Y2 = 89.54−3.33A−3.98B + 5.53C−3.76AB−4.34AC + 0.03BC−10.37A2−16.22B2−7.17C2
where Y1 and Y2 are the removal of COD and PAHs, respectively; A, B, and C show the concentration of Fe (VI), pH, and contact time, respectively. The predicted (attained from Equations (7) and (8)) and experimental responses are presented in Table 6. It revealed that the proposed polynomial quadratic models were appropriate for the prediction of responses and showed a remarkably good agreement between the results.
The COD and PAH removal predicted by the polynomial quadratic models agreed well with the experimental values. Furthermore, the distribution of all data points was close to the 45° straight line, as shown in Figure 3. These graphs showed a satisfactory agreement between experimental and predicted values. The model adequacy was also determined by the normal plot of residuals from the least square fit. The assumption of normality was checked by creating a plot between normal percentage of probability and studentized residuals, which was found to be satisfactory for COD and PAH removal efficiencies, as shown in Figure 4. All the data points in the graphs of residuals were approximately along the straight line, which is an indication of normal distribution.

3.4. Response Surface and Contour Plots

Three-dimensional (3D) surface and contour plots of the quadratic models obtained from Equations (7) and (8) were used for the graphical representation of independent variables’ impact on COD and PAH removal. These plots also showed the interaction among independent variables, as illustrated in Figure 5, Figure 6 and Figure 7. In these graphs, two independent variables were continually varied for the responses, and the remaining variable was fixed. Correlations between the independent parameters were significant, so the peaks of the response surface plots were prominent, as shown in Figure 5, Figure 6 and Figure 7. All response plots had noticeable peaks, which implied that all the variables in the design space were given optimum conditions for the highest response.

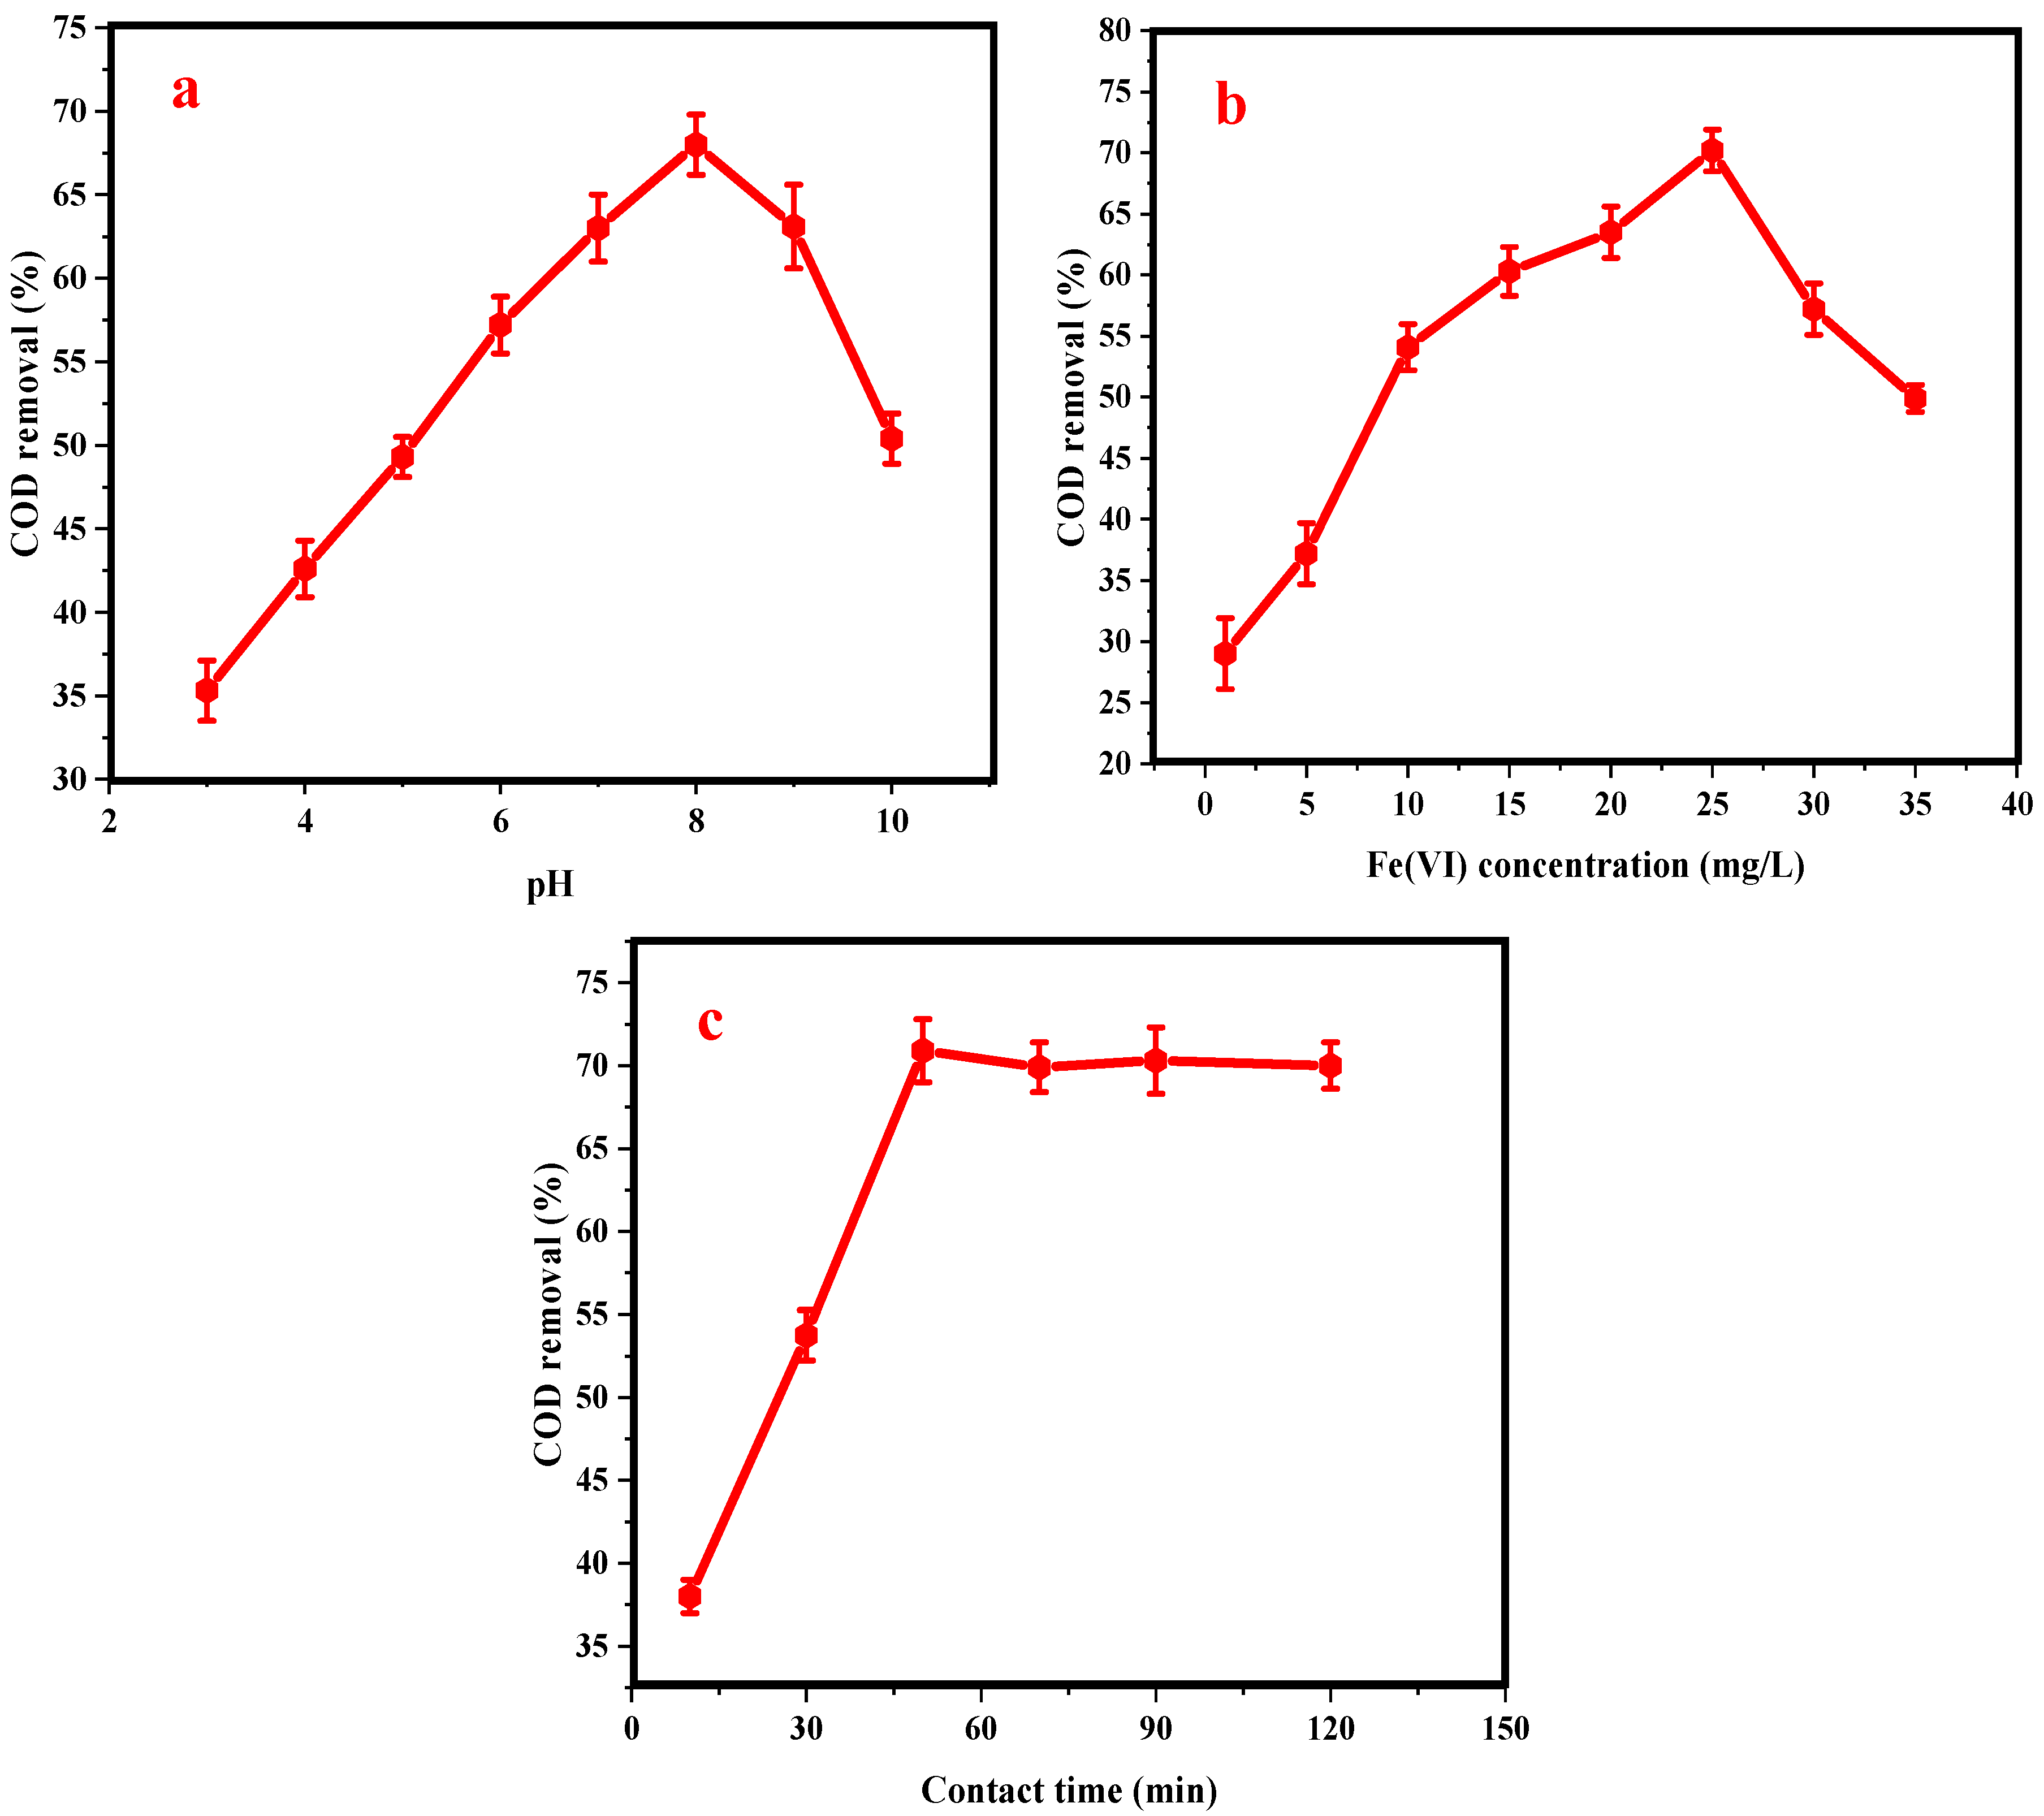
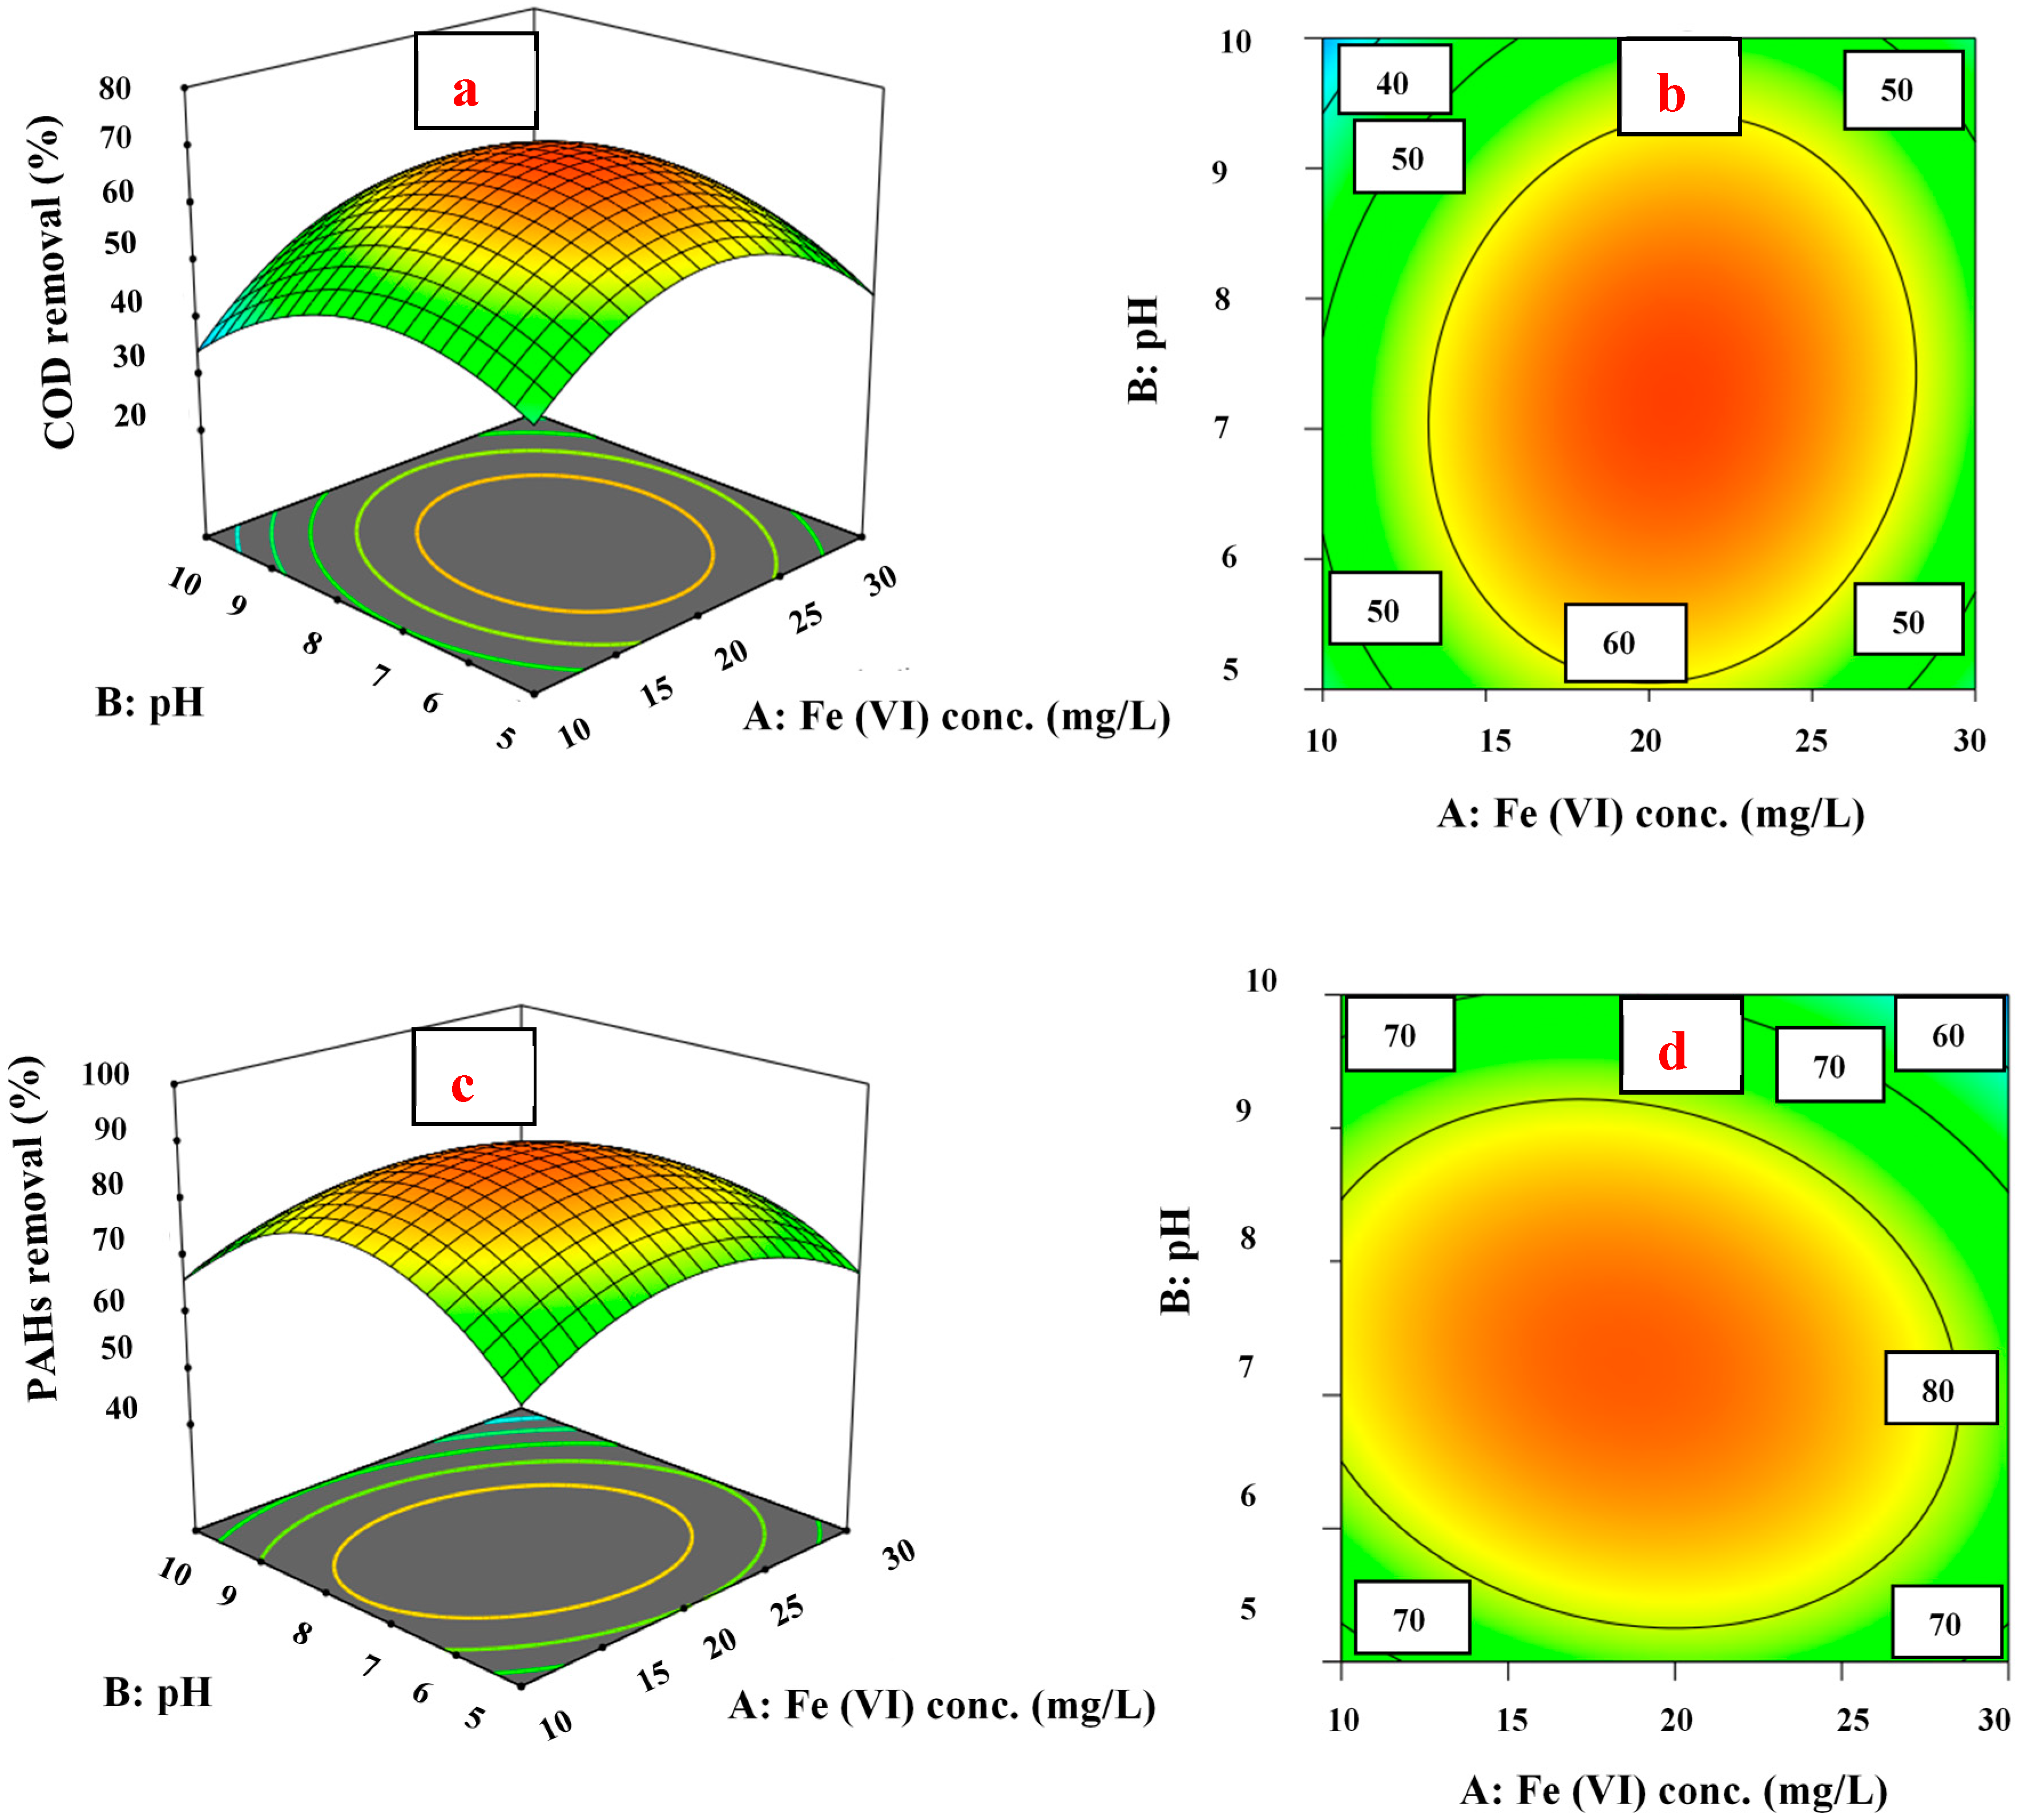
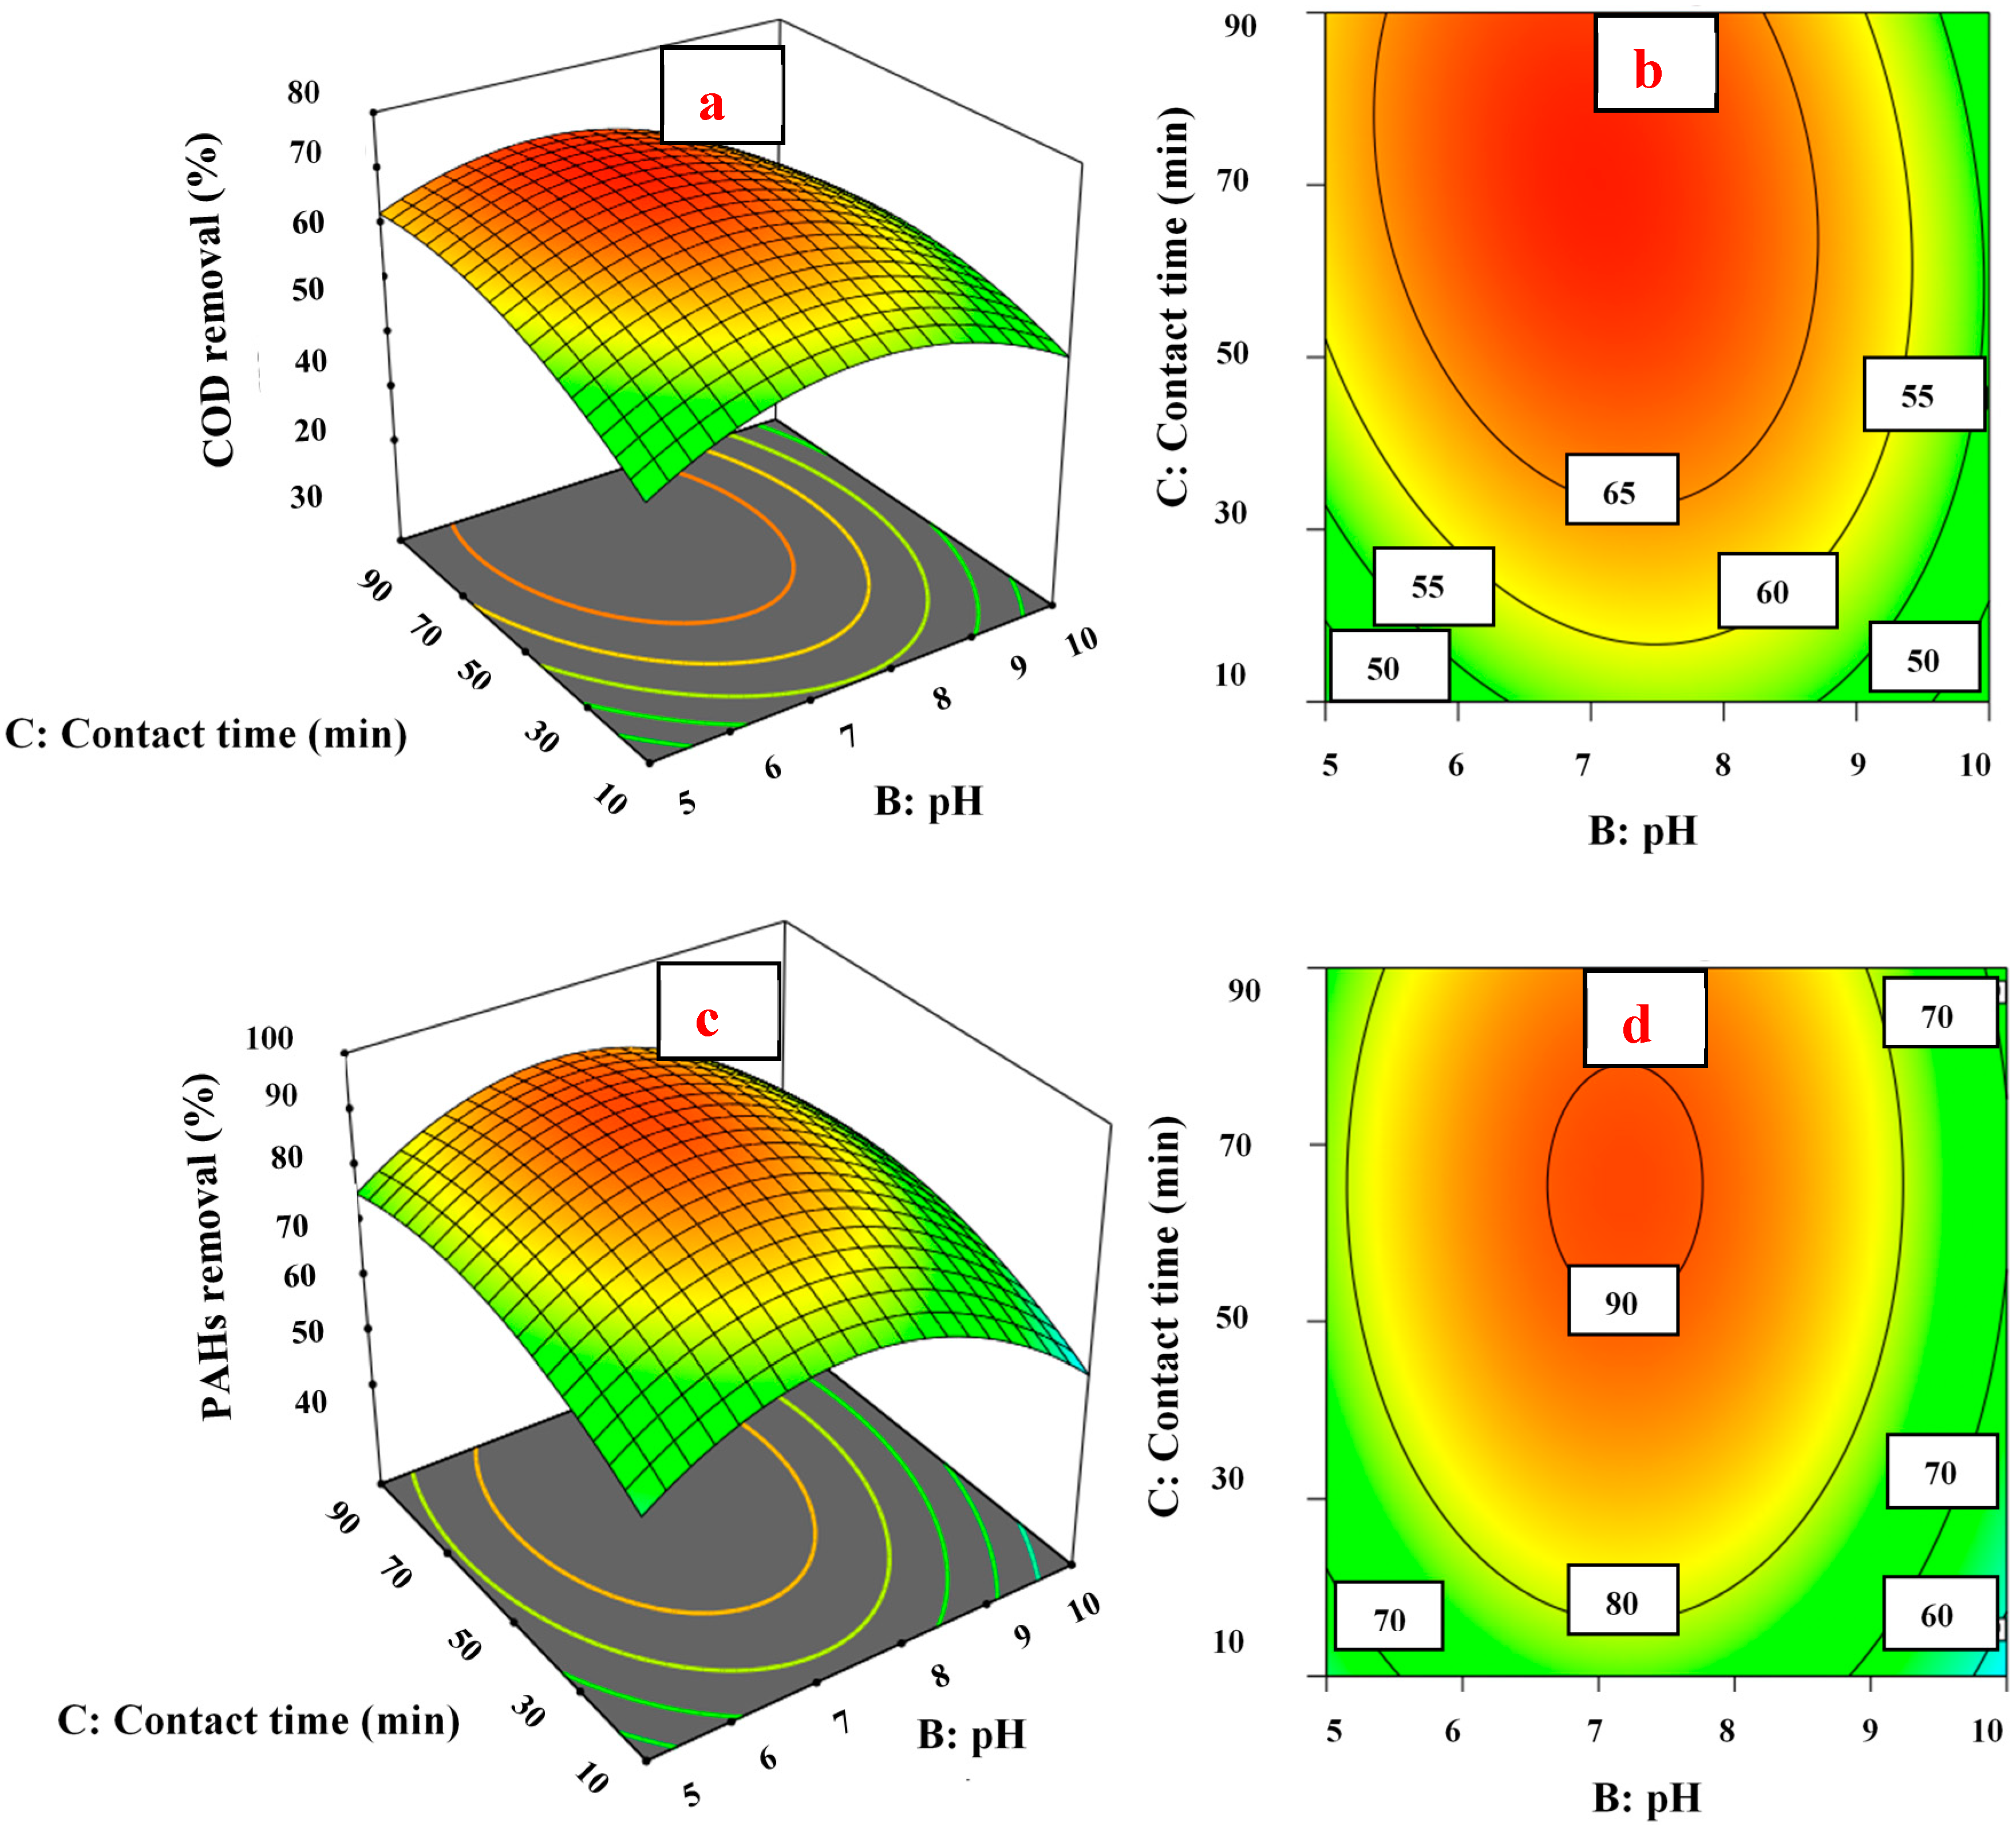
3.4.1. pH Effect on COD and PAH Removal

The interaction between pH and Fe (VI) concentration at 50 min of contact time (fixed) is presented in Figure 5; the peaks in both plots were prominent. The COD and PAH removal efficiencies increased by increasing the pH of the aqueous solution and concentration of Fe (VI) until specific values of both factors in Fe (VI) oxidation. A strong interaction was observed between both variables (Fe (VI) and pH), where the p-values of both parameters’ interaction were found to be significant for COD (p-value 0.0473) and PAH (p-value 0.0323) removal. Moreover, more information on the interaction between pH and Fe (VI) concentration can be attained from the plots, as shown in Figure 5. The COD and PAH removal in Fe (VI) oxidation were highly dependent on pH. It was observed at pH 5.0, the COD and PAH removal efficiencies were 45.0% and 67.0% (respectively) and it increased further when pH was increased from pH 5.0 to pH 7.5. The maximum removal of COD (71.3%) and PAHs (94.3%) were obtained at pH 7.5, which showed that near-neutral pH was more suitable for Fe (VI) and micropollutants reaction in PW. Additionally, based on the working mechanism, Fe (VI) is converted to Fe3+/Fe(OH)3 in an aqueous solution, and these products slightly increase the pH of the solution, which affects the decomposition process [41]. The removal efficiencies were decreased when the pH of the water sample was increased from pH 7.5 to pH 10.0, as shown in Figure 5. It was expected that Fe (VI) stability would increase with the pH increment, whereas the redox potential would decrease. In addition, Fe (VI) has high oxidation potential and is highly unstable (rapidly reduced) in an acidic environment due to the high concentration of H+ existence in aqueous solution [42]. Hence, Fe (VI) quickly reduced in an acidic environment and could not completely react with organic pollutants, which resulted in incomplete oxidation of these hazardous pollutants, while in a neutral environment, the Fe (VI) stability and redox potential were comparatively higher, and oxidation process was relatively more favorable for the degradation of micropollutants. As a result, higher COD and PAH removal efficiencies were attained under a neutral environment. In comparison with the previous studies, Karaatli et al. [43] and Song et al. [44] obtained maximum removal of pollutants from lake water at 6.5 pH. Similarly, Ciabatti et al. [28] achieved maximum remediation (70.0%) of organic pollutants from dyeing effluents at 8.5 pH. Jiang et al. [17] reported almost pH 10.0 as the optimum value for the highest degradation of contaminates from domestic sewage effluent by Fe (VI) oxidation. The optimum value of pH of the current study was different from the previous studies because, in previous studies, they employed Fe (VI) for the treatment of different types of source water/wastewater that contained different kind of pollutants, which influenced the Fe (VI) oxidation accordingly. In the present study, the maximum removal of pollutants was attained at pH 7.5, which indicates that PW influenced the Fe (VI) oxidation. Optimum values of operating parameters may vary depending on the characteristic of the wastewater.

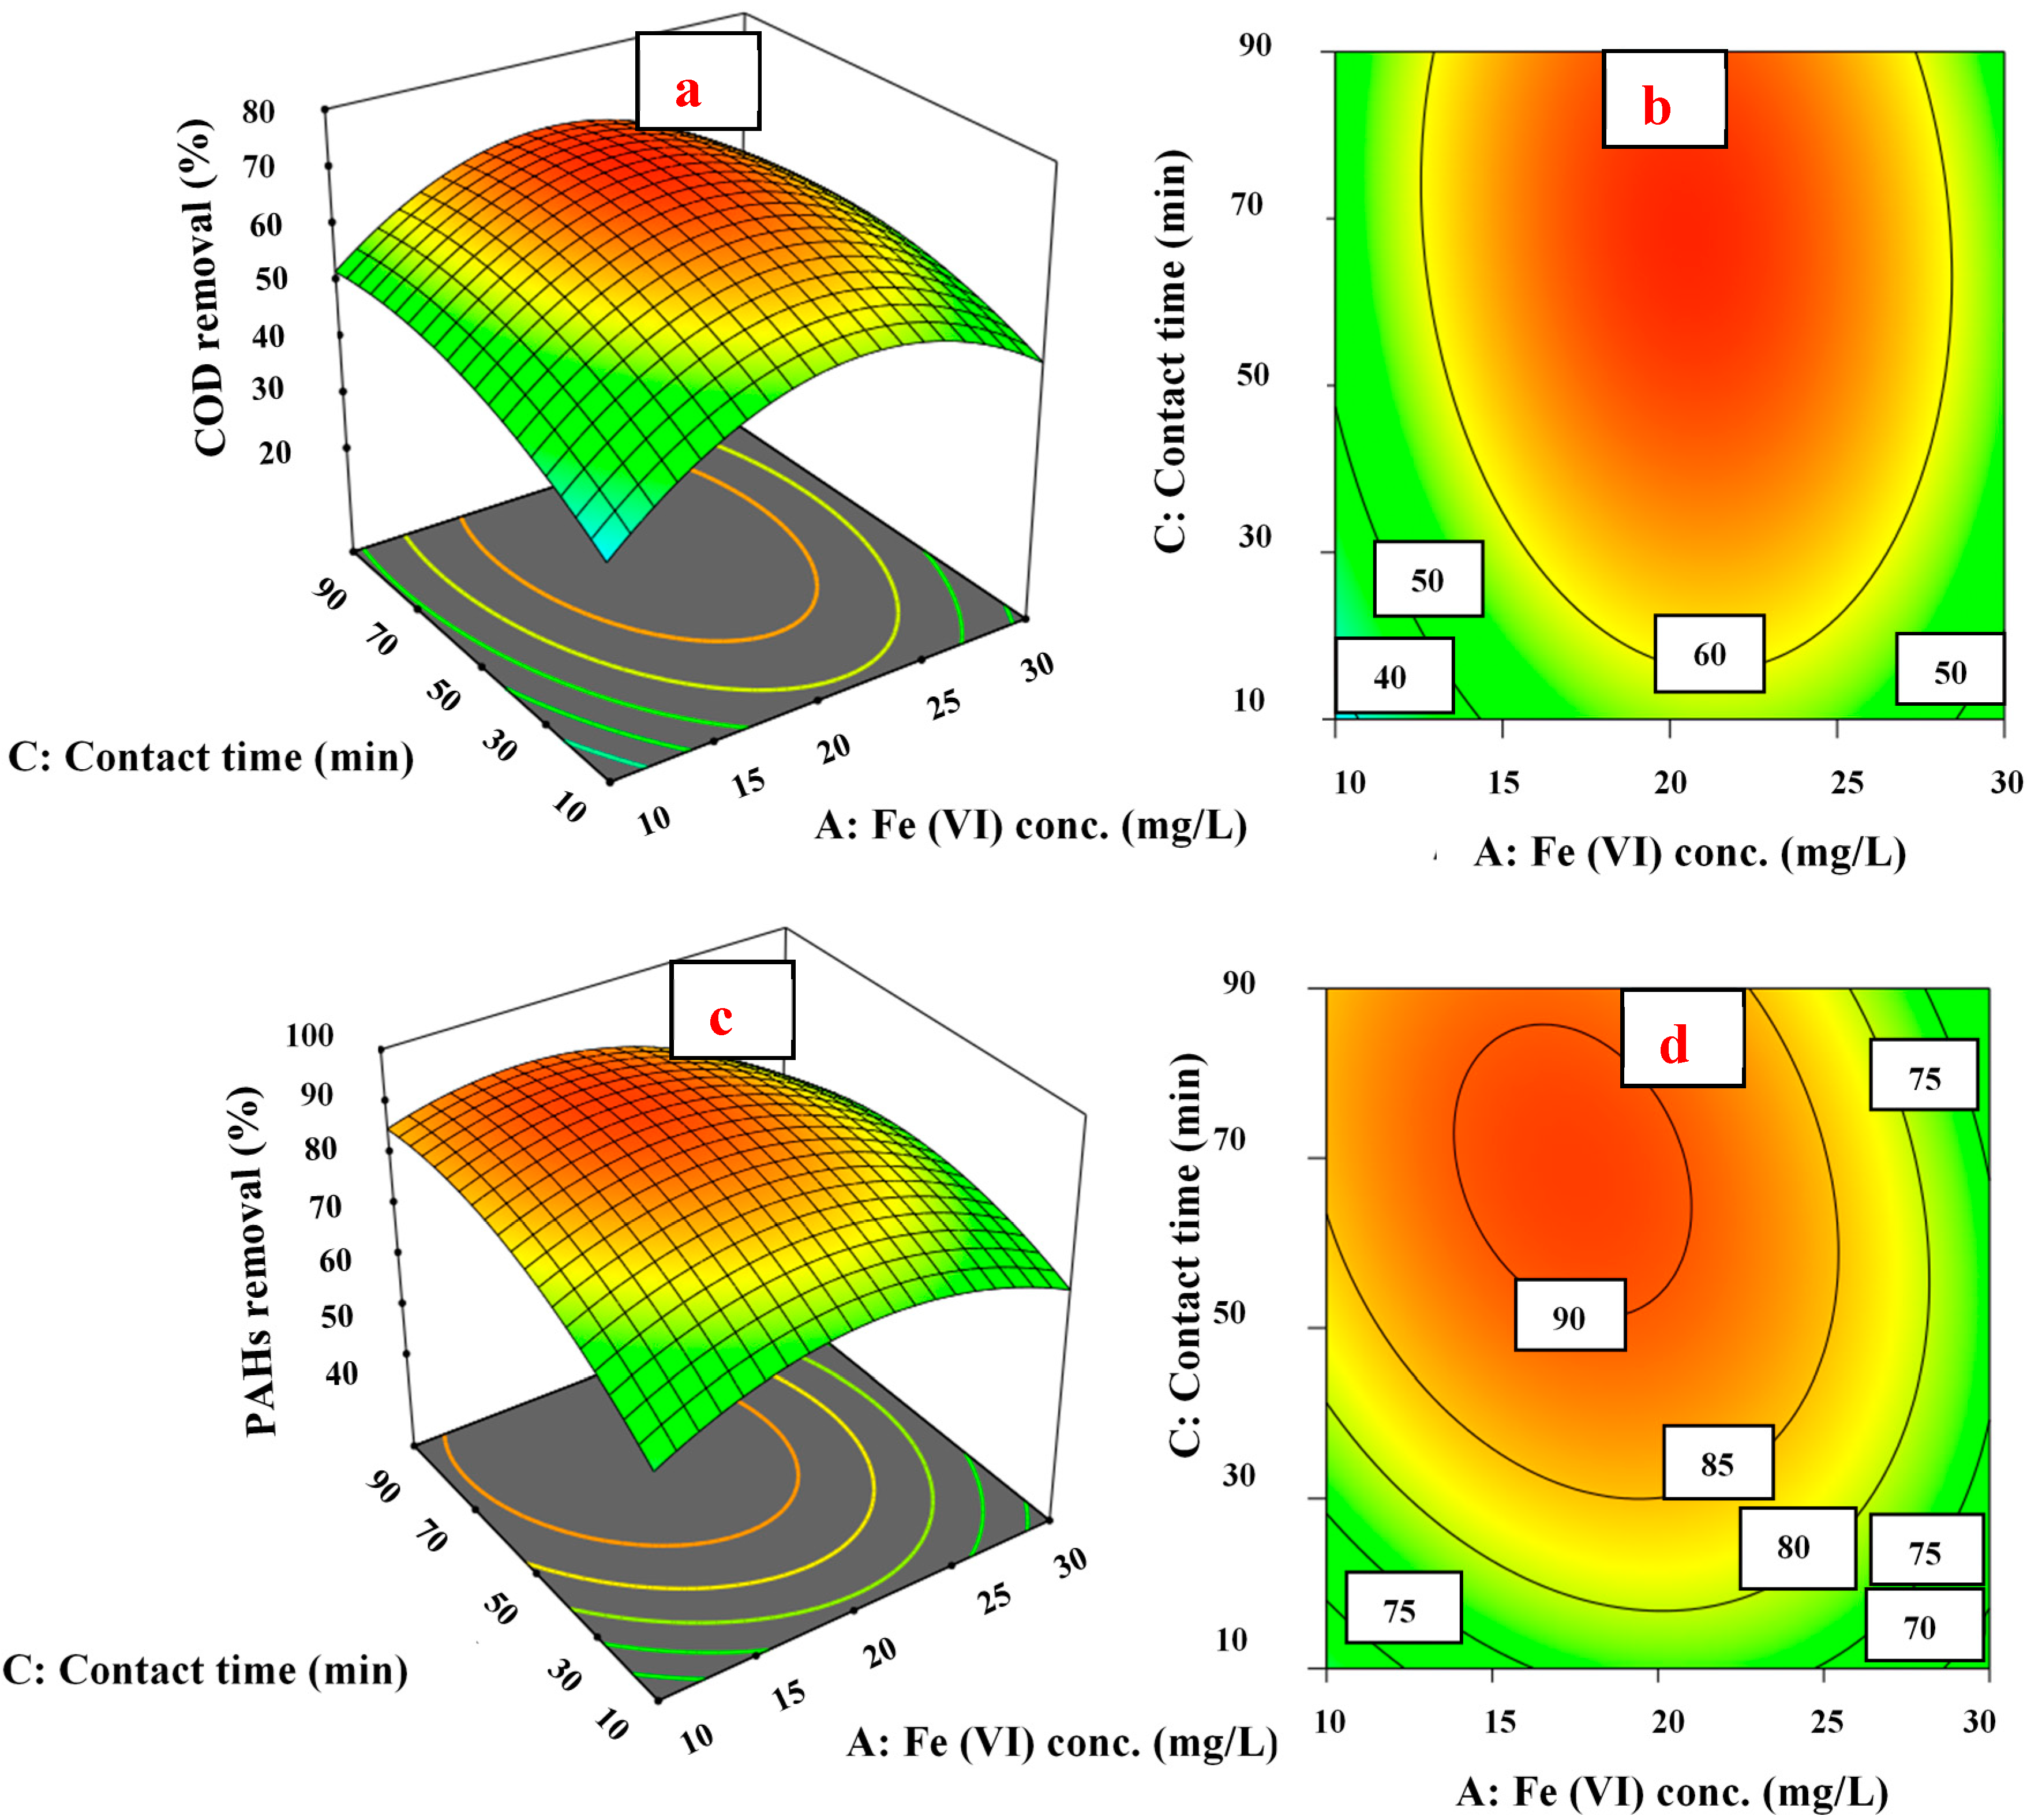
3.4.2. Fe (VI) Concentration Effect on COD and PAH Removal

The correlation between contact time and Fe (VI) concentration at pH 7.5 (fixed) is presented in Figure 6. The plots showed that the interaction between both parameters (contact time and Fe (VI) concentration) was nonsignificant (p-value 0.0861) for COD reduction while it was significant (p-value 0.0168) for PAH removal. The response surface graphs indicated that COD reduction was significantly affected by the individual impact, and there was some interaction between both parameters. When pH was fixed at 7.5, the reaction time showed a trend where it was proportional to the COD removal, while a reverse effect was observed when increasing the Fe (VI) dosage beyond optimum value. It may be because of more Fe3+ ions, which adversely affected the COD reduction and caused insignificant interaction between both parameters.
In addition, the concentration of Fe (VI) played a significant role in COD and PAH removal, as shown in Figure 6. At 10 mg/L of Fe (VI) concentration, the removal percentage of COD and PAHs were 38.0% and 65.0%, respectively. The rise in COD and PAH removal was observed when the concentration of Fe (VI) was increased from 10 to 20 mg/L. The maximum removal of COD and PAHs at 58.0% and 78.0%, respectively (at 10 min of contact time), was observed at 20 mg/L of Fe (VI) concentration. As the Fe (VI) concentration was enhanced, the degradation was predominant in approximately neutral environment, which increased the ability of HFeO4- (Fe (VI) in the protonated form) to react with organic pollutants [30,45]. Thus, HFeO4- resulted in surging the COD and PAH removal efficiencies. Moreover, a reverse phenomenon was observed as the concentration of Fe (VI) was increased above 20 mg/L; the COD and PAH removal efficiencies declined. The COD and PAH removal percentage at 30 mg/L of Fe (VI) concentration decreased to 47.0% and 67.7% (at 10 min of contact time), respectively. Micropollutant removal did not improve by increasing the Fe (VI) concentration beyond 20 mg/L. It appeared that as the concentration of Fe (VI) was increased, more Fe3+ ions were generated, which may have increased Fe (VI) decomposition instead of organic pollutant decomposition [40]. Beyond the optimum value of Fe (VI), the oxidized products generated during the reaction of Fe (VI) and organic pollutants consumed an extra amount of Fe (VI) and decreased the removal efficiencies of COD and PAHs, as shown in Figure 6. Wang et al. [46] reported 20 mg/L Fe (VI) concentration as the optimal value for maximum removal of organic pollutants from papermaking wastewater in line with the current study. Some studies, however, reported different optimal values of Fe (VI) depending on the characteristics of the wastewater [28,32], as PW characteristics affected the Fe (VI) oxidation as well.

3.4.3. Contact Time Effect on COD and PAH Removal

In Figure 7, the effect of pH and contact time on COD and PAH removal have been shown at fixed Fe (VI) concentration (20 mg/L). The interaction between both parameters significantly affected the COD removal in PW. While the interaction between both parameters was insignificant for PAH removal, the response surface graphs indicated that PAH reduction was significantly affected by the individual impact, and there was some interaction between both parameters. It may have been due to the sensitive nature of Fe3+ to pH value in aqueous media. The plots portrayed that increasing the amount of both parameters up to a specific value increased the removal efficiencies of PAHs and COD. The contact time impact on organic compound degradation was studied by varying the time range from 10 to 90 min. As shown in Figure 7, it was noticed that by increasing the contact time, COD and PAH removal efficiencies also increased up to a specific value of contact time. Initially, after 10 min of contact time, the reduction percentage of COD and PAHs was 53.5% and 73.7%, respectively, at pH 6.0. The highest reduction of COD and PAHs of 66.4% and 87.8% was obtained at 50 min of contact time. After 50 min, the degradation of organic pollutants was constant. It could be expected that the Fe (VI) amount was completely consumed within 50 min of contact time, so it was not available after that time for further reaction. In this study, the COD and PAH removal were stable after 50 min of reaction time, which indicated that Fe (VI) was completely degraded within 50 min.

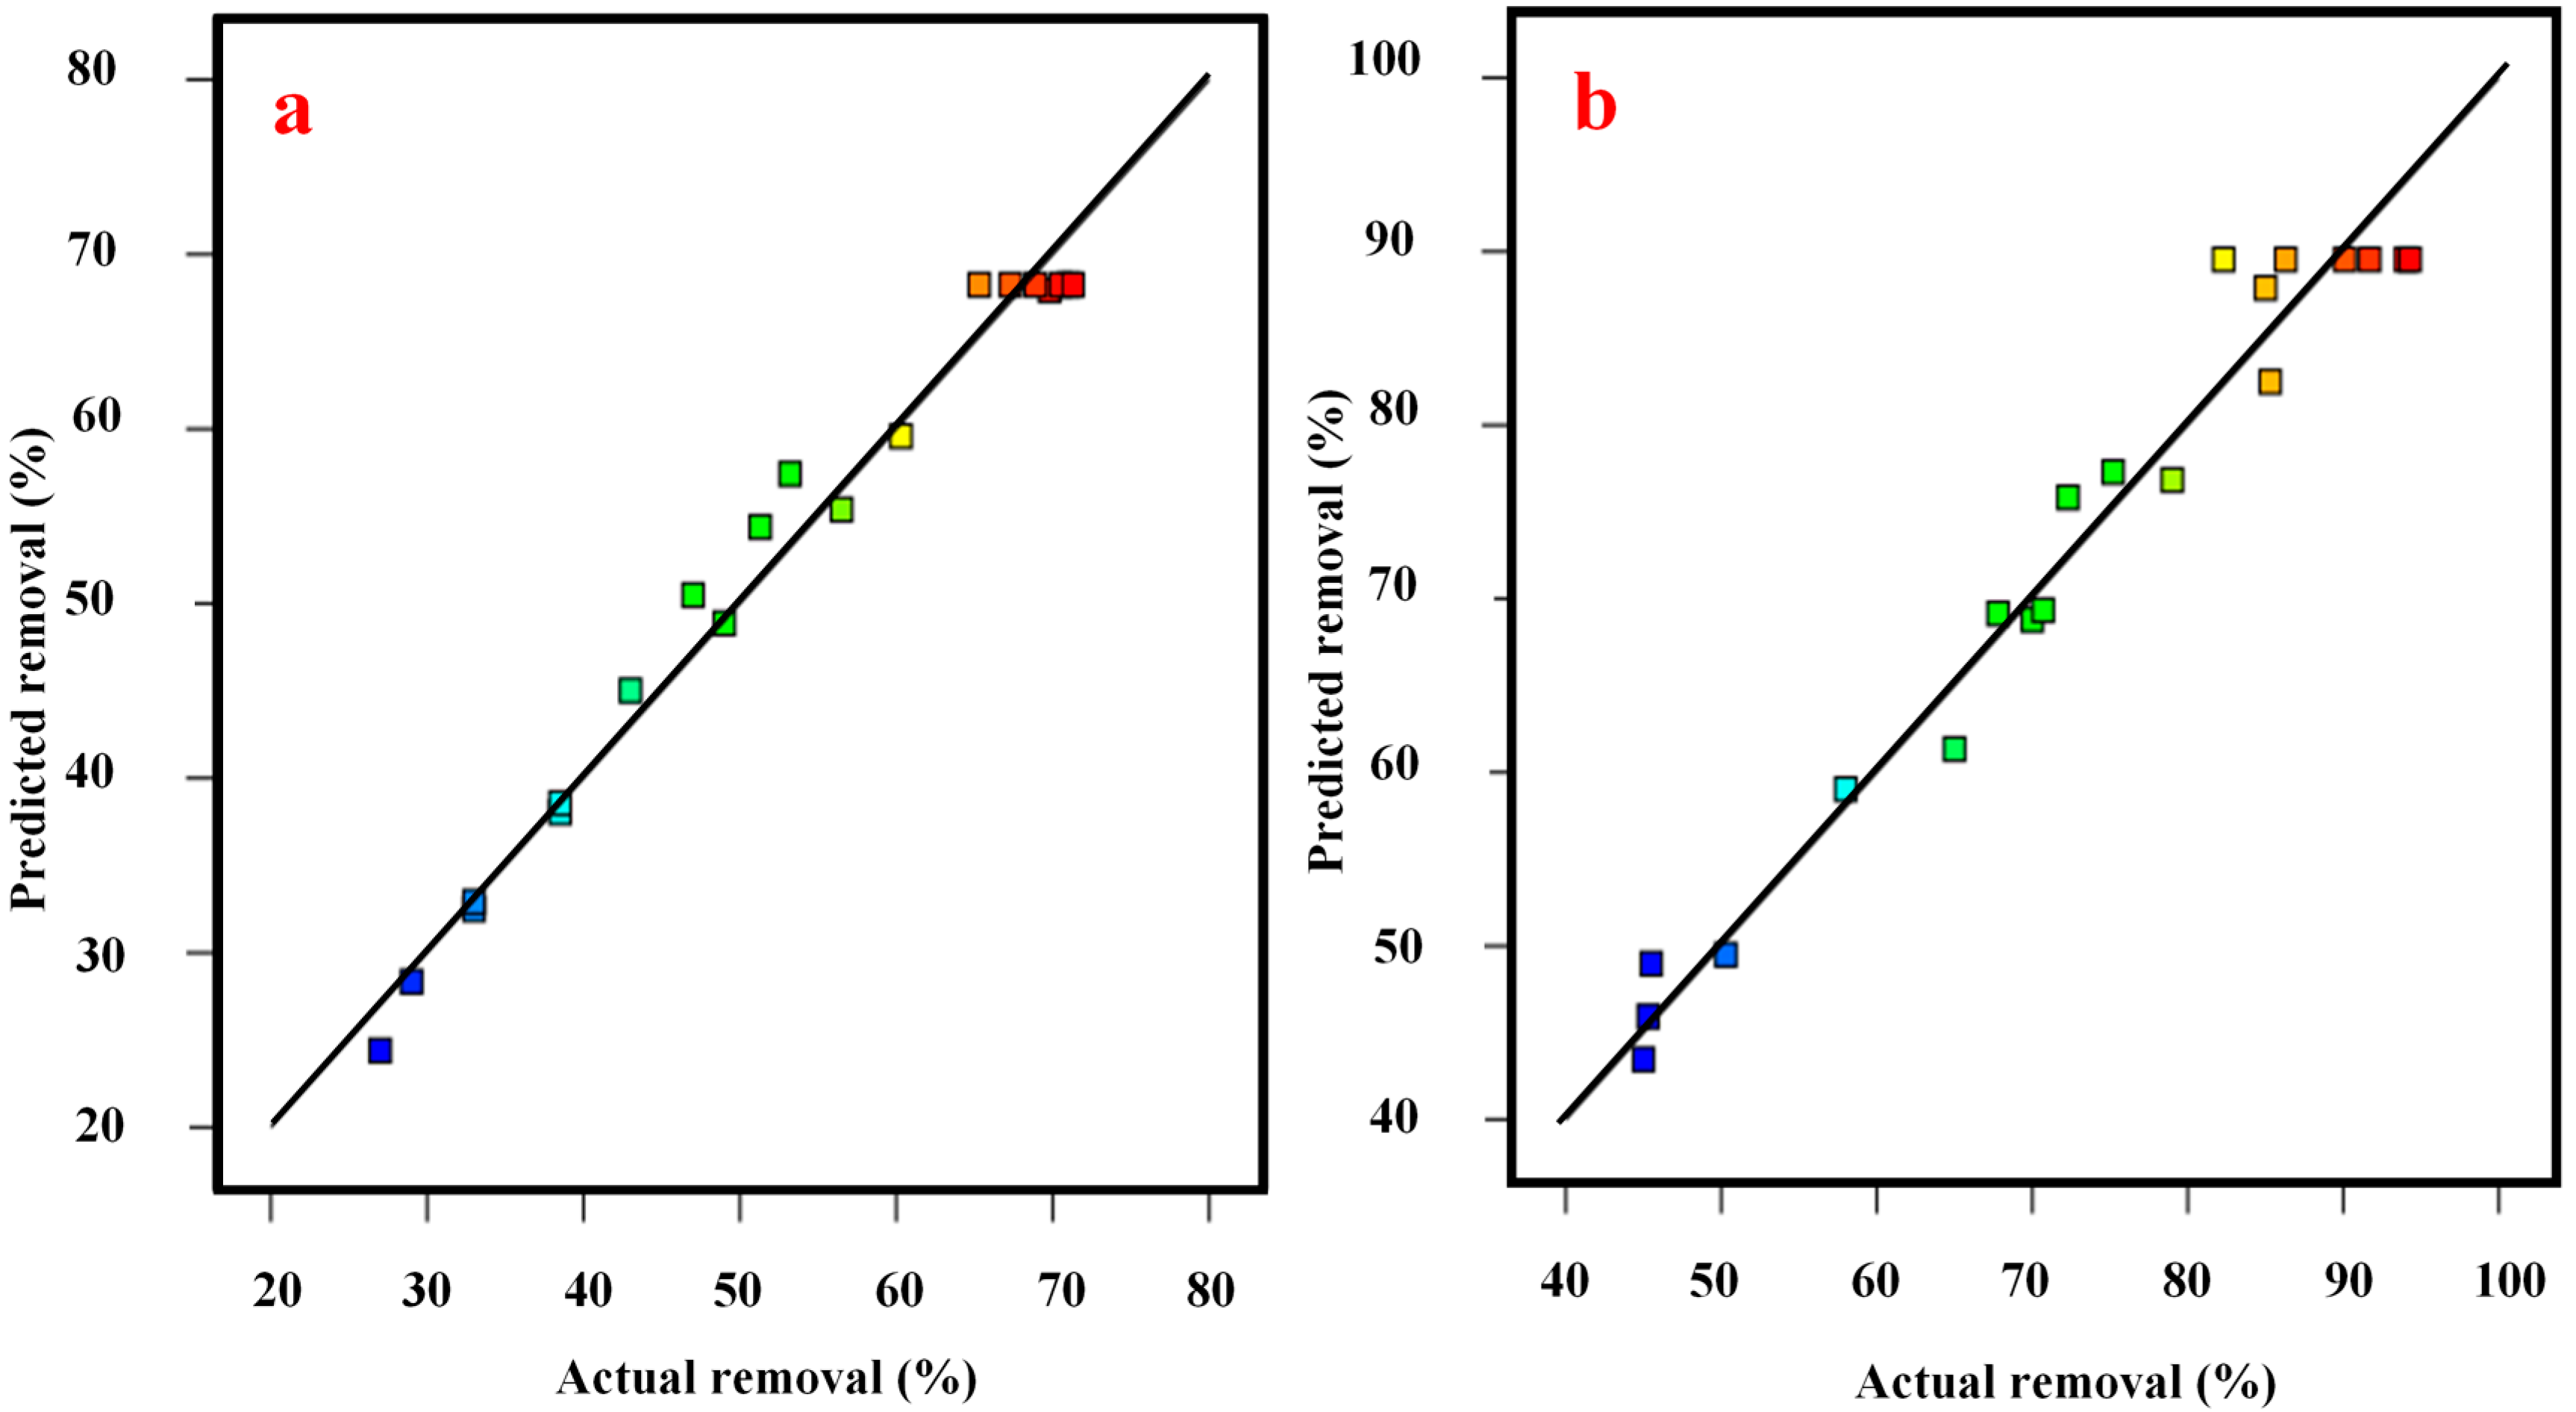
3.5. Optimization and Validation

Central composite design (CCD)-based numerical optimization was utilized to evaluate the optimal conditions for maximum removal of COD and PAHs in PW. The optimal parameters were obtained for COD and PAH removal depending on the desirability functions. In numerical optimization, for all independent parameters, Fe (VI) concentration, pH, and the contact time “in range” option were chosen. In contrast, “maximum range” was selected for COD and PAH removal. Optimized conditions were acquired under maximum desirability for the defined conditions. The COD and PAH removal efficiencies were predicted under these specified conditions by CCD-based numerical optimization. An additional test under optimal conditions was carried out to check the predicted models’ precision and efficiency. The experimental removal efficiencies were in good agreement with predicted removal efficiencies, as shown in Table 7. The small difference between observed and predicted results indicated a strong agreement between responses obtained from experiments and the ones proposed by the quadratic models. In addition, the PAH removal by Fe (VI) oxidation was higher than COD removal. As COD of PW comprises of several organic and inorganic pollutants [45] it could be expected that some pollutants (which were part of COD) were resistant to Fe (VI) oxidation. On the other hand, all PAHs in PW were entirely removed by the Fe (VI) oxidation process except naphthalene and phenanthrene. Fe (VI) oxidation only partially removed naphthalene and phenanthrene. Both PAHs were quantified in very low concentrations in PW after treatment of PW at optimal conditions, as shown in Figure 8. From the results, it can be observed that significant removal of COD and PAHs from PW was attained. However, Fe (VI) oxidation could not attain 100% removal of pollutants from PW. A few pollutants such as naphthalene, phenanthrene, 2,5,5-trimethyl-1-hexen-3-yne, and 2-propenamide were identified after the treatment of PW at optimal conditions. Additionally, based on the identified pollutants after PW treatment, the Fe (VI) oxidation mechanism for PAH removal could be proposed. It is expected that the reduction of PAHs in the treated PW occurred by the transformation of aromatic rings. It might occur through 1,3-dipolar cycloaddition and result in two aldehyde groups, which can be further oxidized by Fe (VI) to acid groups [26]. A future study may be conducted on the Fe (VI) oxidation mechanism for PAH removal from PW.
In comparison with previously conducted scientific studies, Guang et al. [22] reported the maximum removal of PAHs (82.6%) was achieved at 10 mg/L of Fe (VI) concentration and pH 7.1 from synthetic wastewater using Fe (VI) oxidation. Duan et al. [30] reported 84.0% removal of organic contaminants from coking wastewater by Fe (VI) oxidation. Amirreza et al. [46] reported a maximum of 48.0% of micropollutant removal from municipal wastewater was achieved via Fe (VI) oxidation. The results obtained by Ciabatti et al. [28] showed a maximum of 80.0% removal of organic compounds at 70 mg/L of Fe (VI) concentration. The removal efficiencies in this present study were higher than all studies discussed above, which indicates the strong applicability of Fe (VI) to oxidize micropollutants in PW.

4. Conclusions

In this study, the remediation of COD and PAHs in PW by Fe (VI) oxidation was investigated systematically. The effectiveness of Fe (VI) oxidation depends on the operating parameters viz. Fe (VI) concentration, pH, and contact time. Initially, the ranges of operating parameters were evaluated by a screening test. Based on three operating parameters, the experimental design, consisting of 20 runs, was developed by CCD/RSM. Optimum values of independent variables for the current oxidation study were observed, such as 19.35 mg/L, 7.1, and 68.34 min for Fe (VI) concentration, pH, and contact time, respectively. The maximum COD (73.41%) and PAH (89.73%) removal were achieved under tested operating conditions. A satisfactory agreement was confirmed between experimental data and predicted data (obtained from the quadratic regression models). The high values of the coefficient of determination (R2 > 0.90) by the analysis of variance verified the adequacy of the selected model. The findings of this study indicate an excellent efficiency of Fe (VI) for the remediation of micropollutants in PW. The study recommends that it would be advantageous to conduct a continuous flow study for the assessment of field applications of Fe (VI) for the treatment of produced water.

Author Contributions

Conceptualization, M.R.U.M. and M.H.I.; data curation, T.H.; formal analysis, T.H. and M.J.K.B.; funding acquisition, M.R.U.M.; investigation, T.H.; methodology, T.H.; project administration, M.R.U.M.; resources, M.R.U.M.; supervision, M.R.U.M. and K.W.Y.; validation, T.H.; writing—original draft, T.H.; writing—review and editing, M.R.U.M., M.H.I., M.J.K.B., M.A., and M.Z. All authors have read and agreed to the published version of the manuscript.

Funding

This research was funded by the YUTP research project (Cost center 015LC0-044).

Acknowledgments

The authors would like to acknowledge Universiti Teknologi PETRONAS for providing facilities and financial support under the YUTP grant (cost center; 015LC0-044) for this study and the first author also acknowledges the Graduate Assistantship (GA) scheme by the Centre for Graduate Studies of Universiti Teknologi PETRONAS (UTP).

Conflicts of Interest

The authors declare no conflict of interest.

References

  1. Yaqub, A.; Isa, M.H.; Kutty, S.R.M.; Ajab, H.E. lectrochemical degradation of PAHs in produced water using Ti/Sb2O5-SnO2-IrO2 anode. Electrochem. Commun. 2014, 82, 979–984. [Google Scholar] [CrossRef] [Green Version]
  2. Vela, N.; Martínez-Menchón, M.; Navarro, G.; Pérez-Lucas, G.; Navarro, S. Removal of polycyclic aromatic hydrocarbons (PAHs) from groundwater by heterogeneous photocatalysis under natural sunlight. J. Photochem. Photobiol. 2012, 232, 32–40. [Google Scholar] [CrossRef]
  3. Liu, B.; Chen, B.; Zhang, B.; Song, X.; Zeng, G.; Lee, K. Photocatalytic ozonation of offshore produced water by TiO2 nanotube arrays coupled with UV-LED irradiation. J. Hazard. Mater. 2020, 402, 123456. [Google Scholar] [CrossRef] [PubMed]
  4. Jiménez, S.; Micó, M.M.; Arnaldos, M.; Medina, F.; Contreras, S. State of the art of produced water treatment. Chemosphere 2018, 192, 186–208. [Google Scholar]
  5. Nawaz, R.; Kait, C.F.; Chia, H.Y.; Isa, M.H.; Huei, L.W. Glycerol-mediated facile synthesis of colored titania nanoparticles for visible light photodegradation of phenolic compounds. Nanomaterials 2019, 9, 1586. [Google Scholar] [CrossRef] [Green Version]
  6. Haneef, T.; Ul Mustafa, M.R.; Rasool, K.; Ho, Y.C.; Mohamed Kutty, S.R. Removal of polycyclic aromatic hydrocarbons in a heterogeneous Fenton like oxidation system using nanoscale zero-valent iron as a catalyst. Water 2020, 12, 2430. [Google Scholar] [CrossRef]
  7. Haneef, T.; Mustafa, M.R.U.; Farhan Yasin, H.M.; Farooq, S.; Hasnain Isa, M. Study of Ferrate(VI) oxidation for COD removal from wastewater. IOP Conf. Ser. Earth Environ. Sci. 2020, 442, 1–8. [Google Scholar] [CrossRef] [Green Version]
  8. Smol, M.; Włodarczyk, M.M. The effectiveness in the removal of PAHs from aqueous solutions in physical and chemical processes: A review. Polycycl. Aromat. Comp. 2017, 37, 292–313. [Google Scholar] [CrossRef]
  9. Sahrin, N.T.; Nawaz, R.; Fai Kait, C.; Lee, S.L.; Wirzal, M.D.H. Visible light photodegradation of formaldehyde over TiO2 nanotubes synthesized via electrochemical anodization of titanium foil. Nanomaterials 2020, 10, 128. [Google Scholar] [CrossRef] [Green Version]
  10. Manilal, A.M.; Soloman, P.A.; Basha, C.A. Removal of Oil and Grease from Produced Water Using Electrocoagulation. J. Hazard. Toxic Radioact. Waste 2020, 24, 04019023. [Google Scholar] [CrossRef]
  11. Chang, H.; Li, T.; Liu, B.; Vidic, R.D.; Elimelech, M.; Crittenden, J.C. Potential and implemented membrane-based technologies for the treatment and reuse of flowback and produced water from shale gas and oil plays: A review. Desalination 2019, 455, 34–57. [Google Scholar] [CrossRef]
  12. Campos, J.C.; Borges, R.M.H.; Oliveira Filho, A.M.D.; Nobrega, R.; Sant’Anna, G.L., Jr. Oilfield wastewater treatment by combined microfiltration and biological processes. Water Res. 2002, 36, 95–104. [Google Scholar] [CrossRef]
  13. Hao, H.; Huang, X.; Gao, C.; Gao, X. Application of an integrated system of coagulation and electrodialysis for treatment of wastewater produced by fracturing. Desalin. Water Treat. 2015, 55, 2034–2043. [Google Scholar] [CrossRef]
  14. Clay, L.; Pichtel, J. Treatment of simulated oil and gas produced water via pilot-scale rhizofiltration and constructed wetlands. Int. J. Environ. Sci. Technol. 2019, 13, 185–198. [Google Scholar] [CrossRef]
  15. Rasool, K.; Pandey, R.P. Water treatment and environmental remediation applications of two-dimensional metal carbides (MXenes). Mater. Today 2019, 30, 80–102. [Google Scholar] [CrossRef]
  16. Jiang, J.Q.; Stanford, C.; Petri, M. Practical application of ferrate (VI) for water and wastewater treatment–site study’s approach. Water-Energy Nexus 2018, 1, 42–46. [Google Scholar] [CrossRef]
  17. Gombos, E.; Barkács, K.; Felföldi, T.; Vértes, C.; Makó, M.; Palkó, G.; Záray, G. Removal of organic matters in wastewater treatment by ferrate (VI)-technology. Microchem. J. 2013, 107, 115–120. [Google Scholar] [CrossRef]
  18. Alsheyab, M.; Jiang, J.Q.; Stanford, C. On-line production of ferrate with an electrochemical method and its potential application for wastewater treatment—A review. J. Environ. Manag. 2009, 90, 1350–1356. [Google Scholar] [CrossRef]
  19. Sun, S.; Pang, S.; Jiang, J.; Ma, J.; Huang, Z.; Zhang, J.; Liu, Y.; Xu, C.; Liu, Q.; Yuan, Y. The combination of ferrate (VI) and sulfite as a novel advanced oxidation process for enhanced degradation of organic contaminants. Chem. Eng. J. 2018, 333, 11–19. [Google Scholar] [CrossRef]
  20. Jiang, J.Q. Research progress in the use of ferrate(VI) for the environmental remediation. J. Hazard. Mater. 2007, 146, 617–623. [Google Scholar] [CrossRef]
  21. Guan, W.; Xie, Z.; Zhang, J. Preparation and aromatic hydrocarbon removal performance of potassium Ferrate. Int. J. Spectrosc. 2014, 22, 1–8. [Google Scholar] [CrossRef] [Green Version]
  22. Sharma, V.K.; Rivera, W.; Smith, J.O.; O’Brien, B. Ferrate (VI) oxidation of aqueous cyanide. J. Environ. Sci. Technol. 1998, 32, 2608–2613. [Google Scholar] [CrossRef]
  23. Ahmad, A.L.; Ismail, S.; Bhatia, S. Optimization of coagulation-flocculation process for palm oil mill effluent using response surface methodology. Environ. Sci. Technol. 2005, 39, 2828–2834. [Google Scholar] [CrossRef] [PubMed]
  24. Saeed, M.O.; Azizli, K.; Isa, M.H.; Bashir, M.J. Application of CCD in RSM to obtain optimize treatment of POME using Fenton oxidation process. J. Water Process. Eng. 2015, 8, 7–16. [Google Scholar] [CrossRef]
  25. Wang, C.; Klamerth, N.; Huang, R.; Elnakar, H.; Gamal El-Din, M. Oxidation of oil sands process-affected water by potassium Ferrate(VI). Environ. Sci. Technol. 2016, 50, 4238–4247. [Google Scholar] [CrossRef]
  26. Han, H.; Li, J.; Ge, Q.; Wang, Y.; Chen, Y.; Wang, B. Green Ferrate(VI) for multiple treatments of fracturing wastewater: Demulsification, visbreaking, and chemical oxygen demand removal. Int. J. Mol. Sci. 2019, 20, 1857. [Google Scholar] [CrossRef] [Green Version]
  27. Ciabatti, I.; Tognotti, F.; Lombardi, L. Treatment and reuse of dyeing effluents by potassium ferrate. Desalination 2010, 250, 222–228. [Google Scholar] [CrossRef]
  28. Malik, S.N.; Ghosh, P.C.; Vaidya, A.N.; Waindeskar, V.; Das, S.; Mudliar, S.N. Comparison of coagulation, ozone and ferrate treatment processes for color, COD and toxicity removal from complex textile wastewater. Water Sci. Technol. 2017, 76, 1001–1010. [Google Scholar] [CrossRef]
  29. Li, Y.N.; Duan, Z.H.; Wang, Y.F.; Yuan, Z.J.; Wang, G.Y. Preliminary treatment of phenanthrene in coking wastewater by a combined potassium ferrate and Fenton process. Int. J. Sci. Environ. Technol. 2018, 16, 4483–4492. [Google Scholar] [CrossRef]
  30. Kozik, V.; Barbusinski, K.; Thomas, M.; Sroda, A.; Jampilek, J.; Sochanik, A.; Smolinski, A.; Bak, A. Taguchi method and response surface methodology in the treatment of highly contaminated tannery wastewater using commercial potassium Ferrate. Materials 2019, 12, 3784. [Google Scholar] [CrossRef] [Green Version]
  31. Tan, X.M.; Ji, F.Y.; Wang, X.D.; Zhang, G.Z. Preparation of potassium Ferrate and Ferrate(VI) oxidation of phenanthrene. Adv. Mater. Res. 2012, 523, 784–789. [Google Scholar] [CrossRef]
  32. Eaton, A.D. Standard Methods for the Examination of Water and Wastewater; American Public Health Association: Washington, DC, USA, 1915. [Google Scholar]
  33. Perez, S.; Guillamon, M.; Barceló, D. Quantitative analysis of polycyclic aromatic hydrocarbons in sewage sludge from wastewater treatment plants. J. Chromatogr. A 2001, 938, 57–65. [Google Scholar] [CrossRef]
  34. Zahid, M.; Shafiq, N.; Isa, M.H.; Gil, L. Statistical modeling and mix design optimization of fly ash based engineered geopolymer composite using response surface methodology. J. Clean. Prod. 2018, 194, 483–498. [Google Scholar] [CrossRef]
  35. Rai, P.K.; Lee, J.; Kailasa, S.K.; Kwon, E.E.; Tsang, Y.F.; Ok, Y.S.; Kim, K.H. A critical review of ferrate (VI)-based remediation of soil and groundwater. Environ. Res. 2018, 160, 420–448. [Google Scholar] [CrossRef]
  36. Jiang, J.Q.; Lloyd, B. Progress in the development and use of ferrate(VI) salt as an oxidant and coagulant for water and wastewater treatment. Water Res. 2001, 36, 1397–1408. [Google Scholar] [CrossRef]
  37. Matin, A.R.; Yousefzadeh, S.; Ahmadi, E.; Mahvi, A.; Alimohammadi, M.; Aslani, H.; Nabizadeh, R. A comparative study of the disinfection efficacy of H2O2/Ferrate and UV/H2O2/Ferrate processes on inactivation of Bacillus subtilis spores by response surface methodology for modeling and optimization. Food Chem. Toxicol. 2018, 116, 129–137. [Google Scholar] [CrossRef]
  38. Karim, A.V.; Krishnan, S.; Pisharody, L.; Malhotra, M. Application of Ferrate for Advanced Water and Wastewater Treatment. In Advanced Oxidation Processes-Applications, Trends, and Prospects; IntechOpen: London, UK, 2020. [Google Scholar]
  39. Sun, X.; Zhang, Q.; Liang, H.; Ying, L.; Xiangxu, M.; Sharma, V.K. Ferrate(VI) as a greener oxidant: Electrochemical generation and treatment of phenol. J. Hazard. Mater. 2016, 319, 130–136. [Google Scholar] [CrossRef]
  40. Graham, N.; Jiang, C.C.; Li, X.Z.; Jiang, J.Q.; Ma, J. The influence of pH on the degradation of phenol and chlorophenols by potassium ferrate. Chemosphere 2004, 56, 949–956. [Google Scholar] [CrossRef]
  41. Karaatli, T. Disinfection of Surface Waters by Ferrate. Master’s Thesis, Middle East Technical University, Ankara, Turkey, 1998. [Google Scholar]
  42. Song, Y.; Men, B.; Wang, D.; Ma, J. On line batch production of ferrate with an chemical method and its potential application for greywater recycling with Al(III) salt. Int. J. Environ. Sci. Technol. 2017, 52, 1–7. [Google Scholar] [CrossRef]
  43. Jiang, J.Q. Advances in the development and application of ferrate (VI) for water and wastewater treatment. J. Chem. Technol. 2014, 89, 165–177. [Google Scholar] [CrossRef]
  44. Miao, Z.C.; Wang, F.; Deng, D.; Wang, L.; Yang, J.Z. Removal effect of potassium Ferrate to COD in different wastewater. Adv. Mater. Res. 2012, 553, 2288–2290. [Google Scholar] [CrossRef]
  45. Duraisamy, R.T.; Beni, A.H.; Henni, A. State of the art treatment of produced water. Water Treat. 2013, 233, 199–222. [Google Scholar]
  46. Talaiekhozani, A.; Eskandari, Z.; Bagheri, M.; Talaie, M.R. Removal of H2S and COD using UV, Ferrate and UV/Ferrate from municipal wastewater. J. Hum. Environ. Health Prom. 2016, 2, 1–8. [Google Scholar] [CrossRef] [Green Version]
Figure 1. Quantified 15 PAHs in produced water (before treatment) via GC–MS analysis.
Water 12 03132 g001
Figure 2. Screening test results for COD removal: (a) removal of COD (%) against pH, (b) removal of COD (%) against Fe (VI), (c) removal of COD (%) against contact time.
Water 12 03132 g002
Figure 3. Comparison between predicted and experimental removal efficiencies. (a) Predicted COD removal vs. experimental COD removal (%) (b) Predicted PAH removal vs. experimental PAH removal (%).
Water 12 03132 g003
Figure 4. Residual normal plots for (a) COD removal efficiency and (b) PAH removal efficiency.
Water 12 03132 g004
Figure 5. Effect of pH on COD and PAH removal. (a) 3D plot and (b) couture plot for COD removal; (c) 3D plot and (d) couture plot for PAH removal.
Water 12 03132 g005
Figure 6. Effect of Fe (VI) concentration on COD and PAH removal. (a) 3D plot and (b) couture plot for COD removal; (c) 3D plot and (d) couture plot for PAH removal.
Water 12 03132 g006
Figure 7. Effect of contact time on COD and PAH removal. (a) 3D plot and (b) couture plot for COD removal; (c) 3D plot and (d) couture plot for PAH removal.
Water 12 03132 g007
Figure 8. Name/concentration of PAHs quantified in PW after treatment of PW at optimal conditions.
Water 12 03132 g008
Table 1. Redox potential of different oxidants.
OxidantE° (Volt)OxidantE° (Volt)
Permanganate1.67Dissolved oxygen1.22
Ozone2.07Perchlorate1.38
Chlorine dioxide0.95Hypochlorite1.48
Chlorine1.35Ferrate (VI)2.20
Table 2. Ranges of independent parameters and coded values for the experimental design.
FactorsIndependent ParametersLowMediumHigh
−100
AFe (VI) concentration (mg/L)102030
BpH5.07.510.0
CContact time (min)105090
Table 3. Experimental trials designed by response surface methodology (RSM) for the reduction of chemical oxygen demand (COD) and polycyclic aromatic hydrocarbons (PAHs).
Experiment No.Parameters
Fe (VI) Concentration (mg/L)Contact Time (min)pH
1101010.0
220507.5
310507.5
4109010.0
520505.0
620507.5
730507.5
830905.0
910905.0
1030105.0
1120107.5
1220507.5
1320507.5
1420507.5
15301010.0
7.5
162090
1710105.0
1820507.5
19205010.0
20309010.0
Table 4. Results from the ANOVA table for COD removal.
Source * SS* DF* MSF-Valuep-ValueModel’s Status
Model4446.859494.0955.950.0001Significant
A60.02160.026.800.0262
B67.60167.607.650.0199
C276.601276.6831.330.0002
AB45.13145.135.110.0473
AC32.00132.003.620.0861
BC72.00172.008.150.0171
A2646.001646.0473.160.0001
B2349.701349.7439.600.0001
C285.54185.549.690.0110
Residual88.31108.83
Lack of Fit60.20512.042.140.2116Non-significant
Model summary:R2R2adj.R2pred.
98.05%96.30%89.23%
Note: * SS = sum of square, * DF = degree of freedom, * MS = mean square.
Table 5. Results from the ANOVA table for PAH removal.
Source * SS* DF* MSF-Valuep-ValueModel’s Status
Model5104.189567.1330.930.0001Significant
A110.891110.896.050.0337
B158.401158.408.640.0148
C305.811305.8116.680.0022
AB113.251113.256.180.0323
AC150.511150.518.210.0168
BC0.0110.010.000.9807
A2295.881295.8816.130.0025
B2723.741723.7439.470.0001
C2141.481141.487.710.0195
Residual183.391018.34
Lack of Fit73.30514.660.66690.6669Non-significant
Model summary:R2R2adj.R2pred.
96.50%93.40%79.72%
Note: * SS = sum of square, * DF = degree of freedom, * MS = mean square.
Table 6. Experimental and predicted results of PAHs and COD in percentage (%).
Experimental RunActual PAHs RemovalPredicted PAHs RemovalActual COD RemovalPredicted COD Removal
145.5048.9827.0024.39
282.3089.5471.3068.26
385.3082.5047.0050.48
470.0068.7933.0032.91
575.2077.3060.3059.58
694.3089.5467.3068.26
772.3075.8456.5055.38
865.0061.3443.0045.01
967.8069.1549.0048.86
1058.0059.0333.0032.49
1179.0076.8453.2057.42
1290.1089.5465.3068.26
1391.7089.5468.9068.26
1486.3089.5470.5068.26
1545.0043.4738.5038.04
1685.0087.9069.8067.94
1750.3049.4929.0028.34
1894.0089.5471.0068.26
1970.7069.3451.3054.38
2045.3045.9338.5038.56
Table 7. Optimum values of independent variables found by Design-Expert software and verification.
Dependent VariablesFe (VI) Conc. (mg/L)pHContact Time (min)Predicted Removal (%)Observed Removal (%)
COD19.357.168.3469.6973.41
PAHs19.357.168.3491.0089.73
Publisher’s Note: MDPI stays neutral with regard to jurisdictional claims in published maps and institutional affiliations.

