Abstract
This paper aims to bridge the gap in the detailed modelling of flow and sediment process interactions in sewers through the development of a computational fluid dynamics (CFD) model. It draws on previous models developed for surface water sediment transport in the OpenFOAM CFD framework and builds on them to improve their suitability for sewer sediment processes. Three distinct sediment processes, suspended sediment transport, bedload transport, and deposited bed morphology, are incorporated into a free surface flow solver, interFoam. This sewer sediment model, called SewerSedFoam, models the impacts of sediment deposition and erosion on flow velocity by using dynamic mesh deformation to capture the movement of the deposited bed and its morphology. Further, three sediment classes, two suspended and one bedload sediment, can be modelled along with some bed stabilization and consolidation effects during deposition and erosion, respectively. The functionality of the overall model in modelling sewer sediment deposition and erosion is promising, although the validation of a large magnitude sediment erosion event has been limited by the availability of granular data in existing case studies.
1. Introduction
Solids transport and deposited bed erosion/deposition processes in gravity sewers are extremely complex due to the interactions between numerous solids classes, variable inflow volumes, and the large scales of urban sewer systems [1]. However, sewer designers and operators still attempt to model these complicated processes to prevent excess solids deposition, which can result in a reduced sewer hydraulic capacity, increased pollution from combined sewer overflows (CSOs), and an increased number of sewer blockages [2]. The extensive lengths of underground sewer networks in cities globally and their long lifespans make any additional costs to their repair and rehabilitation very significant [3]. The impacts of climate change and the introduction of sustainable planning frameworks for urban water systems, specifically the focus on increasing decentralized water recycling and reducing per capita water use, bring additional uncertainty to the inflow volumes and solids concentration in sewers [4,5,6,7]. Lower inflows to sewers with an increased solids concentration can increase the rate of excess solids deposition [8]; hence, the current uncertainties around wastewater inflows and concentration in sewers provide a fresh impetus to examine and progress sewer solids models.
The multitude of solid types in sewers fall broadly into two main categories: sewer sediments, with diameters under 6 mm, and gross solids, with diameters above 6 mm [2]. A third category of near-bed or inner suspension solids has also been proposed [9], however there is significantly less fundamental research on their transport and erosion/deposition processes compared to the other solid fractions. There are avenues for improvement in the modelling of all sewer solid fractions, however, the focus of this paper is on the deterministic modelling of sewer sediments. In the past, sewer sediment research has drawn from sediment modelling in surface waters, such as rivers and oceans, due to the similarities in their flow and sediment processes [10,11,12]; these sediment processes can be broadly classified as the movement of suspended and bedload sediment due to hydrodynamic flow and the development or removal of the deposited bed due to sediment deposition or erosion (detailed in Figure 1).
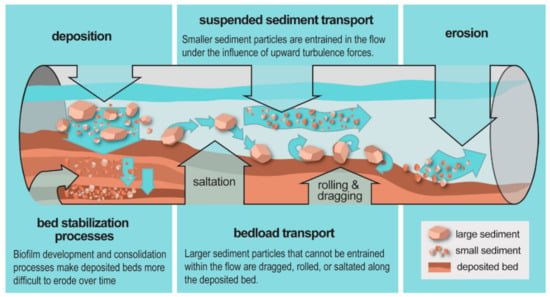
Figure 1.
Illustration of sewer sediment settling, erosion, and transport processes in gravity sewers along with their deposited bed interactions. Descriptions for suspended sediment transport, bedload transport, and bed stabilization processes based on Butler and Davies [13], Butler et al. [10], and Ashley et al. [2], respectively.
The deterministic modelling of sewer sediment transport and hydrodynamic flow over larger scales is very computationally intensive; thus, sewer sediment modelling has been limited to the use of predominantly 1-D flow models and empirical sediment transport equations, usually derived from surface water research [14]. The main limitation to the application of 3-D flow models, such as computational fluid dynamics (CFD), in sewers has been the lack of computational power required to produce reasonable model run times especially in larger sewer networks. However, the insights from the use of 3-D or 2-D flow models can be valuable in understanding the complicated interactions between flow velocity, the deposited bed, and sediment transport rates; such insights have been obtained in a number of surface water sediment transport studies [15,16]. Despite the limitations in the applicability of surface water sediment models to sewers, mainly arising from the different sediment classes in sewers [2], there is still value in the integration of ideas between these two areas. Specifically, CFD flow modelling could be used in smaller sewer sections, i.e., the ‘local’ scale as opposed to larger ‘network’ scales, along with deterministic sediment and deposited bed modelling to obtain a detailed picture of the interactions between flow velocity, sediment transport, and changing deposited bed height. A comprehensive model does have drawbacks, such as the increased requirements for input data and the lack of applicability over larger scales, but it still possesses utility for small scale use and in the development of simplified or empirical equations that can be upscaled for use over larger sewer networks.
To be comprehensive, a sewer sediment model will have to account for some important sediment and bed interactions. The use of multiple classes of sediments is necessary to incorporate the range of sediment types in sewers [2]. The change in the height of the deposited bed under a particular flow regime depends significantly on the critical shear stress, i.e., the stress required to initiate sediment motion [17]. It is a particularly difficult process to determine critical shear stress in sewer beds due to the deposition of multiple sediment fractions, cohesiveness of some sewer sediments, biological activity in sewers, and consolidation of the sediment bed over time [2]. Research into the erosion of cohesive and mixed sediment beds in surface waters and sewers may provide a way forward in the calculation of critical shear stress in sewer sediment beds [14,18,19].
This manuscript details the development of a detailed sewer sediment process model, called SewerSedFoam (SSF), in a CFD framework which can be utilized to model sediment processes in a local-scale sewer system. The development of SSF aims to bridge the gap in the detailed modelling of flow and sediment process interactions in sewers, by implementing three modules to incorporate suspended sediment transport, bedload transport, and deposited bed morphology to an existing CFD hydrodynamic flow module. A validated SSF aims to be particularly valuable in analyzing the impacts of changing wastewater inflow and concentration in sewers, due to the introduction of sustainable planning frameworks, on excess sediment deposition.
2. Model Description
OpenFOAM, an open-source CFD package with multiple distributions, has served as a good platform to develop detailed flow and sediment process models in surface water applications [15,16,20]. OpenFOAM’s active user community, compatibility with high performance computing (HPC), and the lack of licensing issues further add to its suitability in the development of SewerSedFoam (SSF). The open source nature of OpenFOAM also improves both the accessibility and reviewability of any developed model. Due to these advantages, Foam-Extend (v3.2), a community sourced version of OpenFOAM with some additional functionality compared to other distributions, was used for model development in this manuscript.
2.1. Hydrodynamics
OpenFOAM solves the Reynolds-averaged Navier–Stokes (RANS) set of equations to model hydrodynamic flow and can also model multiphase flow with a free surface, such as in a partly filled channel or pipe, using a Volume of Fluids (VoF) based solver called interFoam [21]. InterFOAM is based on the standard VoF method developed in Hirt and Nichols [22], where the RANS equations are solved in the computational domain under the linear influence of a volume fraction, α, which varies between 0 and 1 for air and water, respectively. OpenFOAM’s VoF implementation is detailed extensively in a number of publications [15,23,24,25]. A number of turbulence models are available within OpenFOAM and for this study, the k-Omega SST (k-ω SST) model was used for turbulence closure along with the interFoam solver; this turbulence model was selected as it has been used successfully in previous sediment transport applications utilizing interFoam [15].
2.2. Computational Mesh and Finite Area Method (FAM)
OpenFOAM predominantly uses the finite volume method to solve its transport equations in a domain defined through a, usually stable, computational mesh [26]. However, the development of a deposited bed in SSF necessitates a dynamic, moving mesh that changes with the erosion and deposition of sediment. To incorporate this type of dynamic mesh in OpenFOAM, the finite area method (FAM), outlined in Sattar et al. [15] and Tukovic and Jasak [27], was utilized. FAM was developed as a way to solve curved surface derivatives, such as the equation for deposited bed height Equation (17), in a 3-D OpenFOAM domain [27]. A separate “finite area” mesh is defined within the overall OpenFOAM computational mesh, representing the deposited bed in our case, to implement this method. The bedload transport and deposited bed morphology equations discussed in subsequent sections are limited to the finite area mesh. The movement of the finite area mesh from the solution of the bed morphology Equation (17), still affects the entire computational mesh and results in follow on effects to flow and other transport equations.
2.3. Sediment Fractions
Historically, sewer sediments have been classified empirically as Types A, B, C, D, and E [28], where Type A are coarse mineral sediments, Type B are cemented Type A sediments, Type C are fine grained organic sediments, Type D are biofilms, and Type E are fine grained mineral sediments [2]. Of these five sediment types, at least three major sediment fractions, i.e., Types A, C, and E, need to be modelled for a comprehensive sewer sediment model [2]. Hence, three sediment fractions are implemented in the model to represent these fractions (Table 1). The proportion of the three sediment types in the deposited bed, PA, PC, and PE, can be made constant to suit different types of sewer systems or set to be variable based on the quantity of each sediment fraction that is eroded or deposited.

Table 1.
Description, likely characteristics, and transport method of the three sediment fractions implemented in SewerSedFoam (SSF).
2.4. Suspended Sediment Transport
The one dimensional form of the Advection-Diffusion equation, often used to model suspended sediment transport, from Graf [29] is
where C is the concentration of suspended sediment, x is the transport direction, u is the flow velocity in the x direction, and ε is the dispersion coefficient.
In OpenFOAM, this 1-D equation can be solved in three dimensions for both the suspended sediment types, C and E, as follows [20]:
where Ci is the concentration of type C or E sediment, u is the flow velocity vector (all vectors in equations are represented with bold text), is the gradient operator (i.e., ∂/∂x, ∂/∂y, ∂/∂z), ν is the kinematic viscosity of water, νt is the turbulent kinematic viscosity from the turbulence model, and usi is the sediment settling velocity vector calculated for a sediment fraction i through Stokes’ law [30]:
where ρsi is the density of a suspended sediment fraction i, ρ is the density of water, di is the particle diameter for a sediment fraction i, and g is the acceleration due to gravity in vector form.
A limitation in the application of the VoF method in interFoam is that scalar transport equations, such as Equation (2), are solved for the entire computational domain and not only in the water phase sections. This can cause unphysical results, such as suspended sediment being transported through the free surface into the air domain. To limit this computational problem with VoF, a modification used in Jacobsen [20] has been added to limit turbulence effects to the water phase and obtain the final suspended sediment transport equation implemented:
where α is the phase fraction of water in the domain.
2.5. Bedload Transport
The bedload transport in SSF follows the method detailed in Roulund et al. [31] and implemented in OpenFOAM by Jacobsen [20]. The overall equation used is:
where qb is the bedload transport rate vector, dA is the median diameter of type A sediment, pef is the probability of moving particles near the bed Equation (6), and ub is the mean velocity vector of a bedload particle Equation (8).
where μd is the dynamic friction coefficient (set to a constant value of 0.6), θA is the Shields parameter or dimensionless shear stress applied on bedload particles Equation (7), and θC,A is the bed critical Shields parameter to initiate motion. It is important to note that the bedload transport rate calculations are only initiated when θA values are greater than θC,A.
where τ is the dimensioned shear stress applied by the flow, ρB is the bed sediment density, uf is the friction velocity vector (calculated through the turbulence model in OpenFOAM), s is the relative sediment density to the fluid (= ρs/ρ), and ||X|| represents the magnitude of a vector X.
In 2-D models, the calculation of ub can be approximated by [32]:
where uτ is the near bed tangential velocity.
In 3-D models, the calculation of ub is more complicated and involves solving a system of nonlinear equations based on the forces acting on a bedload particle. This has been implemented in SSF based on the method detailed in Roulund et al. [31], but is not detailed in this manuscript due to the subsequent use of 2-D flow models.
2.6. Critical Shields Parameter
Traditionally, the critical Shields parameter of a sediment is determined by referring to the Shields diagram and matching the diameter of the deposited sediment to the appropriate critical Shields parameter. For ease of use, SSF utilizes an equation fitted to the Shields diagram to determine the initial critical Shields parameter of Type A sediment [33]:
where θC0,A and d*,A are the initial critical Shields parameter and dimensionless diameter of a Type A sediment. The latter is defined for a sediment fraction i as
where d*i, di, and si are the dimensionless diameter, diameter, and relative sediment density of a sediment fraction i, respectively.
However, Shields diagram does not extend to finer sediments, requiring two different equations to be utilized for the initial critical Shields parameter of sediment Types C and E [34]:
where θc0,E/C and d*E/C is the initial critical Shields parameter and dimensionless diameter, respectively, of sediment Types C or E.
To account for the different sediment stabilization processes in sewers, the initial critical Shields parameter values from Equations (9), (11), and (12) are modified based on three main factors: a deposition factor (ϕD), an erosion factor (ϕE), and the morphology of the deposited bed (ϕM). Hence, the final critical Shields parameter was calculated through:
where θC,i and θCo,i are the final and initial critical Shields parameter, respectively, for a sediment fraction i.
Field observations indicate that the stabilization of newly deposited sediment beds in sewers occurs in the scale of a few hours [2]. Further, pilot sewer investigations have shown that sediment deposition can occur for several days under low flow conditions even when the flow velocity increases after some initial deposition [35]. These complex stabilization processes have been incorporated using a somewhat simplistic method in SSF, whereby ϕD is increased from a default value of one based on increasing applied shear stress from flow velocity until a user set maximum bed height is achieved:
where θi, θio, and θi,max are the shear stresses applied on a sediment fraction i, expressed as a dimensionless Shields parameter, at the current time step, at the beginning of the simulation, and when deposited bed height is at hmax respectively, h is the total height of the deposited bed, hmax is a user-set maximum deposited bed height at which deposition scaling stops, tdep is the time for which deposition has been occurring, and tdsp is a user-set time after which the deposition scaling initiates. This equation results in an increase in the critical Shields parameter of a sediment after deposition occurs for tdsp seconds until a maximum bed height is reached, after which it remains constant.
Similarly, ϕE is used to simulate an important behavior in the erosion of sewer sediments: the bed can be eroded relatively easily until a certain depth, where it has consolidated and/or settled, and needs a higher shear stress to erode further [18]. Hence, during erosion, the critical Shields parameter of the sediment fractions increase linearly from their initial values to a user-defined maximum value until a third of the bed is eroded, after which it remains constant at the maximum value. To achieve this change, ϕE is calculated through:
where her is the current depth of erosion, hesp is the setpoint of erosion depth at which erosion scaling starts to occur, θC0,i is the initial critical Shields parameter of a sediment fraction i calculated through Equations (9), (11), and (12), and θCmax,i is the maximum critical Shields parameter of a sediment fraction i set by the user.
Lastly, to account for the variation in the critical Shields parameter from the changing bed morphology due to deposition and/or erosion, ϕM is calculated through [31]:
where β is the angle between the deposited bed and the horizontal plane, σ is the angle between the steepest bed slope and the predominant flow direction, and μs is the static friction coefficient.
2.7. Bed Morphology
The basic form of the Exner equation to model the height of the deposited bed (h) is [16]:
where n is the bed porosity, ∙qb is the divergence of the bedload transport rate, SSE is the erosion rate of suspended sediment from the bed, and SSD is the deposition rate of suspended sediment onto the bed.
Equation (17) is modified to include both the suspended sediment fractions, the effect of the sediment proportions on the bedload components, and to solve only for the change in height to obtain the final bed morphology equation implemented:
where ∂t is approximated to the timestep of the simulation, PA is the proportion of type A sediment in the bed, SSE,C and SSE,E are the erosion rate of suspended sediment types C and E, respectively, and SSD,C and SSD,E are the deposition rates of both suspended sediment types.
·qb is calculated from qb values obtained through Equation (5). Some filtering is in place to prevent instabilities in bed height from the ·qb term around the boundaries of the bed and to conserve mass by preventing deposition changes beyond the existing volume of bedload sediment.
SSE,C and SSE,E are calculated empirically using CE, the equilibrium concentration of suspended sediment at a reference height [36]:
where SSE,i is the erosion rate of suspended sediment type i, Pi is the proportion of suspended sediment i in the bed, and CE,i is defined as:
where Href is the reference height i.e., the height of the first cell from the bed in the computational mesh [33] and T*,i is the transport stage parameter of a sediment i defined as:
where θi is the Shields parameter applied on a suspended sediment type i in the bed, calculated using Equation (7), and θCi is the critical Shields parameter of the same sediment type.
The deposition rate of suspended sediment can be determined more easily using the concentration of the suspended sediment in the cells above the bed, CB,i [16]:
The feedback from suspended sediment deposition and erosion on the concentrations of both sediment types within the fluid, i.e., increasing concentrations during erosion and decreasing during deposition, are also incorporated by modifying CB values through [33]:
where CB,it+1 is the bed concentration in the next time step and CB,it is the bed concentration in the current time step for a sediment type i.
2.8. Model Implementation
A summary of the implementation of the different parts of SSF and their interactions, shown in Figure 2, illustrates that it can be broken down into four main components: flow, Suspended Sediment (SS) transport, Bedload (BL) transport, and bed morphology. Each of these interdependent components occur in every time step of the simulation, provided some conditions are met, and contribute to calculating the change in the height of the deposited bed mesh. Initially, a stable flow is developed in a computational mesh representing a sewer before the introduction of suspended sediment in the form of an inlet concentration and the calculation of a bedload transport rate in the cells of the mesh representing the deposited bed. Subsequently, the difference in height due to erosion or deposition for each cell in the deposited bed, or finite area mesh, is calculated using the solution to Equation (18). These differences in height are then interpolated from the cells to all the points in the finite area mesh using OpenFOAM’s primitivePatchInterpolation. Finally, the deposited bed is moved based on the point interpolated values using OpenFOAM’s dynamicMotionSolver, resulting in changes in the overall sewer mesh structure and subsequently, to altered hydrodynamic flow. This cycle repeats until a stable deposited bed height is reached based on flow conditions and sediment properties.
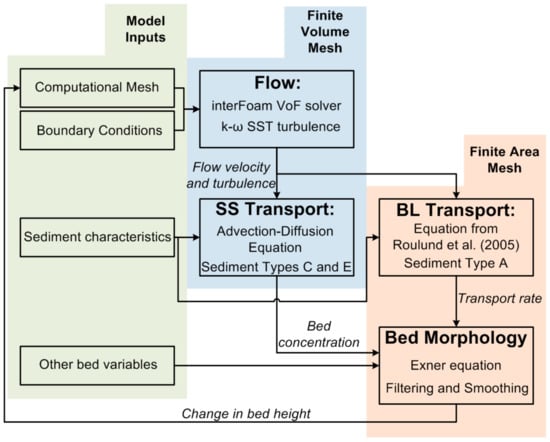
Figure 2.
A flowchart representing the overall framework of the SSF solver and the interactions between the major components, i.e., flow, Suspended Sediment (SS) transport, Bedload (BL) transport, and bed morphology. The green shading indicates initial user inputs, the blue shading indicates processes that occur within the Finite Volume mesh, and the orange shading represents processes in the Finite Area deposited bed mesh.
3. Model Validation
The following sections focus on validating SSF for a relatively large-scale sediment deposition and erosion event involving multiple sediment classes in a sewer. The main challenge for this validation was finding suitable case studies that contained enough data to initiate the hydrodynamic, sediment, and deposited bed modules of SSF. Furthermore, a somewhat simple or compact sewer geometry was ideal, due to the long run times of CFD models. SSF also has some limitations to parallelization which could only be partially addressed, resulting in long run times even for compact geometries. These limitations predominantly arise from the implementation of the finite area mesh in SSF, which require the entire deposited bed area to be assigned to one processor for the finite area calculations to occur correctly. To address this limitation, the mesh geometries were simplified to 2-D models to reduce run times significantly. The simplification of the models to 2-D also solved another issue around meshing any complex geometries for case studies, which would have been a significant task.
3.1. Sediment Deposition
The case study for sediment deposition is based on data published in Regueiro-Picallo et al. [35] from a pilot plant in A Coruña Wastewater Treatment Plant (WWTP) in A Coruña, Spain. The pilot plant consists of two 8 m long plastic sewers, one circular and the other egg-shaped, with an adjustable slope. Screened wastewater from the WWTP was made to flow through both sewers while measuring deposited bed height and flow characteristics. Sediment deposition was induced in the experiments by setting the flow height at the outlet of the pipes to 100 mm using a gate [35]. Two experiments using the circular pipe while it had a 0.2% slope, i.e., Scenarios 6 and 7 from Regueiro-Picallo et al. [35], are modelled in this validation study.
3.1.1. Mesh Setup and Flow Initialization
The 2-D mesh used for both scenarios was generated using OpenFOAM’s blockMesh utility and consists of 33,000 hexahedral cells. This mesh represents a thin central slice of the circular sewer pipe. An additional 2 m of length was added as an inlet section prior to the pilot plant sewer’s 8 m length to develop the flow velocity resulting in a total length of 10 m along the x-axis with a 0.2% slope. The height of the mesh, along the z-axis, is 0.3 m to reflect the diameter of the sewer pipe.
In OpenFOAM, the boundaries of the mesh are defined as patches or walls, based on whether flow can pass through them or not, respectively. In this case, the two main patches are the inlet and the outlet of the mesh while the rest of the boundaries behave as walls (Figure 3). Fixed magnitudes of velocity y (u), turbulence boundary conditions (turbulent energy, k, and specific dissipation rate, ω), and volume fraction (α) are introduced through the lower section of the inlet to simulate the flow of wastewater through the channel. The remaining boundary conditions were set according to general two-phase pipe flow requirements for interFoam detailed in Shuard et al. [37]. The bed was modelled as a rough wall with a roughness height, ks, of 0.5 mm as this produced the closest results to the experimental data; this was achieved by modelling the turbulent viscosity, νt, of the bed with OpenFOAM’s rough wall function, nutRoughWallFunction. The mesh was refined sufficiently to enable the use of wall functions for all turbulence parameters at the walls. Lastly, the timestep of the simulation and the mesh refinement were balanced to achieve a maximum Courant number of 0.8.
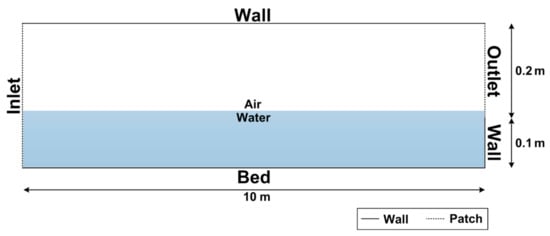
Figure 3.
Conceptual diagram of the A Coruña pilot sewer mesh illustrating the boundary definitions and water level. Please note that this diagram is not to scale.
The published velocity results in Regueiro-Picallo et al. [35] only include one data point along the pilot sewer for Scenario 6. However, Scenarios 6 and 7 have very similar flow characteristics and the results are likely to be very similar for both. After a stable flow height and velocity were established, the modelled flow velocity in the middle of the sewer, 6 m from the inlet, matches up very closely with the experimental results (Figure 4). The experimental velocity data was measured after one day of sediment deposition occurred in the pilot sewer and this may have resulted in the slight increase in velocity in the middle of the flow area as compared to the model values.
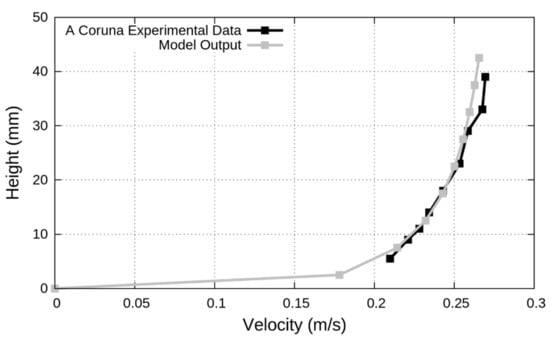
Figure 4.
Velocity magnitude results at the lower flow area after 1 day of deposition from the A Coruña pilot plant experiments and 6 m from the inlet of the model prior to any deposition occurring.
3.1.2. Sediment and Deposited Bed Module Setup
Two different sediment input regimes were implemented in the A Coruña experiments, by utilizing a mixer in the input tank to introduce larger and/or denser sediments into the sewer during Scenario 7 and having the mixer off for Scenario 6. The use of the mixer resulted in both additional deposition and larger sediments being present in the bed. The average sediment diameters in the deposited bed were 240 and 177 µm for the mixing and non-mixing scenarios, respectively. The average bed sediment density for both scenarios was 1460 kg/m3. The effect of the mixing on the characteristics of the overall influent sediment appears to have been more complicated with a reduction in diameter of volatile solids and increase in diameter of non-volatile solids [35].
To reduce the complexity of the overall sediment inputs into SSF, only two sediments were modelled for both scenarios: a suspended Type C sediment and a Type A sediment transported as bedload. Initial model runs were used to determine the ideal range for Type C sediment diameter and density for the current flow scenario (Table 2). Low suspended sediment diameters and densities resulted in insufficient concentrations around the bed to cause deposition, and values that were too high resulted in sediment that did not remain suspended throughout the channel. After the Type C sediment diameter and density were determined, Type A sediment characteristics were set to achieve the experimental deposited sediment characteristics assuming that both sediment fractions occurred in roughly equal proportions in the deposited bed. It is important to note that the selected sediment diameter and density values form a rough estimate of the sediment fractions present in the A Coruña wastewater that are likely to settle; they do not encompass all the sediment present in the influent wastewater.

Table 2.
Sediment parameters used in SSF for the A Coruña sediment deposition validation Scenarios 6 and 7.
Initial results for the suspended sediment components of the Exner Equation (17), SSE and SSD, were used to determine the inlet concentration of the Type C sediment fraction for Scenarios 6 and 7. The concentration values obtained and used in the simulations (Table 2) were significantly lower than the measured total suspended solids (TSS) concentrations in the pilot plant experiment. As discussed previously, this is not a cause for concern as SSF is not aiming to model all the sediment in the influent wastewater but only the fraction that is likely to settle. The bedload transport module has no inlet concentration or boundary conditions, instead the bedload transport rate is calculated at each timestep and it has a continuous impact on the deposited bed height through the divergence of the transport rate and the static proportion of sediments in the bed.
The bed heights in the pilot sewer experiments were measured daily for the first four days during both scenarios and once on the seventh day, but only the first four days were modelled in SSF. Even this shortened timeframe would have necessitated very long model run times as the time step for the flow simulation was 0.004 s. However, due to the small magnitude of bed height change over each time step, −1−9 m, it was found that a large scaling factor could be applied to the change in bed height during each time step to speed up the run times with only minor impacts on the final results. The main impact of scaling was a reduced overall stable deposited bed height with little to no change in the deposition pattern. Hence, to speed up the simulation, the change in bed height was scaled to 100 times its value each time step alongside a small increase in the inlet concentrations to counteract the reduced bed height.
SSF was run with the initial boundary conditions (Table 2) and a 100-time scaling of change in bed height until a stable deposited bed was maintained for an equivalent time of around 5 h. This occurred close to the end of the Day 1 in both scenarios and was assumed to be maintained until the end of Day 2. After this, the effects of further bed stabilization due to biological and consolidation effects, which lead to continued deposition in the experiments after Day 2, need to be accounted for. To induce this additional deposition, the maximum bed height for critical Shields parameter scaling, hmax, was changed to the stable deposited bed heights from the end of Day 2. The change in hmax increased the critical Shields parameter for the deposited sediment based on Equation (14). Further, any deposition beyond a maximum bed height, 10 mm for Scenario 6 and 15 mm for Scenario 7, was suppressed to keep the bed height within reasonable limits. Again, SSF was run with the new values of hmax until a stable deposited bed height was maintained for around 5 h, which occurred close to the end of Day 3 and was also used as the deposited bed height value for Day 4.
3.1.3. Results and Discussion
SSF performs reasonably well in replicating the magnitude of average bed height for both Scenarios (Figure 5), especially considering some of the unaccounted uncertainties around variable inflow sediment quantities and sediment consolidation in the pilot plant. The deposition pattern of the sediment bed across the channel for Scenario 6 and 7 was not published or available at the time of this analysis [35]. Based on initial comparisons with the available data, the patterns are similar between the modelled and the experimental scenarios (please refer to Supplementary Material–Text S1 and Figures S1 and S2).
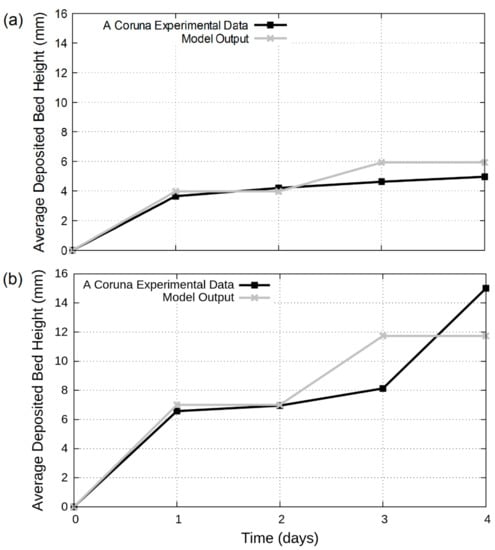
Figure 5.
Measured average deposited bed heights from the A Coruña pilot sewer compared to the modelled SSF average deposited bed height for (a) Scenario 6 and (b) Scenario 7. Please note that the modelled deposited heights have been averaged for the entire length of the sewer channel besides the last 0.2 m in which the change in bed height was suppressed.
The feedback between increasing deposited bed height and changing flow velocity, is also observed clearly in both Scenarios with increasing maximum flow velocity as the deposited bed height increases (Scenario 7 results in Figure 6).
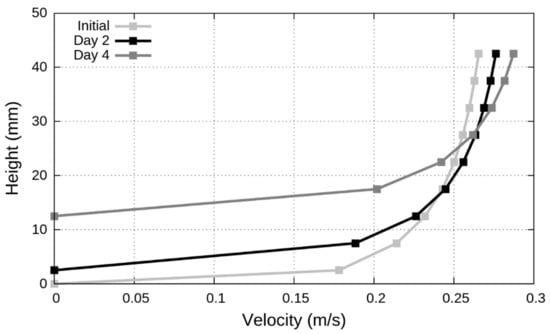
Figure 6.
Modelled velocity magnitude 6 m from the inlet of the pilot sewer for Scenario 7 in the initial case, after 2 days of bed deposition, and after 4 days of bed deposition.
3.2. Sediment Erosion
The selection of an appropriate case study to validate SSF under erosion conditions proved to be significantly more challenging than in the deposition case. A number of studies detail different erosion scenarios in sewers [18,38,39], but these studies are mainly based on longer stretches of sewers in the field; which limits the quantity and granularity of any of data that is collected. All the case studies have some critical data limitations for flow and/or sediment characteristics, so this section is focused on analyzing the functionality of SSF for erosion scenarios rather than a detailed validation, for which there is insufficient data in the literature at the time of this analysis. Data from the case study of a sewer sediment erosion event in Paris, France induced by flushing through a hydraulic gate is used in the SSF erosion analysis [38]. This case study is a large trunk sewer that is over 3 m in height, consisting of a roughly circular upper two thirds, a roughly rectangular channel (or cunette) in the bottom third, and side walkways along the top of the rectangular channel. There is detailed published information on the sediment characteristics for this case study, but there is limited data available on the flow characteristics and suspended solids concentration during the erosion.
Shahsavari et al. [38] monitored five locations across 1100 m of the trunk sewer in Paris. A total of 10 m of this sewer is modelled in SSF based on a location 5 m after the hydraulic flushing gate, S+5 in Shahsavari et al. [38], which has little to no pipe slope. Further, the area of interest in this case study is the lower rectangular channel of the sewer where the deposition and erosion of sediment occur. Hence, in the SSF model, only this area is meshed to reduce the complexity of the simulation.
3.2.1. Mesh Setup and Flow Initialization
As in the previous deposition case, a 2-D mesh was developed for the erosion analysis using OpenFOAM’s blockMesh utility consisting of 96,000 cells. The 2-D mesh represents a thin central slice of a 10 m section of the rectangular channel at the bottom of the Paris trunk sewer (Figure 7). The height of the actual channel is around 1 m, which was reduced to 0.9 m in the mesh to incorporate a pre-existing deposited sediment bed.
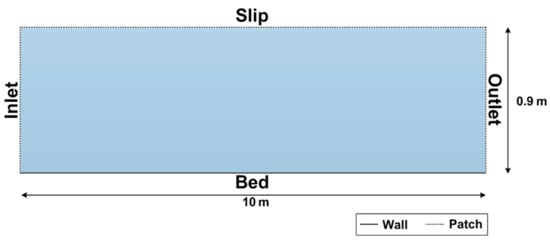
Figure 7.
Conceptual outline of the boundary conditions and mesh representing a section of the Trunk Sewer from Paris.
As the flow height during the erosion event is higher than the rectangular channel in the sewer, no free surface between the water and air was modelled. Instead, the mesh was considered as a channel completely filled with water where the top boundary, Slip, is modelled as a patch with a slip boundary condition imposed on most parameters; this makes the Slip patch have little to no impact on the flow velocity and turbulence. The simulation was also initiated with a completely full channel to ensure that no free surface develops. The roughness height of the bed, ks, was increased to 5 mm based on the increased sediment diameters in this case and wall functions were used for all turbulence parameters at the walls. Besides these changes, the other boundary conditions are similar to the previous deposition case. A constant average flow velocity was calculated for the inlet boundary condition based on the available parameters, flow height and volumetric flow rate, and the cross-sectional area of the sewer to represent the peak flow velocity experienced during the flush [38]. However, this value does not consider the impacts of the sewer geometry which are likely to be significant. The calculated value was increased slightly to incorporate the likely higher flow velocities in the narrower lower channel to obtain a final inlet value of 1.8 m/s, representing the peak flow during the flushing. The lack of detailed flow velocity measurements within the channel is a major reason for the inability to use this case study as a complete validation for SSF’s erosion.
3.2.2. Sediment and Deposited Bed Setup
Two sediment fractions, Type A and Type E, were used in the Paris trunk sewer SSF model. Organic Type C sediment is not included in this analysis due to the low measured proportion of organic sediments deposited in the sewer [38]. The measured bed sediment diameter and density measurements from Shahsavari et al. [38] were used to determine the Type A and E sediment characteristics (Table 3). To model the change in composition of the sediment bed during the erosion event, a dynamic proportion of the sediments in the bed is used. An initial uniform 10-cm thick deposited bed is eroded in the model, which is higher than the recorded pre-erosion average value for the sewer section, 5.6 cm, to incorporate for the lack of slope in this section [38]. To include the introduction of Type A bedload sediment during the erosion, the filtering of the bedload component of the Exner Equation (18) to conserve mass was relaxed to allow for increased bedload deposition based on how much time had passed in the simulation.

Table 3.
Sediment module parameters used in SSF for erosion functionality analysis.
Using these sediment boundary conditions, five erosion cases (Table 4), Erosion Case (EC) 1 to 5, were modelled to test the sensitivity of the erosion magnitude to the consolidation of the deposited bed and the quantity of suspended sediment introduced to the system, as these parameters play a significant part in the erosion calculations of SSF. The consolidation of the bed was varied by changing the reference critical Shields parameter at the bottom of the deposited bed, θCmax. The inlet suspended sediment concentration of Type E sediment, CE, was varied to change the quantity of suspended sediment in the sewer. A baseline CE value, 40 mg/L, was determined with initial model runs to result in a suspended sediment deposition rate that was less than half the magnitude of the erosion rate. Lastly, as the entire height of the flow is not modelled, the suspended sediment does not settle in a realistic way across the channel. To avoid this issue, SSF was modified so that the inlet suspended sediment does not settle through the impact of Equation (4) and remains constant across the channel. However, any eroded suspended sediment from the deposited bed settles normally. All five erosion cases were run until a stable bed height was achieved.

Table 4.
Summary of difference in sediment consolidation magnitude, θCmax, and inlet suspended sediment concentration, CE, for the different erosion cases. θCi refers to the final critical Shields parameter calculated using Equation (13) for a sediment fraction i.
3.2.3. Results and Discussion
A stable bed height was achieved in all erosion cases in a much smaller period of time, ≈100 s, than during deposition, reflecting the shorter time scales required for bed erosion to take place. During all the erosion cases, the magnitude of erosion drops sharply until it stops completely at around 100 s after which a stable sediment proportion occurred (EC2 results in Figure 8). The dynamic proportion of the sediment fractions in the bed reveals that the majority of eroded sediment from the deposited bed is the suspended Type E fraction (EC2 results in Figure 8), with their proportion in the bed more than halving from an initial value of 0.5 to 0.23 at the end of the EC2 simulation. This is in line with the experimental results, where an increase in average sediment diameter in the deposited bed was seen in the areas around the hydraulic gate after the flush [38]. In the simulation, the eroded suspended sediments were transported in the flow and resulted in a higher concentration of sediment around the bed in proportion to the quantity of sediment eroded. This was also observed in the field results, where increased turbidity was recorded near the bed during erosion [38].
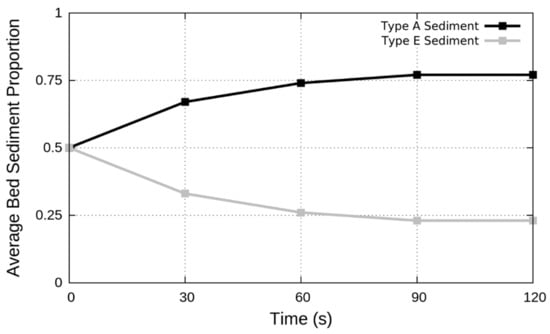
Figure 8.
Type A and E sediment proportion in the deposited bed during the EC2 simulation.
When all the cases had stable deposited beds, the variation in quantity of bed eroded due to the different inlet suspended sediment concentrations was significant (Figure 9a). A three times increase in concentration from 20 to 60 mg/L resulted in about 15% less erosion. The impact of the consolidation multiplier, the magnitude of increase between the reference and the calculated critical Shields parameter, i.e. θCmax/θCo,i, was not as significant, with less than a 2% decrease when it was changed from two to four times the initial critical Shields parameter (Figure 9b). The lack of impact from the bed consolidation multiplier is likely due to the applied Shields parameter from the flow being greater than several times the suspended sediment’s critical Shields parameter combined with the erosion of suspended sediment being the driver for most of the change in bed height. Overall, the quantity of the bed eroded in all the simulated cases, which range between 31% and 44.6% of the bed, is higher than the recorded value in the field, which was around 21% on average for 850 m of sewer after the flushing gate [38]. This indicates that the equivalent inlet sediment concentration and/or consolidation multiplier values used in the simulations probably need to be higher; however, the data limitations for this case study, particularly the velocity patterns in the lower channel, makes it difficult to establish this with any certainty. Overall, although SSF is not validated for a large magnitude erosion event, the initial results do appear to follow the expected patterns of erosion seen in the field and reasonable results can be obtained through the correct selection of simulation parameters.
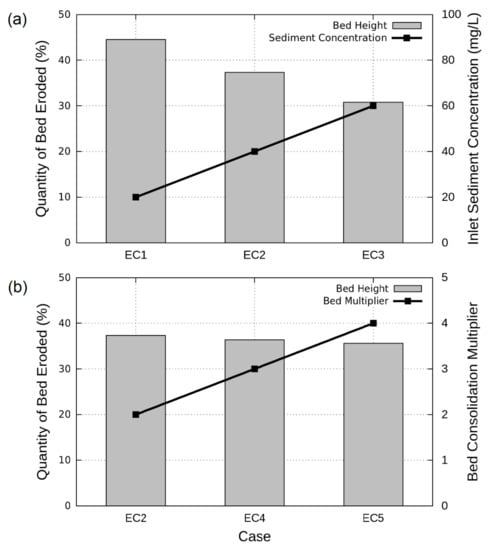
Figure 9.
Quantity of bed eroded at the end of the (a) EC1, EC2, and EC3 simulations and the inlet Type E sediment concentrations used in the simulations and (b) EC2, EC4, and EC5 simulations and the bed consolidation multiplier, the magnitude of increase between the reference, and the calculated critical Shields stress, i.e. θCmax/θCo,i, used in the simulations.
4. Conclusions
Building on existing methodologies in sewer and surface water sediment modelling, a detailed, local-scale sewer sediment model, SewerSedFoam, was developed in the OpenFOAM CFD platform. Based on the results, SSF appears to be able to model the variation in deposited bed height and morphology in sewers due to multiple sediment classes, particularly during sediment deposition events. The impact of the bed deposition and erosion on flow velocity is also well captured due to the implementation of a dynamic mesh that moves in response to bed deposition and erosion as well as the detailed CFD hydrodynamic flow and turbulence modelling. Further, bed stabilization processes during erosion and deposition with some parametrization have also been implemented through a dynamic critical Shields parameter for all sediment classes.
Flow data is particularly important for SSF to work effectively, especially when the sewer geometry is complex, making velocity hard to estimate from the flow rate. The lack of this and other data in existing sewer erosion case studies made it difficult to validate a large magnitude erosion event in SSF. The development of likely flow erosion and deposition scenarios for use in a ‘typical’ sewer may be a solution to the lack of data in some instances. Future work on SSF can focus on improving some of the modules, particularly in a more comprehensive implementation of sediment stabilization though biofilm development processes. The implementation of multiple bedload sediment classes may also be useful for some case studies with larger and denser sewer sediments. Using an Einstein-type bedload equation with the incorporation of improvements such as a random walk model [40] instead of Equation (5) may be a better option to capture the variability of bedload transport across time. Improvements can also be made to suspended sediment modelling by using techniques such as fractional Advection-Diffusion equations to enhance the modelling of larger suspended sediment particles [41]. Lastly, SSF is quite computationally intensive, resulting in the use of 2-D flow models in all cases thus far; hence, a more detailed analysis on improving the parallelization of the finite area mesh and the computational efficiency of the model can also be undertaken to start utilizing the model with 3-D flow modelling.
Despite these drawbacks, SSF can be used in its current state to estimate the magnitude of excess sediment deposition issues in smaller lengths of sewers. The main field data requirements to use SSF are the average minimum and maximum flow velocity in the sewer, through direct measurement or estimation using flow height and/or flowrate, to model sediment deposition and erosion, respectively. A general ideal of sediment inputs based on location and the catchment can also help to estimate the quantities of the different sediment proportions in the sewer. Information on sewer geometry, such as sewer size and slope, is also critical to construct the computational mesh and initiate SSF models. Even if there is some critical data missing, an approximation can be made using data from literature or a sensitivity analysis can be performed on the impact of different sediment characteristics, as was performed for the sediment erosion scenarios in this manuscript. Both the SSF solver and data files from the case studies presented in this manuscript are available for download (availability detailed in Supplementary Materials Text S2).
With increasing priorities globally on reducing water consumption and increasing water recycling, it is likely that sewers will face a transitionary period of reduced inflows and increased sediment concentrations. The use of modelling tools, alongside field and pilot plant experiments, will play an important part in maintaining the integrity of critical water infrastructure during this period. Hence, models, such as SSF, can play a vital role in this transition by being used in the analysis of any potential excess sewer sediment deposition issues during these transitory periods and ease the overall shift towards more sustainable water systems.
Supplementary Materials
The following are available online at https://www.mdpi.com/2073-4441/12/1/270/s1, Text S1: Sediment deposition patterns, Figure S1: Modelled bed height patterns, Figure S2: Experimental bed height patterns, Text S2: Model and data availability.
Author Contributions
Conceptualization, M.K.M., M.R.H., A.G. and Z.Y.; methodology, M.K.M. and M.R.H.; software, M.K.M.; data curation, M.K.M.; writing—original draft preparation, M.K.M.; writing—review and editing, M.R.H. and A.G.; visualization, M.K.M.; supervision, M.R.H., A.G. and Z.Y. All authors have read and agreed to the published version of the manuscript.
Funding
This research was funded by the Cooperative Research Centre for Water Sensitive Cities through project C3.1 “Managing Interactions between Centralised and Decentralised Water Systems”.
Acknowledgments
The first author, Madhu K Murali, also received an Australian Postgraduate Award to conduct this research.
Conflicts of Interest
The authors declare no conflict of interest.
References
- Banasiak, R.; Tait, S. The reliability of sediment transport predictions in sewers: Influence of hydraulic and morphological uncertainties. Water Sci. Technol. 2008, 57, 1317–1327. [Google Scholar] [CrossRef] [PubMed]
- Ashley, R.M.; Bertrand-Krajewski, J.L.; Hvitved-Jacobsen, T.; Verbanck, M.A. Solids in Sewers: Characteristics, Effects and Control of Sewer Solids and Associated Pollutants; IWA Publishing: Cornwall, UK, 2004; p. 340. [Google Scholar]
- Murali, M.K.; Hipsey, M.R.; Ghadouani, A.; Yuan, Z. The development and application of improved solids modelling to enable resilient urban sewer networks. J. Environ. Manag. 2019, 240, 219–230. [Google Scholar] [CrossRef] [PubMed]
- Marleni, N.; Gray, S.; Sharma, A.; Burn, S.; Muttil, N. Impact of water management practice scenarios on wastewater flow and contaminant concentration. J. Environ. Manag. 2015, 151, 461–471. [Google Scholar] [CrossRef] [PubMed]
- DeZellar, J.T.; Maier, W.J. Effects of Water Conservation on Sanitary Sewers and Wastewater Treatment Plants. J. Water Pollut. Control Fed. 1980, 52, 76–88. [Google Scholar] [CrossRef]
- Penn, R.; Schutze, M.; Friedler, E. Modelling the effects of on-site greywater reuse and low flush toilets on municipal sewer systems. J. Environ. Manag. 2013, 114, 72–83. [Google Scholar] [CrossRef]
- Langeveld, J.G.; Schilperoort, R.P.S.; Weijers, S.R. Climate change and urban wastewater infrastructure: There is more to explore. J. Hydrol. 2013, 476, 112–119. [Google Scholar] [CrossRef]
- Marleni, N.; Gray, S.; Sharma, A.; Burn, S.; Muttil, N. Impact of water source management practices in residential areas on sewer networks a review. Water Sci. Technol. 2012, 65, 624. [Google Scholar] [CrossRef]
- Verbanck, M.A. Computing near-bed solids transport in sewers and similar sediment-carrying open-channel flows. Urban Water 2000, 2, 277–284. [Google Scholar] [CrossRef]
- Butler, D.; May, R.W.P.; Ackers, J.C. Sediment Transport in Sewers Part 1: Background. Proc. Inst. Civ. Eng. Water Marit. Energy 1996, 118, 103–112. [Google Scholar] [CrossRef]
- Ashley, R.M.; Verbanck, M.A. Mechanics of sewer sediment erosion and transport. J. Hydraul. Res. 1996, 34, 753–770. [Google Scholar] [CrossRef]
- Creaco, E.; Bertrand-Krajewski, J.-L. Numerical simulation of flushing effect on sewer sediments and comparison of four sediment transport formulas. J. Hydraul. Res. 2009, 47, 195–202. [Google Scholar] [CrossRef]
- Butler, D.; Davies, J.W. Urban Drainage: Second Edition; Taylor and Francis: London, UK, 2004. [Google Scholar]
- Langeveld, J.G.; Veldkamp, R.G.; Clemens, F. Suspended solids transport: An analysis based on turbidity measurements and event based fully calibrated hydrodynamic models. Water Sci. Technol. 2005, 52, 93–101. [Google Scholar] [CrossRef] [PubMed]
- Sattar, A.M.A.; Jasak, H.; Skuric, V. Three dimensional modeling of free surface flow and sediment transport with bed deformation using automatic mesh motion. Environ. Model. Softw. 2017, 97, 303–317. [Google Scholar] [CrossRef]
- Liu, X.; Garcia, M. Three-Dimensional Numerical Model with Free Water Surface and Mesh Deformation for Local Sediment Scour. J. Waterw. Port Coast. Ocean Eng. 2008, 134, 203–217. [Google Scholar] [CrossRef]
- García, M. ASCE Manual of Practice No. 110—Sedimentation Engineering: Processes, Measurements, Modeling and Practice; American Society of Civil Engineers: Reston, VA, USA, 2006; pp. 1–4. [Google Scholar] [CrossRef]
- Saul, A.; Skipworth, P.; Tait, S.; Rushforth, P. Movement of Total Suspended Solids in Combined Sewers. J. Hydraul. Eng. 2003, 129, 298–307. [Google Scholar] [CrossRef]
- Hrissanthou, V.; Hartmann, S. Measurements of critical shear stress in sewers. Water Res. 1998, 32, 2035–2040. [Google Scholar] [CrossRef]
- Jacobsen, N.G. A Full Hydro-and Morphodynamic Description of Breaker Bar Development. Ph.D. Thesis, DTU Mechanical Engineering, Kongens Lyngby, Denmark, 2011. [Google Scholar]
- The OpenFOAM Foundation. Features of OpenFOAM. Available online: http://www.openfoam.org/features/ (accessed on 15 June 2019).
- Hirt, C.W.; Nichols, B.D. Volume of fluid (VOF) method for the dynamics of free boundaries. J. Comput. Phys. 1981, 39, 201–225. [Google Scholar] [CrossRef]
- Jiang, C.; Chen, J.; Yao, Y.; Liu, J.; Deng, Y. Study on threshold motion of sediment and bedload transport by tsunami waves. Ocean Eng. 2015, 100, 97–106. [Google Scholar] [CrossRef]
- Deshpande, S.S.; Anumolu, L.; Trujillo, M.J. Evaluating the performance of the two-phase flow solver interFoam. Comput. Sci. Discov. 2012, 5, 14016. [Google Scholar] [CrossRef]
- Hoang, D.A.; van Steijn, V.; Portela, L.M.; Kreutzer, M.T.; Kleijn, C.R. Benchmark numerical simulations of segmented two-phase flows in microchannels using the Volume of Fluid method. Comput. Fluids 2013, 86, 28–36. [Google Scholar] [CrossRef]
- OpenCFD Ltd. OpenFOAM User Guide: Schemes. Available online: https://www.openfoam.com/documentation/guides/latest/doc/guide-schemes.html (accessed on 10 September 2019).
- Tukovic, Z.; Jasak, H. A Moving Mesh Finite Volume Interface Tracking Method for Surface Tension Dominated Interfacial Fluid Flow. Comput. Fluids 2012, 55, 70–84. [Google Scholar] [CrossRef]
- Crabtree, R.W. Sediments in Sewers. Water Environ. J. 1989, 3, 569–578. [Google Scholar] [CrossRef]
- Graf, W.H. Hydraulics of Sediment Transport; McGraw-Hill: New York, NY, USA, 1971. [Google Scholar]
- Brown, P.P.; Lawler, D.F. Sphere Drag and Settling Velocity Revisited. J. Environ. Eng. 2003, 129, 222–231. [Google Scholar] [CrossRef]
- Roulund, A.; Sumer, B.M.; Fredsøe, J.; Michelsen, J. Numerical and experimental investigation of flow and scour around a circular pile. J. Fluid Mech. 2005, 534, 351–401. [Google Scholar] [CrossRef]
- Engelund, F.; Fredsøe, J. A Sediment Transport Model for Straight Alluvial Channels. Nord. Hydrol. 1976, 7, 293–306. [Google Scholar] [CrossRef]
- Zhou, L. Numerical Modelling of Scour in Steady Flows. Ph.D. Thesis, Universite de Lyon, Lyon, France, 2017. [Google Scholar]
- van Rijn, L. Unified View of Sediment Transport by Currents and Waves. I: Initiation of Motion, Bed Roughness, and Bed-Load Transport. J. Hydraul. Eng. 2007, 133, 649–667. [Google Scholar] [CrossRef]
- Regueiro-Picallo, M.; Naves, J.; Anta, J.; Suárez, J.; Puertas, J. Monitoring accumulation sediment characteristics in full scale sewer physical model with urban wastewater. Water Sci. Technol. 2017, 76, 115–123. [Google Scholar] [CrossRef]
- van Rijn, L. Sediment Transport, Part II: Suspended Load Transport. J. Hydraul. Eng. 1984, 110, 1613–1641. [Google Scholar] [CrossRef]
- Shuard, A.M.; Mahmud, H.B.; King, A.J. Comparison of Two-Phase Pipe Flow in OpenFOAM with a Mechanistic Model. Iop Conf. Ser. Mater. Sci. Eng. 2016, 121, 12018. [Google Scholar] [CrossRef]
- Shahsavari, G.; Arnaud-Fassetta, G.; Campisano, A. A field experiment to evaluate the cleaning performance of sewer flushing on non-uniform sediment deposits. Water Res. 2017, 118, 59–69. [Google Scholar] [CrossRef]
- Mannina, G.; Viviani, G. An urban drainage stormwater quality model: Model development and uncertainty quantification. J. Hydrol. 2010, 381, 248–265. [Google Scholar] [CrossRef]
- Zhang, Y.; Meerschaert, M.M.; Packman, A.I. Linking fluvial bed sediment transport across scales. Geophys. Res. Lett. 2012, 39. [Google Scholar] [CrossRef]
- Chen, D.; Sun, H.; Zhang, Y. Fractional dispersion equation for sediment suspension. J. Hydrol. 2013, 491, 13–22. [Google Scholar] [CrossRef]
© 2020 by the authors. Licensee MDPI, Basel, Switzerland. This article is an open access article distributed under the terms and conditions of the Creative Commons Attribution (CC BY) license (http://creativecommons.org/licenses/by/4.0/).