Article

Effect of a Commercial Air Valve on the Rapid Filling of a Single Pipeline: a Numerical and Experimental Analysis

by
Óscar E. Coronado-Hernández
1,*,
Mohsen Besharat
2,
Vicente S. Fuertes-Miquel
3 and
Helena M. Ramos
2
1
Facultad de Ingeniería, Universidad Tecnológica de Bolívar, Cartagena 131001, Colombia
2
Department of Civil Engineering and Architecture, CERIS, Instituto Superior Técnico, University of Lisbon, Lisbon 1049–001, Portugal
3
Departamento de Ingeniería Hidráulica y Medio Ambiente, Universitat Politècnica de València, Valencia 46022, Spain
*
Author to whom correspondence should be addressed.
Water 2019, 11(9), 1814; https://doi.org/10.3390/w11091814
Submission received: 2 August 2019 / Revised: 27 August 2019 / Accepted: 29 August 2019 / Published: 31 August 2019
(This article belongs to the Special Issue New Challenges in Water Systems)

Abstract

:
The filling process in water pipelines produces pressure surges caused by the compression of air pockets. In this sense, air valves should be appropriately designed to expel sufficient air to avoid pipeline failure. Recent studies concerning filling maneuvers have been addressed without considering the behavior of air valves. This work shows a mathematical model developed by the authors which is capable of simulating the main hydraulic and thermodynamic variables during filling operations under the effect of the air valve in a single pipeline, which is based on the mass oscillation equation, the air–water interface, the polytropic equation of the air phase, the air mass equation, and the air valve characterization. The mathematical model is validated in a 7.3-m-long pipeline with a 63-mm nominal diameter. A commercial air valve is positioned in the highest point of the hydraulic installation. Measurements indicate that the mathematical model can be used to simulate this phenomenon by providing good accuracy.

1. Introduction

Entrapped air inside a liquid in a pressurized pipeline system the cause of numerous serious problems in conveying systems. Specifically, the problem tends to be significantly more substantial when a transient flow scenario exists in the system. The transient flow condition can appear as a consequence of different causes, namely a water hammer event, emptying or filling of a pipeline, pump shut down or start up, the existence of leaks, rapid valve maneuvers, and cavitation occurrence. The aforementioned transient events have been studied extensively in previous studies using different numerical models [1]. The valve maneuver is a crucial issue in pressurized pipelines, in which operating a valve without enough care, might create irretrievable accidents. Azoury et al. [2] studied the effect of a valve closure on water hammer using the method of characteristics. The water hammer numerical simulation in conjunction with a column separation occurrence, was studied by Himr [3], and Simpson and Wylie [4]. Saemi et al. [5] presented a study on two- and three-dimensional calculations of the water hammer flows using computational fluid dynamics (CFD) models. In addition, different studies present the water control issue [6,7,8]. Among the water hammer controlling methods, the air vessel protection device is studied widely due to high reliability [9,10,11,12]. The pipeline draining or emptying is the cause of some pipe buckling events in the real-world due to the existence of air pockets in the system that expand during the emptying process. Based on the polytropic law, the air pocket expansion leads to a pressure drop in the air pocket, which is capable of creating a sub-atmospheric pressure situation. The emptying process has been studied previously numerically and experimentally [13,14,15]. Furthermore, recent works have been developed to understand the behavior of an air pocket and setting operational rules in the emptying process to prevent future accidents. Several works have been published recently on the numerical simulation of the emptying process using one-dimensional (1D) models in case of having air inside a pipe [16,17]. Other works using advanced CFD techniques have been undertaken on the dynamic behavior of an air pocket over drainage and the effect of backflow air entrance [15,18]. During a flow establishment in a partially or fully empty pipeline, which is usually referred to as the filling process, an air compression situation may emerge. The filling process is capable of inducing very huge spikes of pressure that can lead to damage to the pipeline equipment or eventually induce a pipe rupture. Previous studies have focused on different aspects of the filling process under different conditions [19,20,21,22,23]. The thermodynamic behavior of the system plays a significant role in the transient phenomena. They can be categorized into slow and fast transient events. During a slow transient phenomenon, the heat transfer might be important, and generally, they obey the polytropic law [24]. Nevertheless, in a fast transient phenomenon, the heat transfer can be neglected, and for some ranges of the flow condition, the polytropic law is not valid [25]. In this context, the current study endeavors to reveal some aspects of the inconsistent behavior of the air pocket during the filling process. More studies are needed to address the protection devices or methods for all mentioned transient situations. Usually, surge tanks, air vessels, and different operational valves are used in pipeline systems to prevent extraordinary pressure magnitudes. Among them, air valves are widely used due to the simple application and reliability. However, air valves can act unexpectedly in some transient scenarios. The air valves have been studied by different authors to understand the application of an air valve and its effect on the response of the system [26,27,28,29,30]. In a recent study [31], a mathematical model was developed, which was appropriately verified by experimental results to study the various aspects of the emptying and filling processes, including the effect of air valves. The mathematical model revealed that increasing the air valve size will reduce the spike of the pressure head for the filling process condition. But this was challenged widely by real-world problems, an issue that shows the deficiency of current mathematical models in the prediction of the variation of parameters for the filling process. This motivated the authors of this paper to study the effect of the air valve on the filling process more deeply using mathematical models and present the main source of the problem in the formulation. This research explains in detail, the mathematical model, including all hydraulic and thermodynamic formulations in comparison to a previous publication [31] and tackles the experimental and numerical study of the filling process with entrapped air when different air release conditions are provided. This current study provides extensive information about the unusual behavior of an air pocket with different sizes of air releasement. Indeed, plenty of mathematical models exist for the filling process, but in general, the behavior of air valves has not been addressed.

2. Mathematical Model

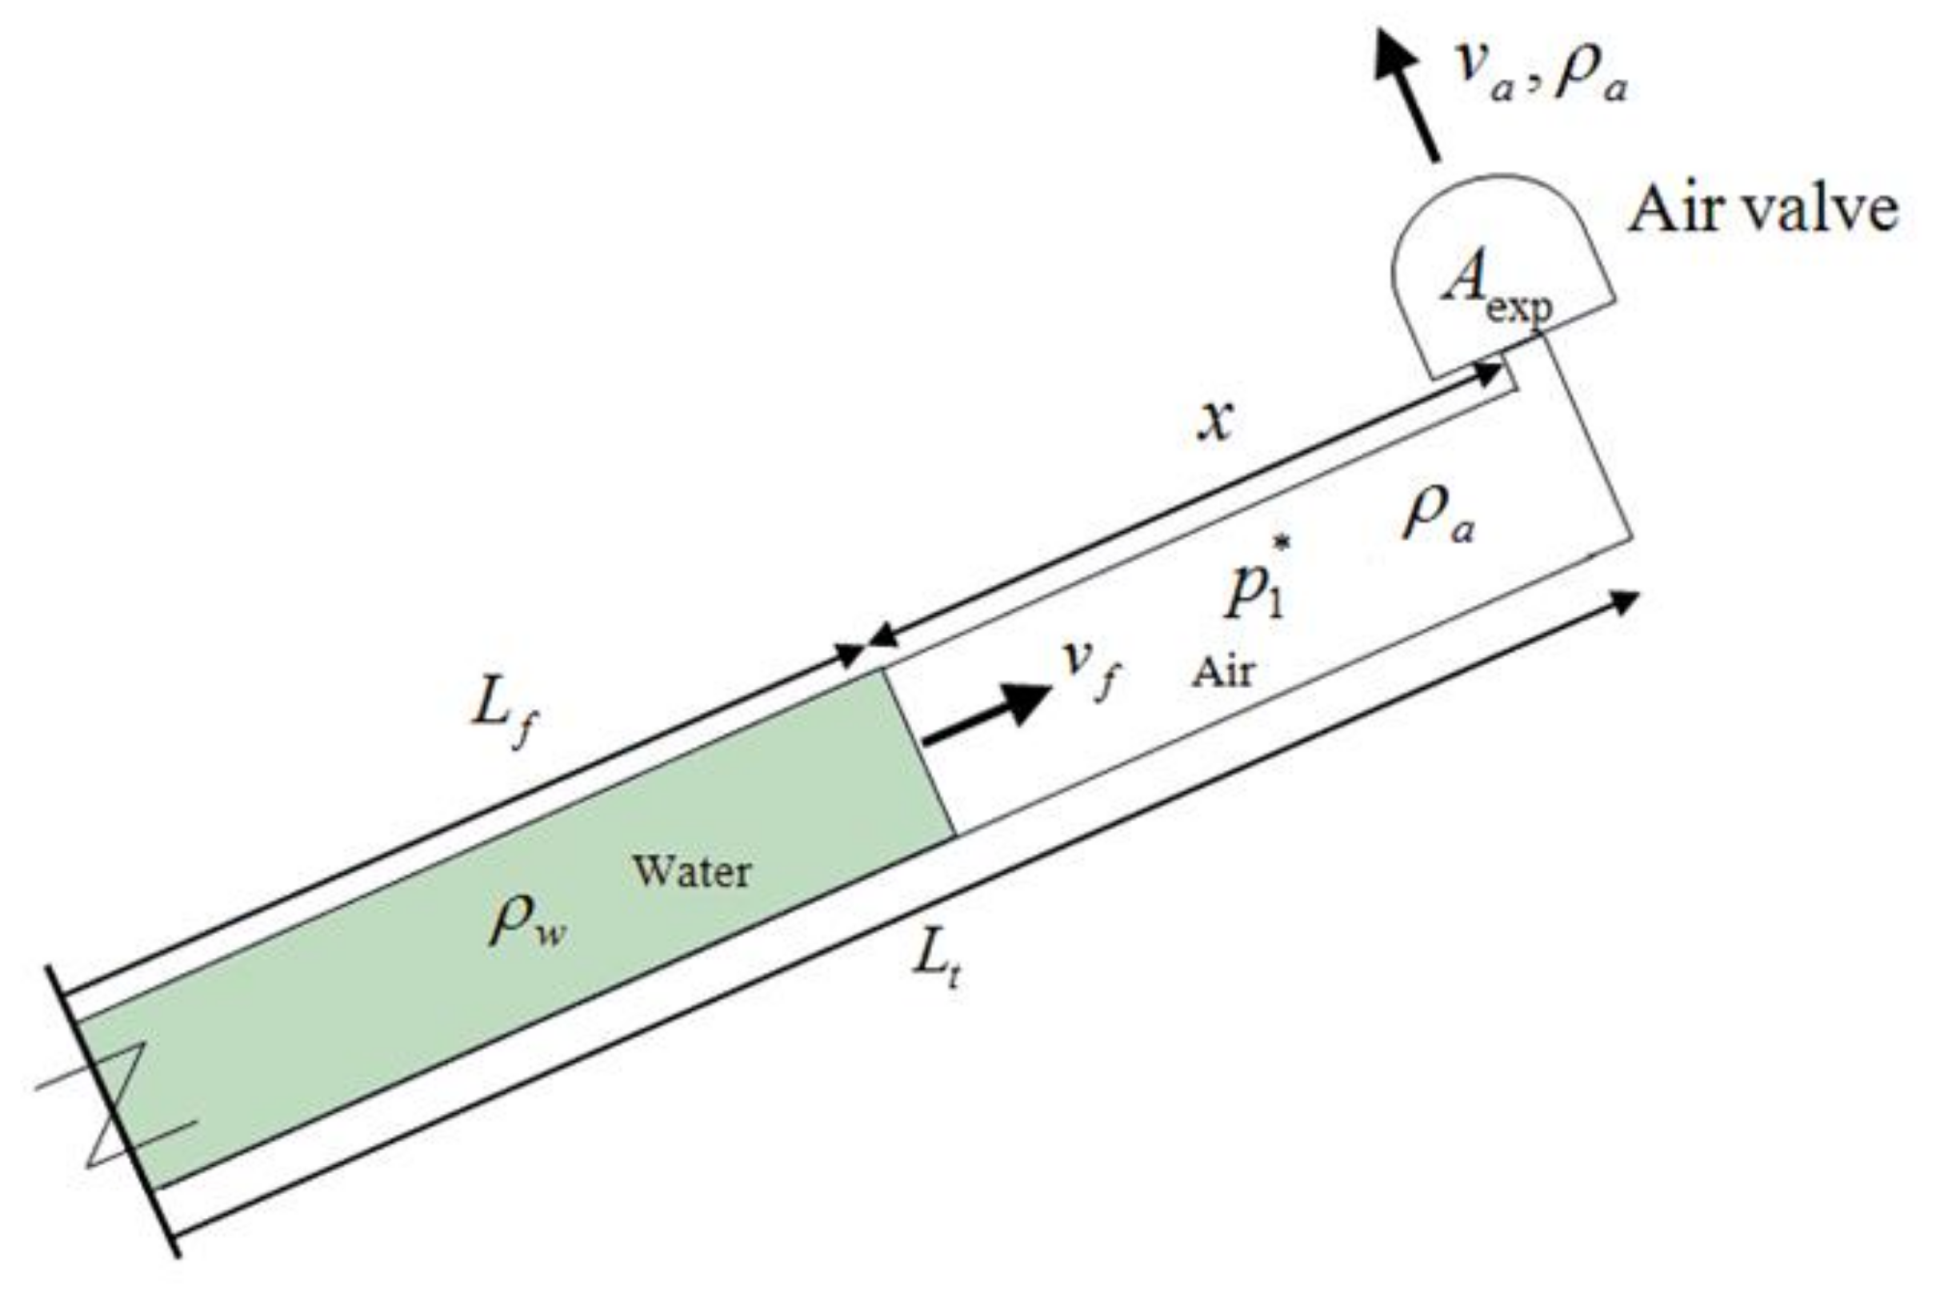
This section presents the mathematical model to simulate a filling process with an air valve in a single pipeline. This process should be a controlled operation, where an entrapped air pocket is compressed by an energy source, and an air valve expels an air volume to relieve pressure surges. Figure 1 shows the scheme of a single pipeline, which consists of a pump or a high-pressure air tank, a length of the filling column, an air valve located at the downstream end, a regulating valve located at the upstream end, and a sloped pipe.

2.1. Assumptions

The mathematical model assumes the uniform movement of the filling water column. The following assumptions are considered:
  • The filling water column is modeled using a rigid column model.
  • The air–water interface is considered perpendicular to the main direction of a single pipeline.
  • The friction factor is constant over the transient event.
  • A polytropic model describes the air phase.

2.2. Formulations

Based on the aforementioned assumptions, the filling process can be modeled using the following formulations:
  • The mass oscillation equation [1,28,31]:
    This equation represents the water movement adequately since in transient flows with trapped air, the compressibility of the air is much higher compared to the water and pipe system:
    d v f d t = p 0 * p 1 * ρ w L f + g Δ z 1 L f f v f | v f | 2 D R v g A 2 v f | v f | L f ,
    where v f = water velocity, p 0 * = initial pressure supplied by tank or pump, p 1 * = air pocket pressure, L f = length of the filling column, t = time, D = internal pipe diameter, R v = resistance coefficient of the regulating valve, f = friction factor, ρ w = water density, g = gravity acceleration, Δ z 1 = difference elevation, and A = cross-sectional area. The relation Δ z 1 / L f (named as gravity term) is calculated for single pipelines as sin θ , where θ represents the pipe slope.
  • The air–water interface [28,29]:
    A piston flow model is considered to represent the interface position, which is applicable in inclined piping installations:
    d L f d t = v f ,
  • The polytropic model of the air phase [30]:
    This formulation shows the evolution of the air pocket pressure over time by relating the compression of an air pocket ( d V a / d t ) to the quantity of the expelled air by an air valve ( d m a / d t ):
    d p 1 * d t = k p 1 * V a ( d V a d t 1 ρ a d m a d t ) ,
    where k = polytropic coefficient, V a = air pocket volume, ρ a = air density, and m a = air pocket mass.
  • The air mass equation [28]:
    d m a d t = ρ a v a A e x p ,
    where A e x p = cross-sectional area of an air valve for expelling conditions, and v a = air velocity.
    Here the air pocket density ( ρ a ) inside of a pipe system is identical to the air density expelled by an air valve and considering m a = ρ a V a , thus:
    d m a d t = d ( ρ a V a ) d t = d ρ a d t V a + d V a d t ρ a = ρ a v a A e x p .
    Based on the variables and parameters shown in Figure 2, then:
    V a = A x = A ( L t L f ) ,
    where x = air pocket size, and L T = total length of the pipe.
    And deriving the Formulation (6), then:
    d V a d t = A v f .
    Plugging Formulations (6) and (7) into (5), then:
    d ρ a d t = v f A ρ a ρ a v a A e x p A ( L t L f ) ,
  • The air valve characterization:
    Subsonic conditions are required to perform an adequate filling process according to recommendations given by the American Water Works Association (AWWA) [32], thus:
    v a = C e x p p 1 * 7 R T [ ( p a t m * p 1 * ) 1.4286   ( p a t m * p 1 * ) 1.714 ] ,
    where p a t m * = atmospheric pressure, C e x p = outflow discharge coefficient, R = air constant, and T = air temperature.

2.3. System Equations and Resolution

A 5 × 5 system of algebraic-differential Equations (1)–(3), (8), and (9) describes the filling operation in single pipelines. The system has five unknown hydraulic and thermodynamic variables: v f , L f , p 1 * , ρ a , and v a . The resolution is conducted using Simulink in MATLAB.

2.4. Initial and Boundary Conditions

The system is considered initially static at t = 0 . Therefore, the initial conditions are described by v f   ( 0 ) = 0 , L f ( 0 ) = L f , 0 , p 1 * ( 0 ) = p 1 , 0 * , ρ a = 1.205 kg/m3, and v a ( 0 ) = 0 .

3. Numerical Validation

3.1. Experimental Facility and Instrumentation

The mathematical model was validated by experimental tests accomplished in the hydraulic lab of the Instituto Superior Técnico located at the University of Lisbon (Lisbon, Portugal). Sudden pressurization of a trapped air pocket in an undulating pipeline when an air valve was located at the highest point of the pipeline has been addressed. Tests were done in a pipeline having a hydro-pneumatic tank (HT) of 1 m3 upstream to produce the required initial pressure ( p 0 * ) for the tests (see Figure 3). For each test, an air pocket was located at the highest point of the pipeline extending towards the upstream branch of the pipeline. An electro-pneumatic ball valve (BV) was used as a means to isolate the pipeline from the high pressure of the HT prior to starting of the test. So, before starting the test, the BV was closed and pressure in the pipeline was set at the atmospheric range. After adjusting the pressure of the HT (using a pressure gauge), the pressure in the pipeline and the air pocket size, the test started by opening the BV. The BV actuation time was 0.20 s leading to sudden pressurization of the downstream pipeline. The pressure data were recorded by a pressure transducer located at Y = 0.8 m and X = 0 m, which had a frequency of data collection of 0.0062 s. The pressure transducer was able to record the absolute pressure up to 25 bar having a maximum pressure measurement error of 0.5% as reported by the manufacturer. This measurement error was negligible compared to the maximum pressure values attained. The pipeline was composed of several polyvinyl chloride (PVC) pipes creating a length of 7.30 m from the HT to the end of the pipeline. The tests were done by changing different parameters, such as the upstream HT pressure and the air pocket size. A commercial air valve S050 (A.R.I. manufacturer) was used in all tests, which had an internal diameter of 3.175 mm ( A e x p = 7.92 × 10⁻⁶ m2) with an outflow discharge coefficient of 0.32. The resistance coefficient of the BV was 2.2 × 10⁵ ms2/m6 for a total opening. The analyzed hydraulic installation can be considered as a single pipeline since transient events occur in the sloped pipe branch due to the valve located at X = 3.0 m remained closed during the experiments.

3.2. Experimental Test

A total of 8 experimental tests were performed to validate the mathematical model proposed by the authors repeating each measurement twice. Initial air pocket sizes ( x 0 ) between 0.96 m and 1.36 m were defined in the 1.50-m-long sloped branch pipe in combination with initial gauge pressures ( p 0 ) of 0.2, 0.5, 0.75, and 1.25 bar in the hydro-pneumatic tank (see Table 1).

3.3. Model Verification

To verify the proposed model, comparisons between computed and measured air pocket pressure oscillations were conducted using a constant friction factor of 0.018, considering the previous work published by the authors [16]. The water column located from X = 0 m to X = 3.4 m (see Figure 3) represents a boundary condition of the system since according to the observations it remains static during all measurements; then, it was neglected for the analysis in the mathematical model. The initial length of the water column was always located at the sloped pipe branch (between X= −1.3 m and X= 0 m). Based on these considerations, the hydraulic installation can be modeled as a single pipeline. For the analyses, the proposed model was developed to simulate the filling process until the closure of the air valve, when a single-phase flow (only water) was reached.
Comparisons show that the mathematical model exhibited a good agreement in following the behavior of the air pocket pressure patterns for the first oscillation compared to the measurements, as shown in Figure 4. However, the mathematical model could not simulate the sub-sequence oscillations because the impact of the water column (from X = −3.2 m to X = 0 m) with the blocking water column (from X = 0 m to 3.4 m) is a complex phenomenon where the air–water interface is not perpendicular to the main direction of the pipe installation.
The more important parameter is the hydro-pneumatic tank pressure since its variation implies important differences of values of air pocket pressures. The greater the hydro-pneumatic tank pressure ( p 0 * ), the higher the air pocket pressure patterns obtained. With a hydro-pneumatic tank pressure of 0.2 bar (Tests No. 1 and No. 2) a maximum value of air pocket pressure head of 15.0 m was reached; in contrast, using a hydro-pneumatic tank pressure of 1.25 bar, peak values of absolute pressure head of 46.9 m and 44.9 m for Test No. 7 and No. 8, respectively, were reached. Peak values of the air pocket pressure were reached at peak time (tpeak). The greater the hydro-pneumatic tank pressure, the lower values of tpeak obtained, indicating that a faster compression of the entrapped air pocket was attained. For a hydro-pneumatic tank pressure of 0.5 bar, values of tpeak of 0.50 s and 0.52 s for Tests No. 3 and No. 4 were attained, respectively; while for a hydro-pneumatic tank pressure of 0.75 bar, values of tpeak of 0.46 s and 0.49 s for Test No. 5 and No. 6 were reached, respectively. The greater the air pocket size (x0), the higher values of tpeak reached.
On the other hand, the polytropic equation is explained with Tests No. 7 and No. 8 (using an HT of 1.25 bar), where air pocket sizes of 0.96 and 1.36 m generated air pocket pressure heads of 46.9 and 44.9 m, respectively. The smaller the air pocket size, the greater peak of pressure surges attained. The remaining tests do not show representative differences on the reached maximum air pocket pressure because the initial hydro-pneumatic tank pressures were not so high as to appreciate these differences. For instance, a peak value of air pocket pressure head of 21.4 m was reached for Tests No. 3 and No. 4 with initial air pocket sizes of x 0 = 0.96 m and x 0 = 1.36 m, respectively. Both the experiment and the mathematical model present these trends.
A summary of experimental results is presented in Table 2, which shows a comparison between maximum values of air pocket pressure head, air pocket size, and attained tpeak.
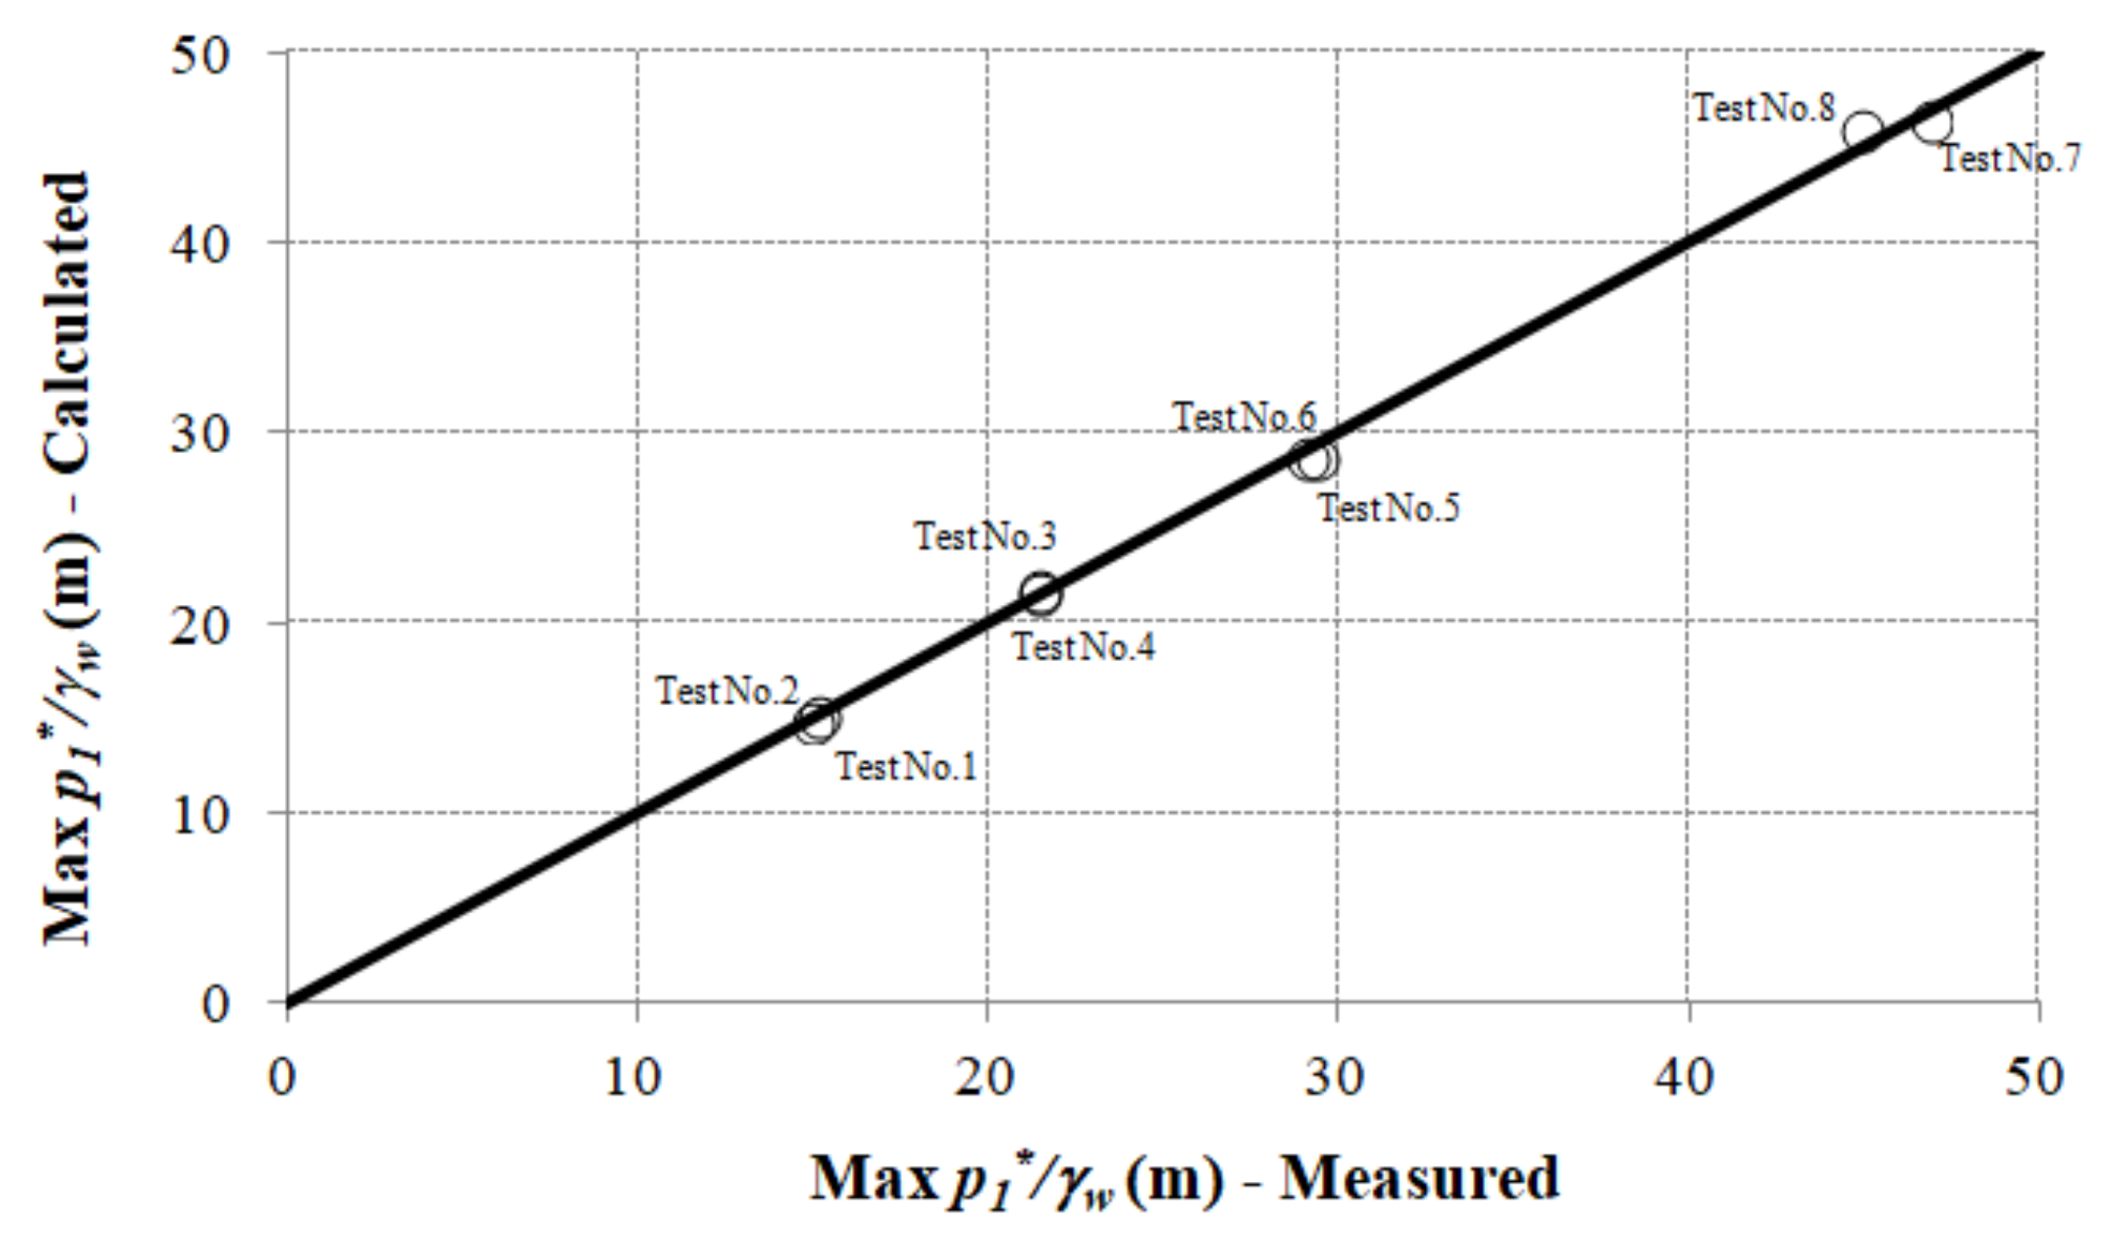
The prediction of the mathematical model can be observed in Figure 5. It demonstrates how the mathematical model developed by the authors has a good agreement with the computation of the maximum air pocket pressure when it is compared with measured values. Hence, the mathematical model can be used to compute the maximum values of air pocket pressure during a filling operation in water installation. It is important to note that the mathematical model properly reproduces the first oscillation and the maximum absolute pressure, but it is not valid for the rest of the hydraulic event.
The selection of a pipe class should consider not only pressure surges occurrence caused by a pump’s stoppages or rapid closure of valves but also the peak value reached by the compression of an air pocket during a filling operation.

3.4. Comparisons Without Air Valve

To note the action of the air valve S050 on the behavior of the air pocket pressure patterns and how this device can relieve pressure surges occurrence, a comparison of results between using the air valve S050 and neglecting it was conducted in the experimental facility. Figure 6 shows the comparison for Test No. 5, where the air pocket pressure pattern exhibited a similar trend for these two scenarios. The mathematical model presented a better behavior in the prediction of absolute pressure oscillations when there was no air valve compared to the scenario using the air valve S050. The prediction of peak values of air pocket pressure head for both scenarios was detected by the mathematical model, where a maximum value of 32.2 m (at 0.44 s) was reached without air valve, and using the air valve S050 the peak value was 29.3 m (at 0.46 s).
The air valve S050 is used in hydraulic installations to release air bubbles when pipelines are completely occupied by water under a normal situation of operation. The air valve S050 can be used during filling processes, which can reduce low percentages of the maximum air pocket pressure since its small outlet orifice is 3.175 mm, as mentioned by the manufacturer A.R.I. Figure 7 and Table 3 present the peak values of the air pocket pressure head reached. Results show how the air valve can relieve pressure surges from 5% to 9% compared to the scenario when there was no installed air valve.

4. Conclusions

Filling maneuvers in water pipelines generate pressure surges since air pockets are being compressed. The analysis of filling processes without air valves has been studied in detail in recent years; however, there are few studies related to the effects of air valves on the upsurge control, which need a better understanding to reduce pipeline failures during these processes. Air valves need to be positioned along hydraulic installations to expel enough volume of air to relieve peak values induced by air pocket compression.
This research presented a 1D mathematical model to simulate the hydraulic behavior of a water column and the thermodynamic evolution of an air pocket during a filling operation using a commercial air valve. The mathematical model was validated in an experimental facility composed by a 7.3-m-long PVC pipeline with an internal diameter of 63 mm. Air pocket pressure patterns were measured for eight different tests. Comparisons of the air pocket pressure between computed and measured values indicated how the mathematical model is suitable to predict the behavior of the first oscillation, which is very important considering the extreme values of absolute pressure are attained in this period. However, the mathematical model is not valid for the rest of the transient response since the impact between the water column and the blocking water column produces a complex phenomenon, where the air–water interaction is not perpendicular to the main direction of the water pipeline.
The air valve S050 relieves the peaks of air pocket pressure in a ratio ranging from 5% to 9% in the laboratory pipe scale compared to the scenario when this device was not installed. The relief percentages of the maximum air pocket pressure were obtained because the air valve S050 presents a small outlet orifice of 3.175 mm.
The mathematical model can be used to compute the maximum air pocket pressure during filling processes using both undersized and well-sized air valves. However, the analysis of oversized air valves was not covered using the mentioned formulations since more extreme pressure surges can be achieved depending on air pocket size and initial hydro-pneumatic tank pressure.

Author Contributions

Conceptualization, Ó.E.C.-H. and V.S.F.-M.; Data curation, Ó.E.C.-H. and M.B.; Methodology, V.S.F.-M.; Writing—original draft, Ó.E.C.-H. and M. B.; Writing—review and editing, H.M.R.

Funding

This work is supported by Fundacao para a Ciencia e Tecnologia (FCT), Portugal (grant number PD/BD/114459/2016).

Conflicts of Interest

The authors declare no conflict of interest.

Abbreviations

The following abbreviations are used in this manuscript:
A Cross-sectional area of pipe (m2)
A e x p Cross-sectional area of outlet orifice in an air valve (m2)
C e x p Outflow discharge coefficient an air valve (−)
D Internal pipe diameter (m)
f Friction factor (−)
k Polytropic coefficient (−)
g Gravity acceleration (m/s2)
L f Length of the filling column (m)
L t Total length of pipe (m)
m a Air mass (kg)
p a t m * Atmospheric pressure (Pa)
p 0 * Absolute pressure supplied by an energy source (Pa)
p 1 * Air pocket pressure (Pa)
R Gas constant (287 J/kg/ K)
R v Resistance coefficient of the regulating valve (m s2/m6)
T Air temperature ( K)
t Time (s)
t p e a k Peak time (s)
V a Air volume (m3)
v a Air velocity (m/s)
v f Water velocity (m/s)
x Air pocket size (m)
Δ z 1 Difference elevation (m)
ρ a Air density (kg/m3)
ρ w Water density (kg/m3)
BVElectro-pneumatic ball valve
HTHydro-pneumatic tank

References

  1. Abreu, J.; Cabrera, E.; Izquierdo, J.; García-Serra, J. Flow Modeling in Pressurized Systems Revisited. J. Hydraul. Eng. 1999, 125, 1154–1169. [Google Scholar] [CrossRef]
  2. Azoury, P.H.; Baasiri, M.; Najm, H. Effect of Valve-Closure Schedule on Water Hammer. J. Hydraul. Eng. 1986, 112, 890–903. [Google Scholar] [CrossRef]
  3. Himr, D. Investigation and Numerical Simulation of a Water Hammer with Column Separation. J. Hydraul. Eng. 2015, 141, 04014080. [Google Scholar] [CrossRef]
  4. Simpson, A.R.; Wylie, E.B. Large Water-Hammer Pressures for Column Separation in Pipelines. J. Hydraul. Eng. 1991, 117, 1310–1316. [Google Scholar] [CrossRef]
  5. Saemi, S.; Raisee, M.; Cervantes, M.J.; Nourbakhsh, A. Computation of two- and three-dimensional water hammer flows. J. Hydraul. Res. 2019, 57, 386–404. [Google Scholar] [CrossRef]
  6. Karney, B.W.; Simpson, A.R. In-line check valves for water hammer control. J. Hydraul. Res. 2007, 45, 547–554. [Google Scholar] [CrossRef] [Green Version]
  7. Triki, A. Water-Hammer Control in Pressurized-Pipe Flow Using a Branched Polymeric Penstock. J. Pipeline Syst. Eng. Pract. 2017, 8, 04017024. [Google Scholar] [CrossRef]
  8. Triki, A.; Fersi, M. Further investigation on the water-hammer control branching strategy in pressurized steel-piping systems. Int. J. Press. Vessel. Pip. 2018, 165, 135–144. [Google Scholar] [CrossRef]
  9. Stephenson, D. Simple Guide for Design of Air Vessels for Water Hammer Protection of Pumping Lines. J. Hydraul. Eng. 2002, 128, 792–797. [Google Scholar] [CrossRef]
  10. Besharat, M.; Tarinejad, R.; Ramos, H.M. The Effect of Water Hammer on a Confined Air Pocket Towards Flow Energy Storage System. J. Water Supply: Res. Technol.-AQUA. 2016, 65, 116–126. [Google Scholar] [CrossRef]
  11. Besharat, M.; Tarinejad, R.; Aalami, M.T.; Ramos, H.M. Study of a Compressed Air Vessel for Controlling the Pressure Surge in Water Networks: CFD and Experimental Analysis. Water Resour. Manag. 2016, 30, 2687–2702. [Google Scholar] [CrossRef]
  12. Besharat, M.; Viseu, M.T.; Ramos, H.M. Experimental Study of Air Vessel Sizing to either Store Energy or Protect the System in the Water Hammer Occurrence. Water 2017, 9, 63. [Google Scholar] [CrossRef]
  13. Laanearu, J.; Annus, I.; Koppel, T.; Bergant, A.; Vučkovič, S.; Hou, Q.; van’t Westende, J.M.C. Emptying of Large-Scale Pipeline by Pressurized Air. J. Hydraul. Eng. 2012, 138, 1090–1100. [Google Scholar] [CrossRef] [Green Version]
  14. Tijsseling, A.; Hou, Q.; Bozkus, Z.; Laanearu, J. Improved One-Dimensional Models for Rapid Emptying and Filling of Pipelines. J. Press. Vessel Technol. 2016, 138, 031301. [Google Scholar] [CrossRef]
  15. Besharat, M.; Coronado-Hernández, O.E.; Fuertes-Miquel, V.S.; Viseu, M.T.; Ramos, H.M. Backflow Air and Pressure Analysis in Emptying Pipeline Containing Entrapped Air Pocket. Urban Water J. 2018, 15, 769–779. [Google Scholar] [CrossRef]
  16. Coronado-Hernández, O.E.; Fuertes-Miquel, V.S.; Besharat, M.; Ramos, H.M. Subatmospheric Pressure in a Water Draining Pipeline with an Air Pocket. Urban Water J. 2018, 15, 346–352. [Google Scholar] [CrossRef]
  17. Coronado-Hernández, O.E.; Fuertes-Miquel, V.S.; Iglesias-Rey, P.L.; Martínez-Solano, F.J. Rigid Water Column Model for Simulating the Emptying Process in a Pipeline Using Pressurized Air. J. Hydraul. Eng. 2018, 144, 06018004. [Google Scholar] [CrossRef]
  18. Besharat, M.; Coronado-Hernández, O.E.; Fuertes-Miquel, V.S.; Viseu, M.T.; Ramos, H.M. Computational Fluid Dynamics for Sub-Atmospheric Pressure Analysis in Pipe Drainage. J. Hydraul. Res. 2019, 1–13. [Google Scholar] [CrossRef]
  19. Vasconcelos, J.G.; Wright, S.J. Rapid Flow Startup in Filled Horizontal Pipelines. J. Hydraul. Eng. 2008, 134, 984–992. [Google Scholar] [CrossRef] [Green Version]
  20. Trindade, B.C.; Vasconcelos, J.G. Modeling of Water Pipeline Filling Events Accounting for Air Phase Interactions. J. Hydraul. Eng. 2013, 139, 921–934. [Google Scholar] [CrossRef] [Green Version]
  21. Malekpour, A.; Karney, B.; Nault, J. Physical understanding of sudden pressurization of pipe systems with entrapped air: Energy auditing approach. J. Hydraul. Eng. 2015, 142, 04015044. [Google Scholar] [CrossRef]
  22. Apollonio, C.; Balacco, G.; Fontana, N.; Giugni, M.; Marini, G.; Piccinni, A.F. Hydraulic Transients Caused by Air Expulsion during Rapid Filling of Undulating Pipelines. Water 2016, 8, 25. [Google Scholar] [CrossRef]
  23. Wang, L.; Wang, F.; Karney, B.; Malekpour, A. Numerical Investigation of Rapid Filling in Bypass Pipelines. J. Hydraul. Res. 2017, 55, 647–656. [Google Scholar] [CrossRef]
  24. Chaudhry, M.H. Applied Hydraulic Transients, 3rd ed.; Springer: New York, NY, USA, 2014. [Google Scholar]
  25. Besharat, M.; Coronado-Hernández, O.E.; Fuertes-Miquel, V.S.; Viseu, M.T.; Ramos, H.M. CFD and 1D Simulation of Transient Flow Effect on Air Vessel. In Proceedings of the 13th International Conference on Pressure Surges, Bordeaux, France, 14–16 November 2018; BHR Group: Bordeaux, France, 2018. [Google Scholar]
  26. Ramezani, L.; Karney, B.; Malekpour, A. The Challenge of Air Valves: A Selective Critical Literature Review. J. Water Resour. Plan. Manag. 2016, 141, 04015017. [Google Scholar] [CrossRef]
  27. Balacco, G.; Apollonio, C.; Piccinni, A.F. Experimental Analysis of Air Valve Behaviour During Hydraulic Transients. J. Appl. Water Eng. Res. 2015, 3, 3–11. [Google Scholar] [CrossRef]
  28. Fuertes-Miquel, V.S.; López-Jiménez, P.A.; Martínez-Solano, F.J.; López-Patiño, G. Numerical modelling of pipelines with air pockets and air valves. Can. J. Civ. Eng. 2016, 43, 1052–1061. [Google Scholar] [CrossRef] [Green Version]
  29. Fuertes-Miquel, V.S.; Coronado-Hernández, O.E.; Iglesias-Rey, P.L.; Mora-Melia, D. Transient Phenomena during the Emptying Process of a Single Pipe with Water-Air Interaction. J. Hydraul. Res. 2019, 57, 318–326. [Google Scholar] [CrossRef]
  30. Coronado-Hernández, O.E.; Fuertes-Miquel, V.S.; Besharat, M.; Ramos, H.M. Experimental and Numerical Analysis of a Water Emptying Pipeline Using Different Air Valves. Water 2017, 9, 98. [Google Scholar] [CrossRef]
  31. Coronado-Hernández, O.E.; Fuertes-Miquel, V.S.; Besharat, M.; Ramos, H.M. A Parametric Sensitivity Analysis of Numerically Modelled Piston-Type Filling and Emptying of an Inclined Pipeline with an Air Valve. In Proceedings of the 13th International Conference on Pressure Surges, Bordeaux, France, 14–16 November 2018; BHR Group: Bordeaux, France, 2018. [Google Scholar]
  32. American Water Works Association (AWWA). Manual of Water Supply Practices-M51: Air-Release, Air-Vacuum, and Combination Air Valves, 1st ed.; American Water Works Association: Denver, CO, USA, 2001. [Google Scholar]
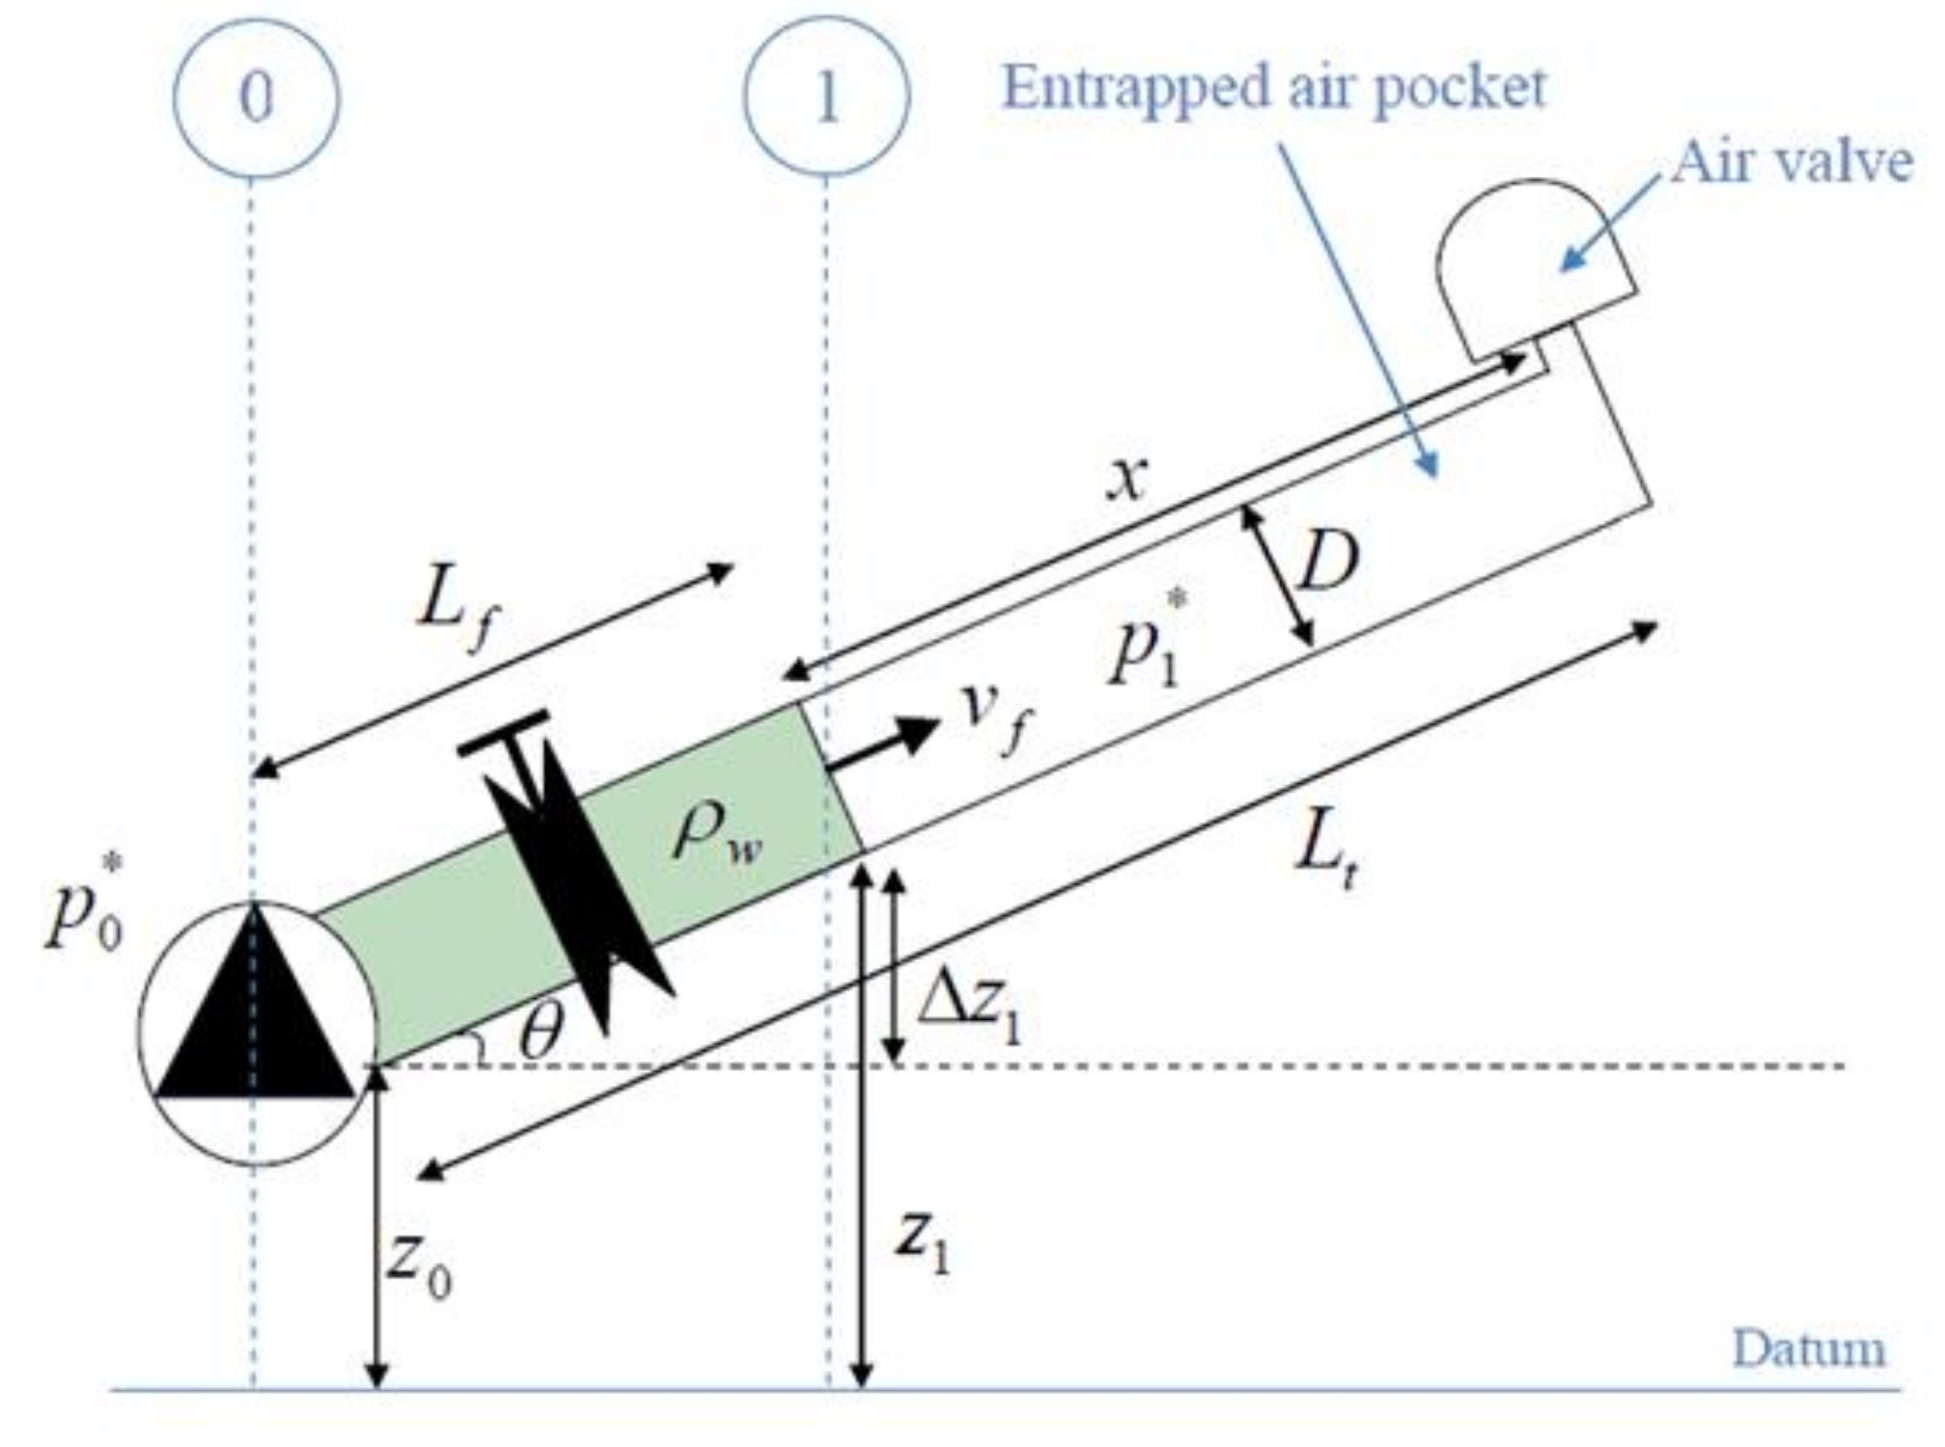
Figure 1. Scheme of a filling process in a single pipeline with an air valve.
Water 11 01814 g001
Figure 2. Location of the air valve.
Water 11 01814 g002
Figure 3. Schematic of filling process apparatus.
Water 11 01814 g003aWater 11 01814 g003b
Figure 4. Air pocket pressure patterns: (a) Test No. 1; (b) Test No. 2; (c) Test No. 3; (d) Test No. 4; (e) Test No. 5; (f) Test No. 6; (g) Test No. 7; (h) Test No. 8.
Water 11 01814 g004aWater 11 01814 g004b
Figure 5. Comparison between calculated and measured maximum air pocket pressure.
Water 11 01814 g005
Figure 6. Effect of air pocket pressure pattern considering and neglecting the air valve S050 for Test No. 5.
Water 11 01814 g006
Figure 7. Peak reduction percentage vs. maximum air pocket pressure attained.
Water 11 01814 g007
Table 1. Characteristics of tests.
Test No. p 0 (bar) p 0 * 1 (Pa) x 0 ( m )
10.201200600.96
20.201200601.36
30.501500750.96
40.501500751.36
50.751750870.96
60.751750871.36
71.252251120.96
81.252251121.36
1 Absolute pressure in the hydro-pneumatic tank ( p 0 * ) were computed as p 0 + p a t m * .
Table 2. Summary of experimental results.
Test No.Maximum Value of Air Pocket Pressure Head (m) x 0 ( m ) tpeak (s)
115.00.960.55
215.01.360.58
321.40.960.50
421.41.360.52
529.30.960.46
629.11.360.49
746.90.960.40
844.91.360.44
Table 3. Summary of extreme values of reached pressure surges.
Test No.Air Pocket Pressure Head (M)Peak Reduction Percentage (%)
Without Air ValeUsing the Air Valve S050
115.915.05
216.015.06
323.621.49
423.121.47
532.229.39
631.429.17
751.146.98
847.444.95