METRIC and WaPOR Estimates of Evapotranspiration over the Lake Urmia Basin: Comparative Analysis and Composite Assessment


Abstract
1. Introduction
2. Materials and Methods
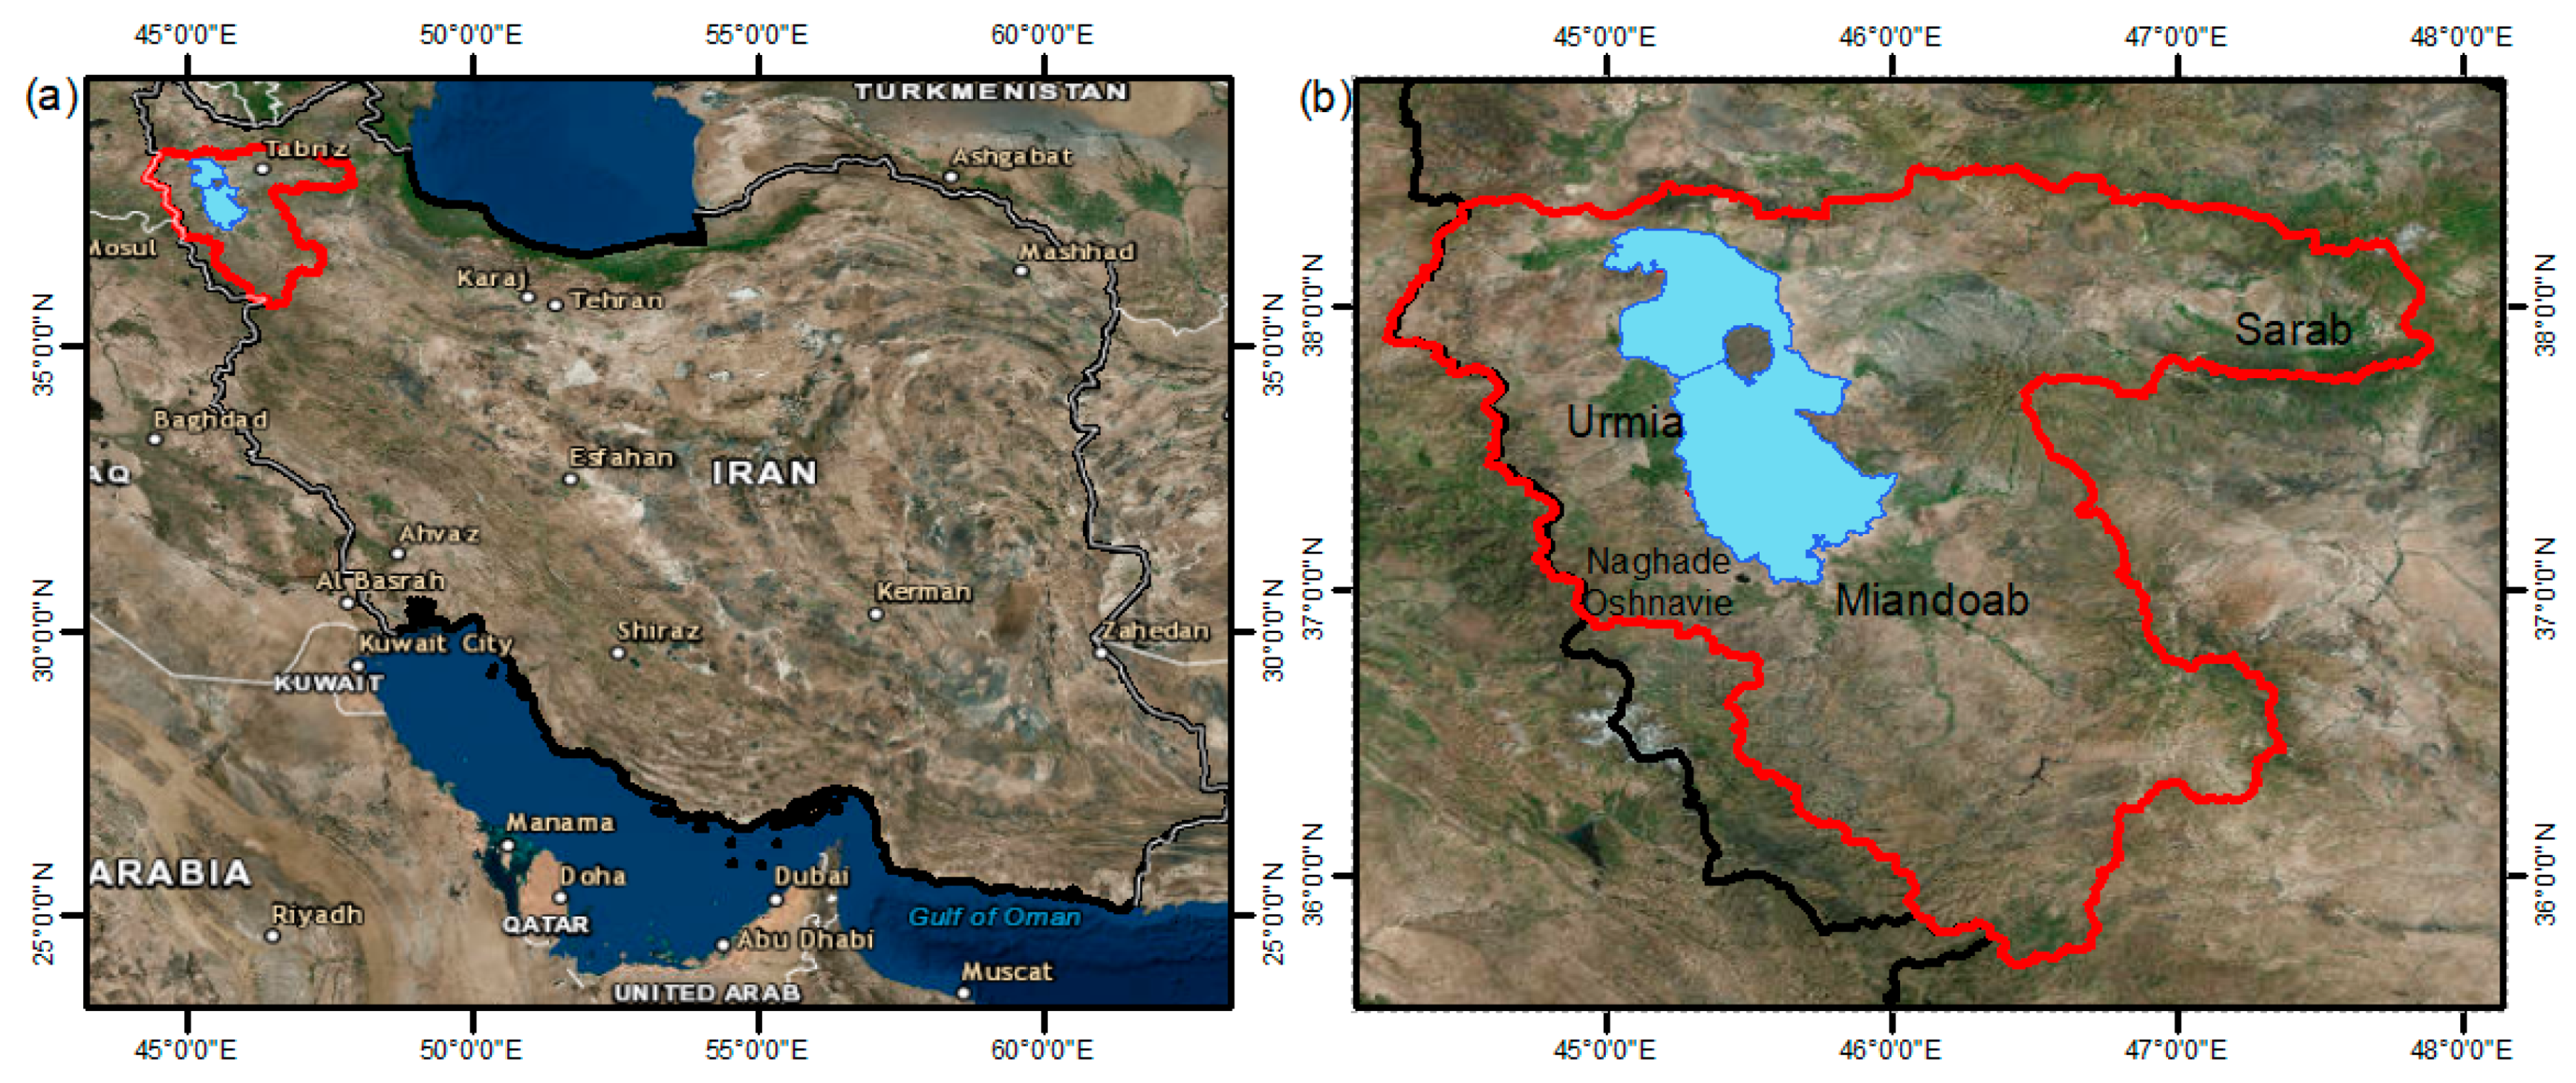
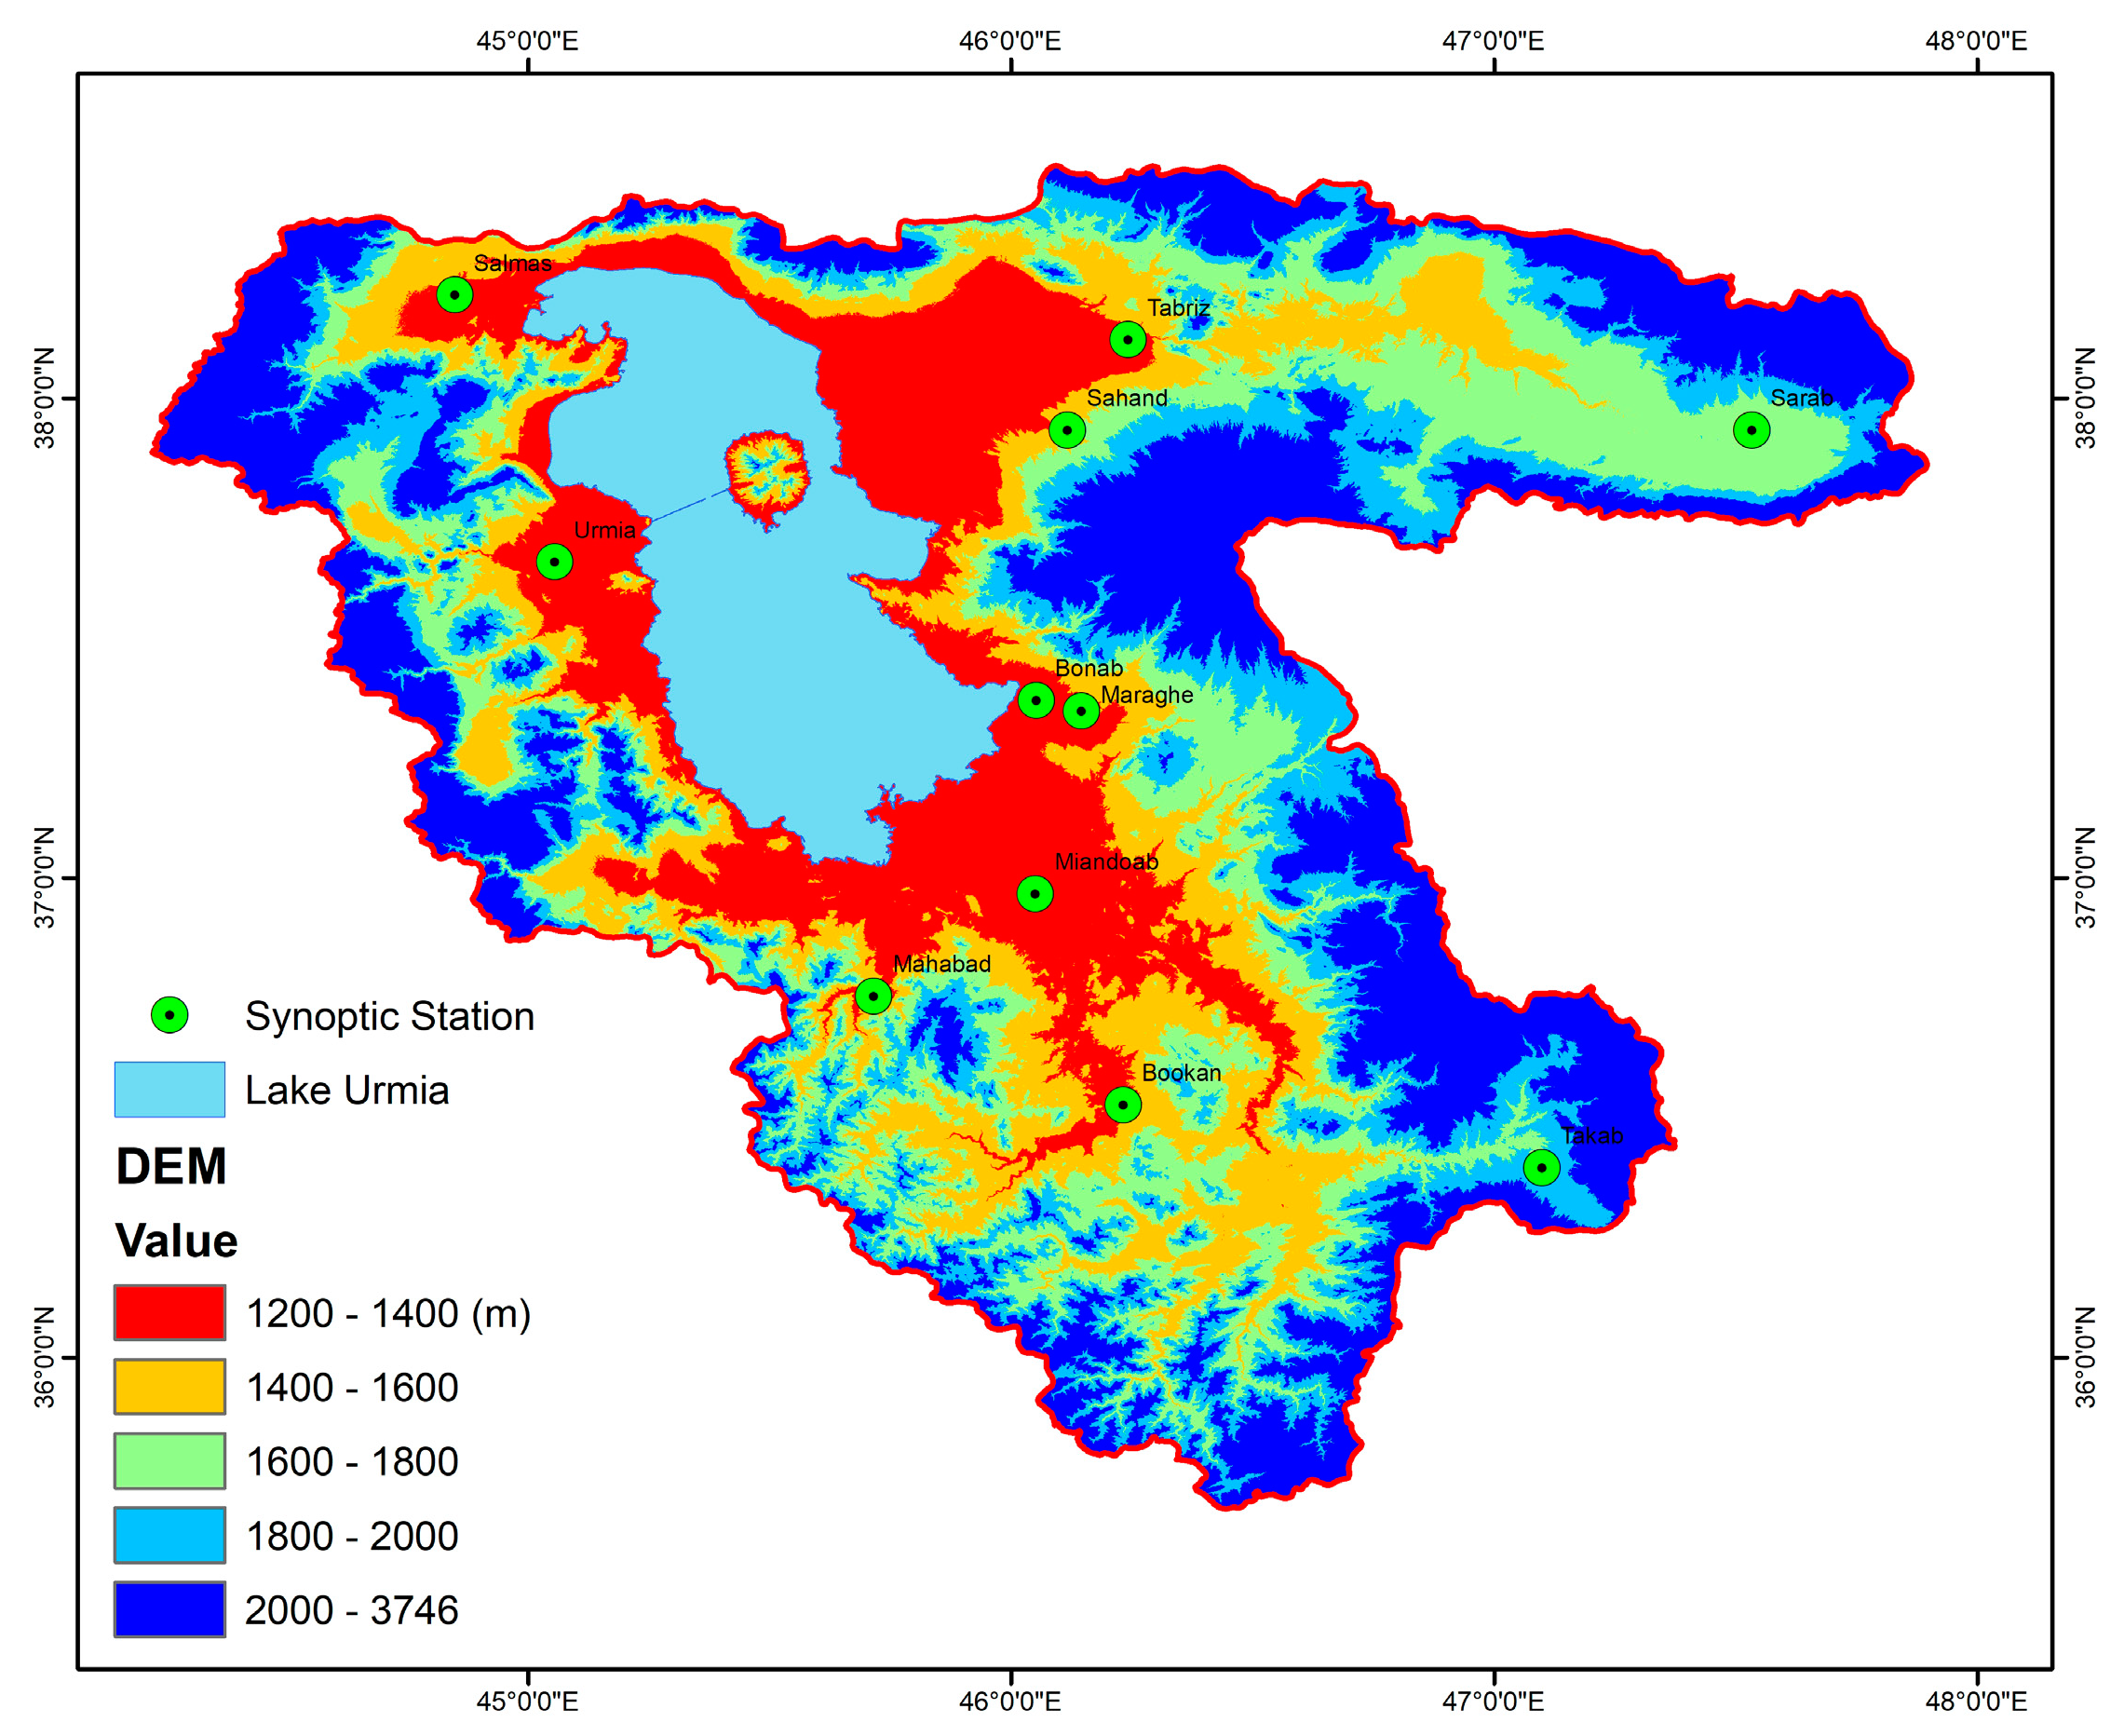
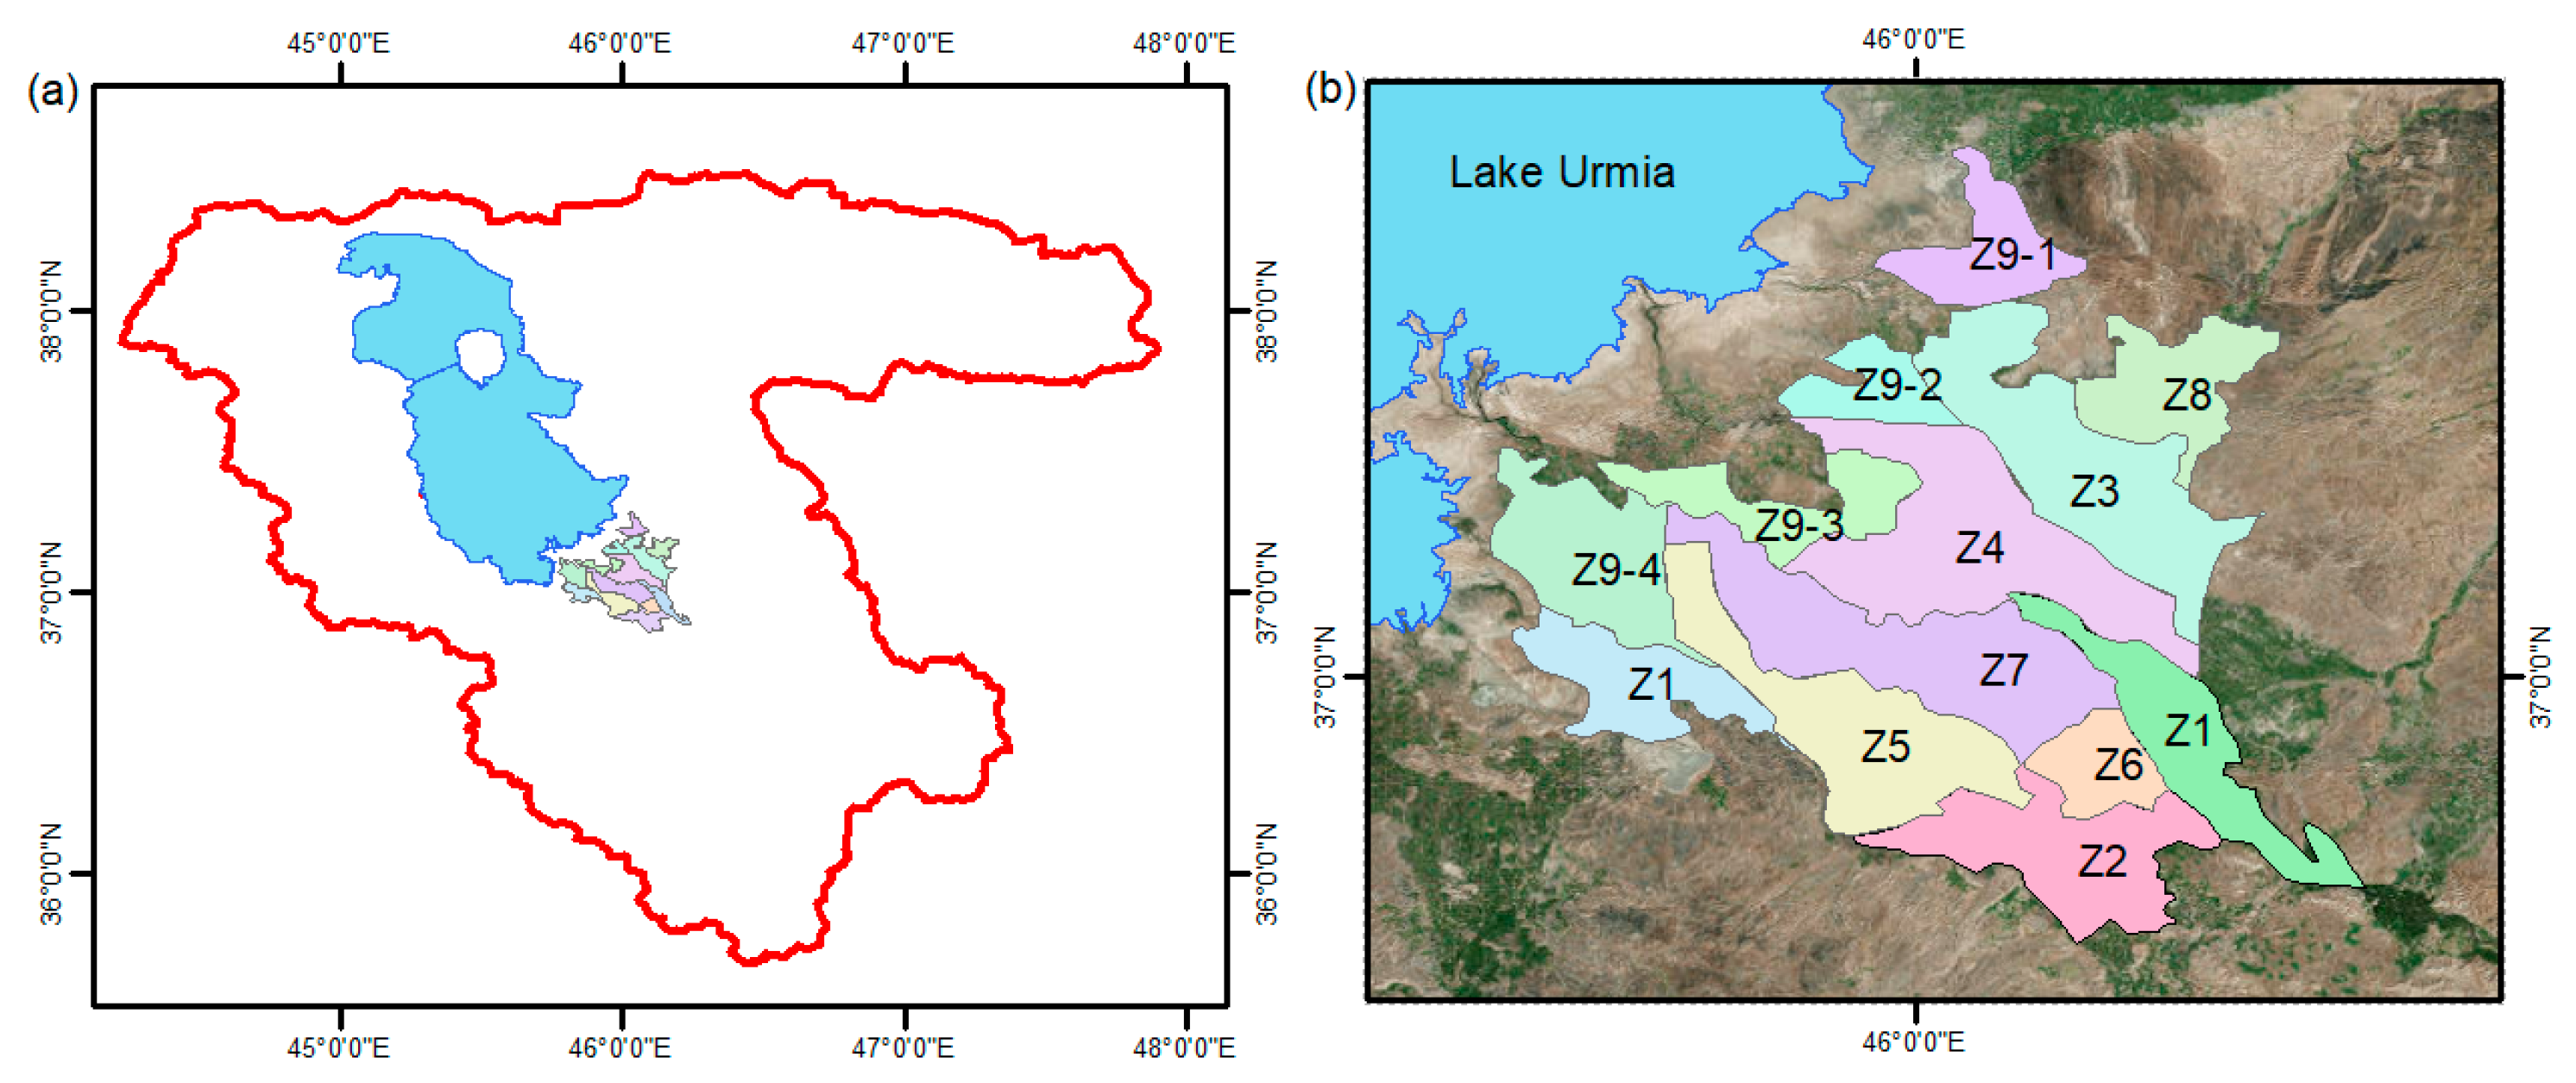
2.1. Study Area
2.2. Datasets
2.2.1. Ground Data
2.2.2. Satellite Data
2.2.3. Precipitation Map
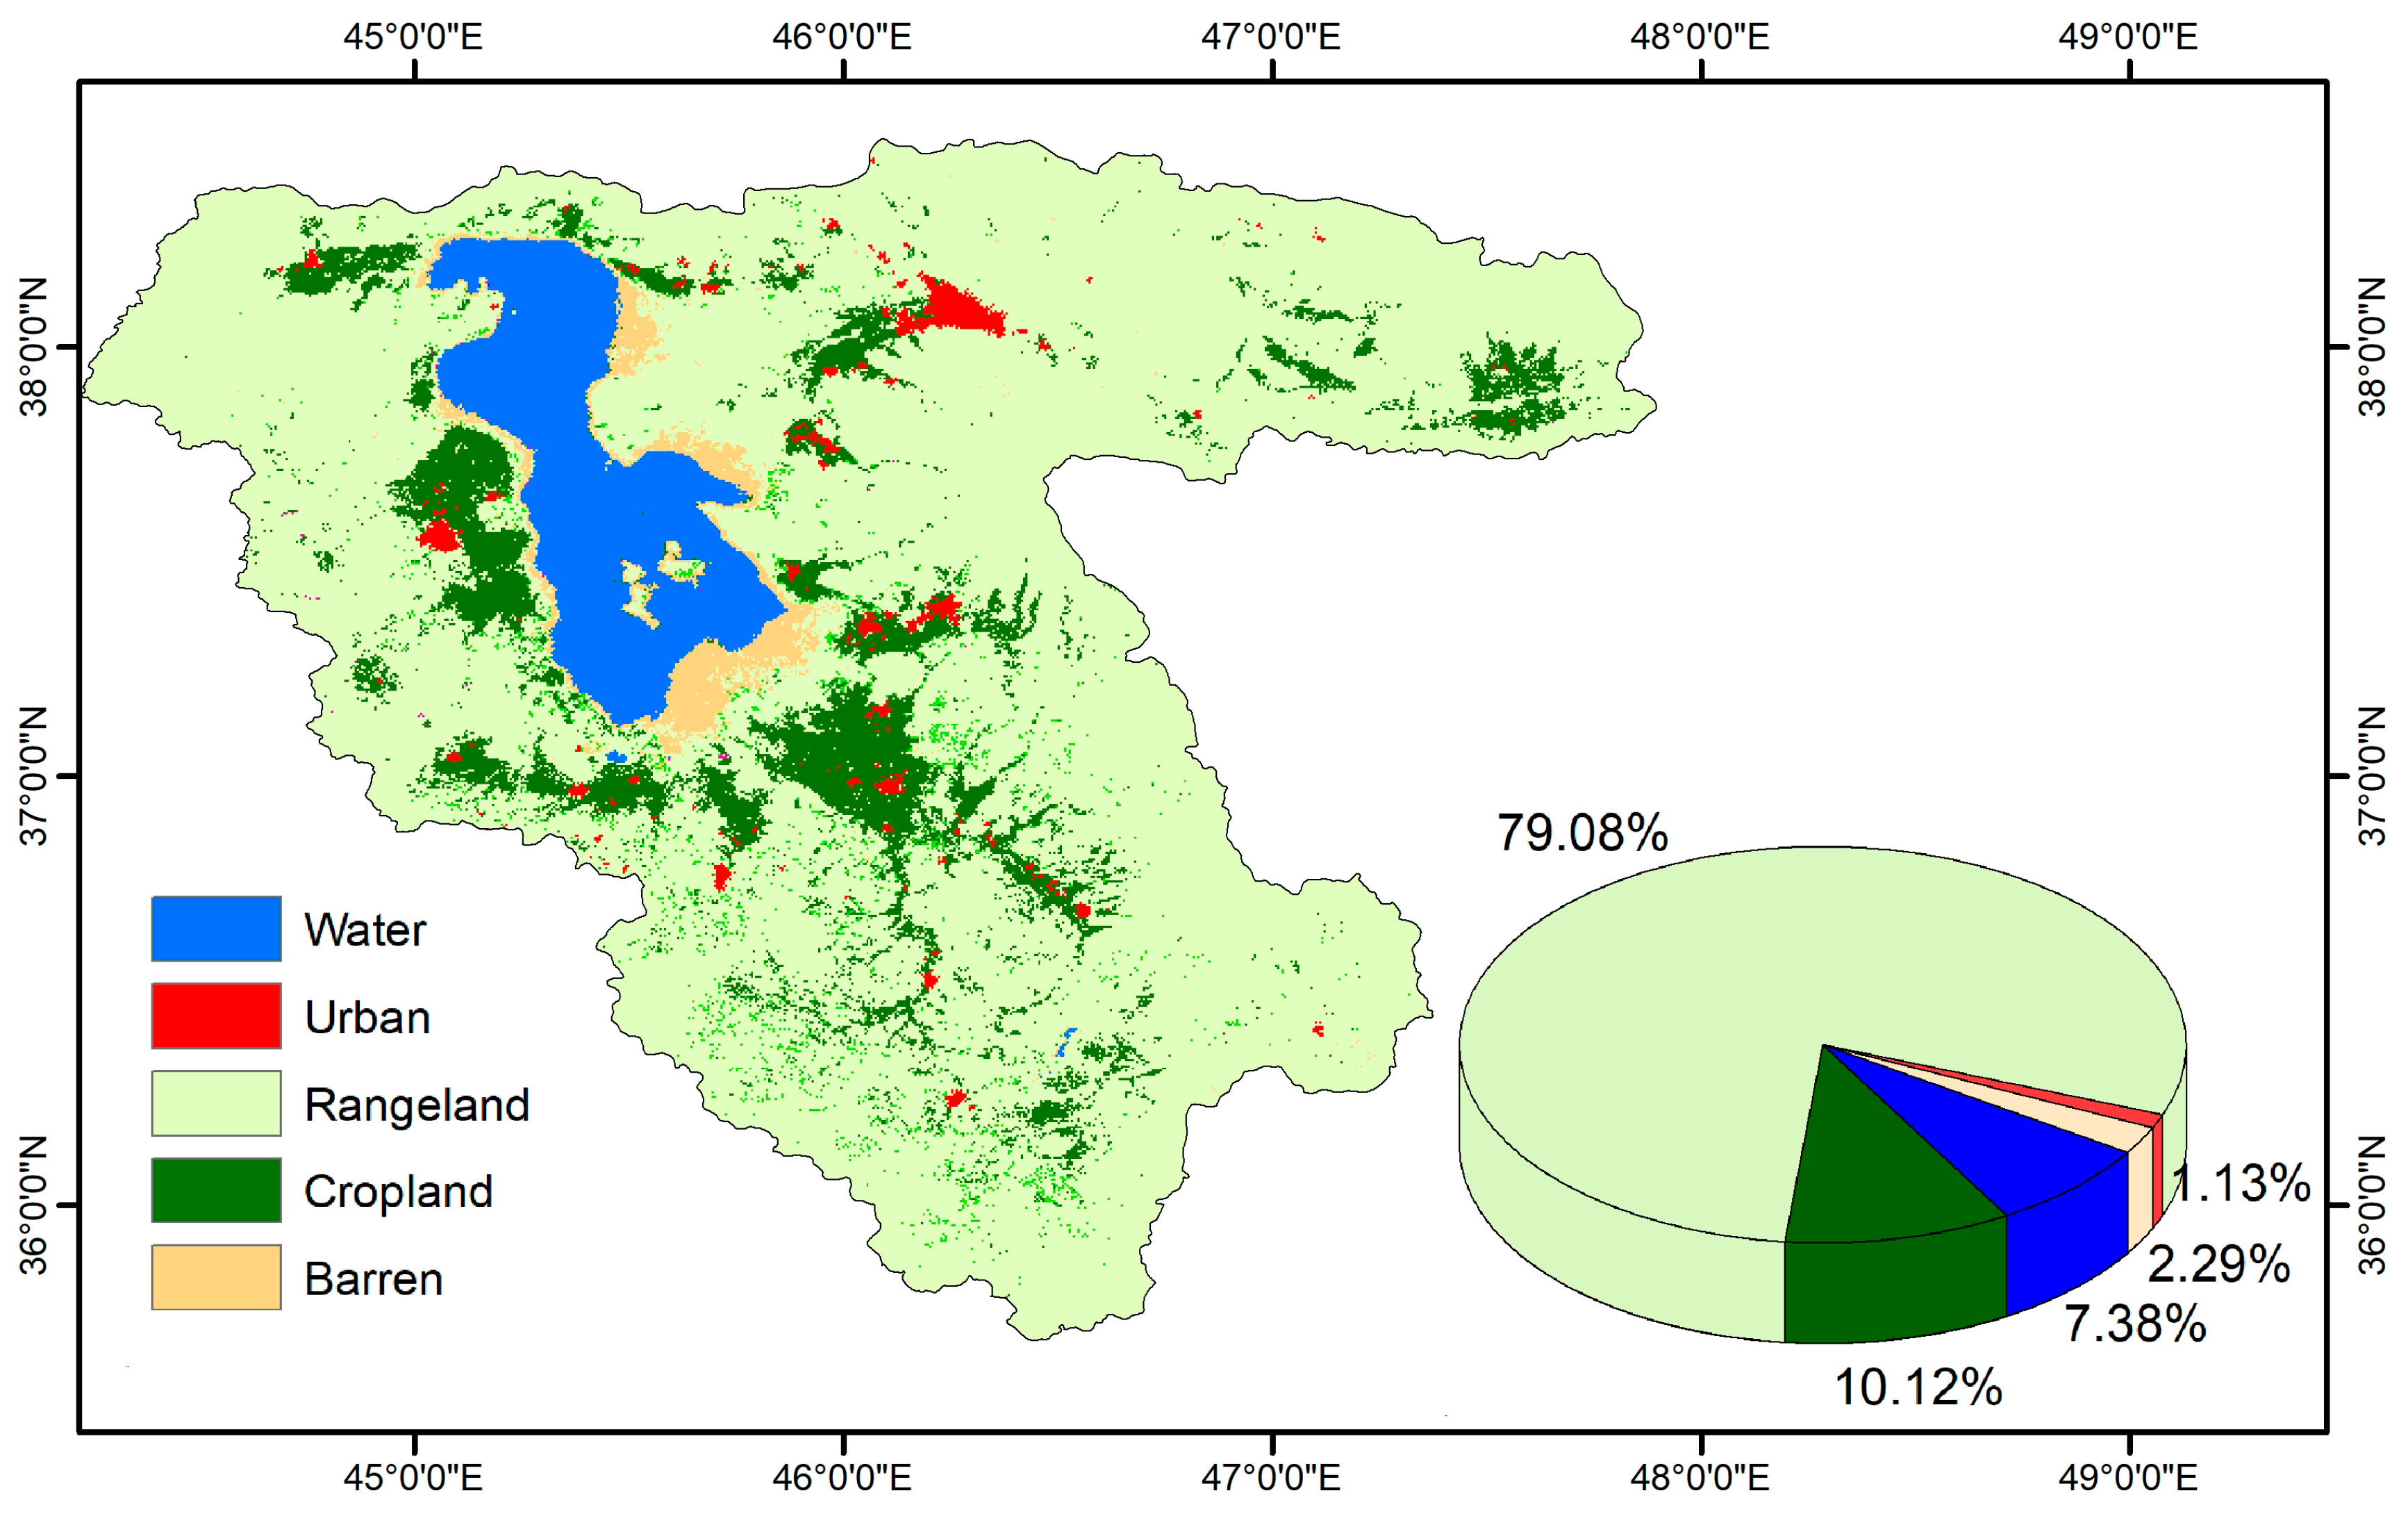
2.2.4. Land Use/Land Cover Map
2.3. METRIC
2.3.1. Net Radiation (Rn)
2.3.2. Ground Heat Flux (G)
2.3.3. Sensible Heat Flux (H)
2.3.4. Actual ET
- Determine the length of the desired season
- Determine the period which each satellite image (in that season) is representative of that number of days (regarding maximum cloudiness of 5% in the entire basin from April to October and 20% from November to March)
- Calculate cumulative ETr for the period specified in the previous step (equal to the sum of daily ETr values during this time period
- Calculate cumulative actual ET in each period when it is done according to the following equation:where is the daily ETr, the number of days of the time period and represents the ETrF in that period, calculated from the following equation:
2.4. ETLook
3. Results and Discussion
3.1. Validation of ET with In-Situ Data
3.1.1. Lysimeter
3.1.2. Irrigation Network
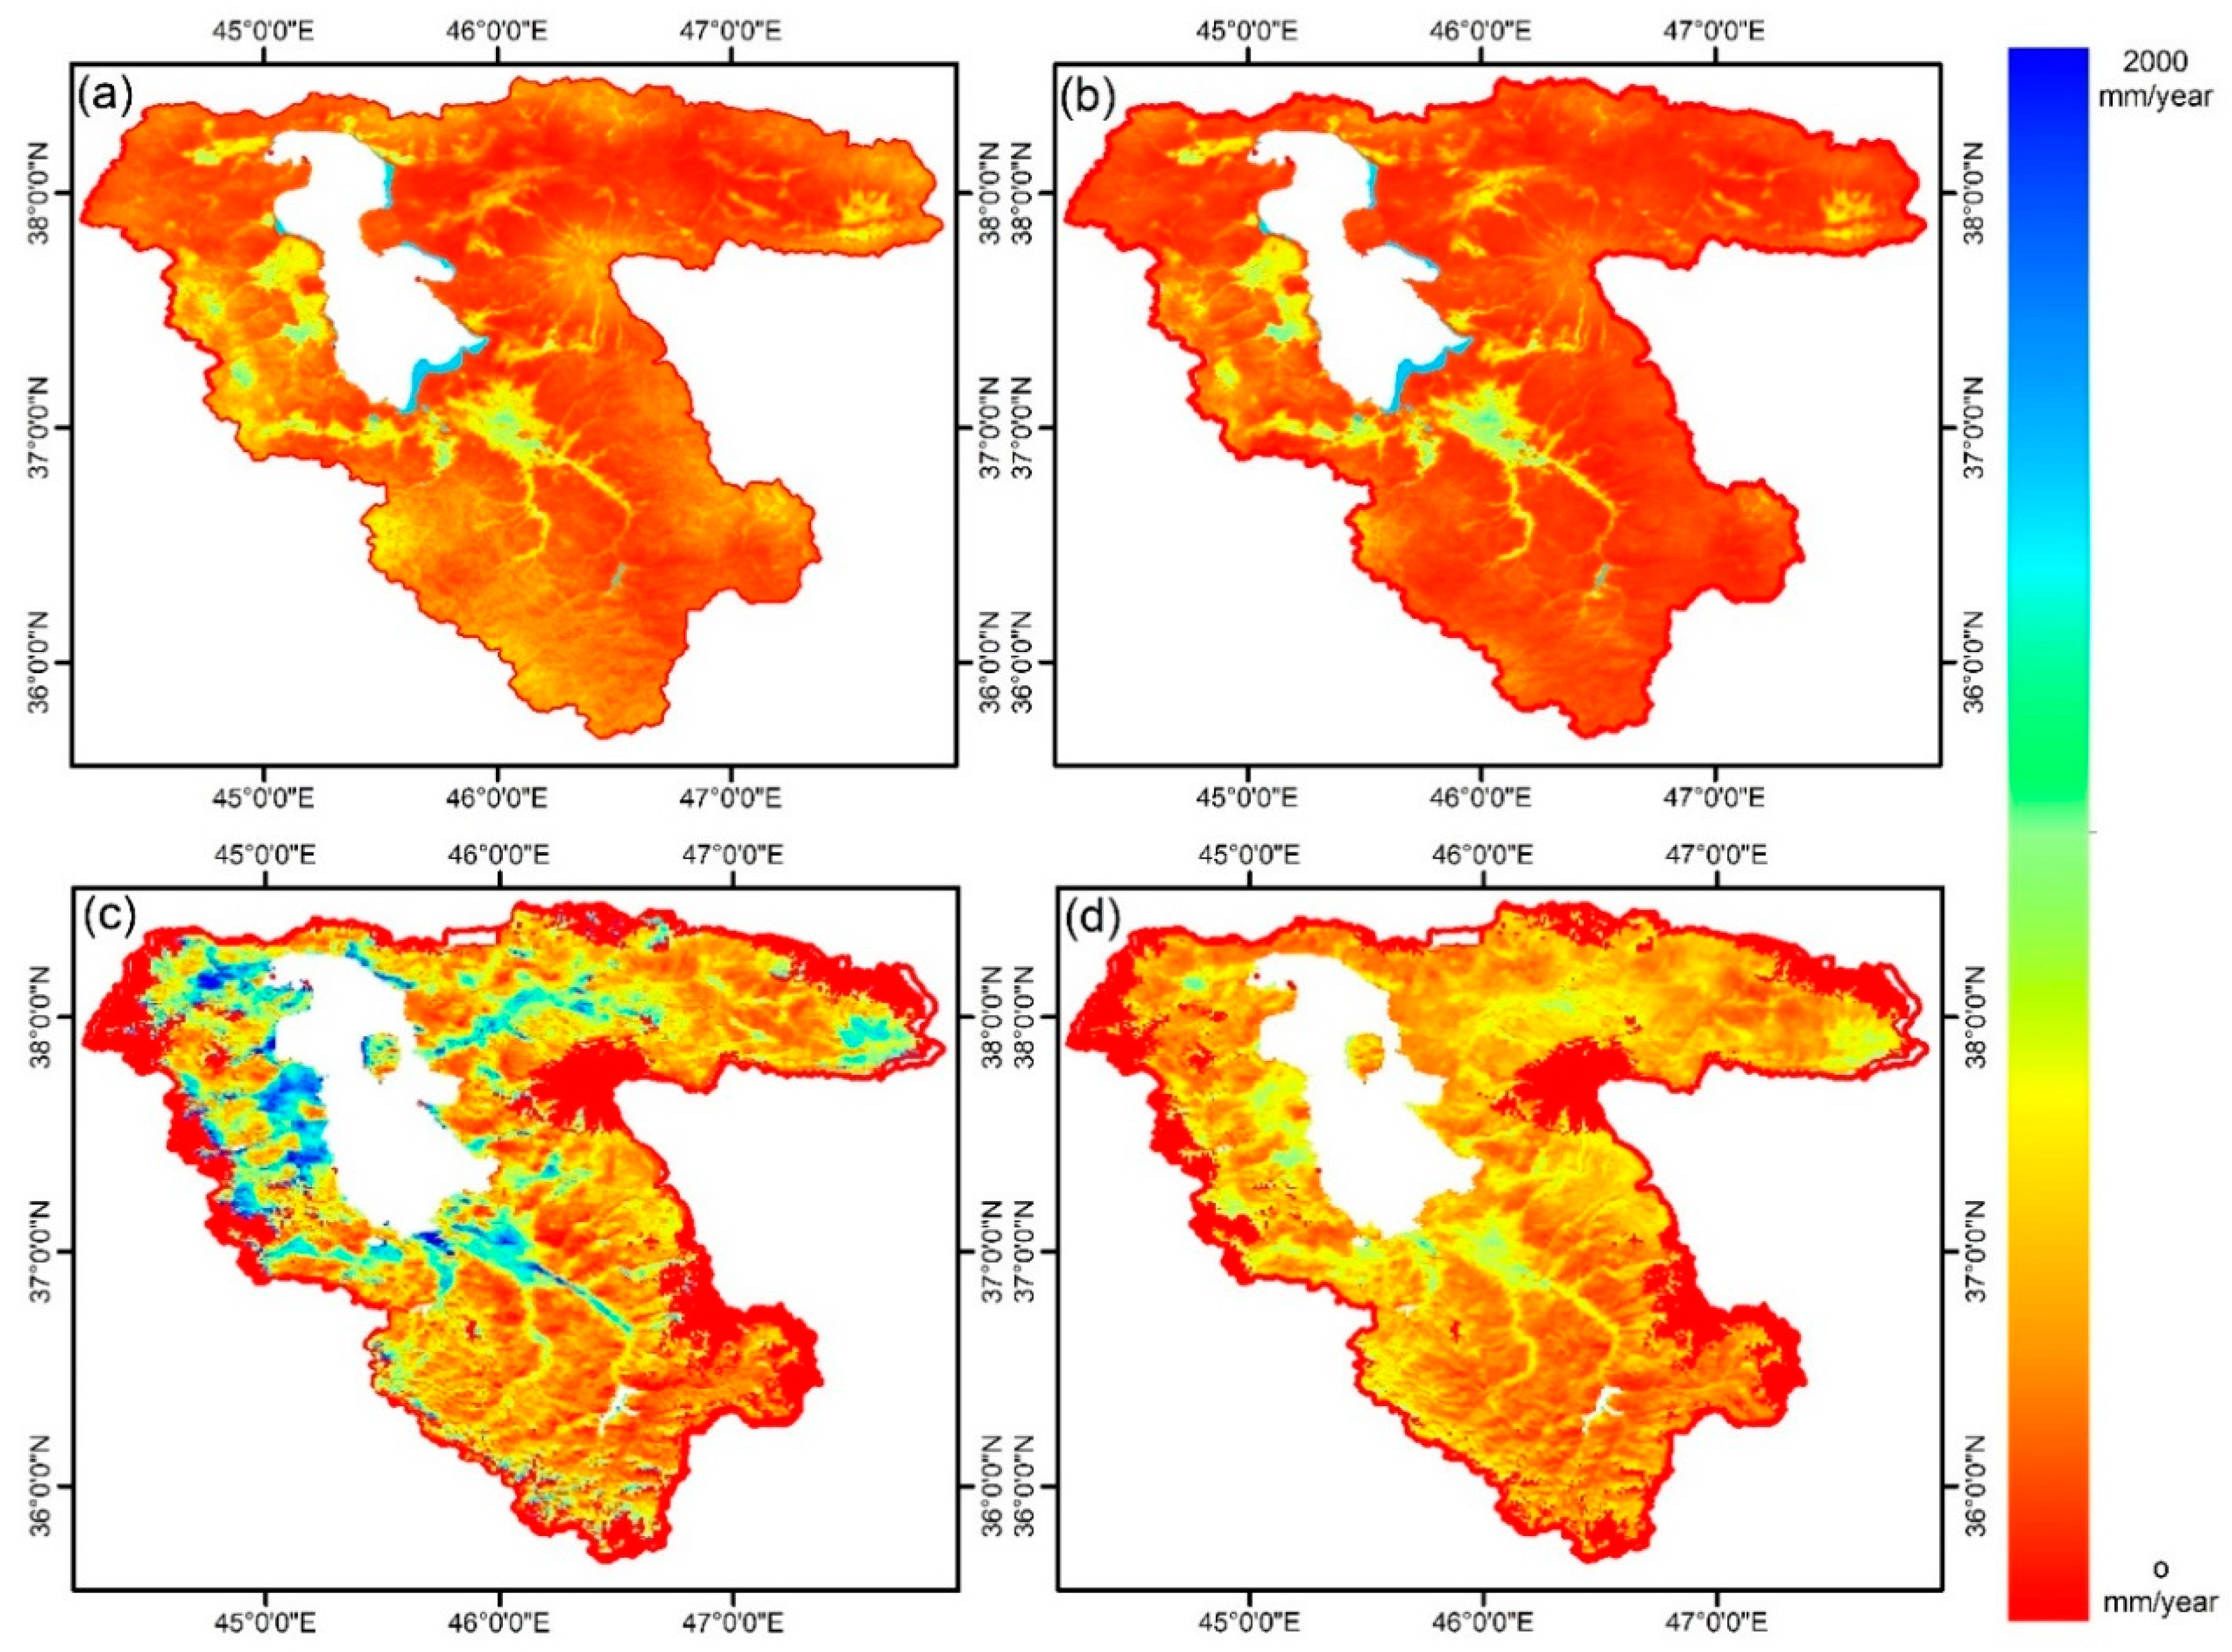
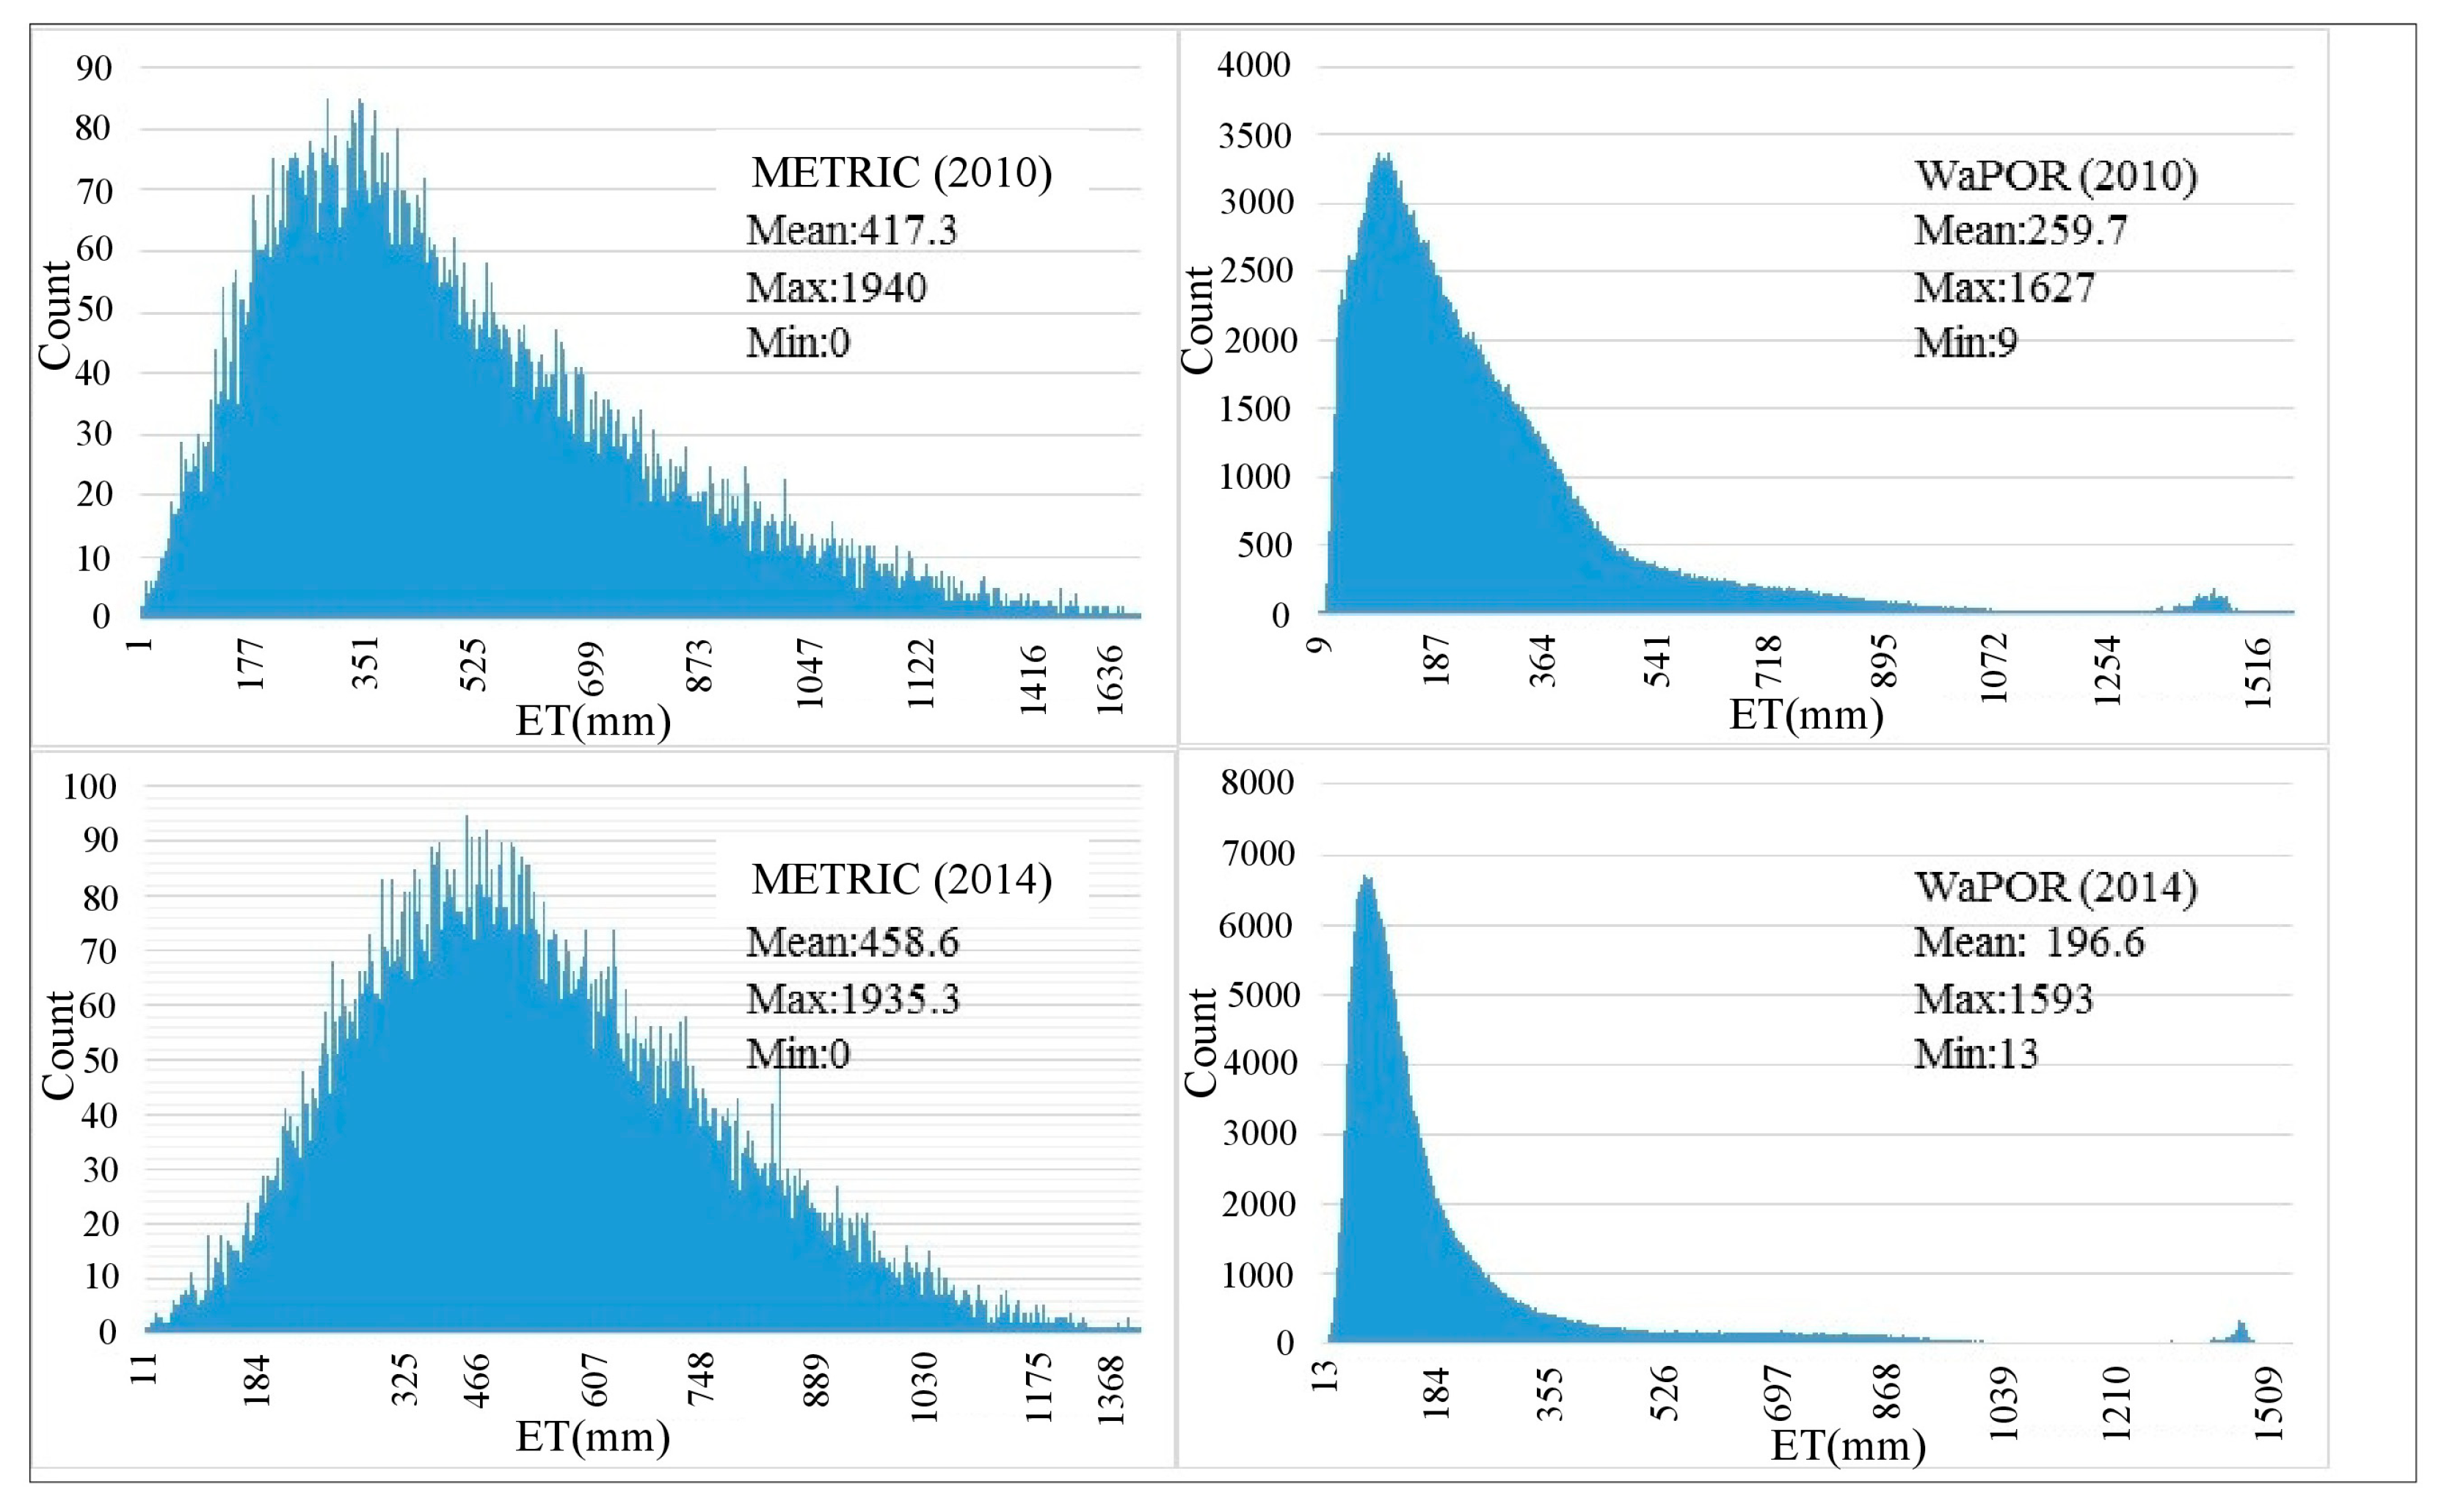
3.2. Comparison of Actual ET from METRIC Algorithm and WaPOR Product
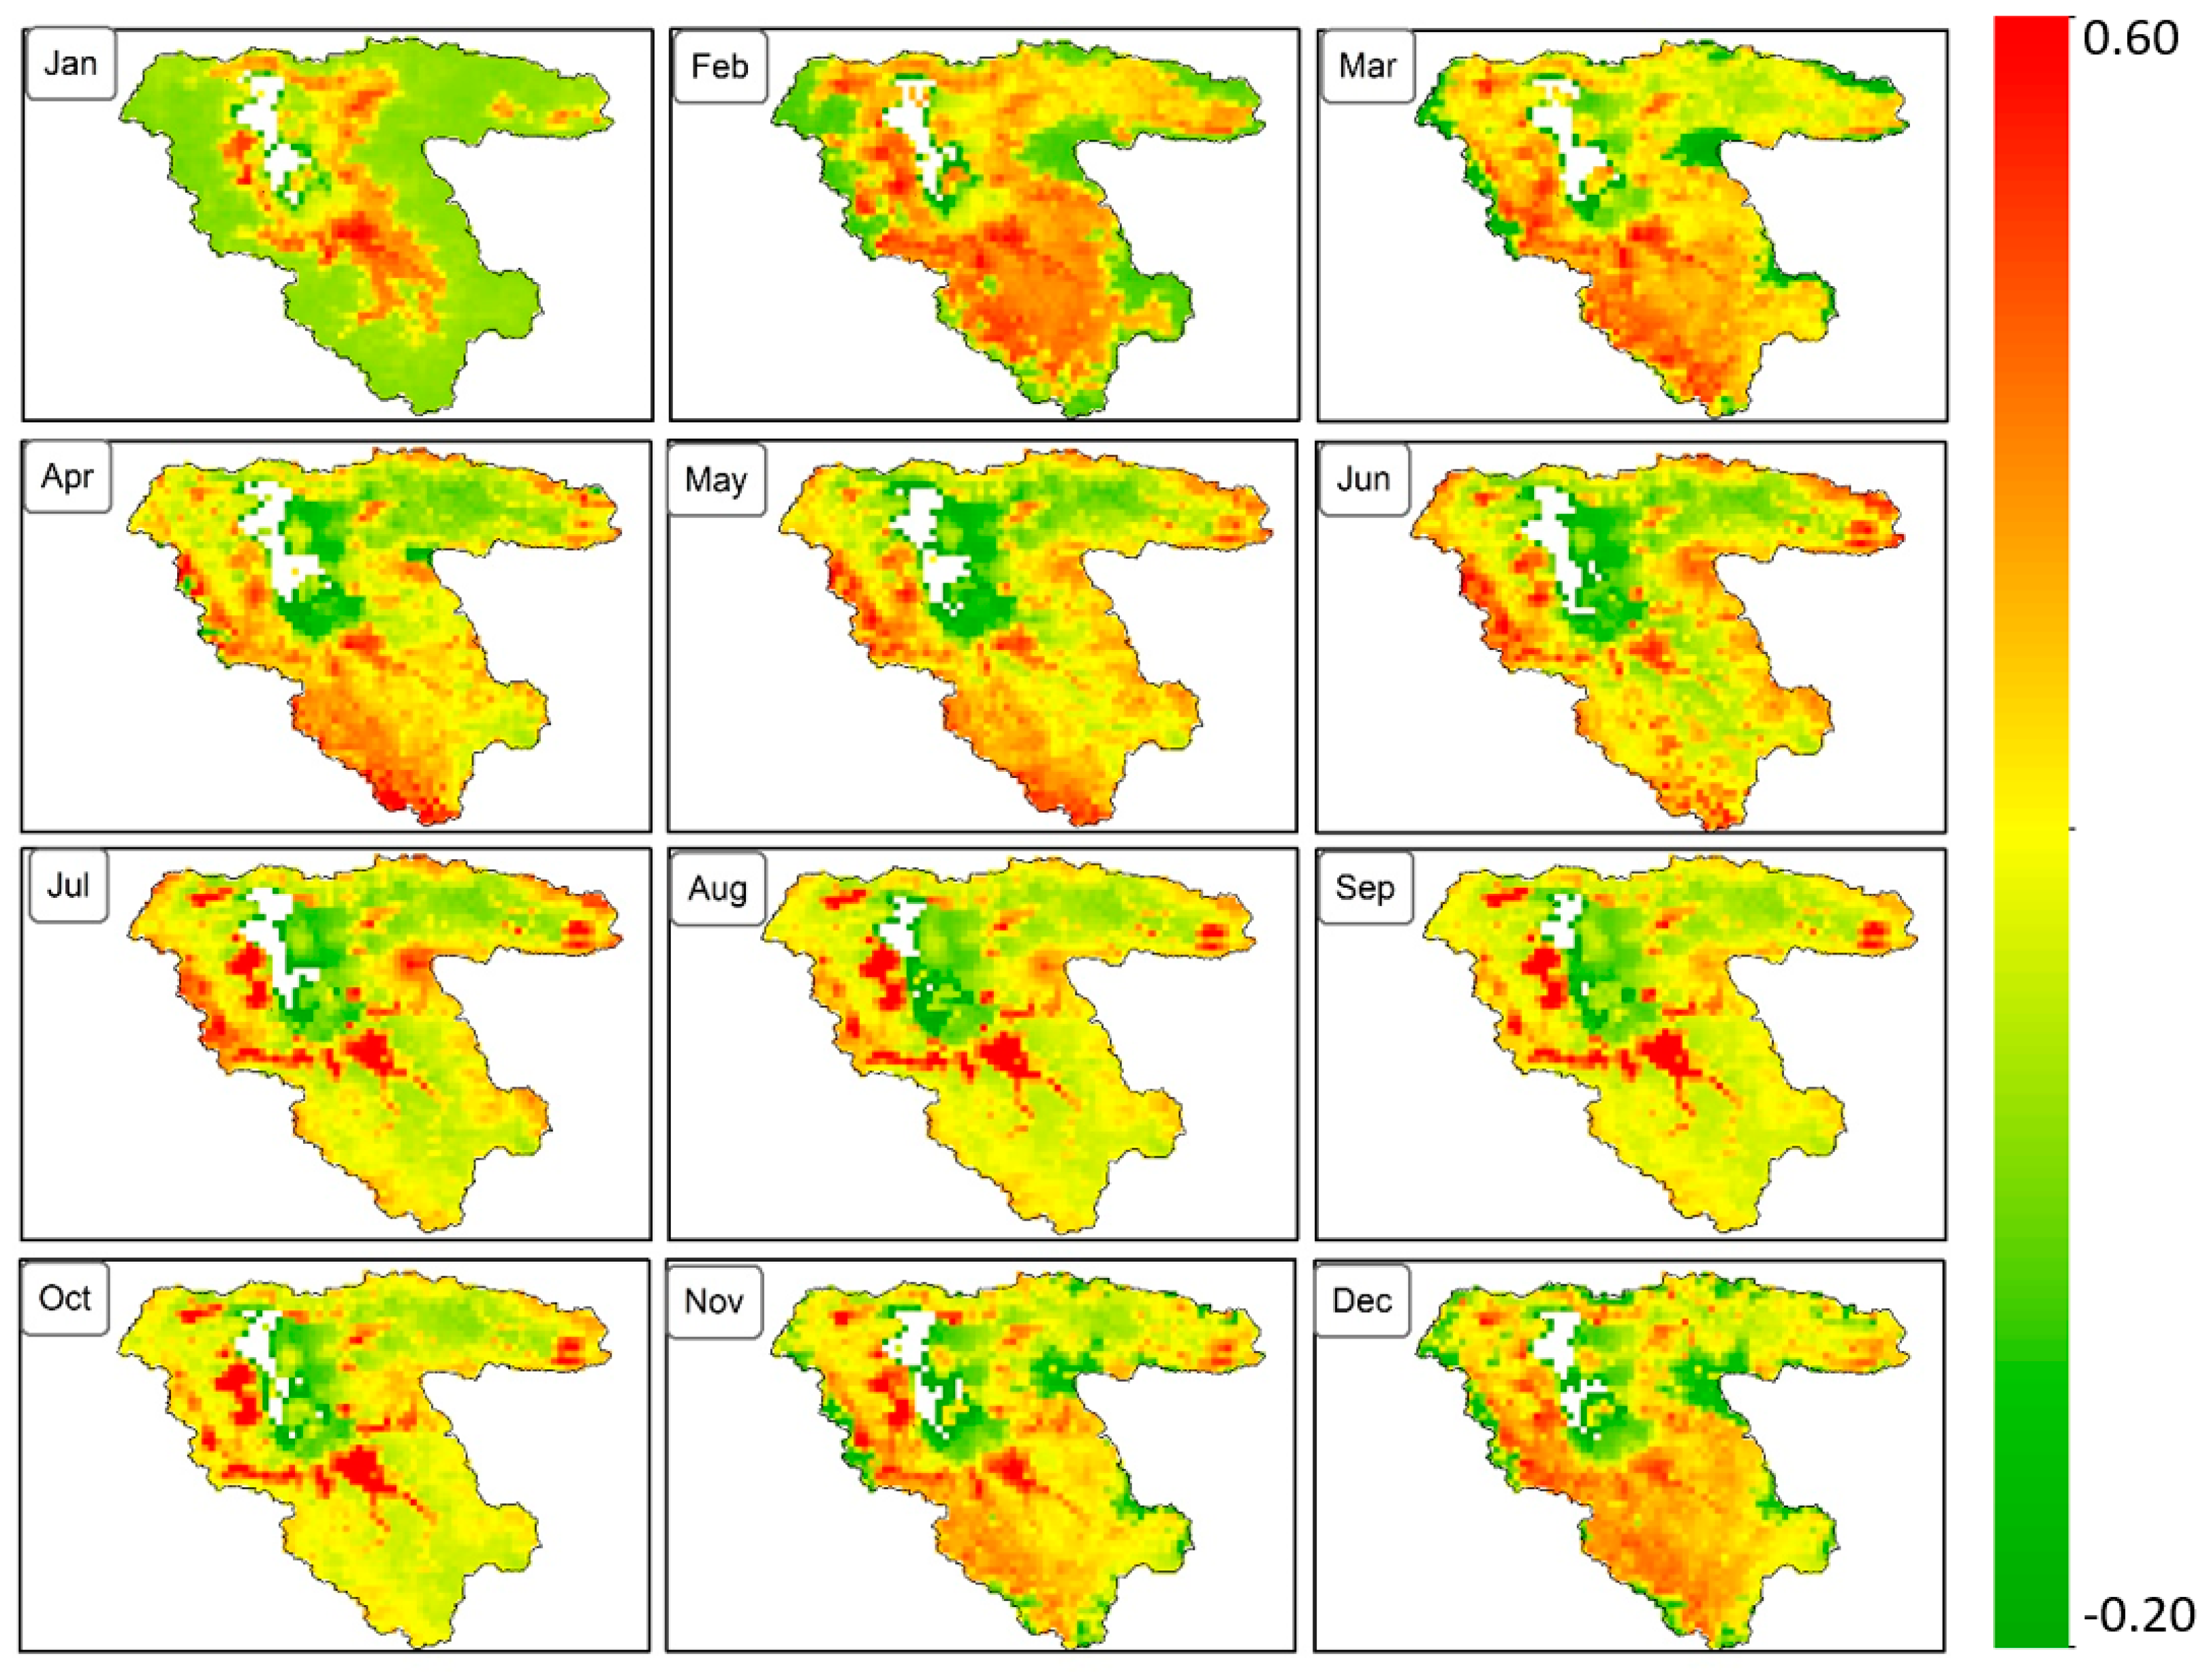
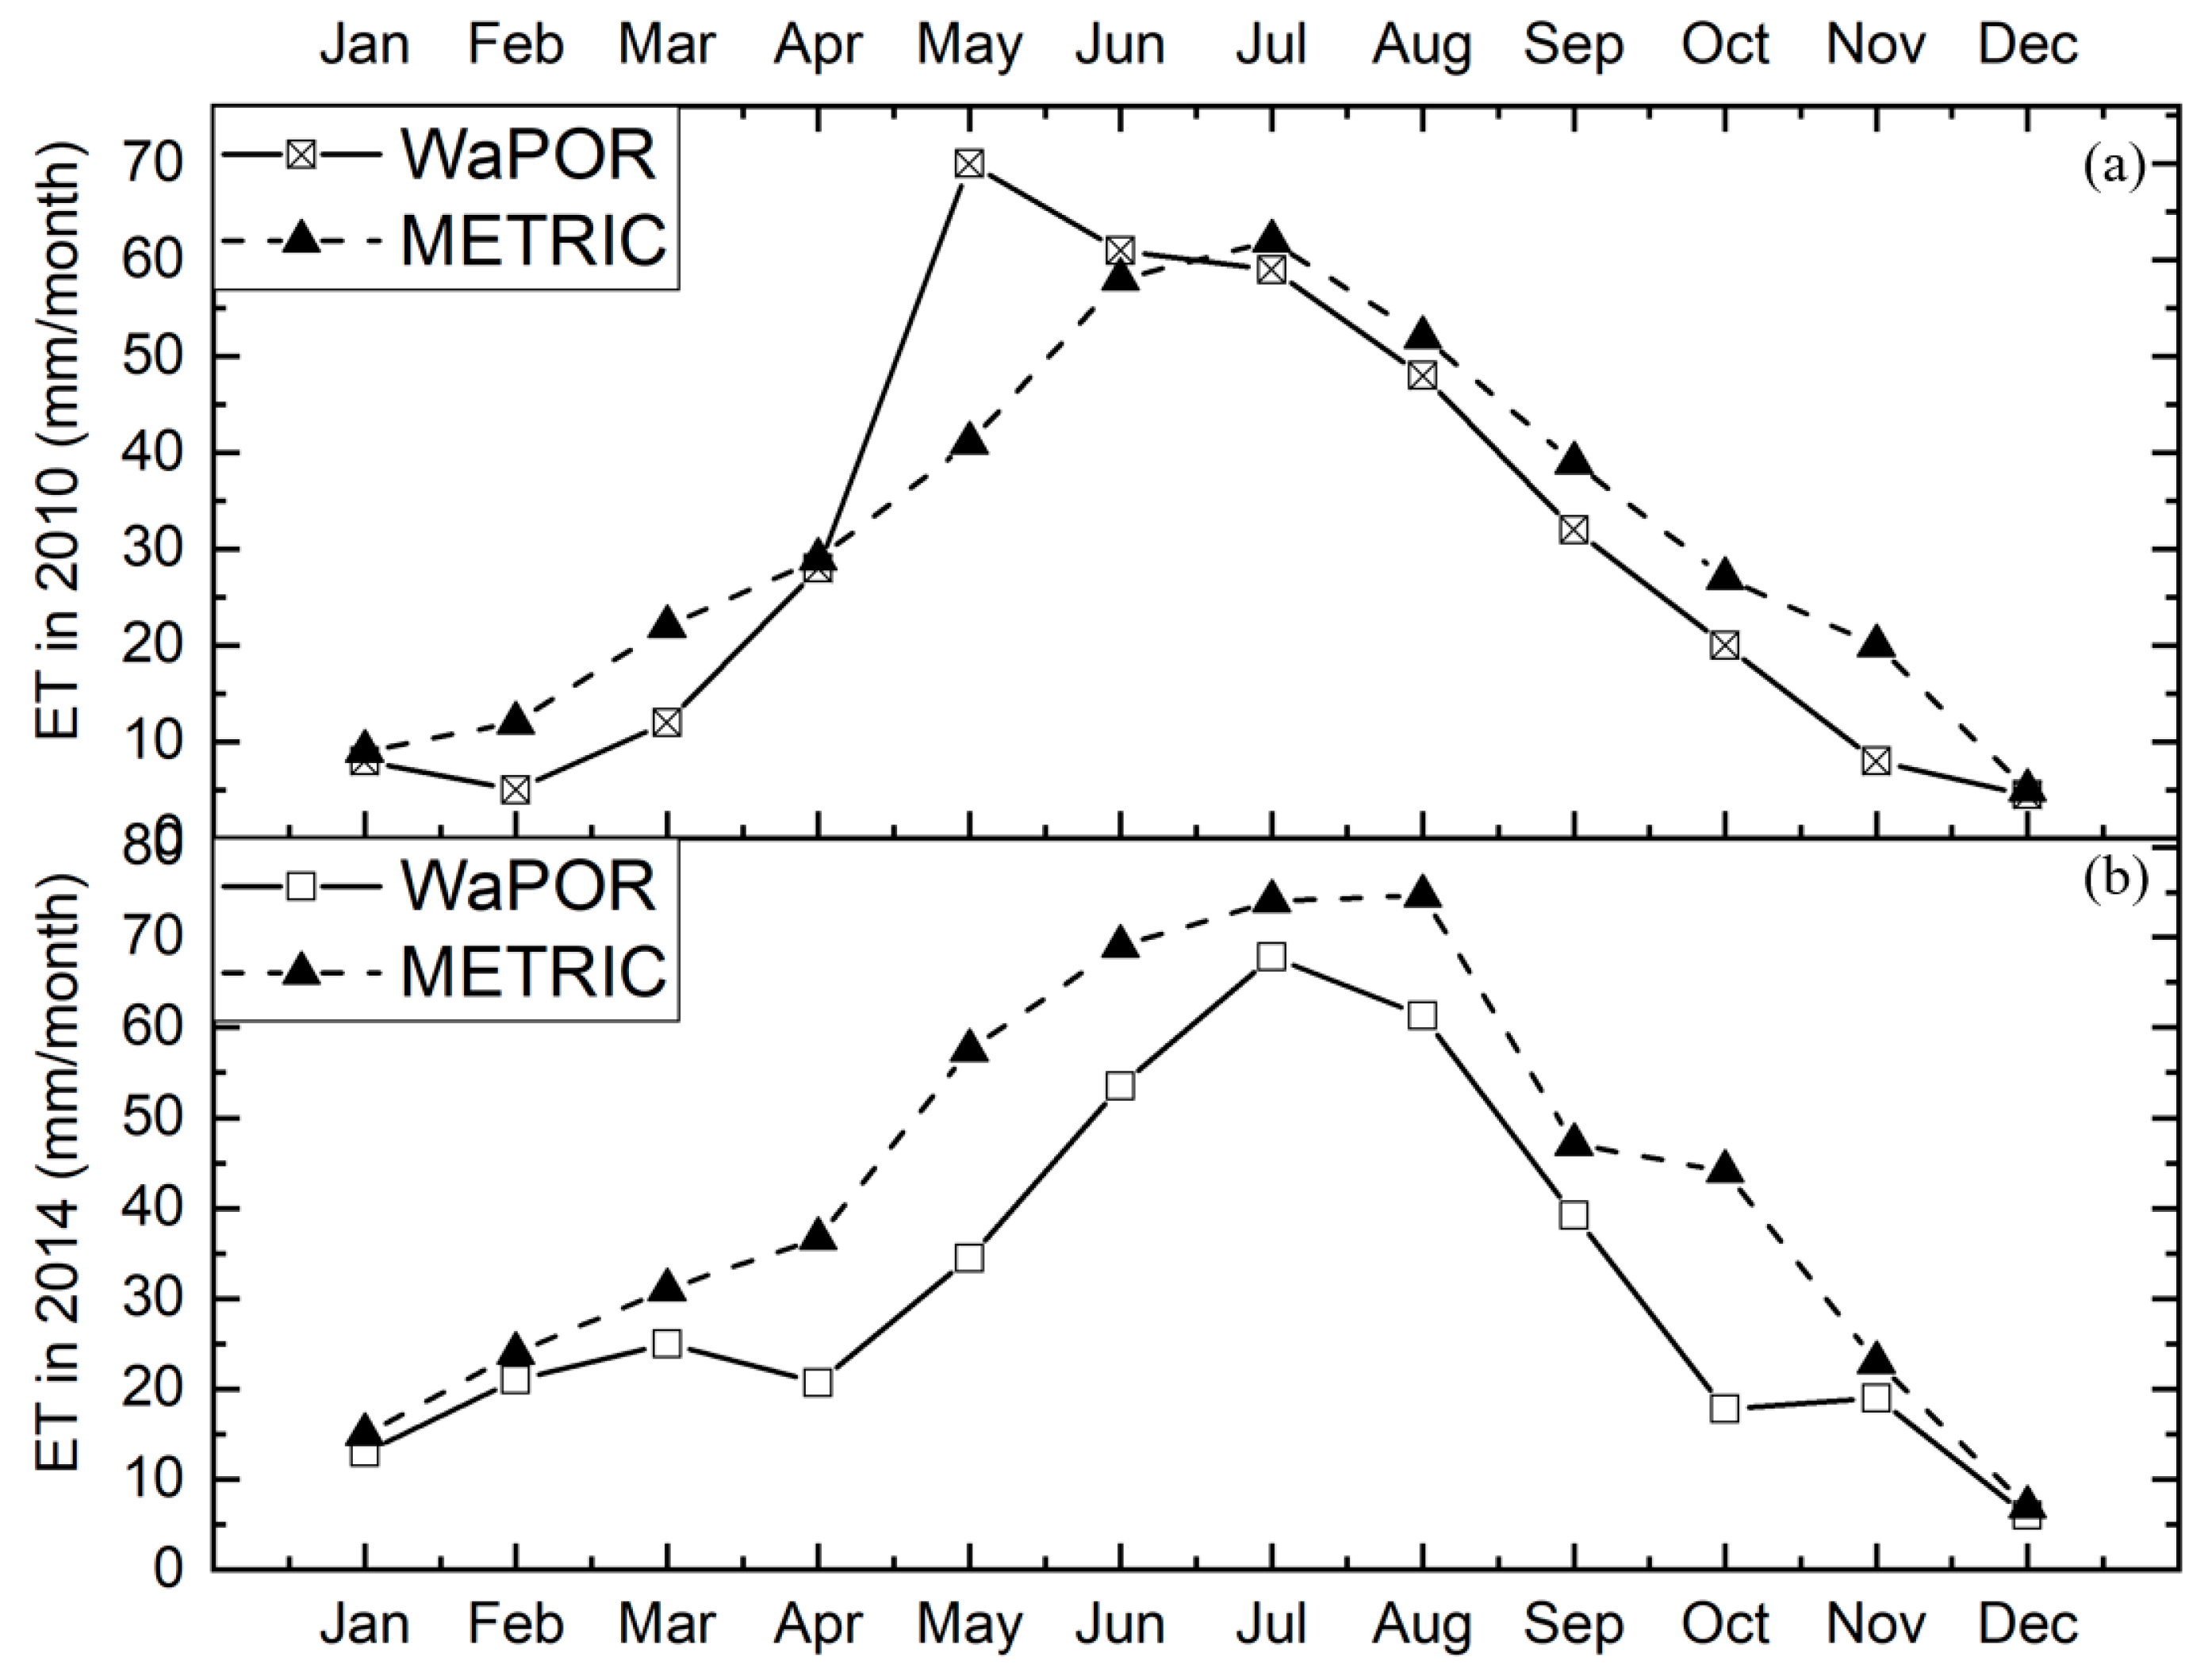
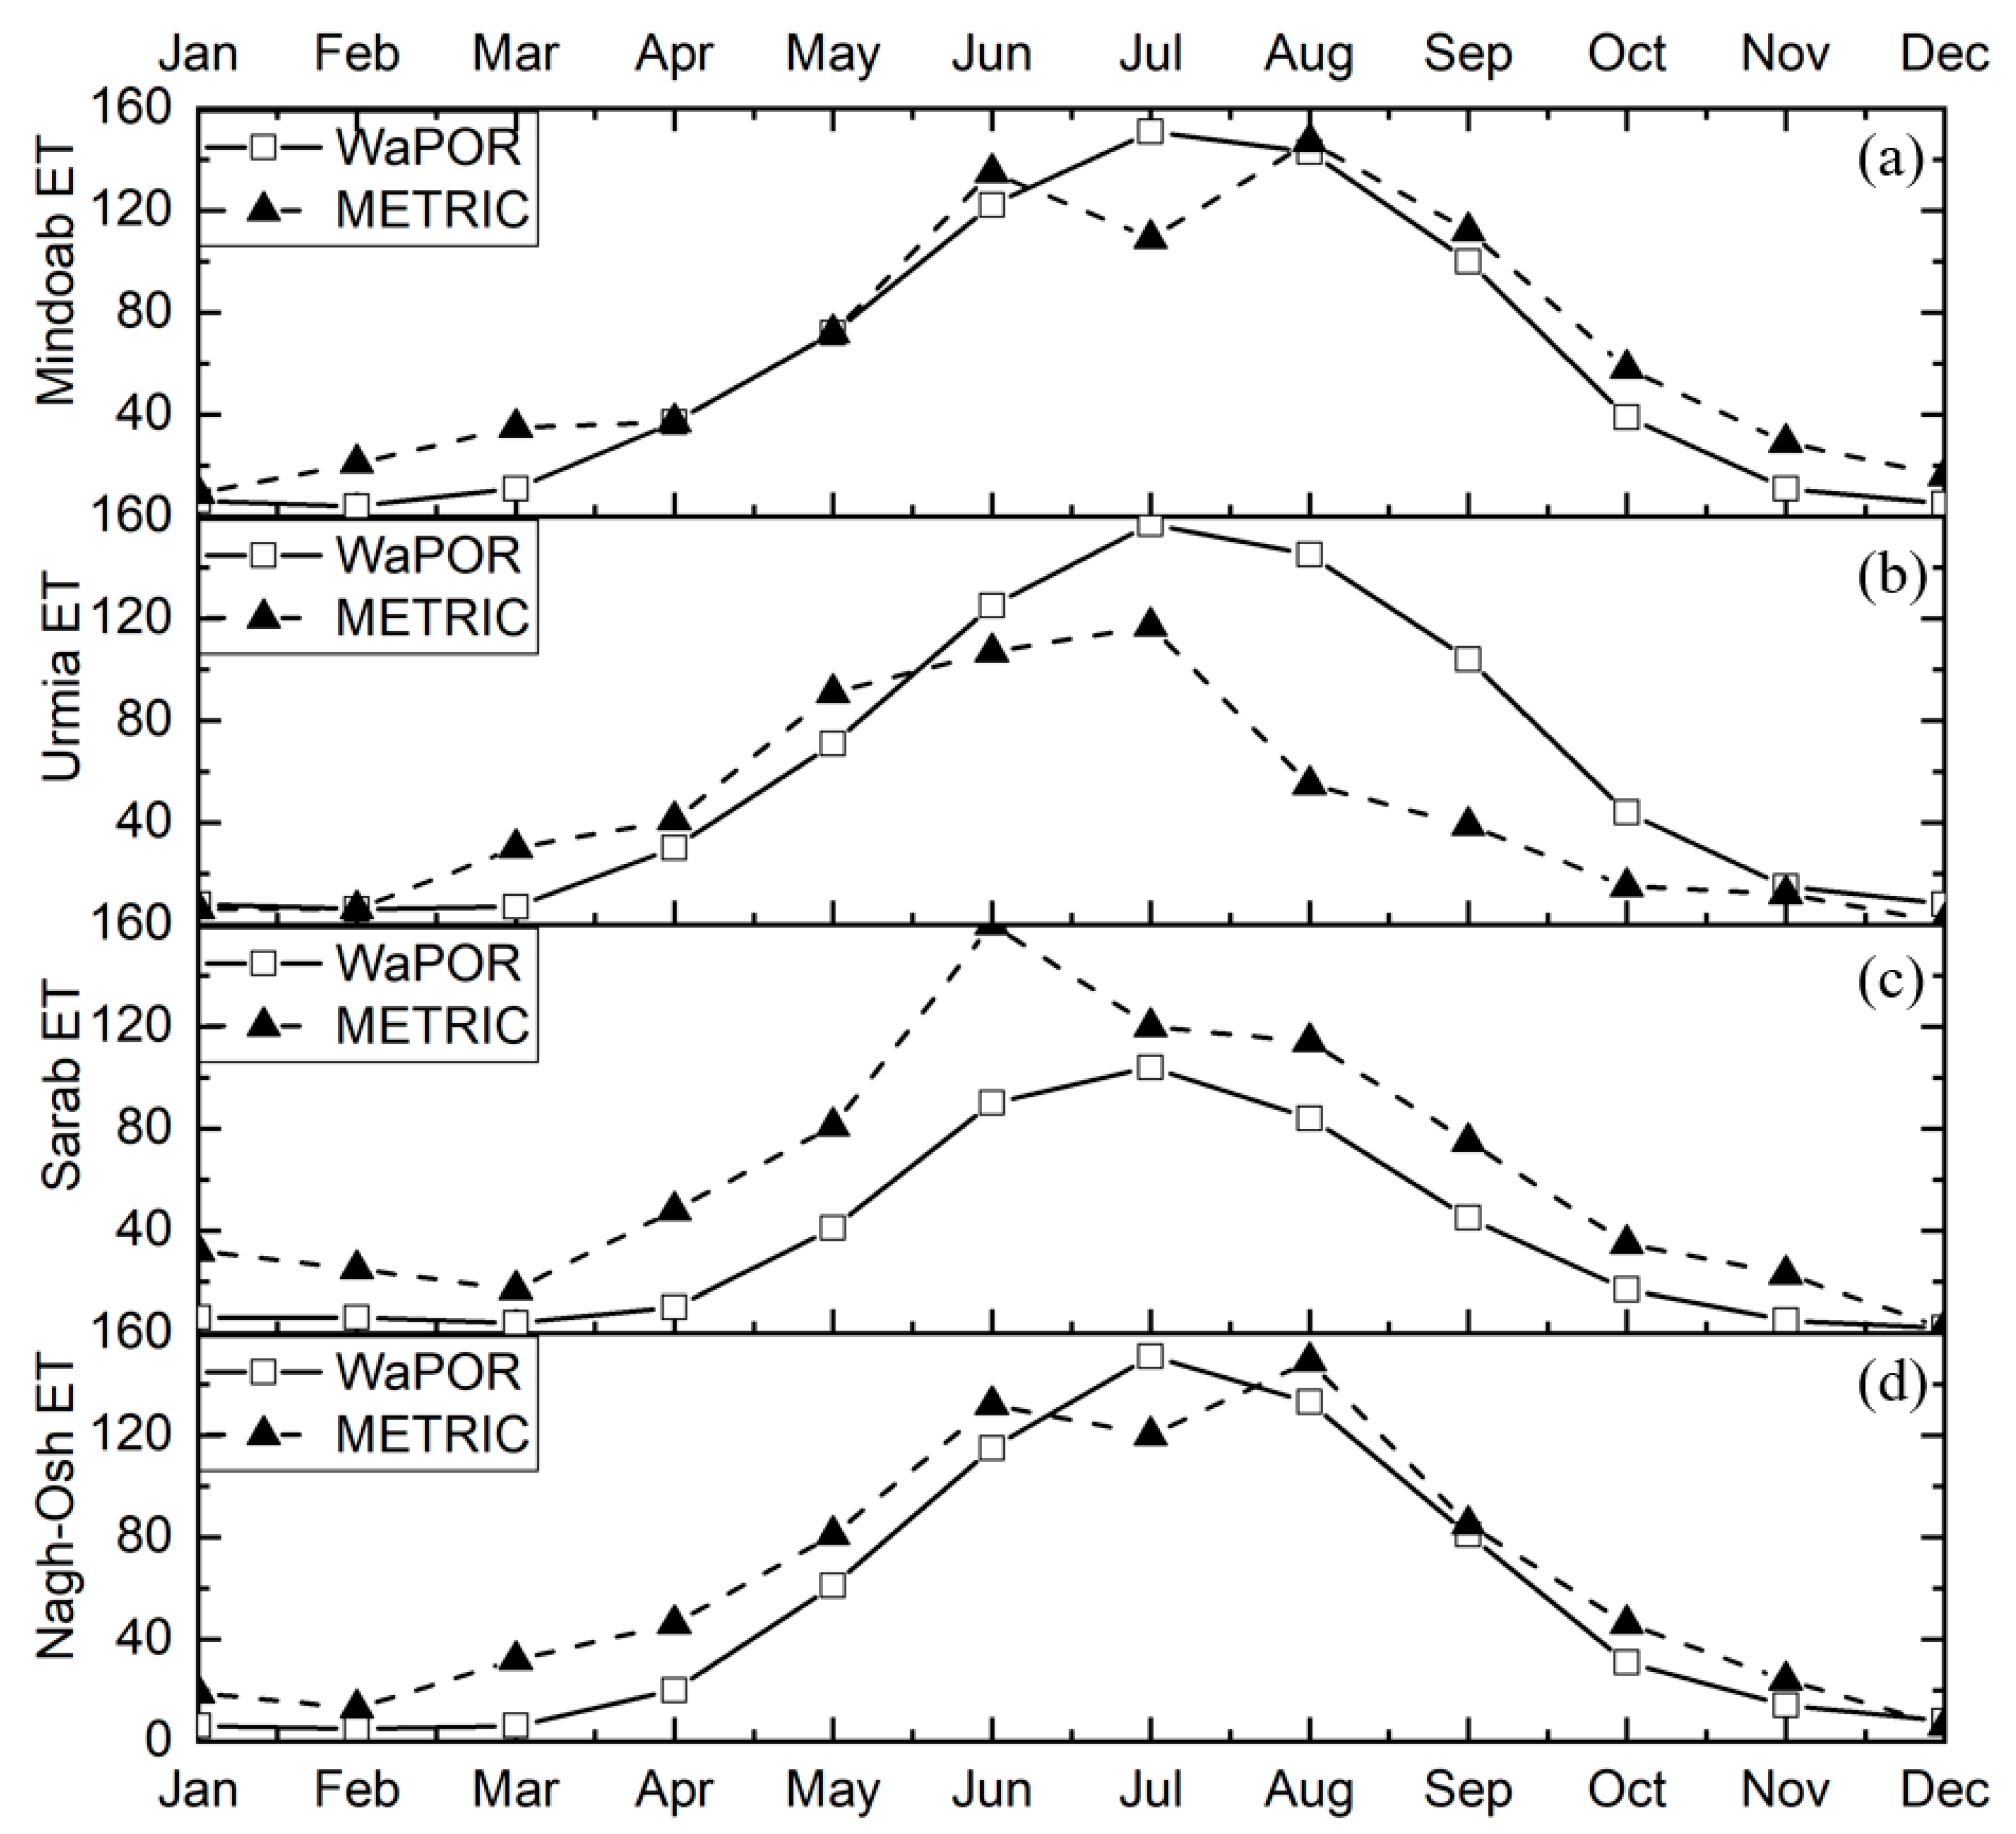
3.3. Spatial and Temporal Comparison
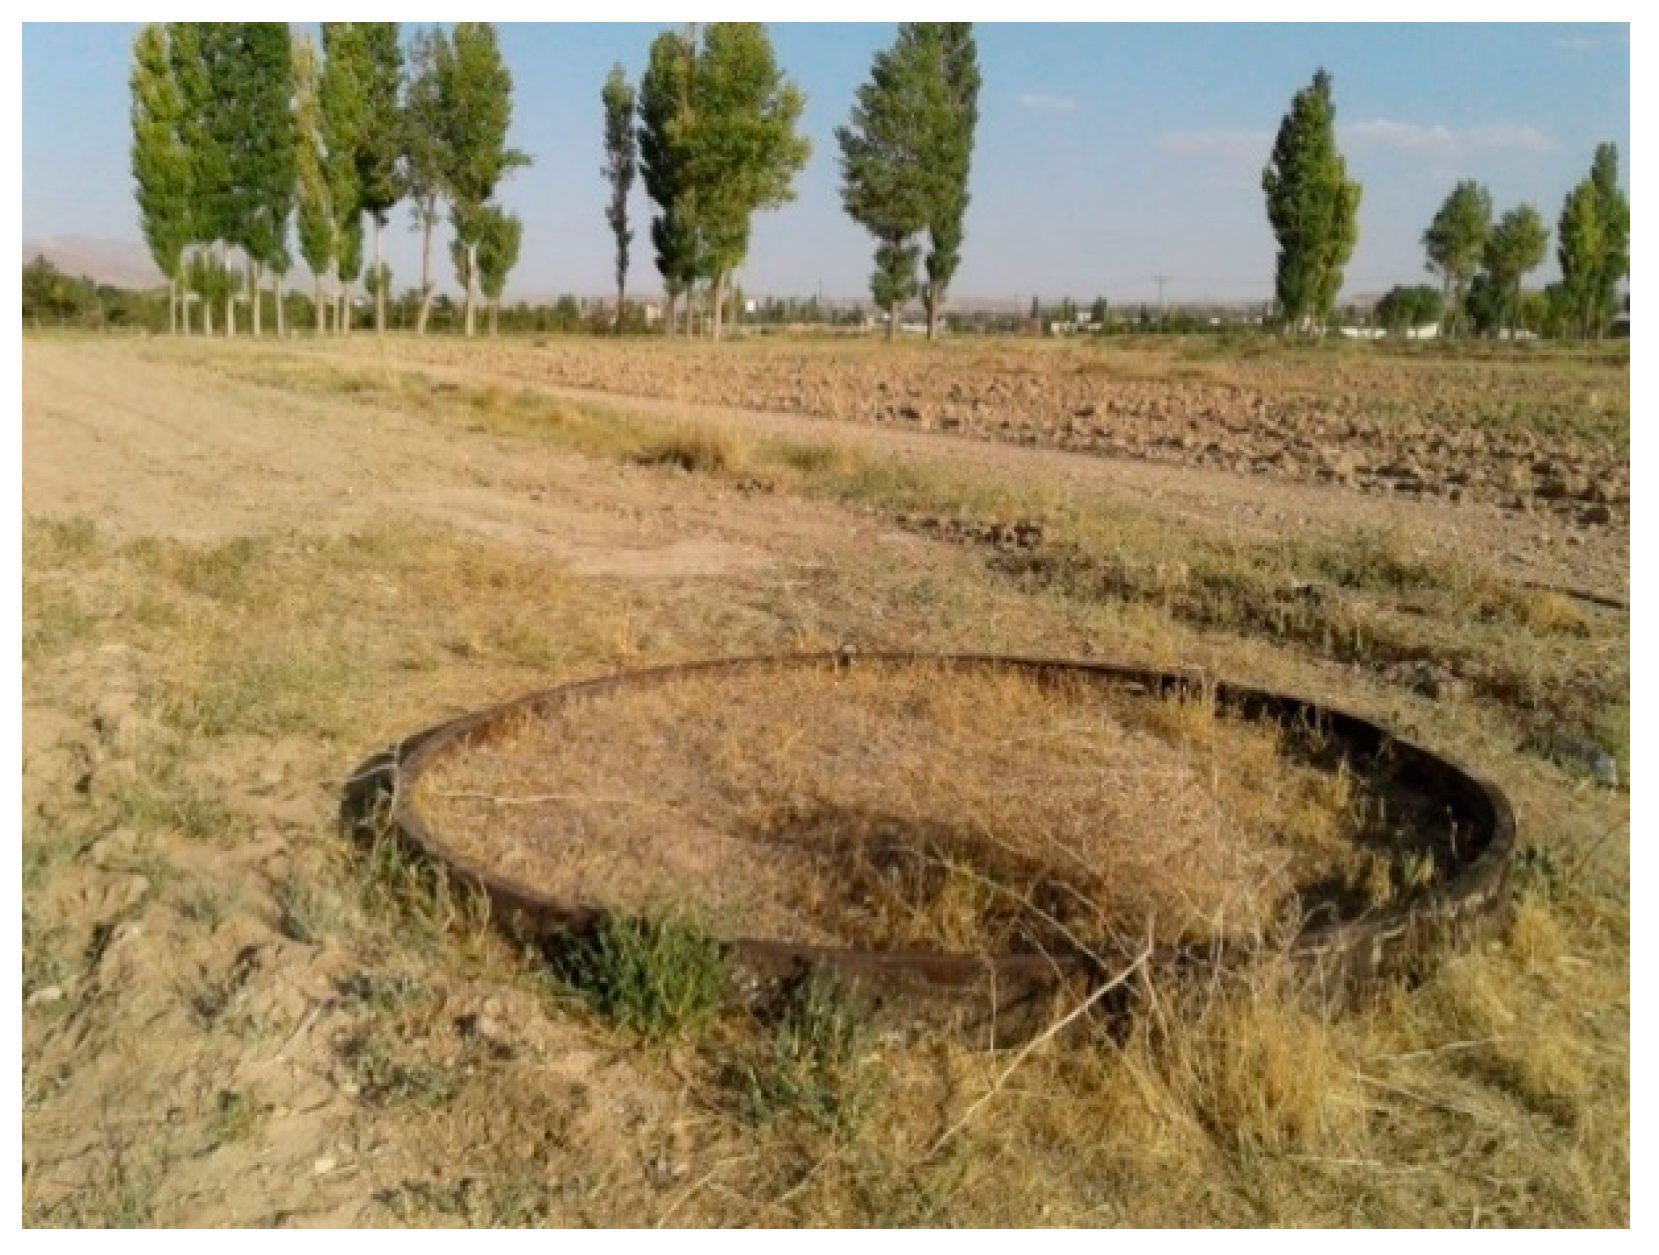
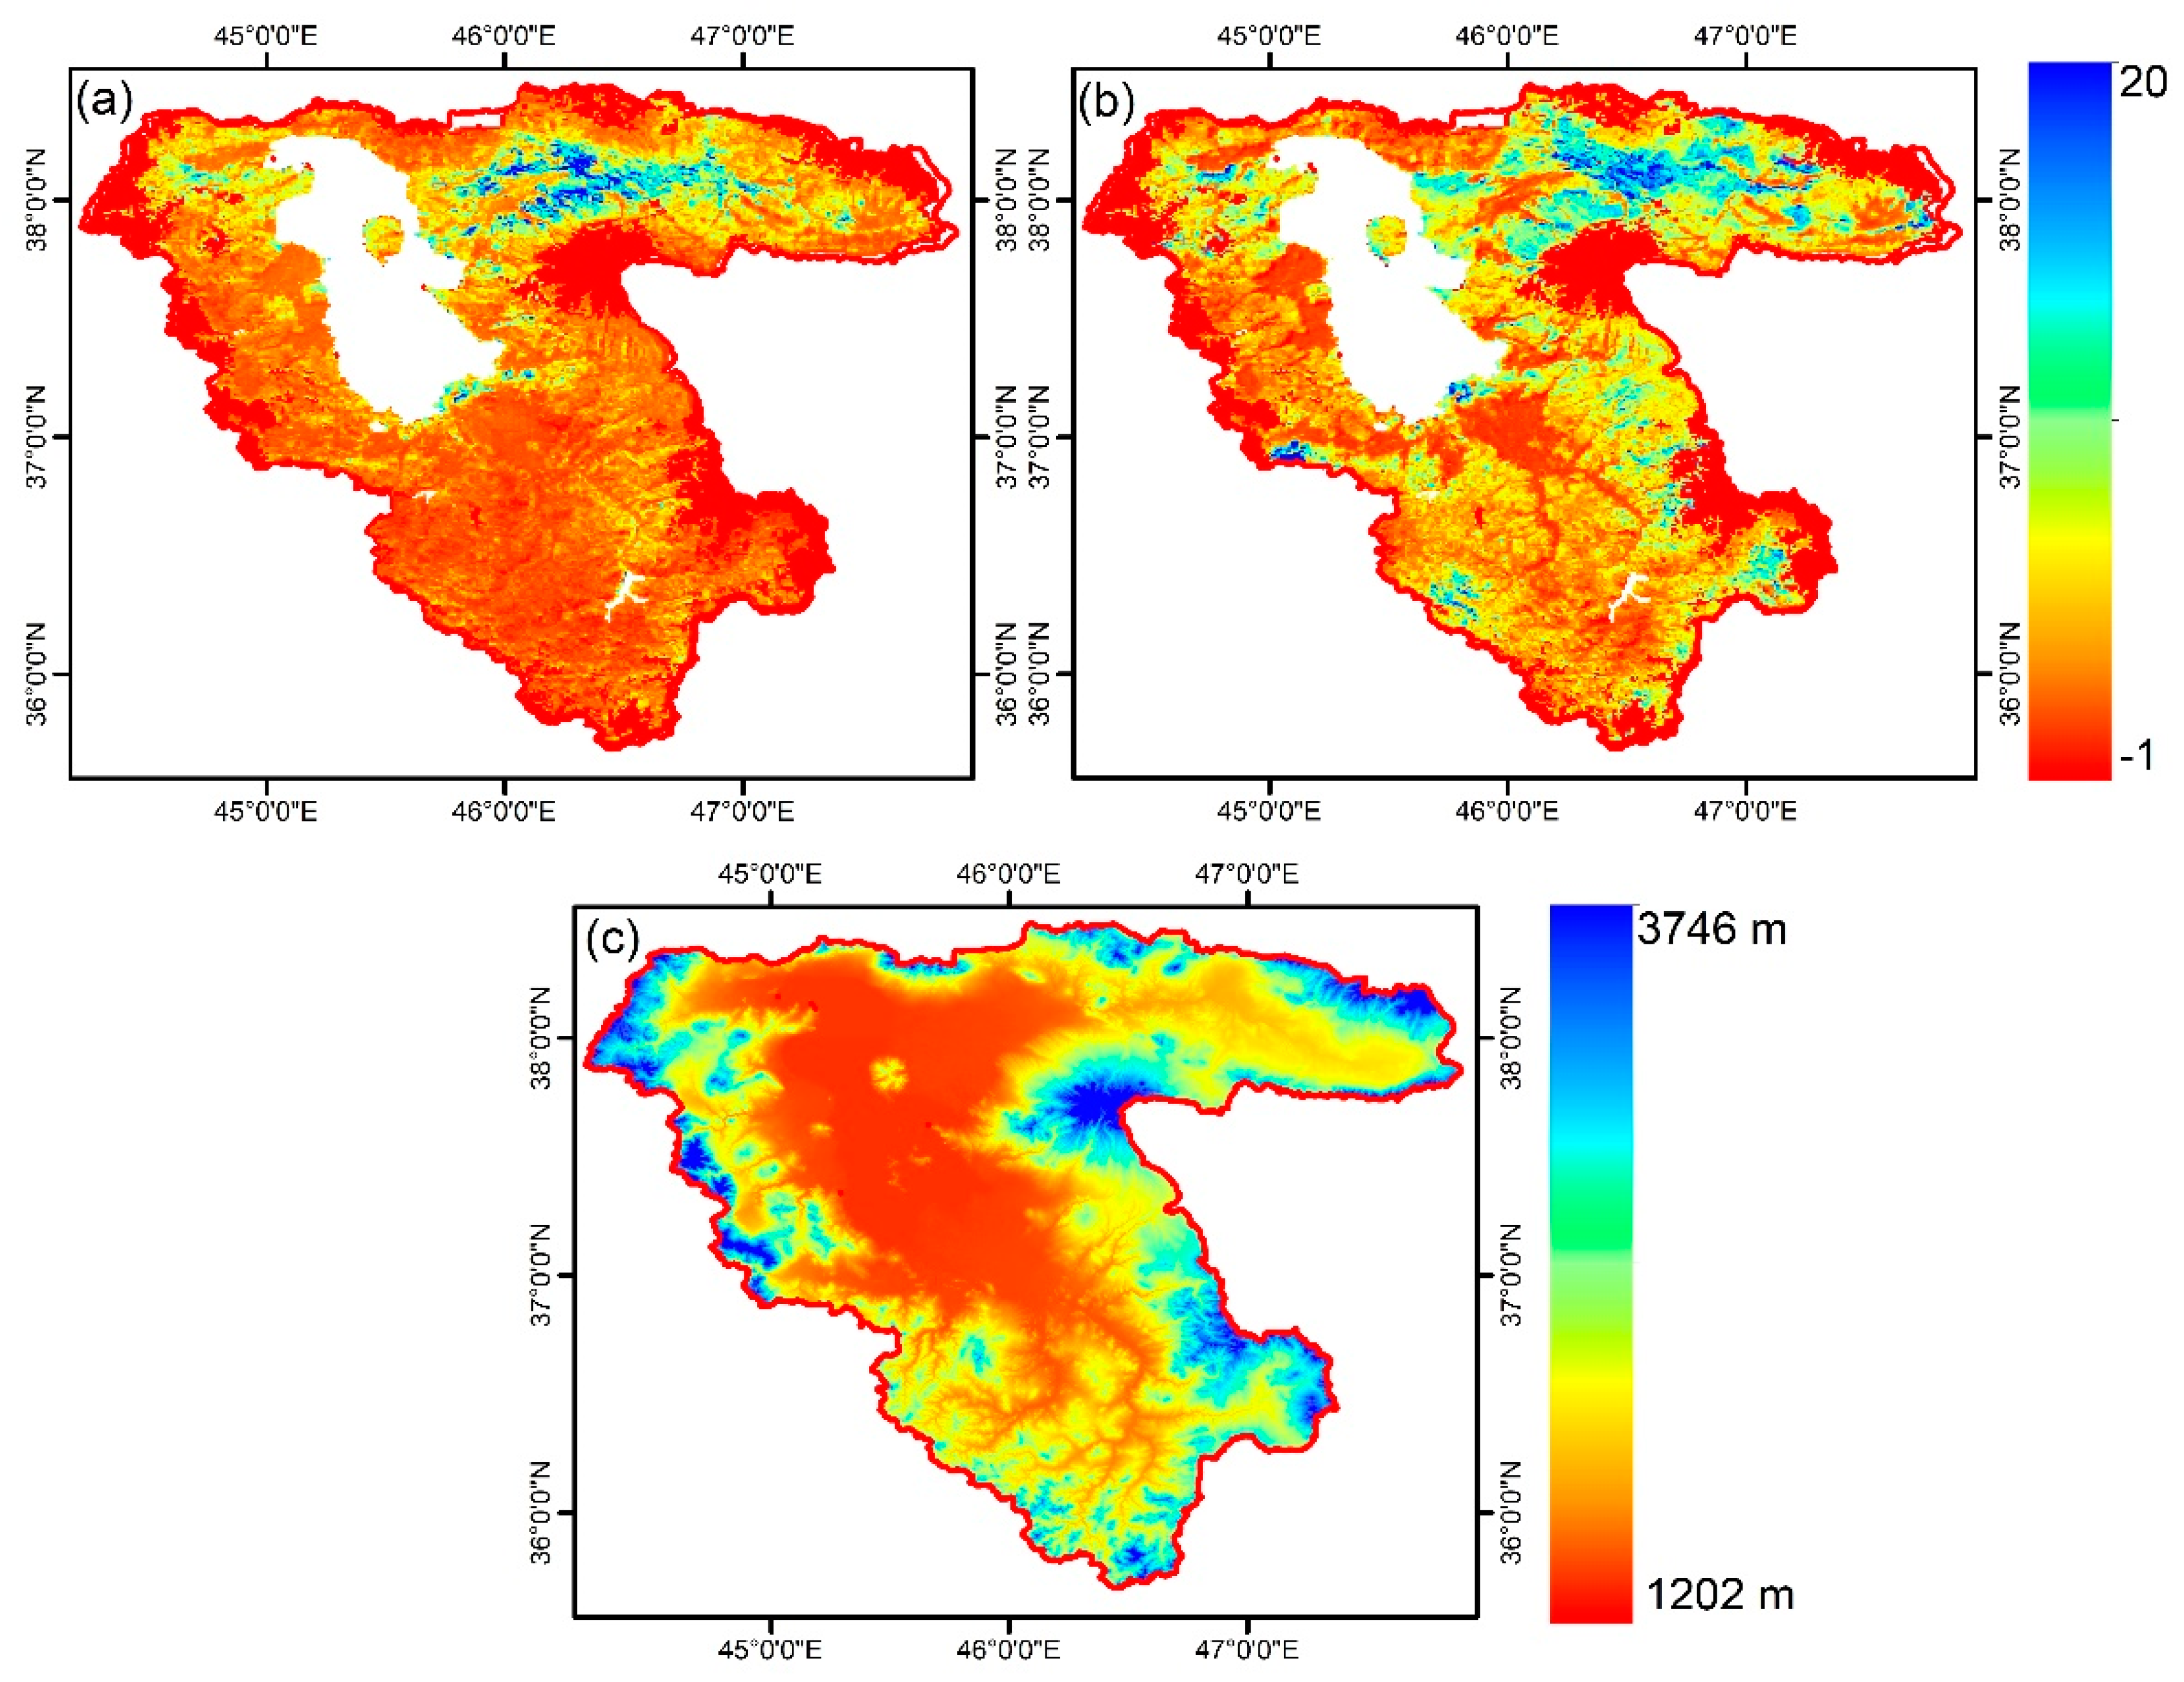
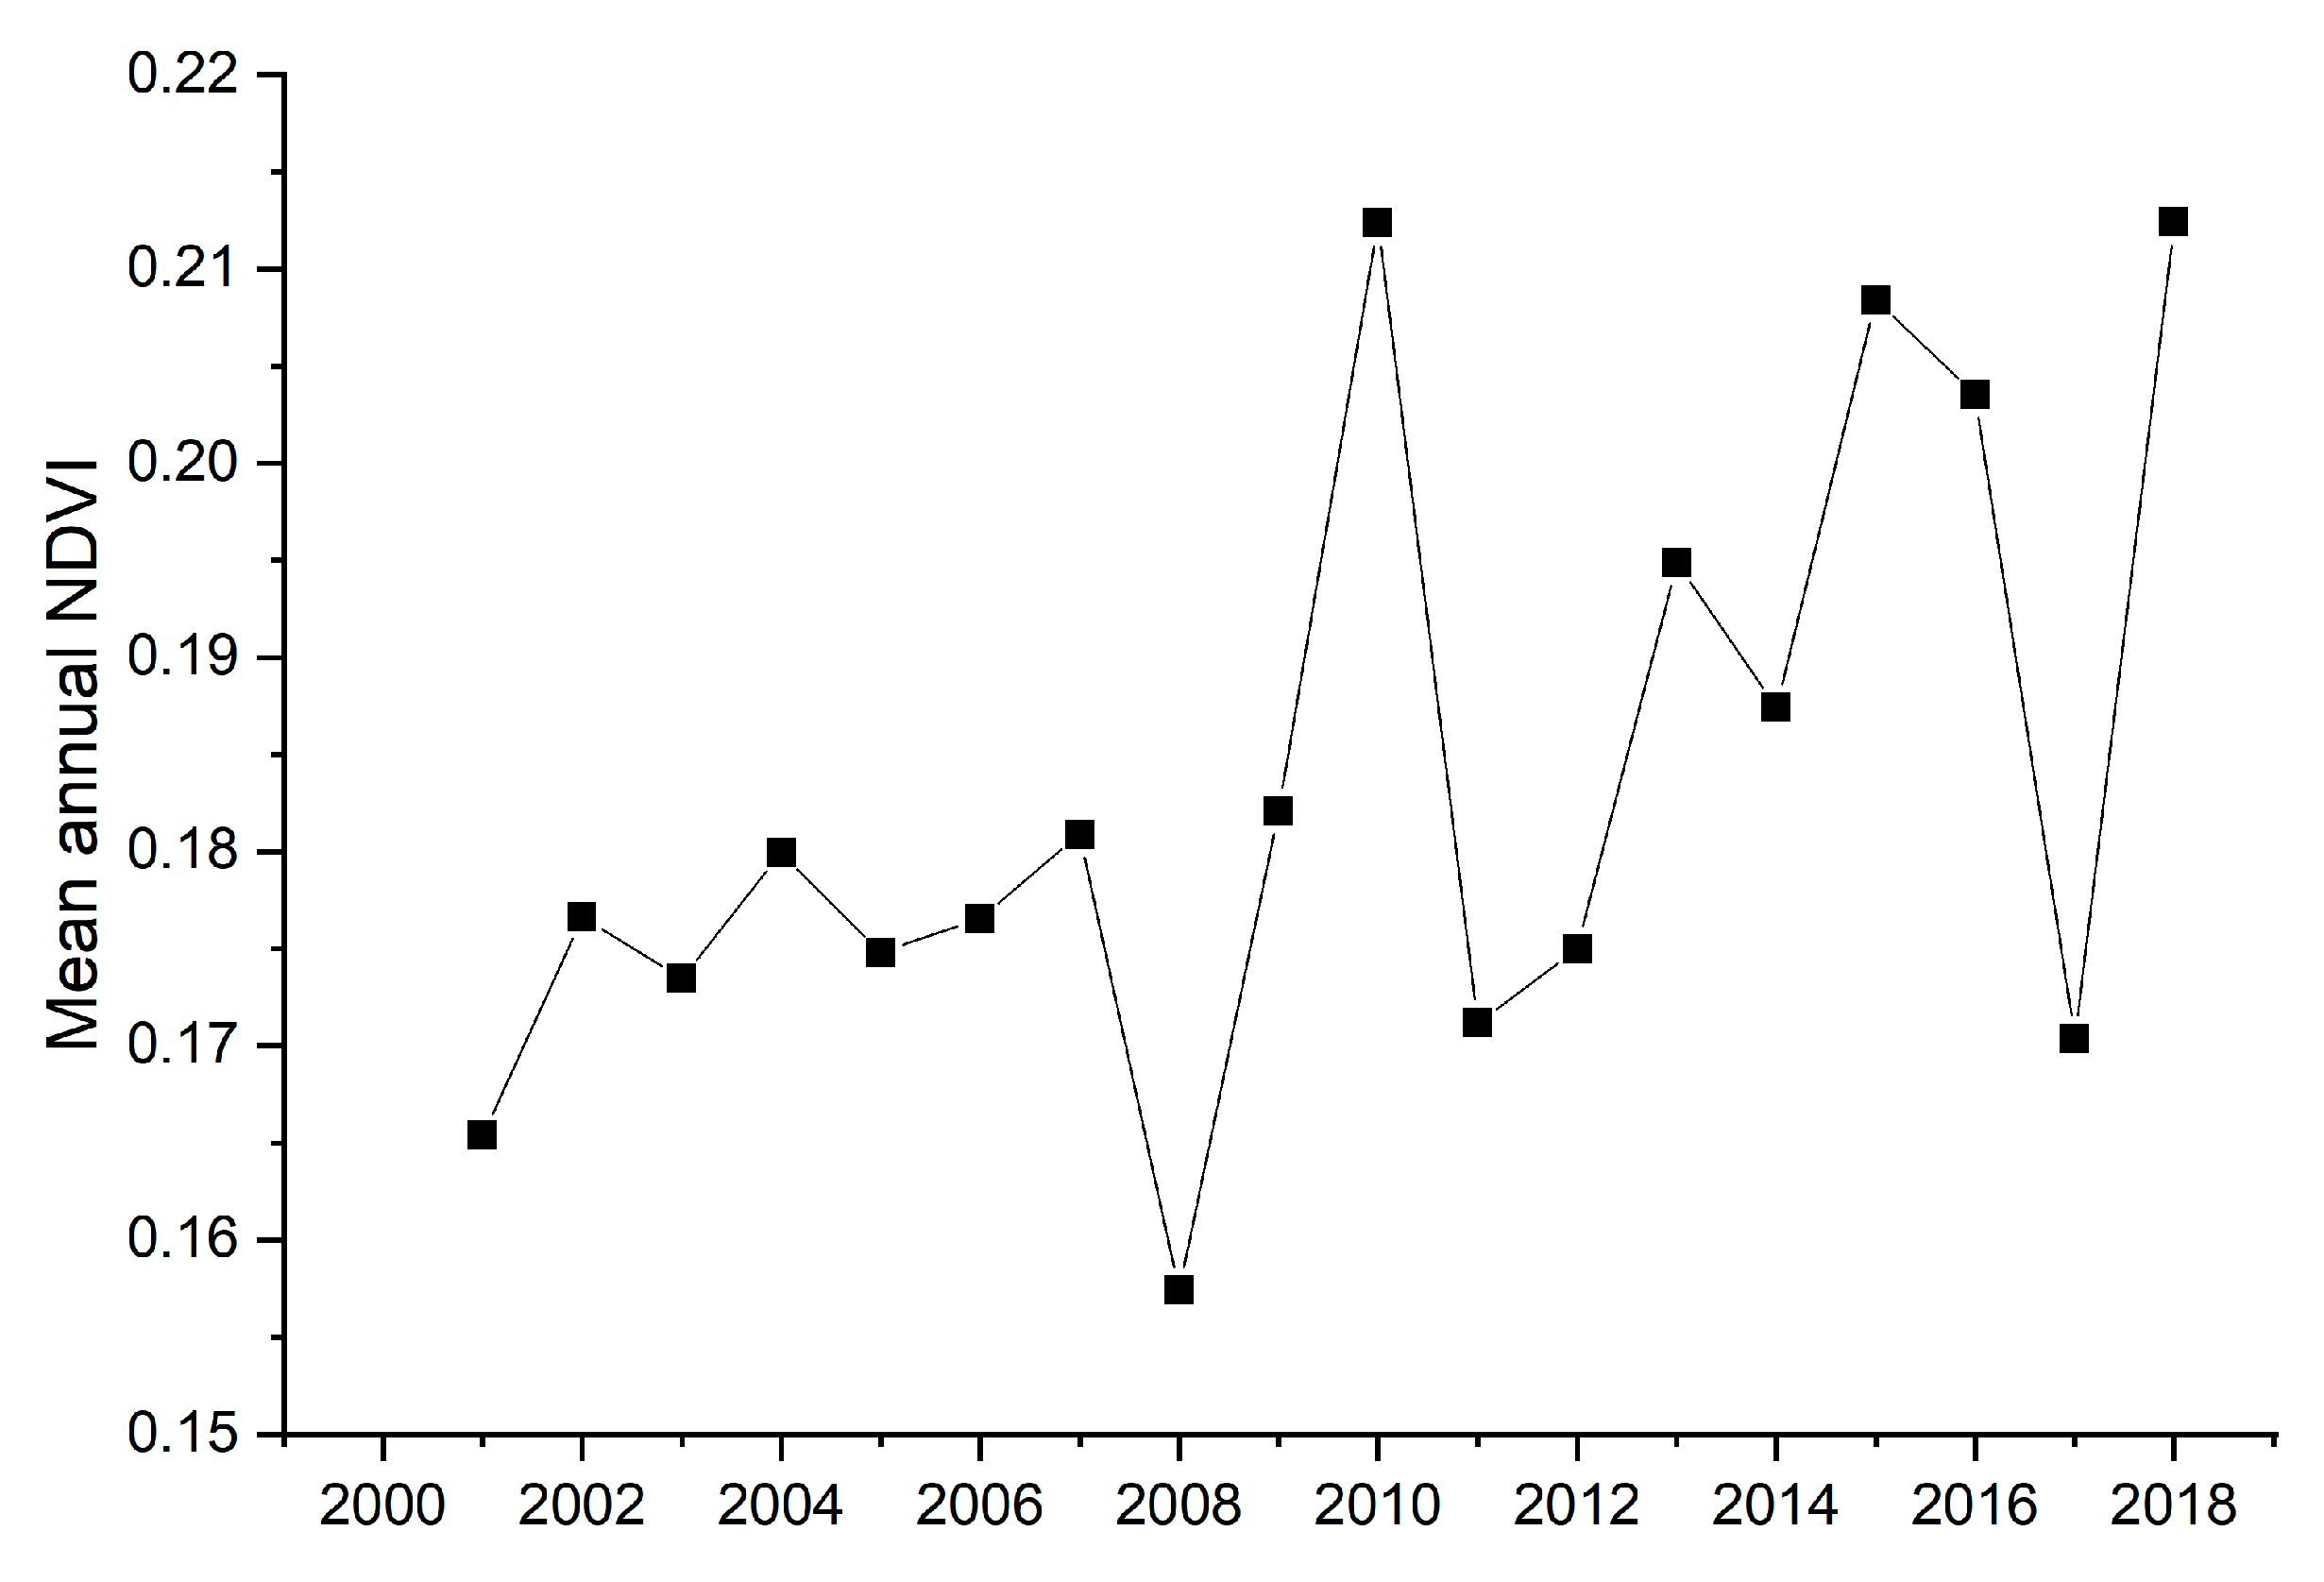
3.4. Evaluation of Differences in Rainfed Agriculture Areas
4. Concluding Remarks
Author Contributions
Funding
Acknowledgments
Conflicts of Interest
Appendix A

References
- Allen, R.G.; Tasumi, M.; Trezza, R. Satellite-Based Energy Balance for Mapping Evapotranspiration with Internalized Calibration (METRIC)—Model. J. Irrig. Drain. Eng. 2007, 133, 380–394. [Google Scholar] [CrossRef]
- Calcagno, G.; Mendicino, G.; Monacelli, G.; Senatore, A.; Versace, P. Distributed estimation of actual evapotranspiration through remote sensing techniques. In Methods and Tools for Drought Analysis and Management; Rossi, G., Vega, T., Bonaccorso, B., Eds.; Springer: Dordrecht, The Netherlands, 2007; pp. 125–147. [Google Scholar]
- Golian, S.; Javadian, M.; Behrangi, A. On the use of satellite, gauge, and reanalysis precipitation products for drought studies. Environ. Res. Lett. 2019, 14, 075005. [Google Scholar] [CrossRef]
- Zhang, Y.; Yu, Z.; Niu, H. Standardized precipitation evapotranspiration index is highly correlated with total water storage over China under future climate scenarios. Atmosp. Environ. 2018, 194, 123–133. [Google Scholar] [CrossRef]
- Molden, D.; Sakthivadivel, R. Water accounting to assess use and productivity of water. Int. J. Water Res. Dev. 1999, 15, 55–71. [Google Scholar] [CrossRef]
- Zwart, S.J.; Bastiaanssen, W.G.M.; de Fraiture, C.; Molden, D.J. WATPRO: A remote sensing based model for mapping water productivity of wheat. Agric. Water Manag. 2010, 97, 1628–1636. [Google Scholar] [CrossRef]
- Wilcox, J.D. Total solar eclipse effects on evapotranspiration captured by groundwater fluctuations in a Southern Appalachian fen. Hydrol. Proc. 2019, 33, 1538–1541. [Google Scholar] [CrossRef]
- Javadian, M.; Aghaie, M.; Tajrishi, M. Simulation of interaction between aquifer and surface flow for different water resources utilization scenarios (Case Study: Urmia Plain). In Proceedings of the 45th International Hydrogeologists Congress, Daejeon, Korea, 12 September 2018. [Google Scholar]
- Javadian, M. Simulation of Interaction between Aquifer and Surface Flow for Different Water Resources Utilization Scenarios (Case Study: Urmia Plain); Sharif University of Technology: Tehran, Iran, 2018. [Google Scholar]
- Jackson, R.D.; Reginato, R.J.; Idso, S.B. Wheat canopy temperature: A practical tool for evaluating water requirements. Water Resour. Res. 1977, 13, 651–656. [Google Scholar] [CrossRef]
- Javadian, M.; Kordi, F.; Tajrishy, M. Evaluation and comparison of estimation methods for actual evapotranspiration in the Urmia Lake Basin. Iranian J. Ecohydrol. 2019, 6, 125–136. [Google Scholar] [CrossRef]
- Bastiaanssen, W.G.M. Regionalization of Surface Flux Densities and Moisture Indicators in Composite Terrain: A Remote Sensing Approach under Clear Skies in Mediterranean Climates; SC-DLO: Wageningen, The Netherlands, 1995. [Google Scholar]
- Bastiaanssen, W.G.M.; Pelgrum, H.; Wang, J.; Ma, Y.; Moreno, J.F.; Roerink, G.J.; van der Wal, T. A remote sensing surface energy balance algorithm for land (SEBAL): 2. Validation. J. Hydrol. 1998, 212, 213–229. [Google Scholar] [CrossRef]
- Zwart, S.J.; Bastiaanssen, W.G.M. SEBAL for detecting spatial variation of water productivity and scope for improvement in eight irrigated wheat systems. Agric. Water Manag. 2007, 89, 287–296. [Google Scholar] [CrossRef]
- Du, J.; Song, K.; Wang, Z.; Zhang, B.; Liu, D. Evapotranspiration estimation based on MODIS products and surface energy balance algorithms for land (SEBAL) model in Sanjiang Plain, Northeast China. Chin. Geograph. Sci. 2013, 23, 73–91. [Google Scholar] [CrossRef]
- Youneszadeh, S.; Sima, S.; Javadian, M.; Tajrishy, M. Determining daily variations of river flood plains in the southern buffer zone of Urmia Lake in 2010. Iran Water Resour. Res. 2018, 14, 25–31. [Google Scholar]
- Moghim, S.; Javadian, M. Characterization of hydroclimatological changes in Iran. In Proceedings of the 2017 AGU Fall Meeting, New Orleans, LA, USA, 11–15 December 2017. [Google Scholar]
- Youneszadeh, S.; Javadian, M.; Tajrishy, M.; Taheri, H. Extraction of the lake Urmia water bodies using landsat 8 imagery. In Proceedings of the 7th National Conference on Water Resources Management, Yazd, Iran, 25 April 2018. [Google Scholar]
- Hesami, A.; Amini, A. Changes in irrigated land and agricultural water use in the Lake Urmia basin. Lake Res. Manag. 2016, 32, 288–296. [Google Scholar] [CrossRef]
- Iran_Water_Research_Institute. Integrated Water Resources Management for Lake Urmia Basin; Iran Water Research Institute Tehran: Tehran, Iran, 2006. [Google Scholar]
- Bagheri, M.; Morid, S.; Arshad, S. Application of remotely-sensed data to estimate a water budget for data-scarce endorheic basins: A case study of lake Urmia basin, Iran. J. Ind. Soc. Remote Sens. 2017, 45, 101–112. [Google Scholar] [CrossRef]
- Taheri, M.; Emadzadeh, M.; Gholizadeh, M.; Tajrishi, M.; Ahmadi, M.; Moradi, M. Investigating the temporal and spatial variations of water consumption in Urmia Lake River Basin considering the climate and anthropogenic effects on the agriculture in the basin. Agric. Water Manag. 2019, 213, 782–791. [Google Scholar] [CrossRef]
- Jia, L.; Xi, G.; Shaomin, L.; Chao, H.; Yan, Y.; Liu, G. Regional estimation of daily to annual regional evapotranspiration with MODIS data in the Yellow River Delta wetland. Hidrol. Earth Syst. Sci. 2009, 13, 1775–1787. [Google Scholar] [CrossRef]
- Leung, T.; Kong, J.; Njoku, E.; Staelin, D.; Waters, J. Theory for microwave thermal emission from a layer of cloud or rain. IEEE Trans. Antennas Propag. 1977, 25, 650–657. [Google Scholar] [CrossRef]
- Bastiaanssen, W.G.M.; Cheema, M.J.; Immerzeel, W.W.J.; Miltenburg, I.; Pelgrum, H. Surface energy balance and actual evapotranspiration of the transboundary Indus Basin estimated from satellite measurements and the ETLOOK model. Water Resour. Res. 2012, 48, W11512. [Google Scholar] [CrossRef]
- Chen, Y.; Ebert, E.E.; Walsh, K.J.E.; Davidson, N.E. Evaluation of TRMM 3B42 precipitation estimates of tropical cyclone rainfall using PACRAIN data. J. Geophys. Res. Atmosp. 2013, 118, 2184–2196. [Google Scholar] [CrossRef]
- Bastiaanssen, W.G.M. SEBAL-based sensible and latent heat fluxes in the irrigated Gediz Basin, Turkey. J. Hidrol. 2000, 229, 87–100. [Google Scholar] [CrossRef]
- Kjaersgaard, J.H.; Allen, R.G.; Garcia, M.; Kramber, W.; Trezza, R. Automated Selection of anchor pixels for landsat based evapotranspiration estimation. In Proceedings of the World Environmental and Water Resources Congress, Kansas City, MO, USA, 17–21 May 2009. [Google Scholar] [CrossRef]
- FAO. WaPOR Database Methodology: Level 1. Remote Sensing for Water Productivity Technical Report: Methodology Series; FAO: Rome, Italy, 2018. [Google Scholar]
- Wang, Y.; Yu, P.; Xiong, W.; Shen, Z.; Mingchun, G.; Shi, Z.; Du, A.; Wang, L. Water-Yield Reduction After Afforestation and Related Processes in the Semiarid Liupan Mountains, Northwest China 1. JAWRA 2008, 44, 1086–1097. [Google Scholar]
- Gan, M.; Jia, Y.; Shao, M.A.; Guo, C.; Li, T. Permanent gully increases the heterogeneity of soil water retention capacity across a slope-gully system. Agric. Ecosyst. Environ. 2019, 272, 206–217. [Google Scholar] [CrossRef]
- Sherwood, S.; Fu, Q. Climate change. A drier future? Science 2014, 343, 737–739. [Google Scholar] [CrossRef] [PubMed]
- Behrangi, A.; Fetzer, E.J.; Granger, S.L. Early detection of drought onset using near surface temperature and humidity observed from space. Int. J. Remote Sens. 2016, 37, 3911–3923. [Google Scholar] [CrossRef]
- Behrangi, A.; Loikith, P.; Fetzer, E.M.; Nguyen, H.; Granger, S. Utilizing humidity and temperature data to advance monitoring and prediction of meteorological drought. Climate 2015, 3, 999–1017. [Google Scholar] [CrossRef]
- Singh, A.; Behrangi, A.B.; Fisher, J.T.; Reager, J. On the desiccation of the south aral sea observed from spaceborne missions. Remote Sens. 2018, 10, 793. [Google Scholar] [CrossRef]
- Hulley, G.; Hook, S.; Fisher, J.; Lee, C. ECOSTRESS, A NASA Earth-Ventures Instrument for studying links between the water cycle and plant health over the diurnal cycle. In Proceedings of the 2017 IEEE International Geoscience and Remote Sensing Symposium (IGARSS), Fort Worth, TX, USA, 23–28 July 2017; pp. 5494–5496. [Google Scholar]


| Data | Product ID | Format | Temporal Res. | Spatial Res. |
|---|---|---|---|---|
| Land Surface Temperature (LST) | MOD11L2 | Raster | 5 min | 1 km |
| Leaf Area Index (LAI) | MCD15A3 | Raster | 4-day | 1 km |
| Normalized Difference Vegetation Index (NDVI) | MOD13A2 | Raster | 16-day | 1 km |
| Reflectance (all of band) | MOD02 & MOD09 | Raster | 5 min and daily | 1 km |
| Anchor Pixel | Step No | Procedure |
|---|---|---|
| Cold | 1 | Select the top 5% NDVI pixels within a predefined and filtered Area of Interest (AOI) |
| 2 | From the group in (1), calculate the average temperature among the coldest 20% of Ts | |
| 3 | Cold pixel candidates are pixels that have a Ts within ± 0.2 K of the average Ts from (2) and an albedo within ± 0.02 | |
| 4 | One pixel is selected from the group in (3) based on the homogeneity among its neighboring pixels | |
| Hot | 1 | Select the lowest 10% NDVI pixels within a predefined and filtered Area of Interest (AOI). |
| 2 | From the group in (1) calculate the average temperature among the hottest 20% Ts. | |
| 3 | One pixel is selected from the group in (2) that has a Ts ± 0.2 K of the average Ts and has high homogeneity among neighboring pixels |
| Date | Lysimeter ET | METRIC ET | WaPOR ET |
|---|---|---|---|
| 27 May 2010 | 5 | 4.7 | 0.4 |
| 3 June 2010 | 4.1 | 3.8 | 1.3 |
| 9 July 2010 | 10.5 | 8.1 | 1.9 |
| 30 July 2010 | 2.2 | 3.1 | 1.5 |
| Elevation Ranges (m) | Average of Relative Spatial Difference between METRIC & WaPOR in 2010 | Average of Relative Spatial Difference between METRIC & WaPOR in 2014 |
|---|---|---|
| 1235–1400 | 1.12 | 1.08 |
| 1400–1600 | 1.23 | 1.31 |
| 1600–1800 | 3.61 | 4.12 |
| 1800–2000 | 4.79 | 4.05 |
| 2000–2200 | 4.23 | 3.85 |
© 2019 by the authors. Licensee MDPI, Basel, Switzerland. This article is an open access article distributed under the terms and conditions of the Creative Commons Attribution (CC BY) license (http://creativecommons.org/licenses/by/4.0/).
Share and Cite
Javadian, M.; Behrangi, A.; Gholizadeh, M.; Tajrishy, M. METRIC and WaPOR Estimates of Evapotranspiration over the Lake Urmia Basin: Comparative Analysis and Composite Assessment. Water 2019, 11, 1647. https://doi.org/10.3390/w11081647
Javadian M, Behrangi A, Gholizadeh M, Tajrishy M. METRIC and WaPOR Estimates of Evapotranspiration over the Lake Urmia Basin: Comparative Analysis and Composite Assessment. Water. 2019; 11(8):1647. https://doi.org/10.3390/w11081647
Chicago/Turabian StyleJavadian, Mostafa, Ali Behrangi, Mohsen Gholizadeh, and Masoud Tajrishy. 2019. "METRIC and WaPOR Estimates of Evapotranspiration over the Lake Urmia Basin: Comparative Analysis and Composite Assessment" Water 11, no. 8: 1647. https://doi.org/10.3390/w11081647
APA StyleJavadian, M., Behrangi, A., Gholizadeh, M., & Tajrishy, M. (2019). METRIC and WaPOR Estimates of Evapotranspiration over the Lake Urmia Basin: Comparative Analysis and Composite Assessment. Water, 11(8), 1647. https://doi.org/10.3390/w11081647