Article

Evaluation of Stream and Wetland Restoration Using UAS-Based Thermal Infrared Mapping

1
Department of Natural Resources and the Environment, Center for Environmental Sciences and Engineering, University of Connecticut, Storrs, CT 06269, USA
2
Massachusetts Division of Ecological Restoration, 251 Causeway Street, Suite 400, Boston, MA 02114, USA
3
The Living Observatory, 139 Bartlett Rd, Plymouth, MA 02360, USA
4
U.S. Geological Survey, Hydrogeophysics Branch, 11 Sherman Place, Unit 5015, Storrs, CT 06269, USA
*
Author to whom correspondence should be addressed.
Water 2019, 11(8), 1568; https://doi.org/10.3390/w11081568
Submission received: 30 May 2019 / Revised: 11 July 2019 / Accepted: 16 July 2019 / Published: 29 July 2019
(This article belongs to the Special Issue Groundwater-Surface Water Interactions)

Abstract

:
Large-scale wetland restoration often focuses on repairing the hydrologic connections degraded by anthropogenic modifications. Of these hydrologic connections, groundwater discharge is an important target, as these surface water ecosystem control points are important for thermal stability, among other ecosystem services. However, evaluating the effectiveness of the restoration activities on establishing groundwater discharge connection is often difficult over large areas and inaccessible terrain. Unoccupied aircraft systems (UAS) are now routinely used for collecting aerial imagery and creating digital surface models (DSM). Lightweight thermal infrared (TIR) sensors provide another payload option for generation of sub-meter-resolution aerial TIR orthophotos. This technology allows for the rapid and safe survey of groundwater discharge areas. Aerial TIR water-surface data were collected in March 2019 at Tidmarsh Farms, a former commercial cranberry peatland located in coastal Massachusetts, USA (41°54′17″ N 70°34′17″ W), where stream and wetland restoration actions were completed in 2016. Here, we present a 0.4 km2 georeferenced, temperature-calibrated TIR orthophoto of the area. The image represents a mosaic of nearly 900 TIR images captured by UAS in a single morning with a total flight time of 36 min and is supported by a DSM derived from UAS-visible imagery. The survey was conducted in winter to maximize temperature contrast between relatively warm groundwater and colder ambient surface environment; lower-density groundwater rises above cool surface waters and thus can be imaged by a UAS. The resulting TIR orthomosaic shows fine detail of seepage distribution and downstream influence along the several restored channel forms, which was an objective of the ecological restoration design. The restored stream channel has increased connectivity to peatland groundwater discharge, reducing the ecosystem thermal stressors. Such aerial techniques can be used to guide ecological restoration design and assess post-restoration outcomes, especially in settings where ecosystem structure and function is governed by groundwater and surface water interaction.

Graphical Abstract

1. Introduction

At temperate latitudes, cold water anomalies in summer and warm water anomalies in winter can indicate zones of spatially preferential groundwater discharge that can be mapped with ground-based thermal infrared (TIR) at high spatial resolution compared to more traditional groundwater discharge-characterization methodology [1]. Unoccupied aircraft systems (UAS) are now routinely used for collecting visible-light aerial imagery and creating digital surface models (DSM) of surface water-related features [2,3,4]. Lightweight TIR sensors provide another remotely sensed data type that can be used to generate high-resolution (<1 m) TIR orthophotos (e.g., [5]). However, the use of TIR-equipped UAS is relatively novel, only recently finding environmental and hydrological applications [1,5,6,7,8,9,10]. Examples include environmental monitoring of natural geothermal systems [5] and distinguishing sewer and stormflow discharges from groundwater based on characteristic temperatures [9]. In engineered peatlands, UAS TIR was used to guide water isotopic sampling for a similar goal of parsing groundwater discharge endmembers [10].
Recently, there has been a movement to better incorporate ecological services and functions into stream and wetland restoration projects [11]. Hydrological process-based wetland restoration requires understanding of site-wide hydrodynamics, which often involves scaling-up measurements from discrete physical sampling points to the square-kilometer scale [12]. A fundamental challenge to point-scale measurement upscaling is that wetland subsurface materials often exhibit strongly heterogeneous and anisotropic properties and preferential flow paths; traditional groundwater discharge characterization methods are often inadequate for representing system-scale dynamics [13]. In contrast, spatially distributed thermal methods (i.e., ground-based TIR and fiber-optic sensing) have shown great promise for the comprehensive mapping of preferential seepage processes in wetlands [14,15], although work is hindered by boggy terrain and vegetation. The use of spatially extensive thermal investigations to identify groundwater seepages could potentially improve restoration design and evaluation, particularly if deployed from a UAS platform. TIR-equipped UAS provides such an opportunity for developing effective and transferable methods to produce spatially contiguous and extensive groundwater seepage maps.
UAS-based imaging offers the potential to plan and evaluate process-based wetland restoration projects efficiently, with the combined collection of visible, DSM, and TIR data. However, the approach requires sufficient contrast between the temperature of the surface environment and groundwater temperature, enough to allow the TIR sensor to resolve the groundwater as relatively warm (winter) or cool (summer). Contrast is a function of the sensitivity and resolution of the TIR sensor (see Section 3.1) but also hydrodynamics, where turbulence may rapidly homogenize waters of different temperatures, making discreet seeps harder to identify. The use of TIR-equipped UAS to map high-temperature geothermal springs has been previously demonstrated [5], but imaging lower-temperature groundwater is more challenging, as temperature contrasts are much less. Further, relatively cold groundwater discharge often plunges in slow-flowing surface waters in summer, when most field work is conducted, reducing the surface expression of groundwater discharge zones [14]. Thermal images collected during winter may provide the best opportunity to explore the potential of the method to evaluate wetland restoration design and implementation, as groundwater is relatively warm and buoyant.
The objectives of the study were to evaluate (i) the ability of TIR-equipped UAS for identifying groundwater discharges and (ii) the usefulness of TIR-equipped UAS as a tool for validating thermal refugia goals of process-based restoration.

2. Site Background

2.1. Tidmarsh Farms Site Description

The study area, Tidmarsh Farms, is a former 2.5 square-km cranberry peatland that underwent a process-based restoration in coastal Massachusetts, USA (41°54′17.6″ N 70°34′17″ W) (Figure 1). The cranberry farm, through which the restored stream channel flows, was built on a series of smaller peat-filled kettle holes located in Manomet Village in Plymouth, Massachusetts. The Beaver Dam Brook Watershed has a small spatial extent (5 km2), while the groundwater aquifer supplying this area (Plymouth–Carver–Kingston–Duxbury aquifer system) is 360 km2, indicating that the groundwater flow paths are from a large hydrologic system [16], and the natural volumetric contributions to the system are predominately controlled by groundwater. The original stream channel, sometimes known as Beaver Dam Brook, was dammed in the early 1830s, forming an early version of what became known as Beaver Dam Pond. Beginning in the 1890s, cranberry production was conducted, for which water structures were built, maintained (including a perimeter ditch and lateral ditches), and peat covered with layers of sand. These anthropogenic modifications decreased the surface wetness and modified the location of the naturally flowing surface waters, which resulted in a decrease in groundwater connection to the main stem and thus a decrease in thermal stability, an important indicator of ecosystem health. In 2008, the owners of Tidmarsh Farms decided to take the farm out of production in order to ecologically restore and protect the area. In 2017, having completed the largest freshwater wetland restoration in Massachusetts, the property was purchased by the Massachusetts Audubon Society, who in 2018 opened the Tidmarsh Wildlife Sanctuary to the public. The area is covered in low-lying cranberry vegetation as well as a variety of sedges and cattails that are mostly adjacent to the central stream bank and marginal drainage ditches.

2.2. Tidmarsh Farms Restoration Approach and Details

The Tidmarsh Farms restoration project used a ”process-based” approach [17], which considers the underlying physical drivers of wetland and stream systems. The process-based approach identifies limiting factors to wetland recovery with the goal of reducing ecological stressors and encouraging site rejuvenation. Focusing on the natural movement and storage of water on the land, the project team identified legacy agricultural impacts that affected site hydrology. The three primary issues were (i) an anthropogenic sand layer placed during farming over native peatland soils that impacted water storage in the upper layer (~1 m), (ii) dams and water control structures that interrupted the movement of water, and (iii) physical simplification, including channel straightening, ditching, and peatland platform maintenance, that reduced water retention. The ecological restoration approaches developed to mitigate these impacts included ditch plugging, peatland surface roughening, dam and water control structure removal, stream channel reconstruction (5.6 km), and large wood addition (~3000 pieces) (Figure 1b). Collectively, these actions were intended to help increase hydrologic residence time on site and improve ecological services within the restored wetlands.
During the assessment and design phase, a key question for the project team focused on where to locate the reconstructed stream channel within the broad valley. Project designers hoped to replace highly modified (wide, straight, shallow) agricultural channels with more geomorphically appropriate (narrow, sinuous) channels that also provided cool/cold-water habitat by intercepting groundwater discharge [14]. As detailed in Hare et al. [16], each identified discharge was characterized as a low-flux or high-flux zone by scaling up vertical flux measurements based on a subset of thermal flux profiles (~0.15 m/day, ~3 m/day, respectively) analyzed with 1DTempPro software [18]. These locations were compared to the underlying peat depth and subsurface peat basin structure, determined by ground penetrating radar (GPR) [16]. The results of the pre-restoration assessment demonstrated that both high- and low-flux seepage occurred along the margins of the peat surface, but high-flux preferential discharges also appeared within the peat surface interior (Figure 2a). No groundwater discharge was visible in the interior of these zones (Figure 2b), signaling an abrupt end to any groundwater input along the site edge. These interior preferential flow path discharges correlated with large increases in peat depth (high curvature) located on the upgradient side of the regional groundwater flow path as well as in areas of general peat thinning (Figure 2c); it was theorized that the high curvature of the subsurface peat induced high-seepage zones interior of where they were expected due to the abrupt change in hydraulic conductivity [16]. Therefore, the restoration design incorporated the observational theory and the site’s interpolated peat depth, along with other observational and historical site data, to place the new stream channel to maximize groundwater input.

3. Methods

3.1. Aerial Imaging Field Methods

UAS TIR imagery was collected during the early morning of 19 March 2019 using a DJI Matrice 100 quadcopter fitted with an ICI 9640 640 × 480 uncooled TIR sensor (spectral response 7–14 µm, focal length 12.5 mm, temperature range −40 to 140 °C, and thermal sensitivity <50 mK) and automated image capture (ICI UAV module®) (ICI Cameras, Beaumont, TX, USA) that records raw sensor values (without calibration applied). Imaging was performed before sunrise, when most of the peatland surface was covered in frost (air temperature was approximately −3 °C) but flowing channel features were not frozen. In-situ temperature measurements were not taken during the TIR flight (a separate temperature calibration was conducted—Section 3.3). However, the objective of the study was to identify groundwater discharge locations, so it was sufficient to measure relative temperature; absolute temperature was not required to meet this objective. Regional groundwater temperature from a groundwater well in the Plymouth–Carver–Kingston–Duxbury aquifer system was reported to be 11.7 °C on 19th March 2019 [19]. Accordingly, available data indicated that groundwater discharge-influenced surface water could be relatively distinguished from other surface waters.
The flight plan was developed using UgCS® software (UgCS, Riga, Latvia). The UgCS photogrammetry tool was utilized with the following parameters: forward and side overlap 80%, flight speed 8 m/s, and ground resolution 16 cm (equates to a flight altitude of 120 m above ground level). The flight plan was then uploaded to the quadcopter’s flight controller via a Samsung S4 smartphone running Android and the UgCS® for DJI application. Accordingly, both in-flight navigation and image capture were autonomous. Ground control points were not deployed at the time of data collection but were later identified in Google Earth for photogrammetry processing (see Section 3.2).
Visible imagery was collected from aircraft approximately one year prior (March 2018) using a Ricoh GRII camera (Ricoh Imaging Company, Ltd., Tokyo, Japan) when there was patchy snowpack over the land areas. Image stills were collected along multiple flight lines, with aircraft altitudes ranging approximately 90–120 m above ground level. Position of the aircraft was tracked by internal global positioning system (GPS). Additional detail of methodology for both TIR and visible data collection, including flight and photogrammetry processing parameters, is available from Harvey et al. [20].

3.2. Image Processing and Analysis

TIR images were processed using Agisoft Photoscan® commercial photogrammetry software, running on a computer equipped with an i7 processor and 32 GB RAM. Georeferencing was improved within Agisoft Photoscan using ground control points, which were identified during post-processing using Google Earth satellite imagery. This provided a horizontal position error of 1.6 m (root mean squared error) relative to Google Earth imagery. Agisoft Photoscan workflow parameters for TIR imagery were Highest (Align Photos) and Medium (Build Dense Cloud). The resulting TIR orthophoto was then post-processed using QGIS open-source desktop geographic information system (GIS). This involved the conversion of the raw 32-bit pixel values to calibrated temperature values (°C) (Section 3.3). All map coordinates shown in figures are WGS84 datum.

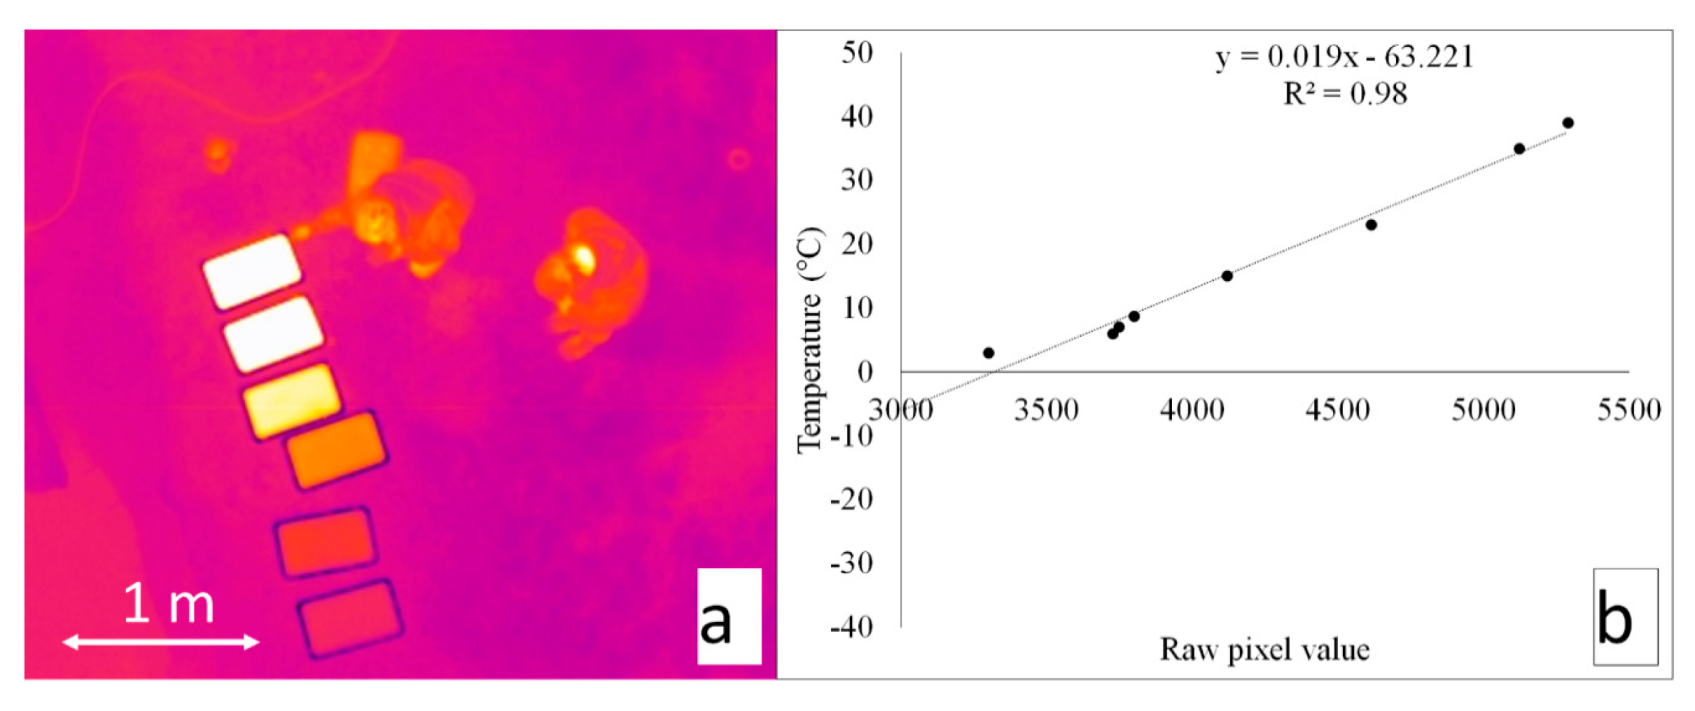
3.3. Temperature Calibration of TIR Images

Temperature calibration utilized aluminum trays filled with water of various temperatures recorded using a high-precision (0.01 °C) digital thermometer (Traceable Thermometer, Control Company, Friendswood, TX, USA). Five distributed temperature measurements were made inside each tray (each corner and center), while the UAS hovered (15 m above tray level) capturing TIR images (Figure 3a). The temperature probe was left to stabilize for 15 s before the temperature was recorded. In order to obtain the water surface skin temperature, the thermometer was placed in contact with the uppermost surface of the water.
The five temperature values were averaged to give a best estimate of the water surface temperature of each tray. Average temperature measurements were regressed against average raw pixel values from the TIR images of the trays during the flight (plus two additional sites on rivers with known temperature at time of image capture) (Figure 3b). A linear equation was fitted to the calibration scatter plot (r2 = 0.98), which allowed temperature calibration of the TIR orthophoto (standard error of the regression = 1.9 °C). Note: the function is linear, so the conversion from raw values to temperature does not affect the appearance of the orthophoto, has no effect on the ability to detect groundwater seeps, and does not impact the conclusions of the study.
Temperature calibration was undertaken one week after the TIR flights at Tidmarsh Farm (25 March 2019), with warmer ambient air temperature (5 °C versus −3 °C). However, the effect of ambient temperature appeared to be minor; a previous calibration (same TIR sensor) undertaken with different ambient temperatures (13–20 °C) gave a similar linear relation (Table 1) [5], and standard error of the regression (2.3 °C).

4. Results and Discussion

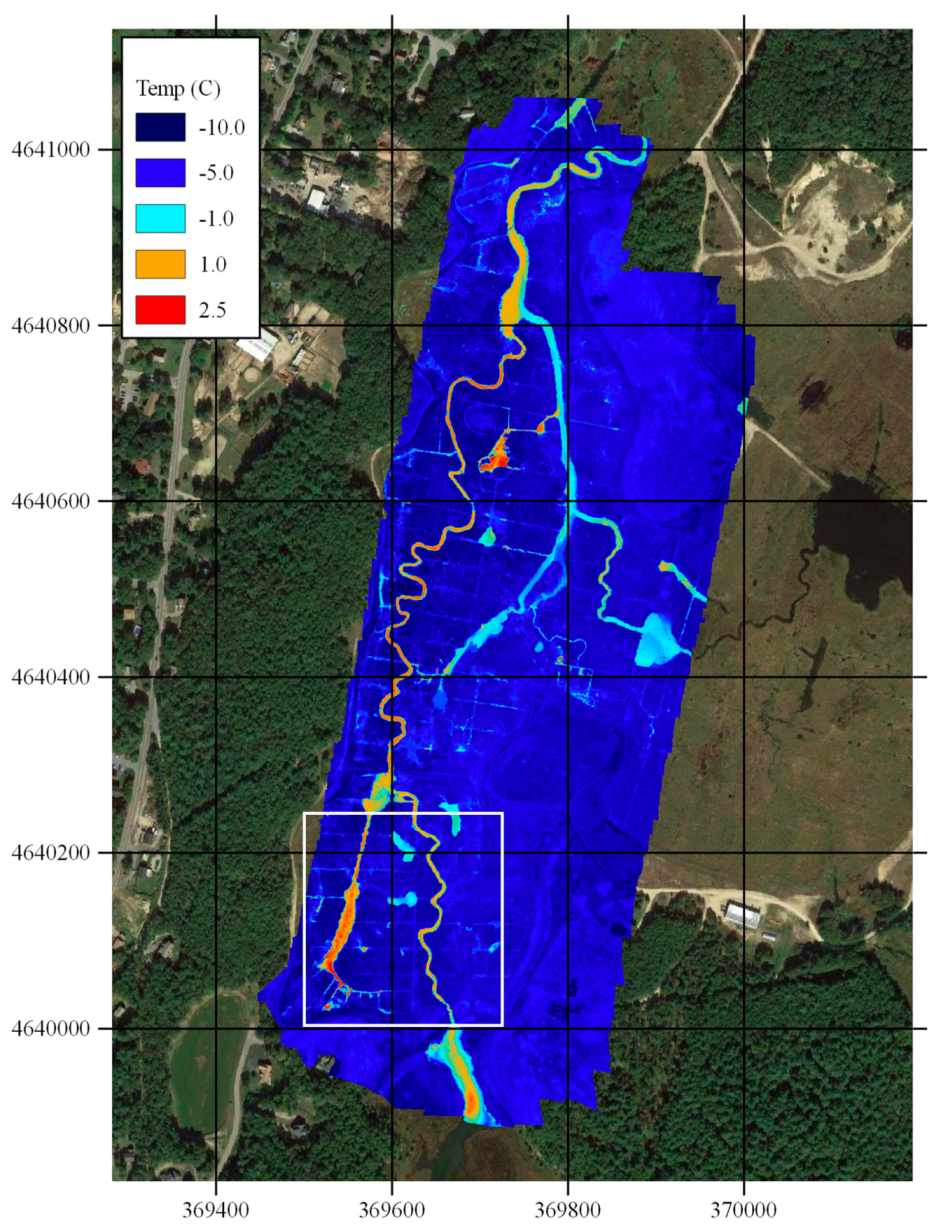
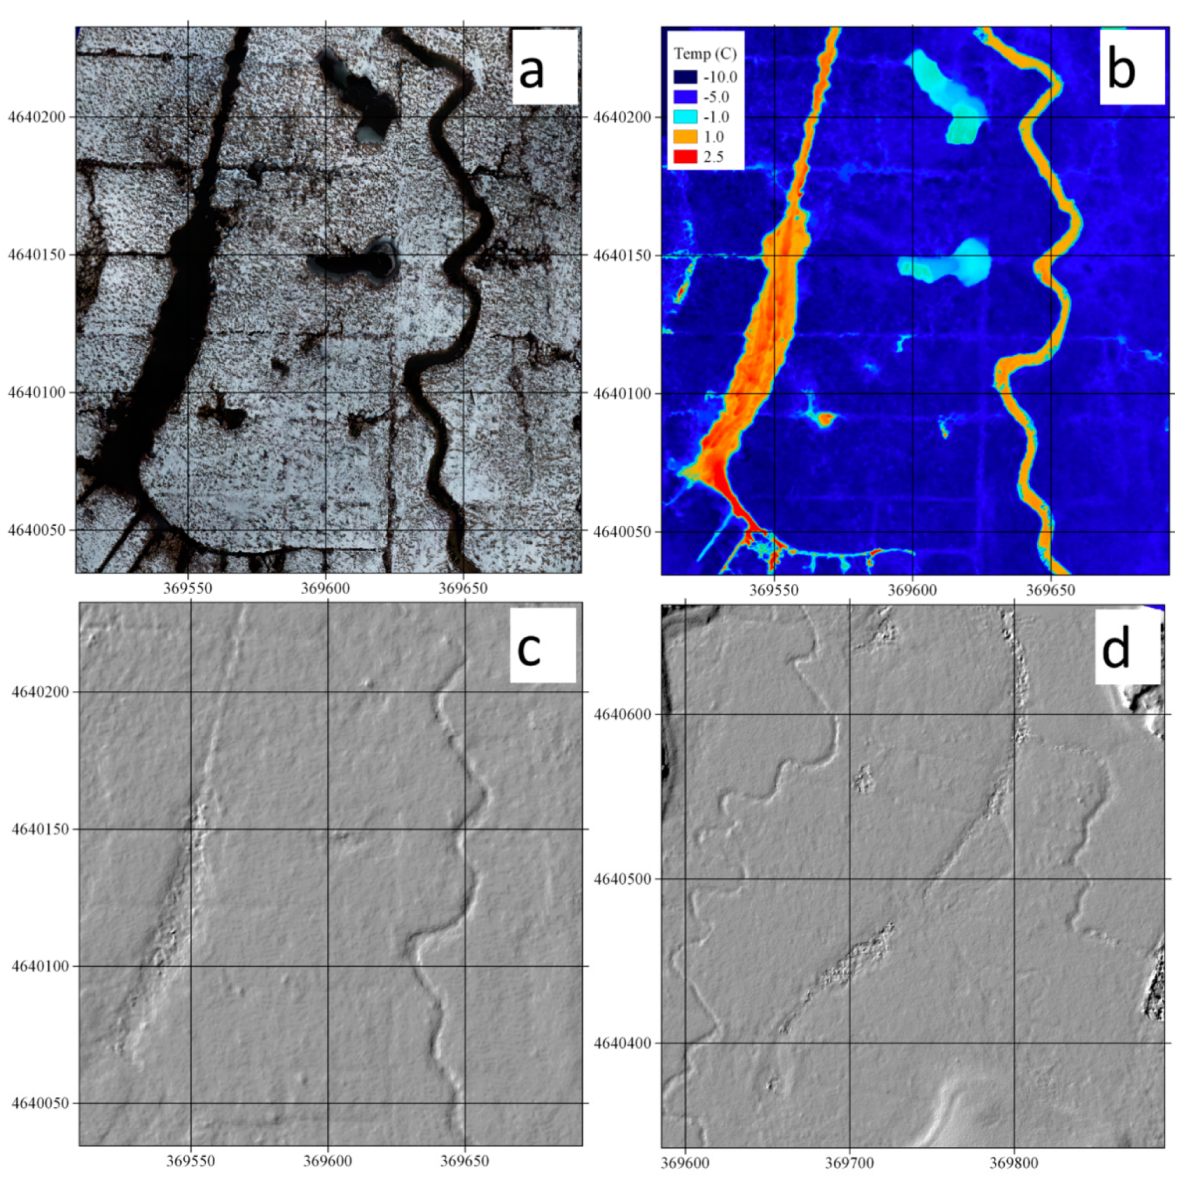
4.1. Image Quality and Spatial Coverage

Results show the TIR-equipped UAS survey method has sufficient resolution and sensitivity to resolve subtle temperature contrasts presented by groundwater seeps in cold, temperate winter conditions. The UAS method can efficiently map large areas (i.e., 0.4 km2 area captured in 36 min of flight) and is well suited for assessment of wetlands, both before and after restoration efforts.
We compared TIR, visible, and DSM imagery to evaluate the landscape forms and thermal signature of groundwater inflows (Figure 4 and Figure 5). While the visible and DSM images show stream and pond morphology (Figure 5a,c,d), they provide no indication of groundwater input. However, the TIR image makes groundwater input obvious, and substantial inflows of warmer groundwater are visible along the restored channel (i.e., compared to other locations on the wetland platform) (Figure 5b). DSMs extracted from visible imagery (Figure 5c,d) provide an efficient method for mapping the restored channel forms (compared to ground-based surveys).
Figure 6 provides close-up views of the TIR imagery, with colors adjusted to provide more contrast at the warmer end of the temperature scale (more clearly shows groundwater input). Note that (i) groundwater discharge (>1 °C) is clearly discernible from the relatively cooler surface waters (−1 °C) (Figure 6a), (ii) seepage zones are distributed along the reconstructed stream channel (Figure 6b), and (iii) discrete seeps within the stream channel are clearly identifiable (Figure 6c).
Before the restoration, ground-based TIR (Figure 2) showed that “wet areas”, long known by farmers, were due to groundwater seeps, likely due to the thin peat in this area (rather than ponding of meteoric water in topographic depressions). This led to the seeps being utilized during the restoration process and demonstrated the value of TIR to inform the restoration design [16]; thermally stable pools and streams are important for ecological refugia, which are fundamental for successful ecological restoration [21]. Based on our results, we expect UAS TIR imagery would be equally useful in the pre-restoration design phase.
One of the objectives of the restored stream channel was to strengthen the connection between groundwater and surface water, encouraging groundwater discharge. To meet this objective, the main stream channel was moved through a process of filling portions of the relic farm channel and locating a newly dug restored channel according to underlying hydrologic drivers of peatland groundwater outflows (see Section 2, Figure 7). Our post-restoration TIR imagery confirms this approach was successful; both diffuse and focused groundwater seepage is visible along the reconstructed channel (Figure 6b,c), showing greater groundwater connection than in the relic channel. The process-based design resulted in a lateral thermal profile typical of a groundwater-dominated stream, which demonstrates the success of the stream placement based on the restoration objective.

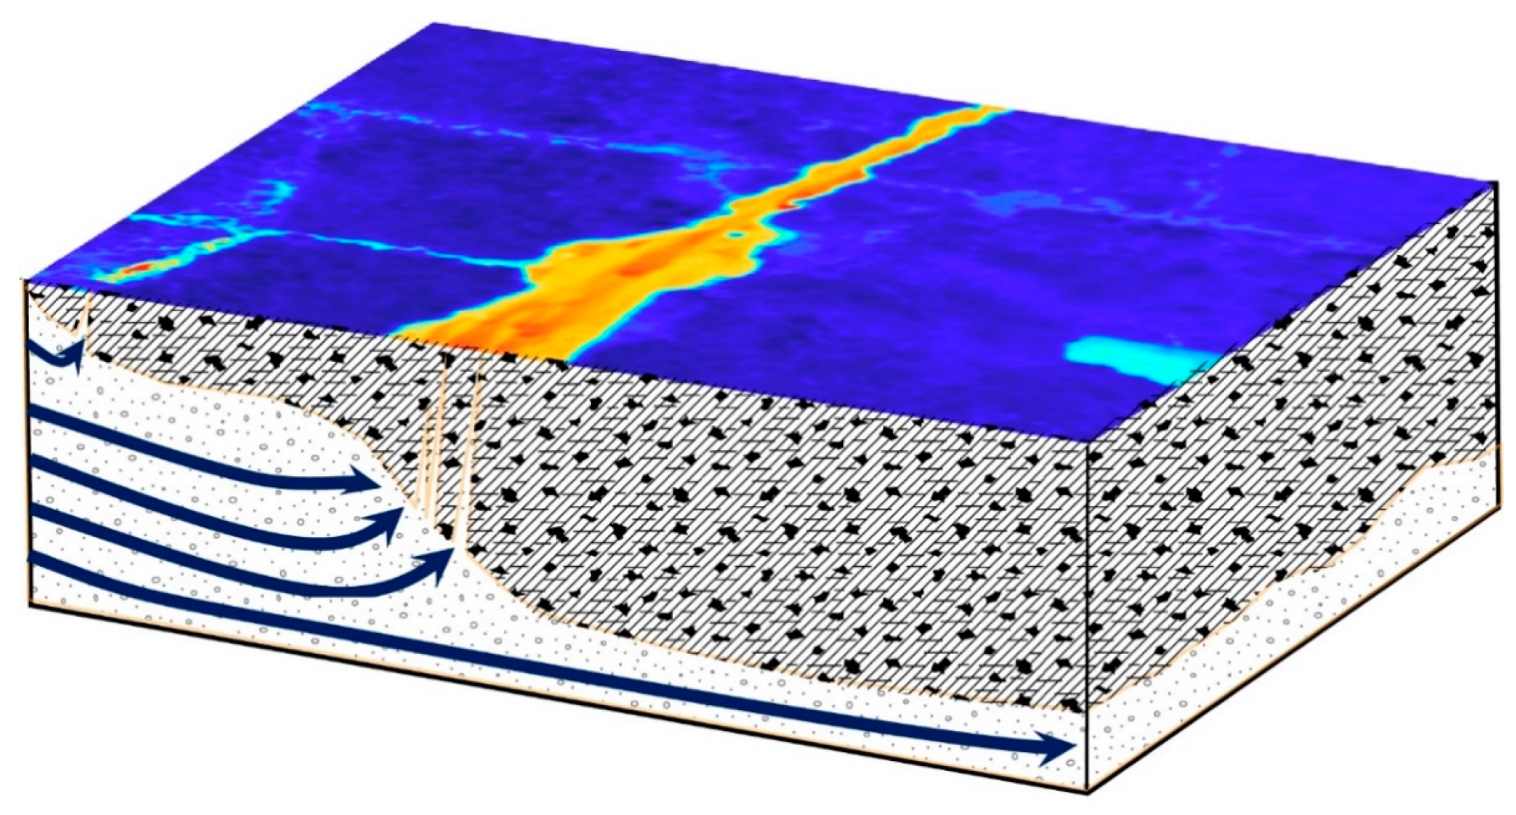
4.2. General Utility and Limitations of the Method in Wetlands

Here, we have successfully demonstrated the TIR-equipped UAS method in a continental climate during cold, winter conditions. The timing of the survey was intentional to provide maximum temperature contrast. The same method would not be as effective when applied in spring or autumn or in temperate to tropical climates; in these cases, the temperature contrast between surface environment and groundwater would be less and would be more quickly lost by surface mixing. Similarly, vegetation coverage is at a minimum in the winter, and this provided ideal conditions (TIR sensors cannot penetrate vegetation). In continental climates, surface waters may not be visible outside of winter because of foliage. In temperate/tropical climates, streams may be partly or completely covered by vegetation throughout the year.
Groundwater temperature is also a factor. The northeastern USA has a typical continental geothermal gradient [22], with shallow groundwater temperature approximating the mean annual surface temperature (~11 °C). Less commonly, groundwater may be much warmer due to magmatism and/or geologic faults that allow deeply circulating groundwater to reach the surface [5]. At Tidmarsh, it is possible that groundwater is warmed by decomposition of organic matter present in the peat soils.
Our results show how UAS-based TIR can be applied to mapping groundwater seeps in wetlands. This approach provides a viable alternative to ground-based seep identification methods (i.e., ground-based TIR or direct temperature measurements), particularly at the scale of this survey. Depending on survey size, UAS may provide a less labor-intensive solution, with spatial coverage that is unimpeded by site-access considerations. For instance, the hand-held TIR survey conducted by Hare et al. [16] took place over three days (two in the summer and one in the winter) for ~2 h each and was substantially more efficient than the weeks-long fiber-optic distributed temperature sensing survey [14,16]. The efficiency of UAS allows for repeat surveying, opening opportunities to conduct temporal thermal evaluations. More importantly, by using photogrammetry to combine images from a single flight, a complete landscape snap-shot-in-time image could be achieved, ensuring the entire area of interest is covered, including areas that would have been difficult to access by foot. Also, many wetland sites do not allow for direct foot access due to active farms, waterlogged areas, or protected areas, making UAS TIR the only viable approach for a temperature survey.
Here, we have demonstrated the UAS TIR method at Tidmarsh Farms, where groundwater flows are clearly large enough (i.e., compared to surface water flows) to be seen. In wetlands like Tidmarsh, the method will allow for more accurate and reproducible surface monitoring. In other wetland areas where groundwater inflows are relatively weak or in river environments, groundwater inflows may be greatly diluted and the thermal signature quickly lost, even in winter. In such areas, groundwater seeps may not be identified using TIR-equipped UAS, and the refugia potential would be similarly reduced. This remains to be tested in future studies.

5. Conclusions

A key question of the study was to determine if TIR-equipped UAS imaging would have sufficient resolution and sensitivity to resolve subtle temperature contrasts resulting from surface–groundwater connectivity and exchange. Our results confirm that UAS-based TIR imaging can delineate focused and diffuse seeps. The winter survey timing maximized temperature contrast between relatively warm groundwater and cooler surface waters (more equilibrated with air temperature) while minimizing vegetative cover that could obstruct the TIR sensor’s nadir overhead view. Further, we targeted a winter day when there was no snow on the peatland platform and little ice on the surface water features. The same method would not be as effective during times of snow and deep freeze or in summer when relatively cold, dense groundwater tends to plunge below slow-flowing warmer surface water.
The primary objective of the study was to determine if the engineered stream channel at Tidmarsh Farms had successfully intercepted groundwater seepage compared to relic farm channels. The TIR-equipped UAS was able to image the entirety of the restored channel area in a single morning. Results show the reconstructed stream channel is warmer along its entire length, indicating spatially contiguous groundwater connectivity. Therefore, we conclude that the groundwater discharge “process-based” restoration design was successful and likely creates thermal refugia for aquatic habitats. Further, the DSM extracted from visible imagery was useful in efficiently mapping the restored channel forms (compared to ground-based surveys).
Our results show that TIR-equipped UAS can efficiently map wetland groundwater seeps. This approach provides a viable alternative to ground-based seep identification methods, including ground-based TIR, direct temperature measurements, and indirect methods (vegetation mapping), particularly at the scale of this survey. Depending on survey size, UAS may provide a less labor-intensive solution (hours versus days) with greater spatially continuous coverage than ground-based methods, particularly when site access is limited. Temperature calibration and georeferencing of imagery provides an accurate and reproducible approach for surface monitoring of wetlands, wetland restoration planning, post-restoration evaluation, and mapping thermal refugia. More generally, TIR imagery can be used as a base map for planning geochemical, geophysical, or ecological sampling campaigns and provides the high-resolution georeferenced TIR imagery necessary to identify, locate, and sample individual seeps.

Author Contributions

Conceptualization, M.A.B. and D.K.H.; methodology, M.C.H. and M.A.B.; validation, M.C.H.; formal analysis, M.C.H. and A.B.H.; investigation, M.C.H., M.A.B., A.B.H., D.K.H., A.H. (Alex Hackman), and A.B.H.; resources, M.C.H.; data curation, M.C.H.; writing—original draft preparation, M.C.H., D.K.H., A.H. (Alex Hackman), A.B.H., and G.D.; writing—review and editing, M.A.B., A.H. (Ashley Helton), and J.W.L.J.; visualization, M.C.H., D.K.H., and A.H. (Alex Hackman); supervision, M.A.B.; project administration, M.A.B.; funding acquisition, J.W.L.J., M.A.B., and A.H. (Ashley Helton).

Funding

Funding for this method development was provided by the National Science Foundation Division of Earth Sciences award (#1824820), U.S. Department of Energy grant DE-SC0016412, and the U.S. Geological Survey (USGS) Toxic Substances Hydrology Program.

Acknowledgments

We thank the Audubon Society for site access and logistical support. Any use of trade, firm, or product names is for descriptive purposes only and does not imply endorsement by the U.S. Government.

Conflicts of Interest

The authors declare no conflict of interest. The funders had no role in the design of the study; in the collection, analyses, or interpretation of data; in the writing of the manuscript; or in the decision to publish the results.

References

  1. Briggs, M.A.; Hare, D.K. Explicit consideration of preferential groundwater discharges as surface water ecosystem control points. Hydrol. Process. 2018. [Google Scholar] [CrossRef]
  2. Briggs, M.A.; Dawson, C.B.; Holmquist-Johnson, C.L.; Williams, K.H.; Lane, J.W. Efficient hydrogeological characterization of remote stream corridors using drones. Hydrol. Process. 2018, 1–4. [Google Scholar] [CrossRef]
  3. Pai, H.; Malenda, H.F.; Briggs, M.A.; Singha, K.; González-Pinzón, R.; Gooseff, M.N.; Tyler, S.W. Potential for Small Unmanned Aircraft Systems Applications for Identifying Groundwater-Surface Water Exchange in a Meandering River Reach. Geophys. Res. Lett. 2017, 44. [Google Scholar] [CrossRef]
  4. Woodget, A.S.; Carbonneau, P.E.; Visser, F.; Maddock, I.P. Quantifying submerged fluvial topography using hyperspatial resolution UAS imagery and structure from motion photogrammetry. Earth Surf. Process. Landf. 2015, 40, 47–64. [Google Scholar] [CrossRef]
  5. Harvey, M.C.; Rowland, J.V.; Luketina, K.M. Drone with thermal infrared camera provides high resolution georeferenced imagery of the Waikite geothermal area, New Zealand. J. Volcanol. Geotherm. Res. 2016, 325, 61–69. [Google Scholar] [CrossRef]
  6. Abolt, C.; Caldwell, T.; Wolaver, B.; Pai, H. Unmanned aerial vehicle-based monitoring of groundwater inputs to surface waters using an economical thermal infrared camera. Opt. Eng. 2018, 57, 053113. [Google Scholar] [CrossRef]
  7. Dugdale, S.J. A practitioner’s guide to thermal infrared remote sensing of rivers and streams: Recent advances, precautions and considerations. Wiley Interdiscip. Rev. Water 2016, 3, 251–268. [Google Scholar] [CrossRef]
  8. Dugdale, S.J.; Kelleher, C.A.; Malcolm, I.A.; Caldwell, S.; Hannah, D.M. Assessing the potential of drone-based thermal infrared imagery for quantifying river temperature heterogeneity. Hydrol. Process. 2019, 33, 1152–1163. [Google Scholar] [CrossRef]
  9. Fitch, K.; Kelleher, C.; Caldwell, S.; Joyce, I. Airborne Thermal Infrared Videography of Stream Temperature from a Small Unmanned Aerial System. HPEYE 2018. [Google Scholar] [CrossRef]
  10. Isokangas, E.; Davids, C.; Kujala, K.; Rauhala, A.; Ronkanen, A. Combining unmanned aerial vehicle-based remote sensing and stable water isotope analysis to monitor treatment peatlands of mining areas. Ecol. Eng. 2019, 133, 137–147. [Google Scholar] [CrossRef]
  11. Hester, E.T.; Gooseff, M.N. Moving beyond the banks: Hyporheic restoration is fundamental to restoring ecological services and functions of streams. Environ. Sci. Technol. 2010, 44, 1521–1525. [Google Scholar] [CrossRef] [PubMed]
  12. Grand-Clement, E.; Anderson, K.; Smith, D.; Luscombe, D.; Gatis, N.; Ross, M.; Brazier, R.E. Evaluating ecosystem goods and services after restoration of marginal upland peatlands in South-West England. J. Appl. Ecol. 2013, 50, 324–334. [Google Scholar] [CrossRef]
  13. Hunt, R.J.; Krabbenhoft, D.P.; Anderson, M.P. Assessing hydrogeochemical heterogeneity in natural and constructed wetlands. Biogeochemistry 1997, 39, 271–293. [Google Scholar] [CrossRef]
  14. Hare, D.K.; Briggs, M.A.; Rosenberry, D.O.; Boutt, D.F.; Lane, J.W. A comparison of thermal infrared to fiber-optic distributed temperature sensing for evaluation of groundwater discharge to surface water. J. Hydrol. 2015, 530, 153–166. [Google Scholar] [CrossRef] [Green Version]
  15. Lowry, C.S.; Walker, J.F.; Hunt, R.J.; Anderson, M.P. Identifying spatial variability of groundwater discharge in a wetland stream using a distributed temperature sensor. Water Resour. Res. 2007, 43. [Google Scholar] [CrossRef]
  16. Hare, D.K.; Boutt, D.F.; Clement, W.P.; Hatch, C.E.; Davenport, G.; Hackman, A. Hydrogeological controls on spatial patterns of groundwater discharge in peatlands. Hydrol. Earth Syst. Sci. 2017, 21, 6031–6048. [Google Scholar] [CrossRef] [Green Version]
  17. Beechie, T.J.; Sear, D.A.; Olden, J.D.; Pess, G.R.; Buffington, J.M.; Moir, H.; Roni, P.; Pollock, M.M. Process-based principles for restoring river ecosystems. BioScience 2010, 60, 209–222. [Google Scholar] [CrossRef]
  18. Koch, F.W.; Voytek, E.B.; Day-Lewis, F.D.; Healy, R.; Briggs, M.A.; Werkema, D.; Lane, J.W., Jr. 1DTempPro: A program for analysis of vertical one-dimensional (1D) temperature profiles v2.0: U.S. Geol. Surv. Softw. Release 2015. [Google Scholar] [CrossRef]
  19. U.S. Geological Survey. USGS 420316070433501 MA-D4W 79R Duxbury, MA, in USGS Water Data for the Nation: U.S. Geological Survey National Water Information System Database. 2019. Available online: https://waterdata.usgs.gov/nwis/uv?site_no=420316070433501 (accessed on 1 June 2019).
  20. Harvey, M.; Briggs, M.A.; Dawson, C.B.; White, E.A.; Haynes, A.; Fosberg, D.; Moore, E. Thermal infrared and photogrammetric data collected by small unoccupied aircraft system for the evaluation of wetland restoration design at Tidmarsh Wildlife Sanctuary, Plymouth, MA. USA. Geol. Surv. Public Data Release 2019. [Google Scholar] [CrossRef]
  21. Lake, P.S.; Bond, N.; Reich, P. Linking ecological theory with stream restoration. Freshw. Biol. 2007, 52, 597–615. [Google Scholar] [CrossRef]
  22. Blackwell, D.D.; Richards, M.C.; Frone, Z.S.; Batir, J.F.; Williams, M.A.; Ruzo, A.A.; Dingwall, R.K. SMU Geothermal Laboratory Heat Flow Map of the Conterminous United States. 2011. Available online: http://www.smu.edu/geothermal (accessed on 21 August 2015).
Figure 1. (a) Site location in Massachusetts (Google Earth), (b) feature layout, and (c) overview of survey area (Google Earth)—white box shows area covered by panel (b). Key for panel (b): Red lines are new channels to be built, blue lines are existing channels to remain, red polygons are no-disturbance zones, green polygons are dike removals, and orange polygons are fill.
Water 11 01568 g001
Figure 2. Hand-held thermal infrared (TIR) images collected before the restoration [16], along the relic cranberry peatland drainage ditches. Images show (a) natural groundwater discharge, (b) no discharge, (c) clustered centimeter-scale macropore discharge features, and (d) discrete discharge features observed after the restoration (March 2018) in similar locations to the pre-restoration period, indicating persistent subsurface hydrogeologic controls.
Water 11 01568 g002
Figure 3. Temperature calibration of raw pixel values in TIR images: (a) TIR image capture by UAS hovering 15 m above trays and (b) linear calibration equation derived from average of pixel values in each tray and corresponding temperature measurements.
Water 11 01568 g003
Figure 4. Calibrated TIR orthophoto of the Tidmarsh study area overlaid on Google Earth imagery. Note: white square detail is shown in Figure 5a–c. Map datum WGS84.
Water 11 01568 g004
Figure 5. Comparison of winter UAS imagery showing (a) visible light and (b) TIR. (c,d) Digital surface models show complex channel forms that would be difficult to survey with ground-based methods (e.g., total station). Note: Only TIR shows both stream morphology and temperature. Panels (ac) correspond to white square in Figure 4. Panel (d) shows area of complex channel form restoration in the central survey area.
Water 11 01568 g005
Figure 6. TIR imagery showing (a) confluence of cool surface waters and warmer groundwater, (b) diffuse seepage zones along reconstructed stream channel (white boxes), and (c) warm groundwater seeping into the stream channel. Note: water flows from south to north.
Water 11 01568 g006
Figure 7. TIR imagery superimposed on conceptual model of subsurface. The restored channel was geolocated based in part on the conceptual model presented by Hare et al. [16], which predicted preferential groundwater discharge upward through the peatland platform based on the underlying topography of the sand–peat aquifer interface. Note: figure not to scale.
Water 11 01568 g007
Table 1. Comparison of calibrated temperatures from this study versus Harvey et al. [5].
Pixel ValueCalibrated Temp. (°C) (This Study)Calibrated Temp. (°C) (Harvey et al., [5])
2800−11.5−10.0
3000−7.3−6.2
3200−3.1−2.4
34001.11.4
36005.25.2

