Long-Term Perspective Changes in Crop Irrigation Requirement Caused by Climate and Agriculture Land Use Changes in Rechna Doab, Pakistan


Abstract
1. Introduction
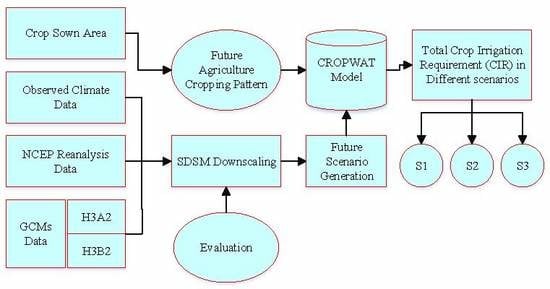
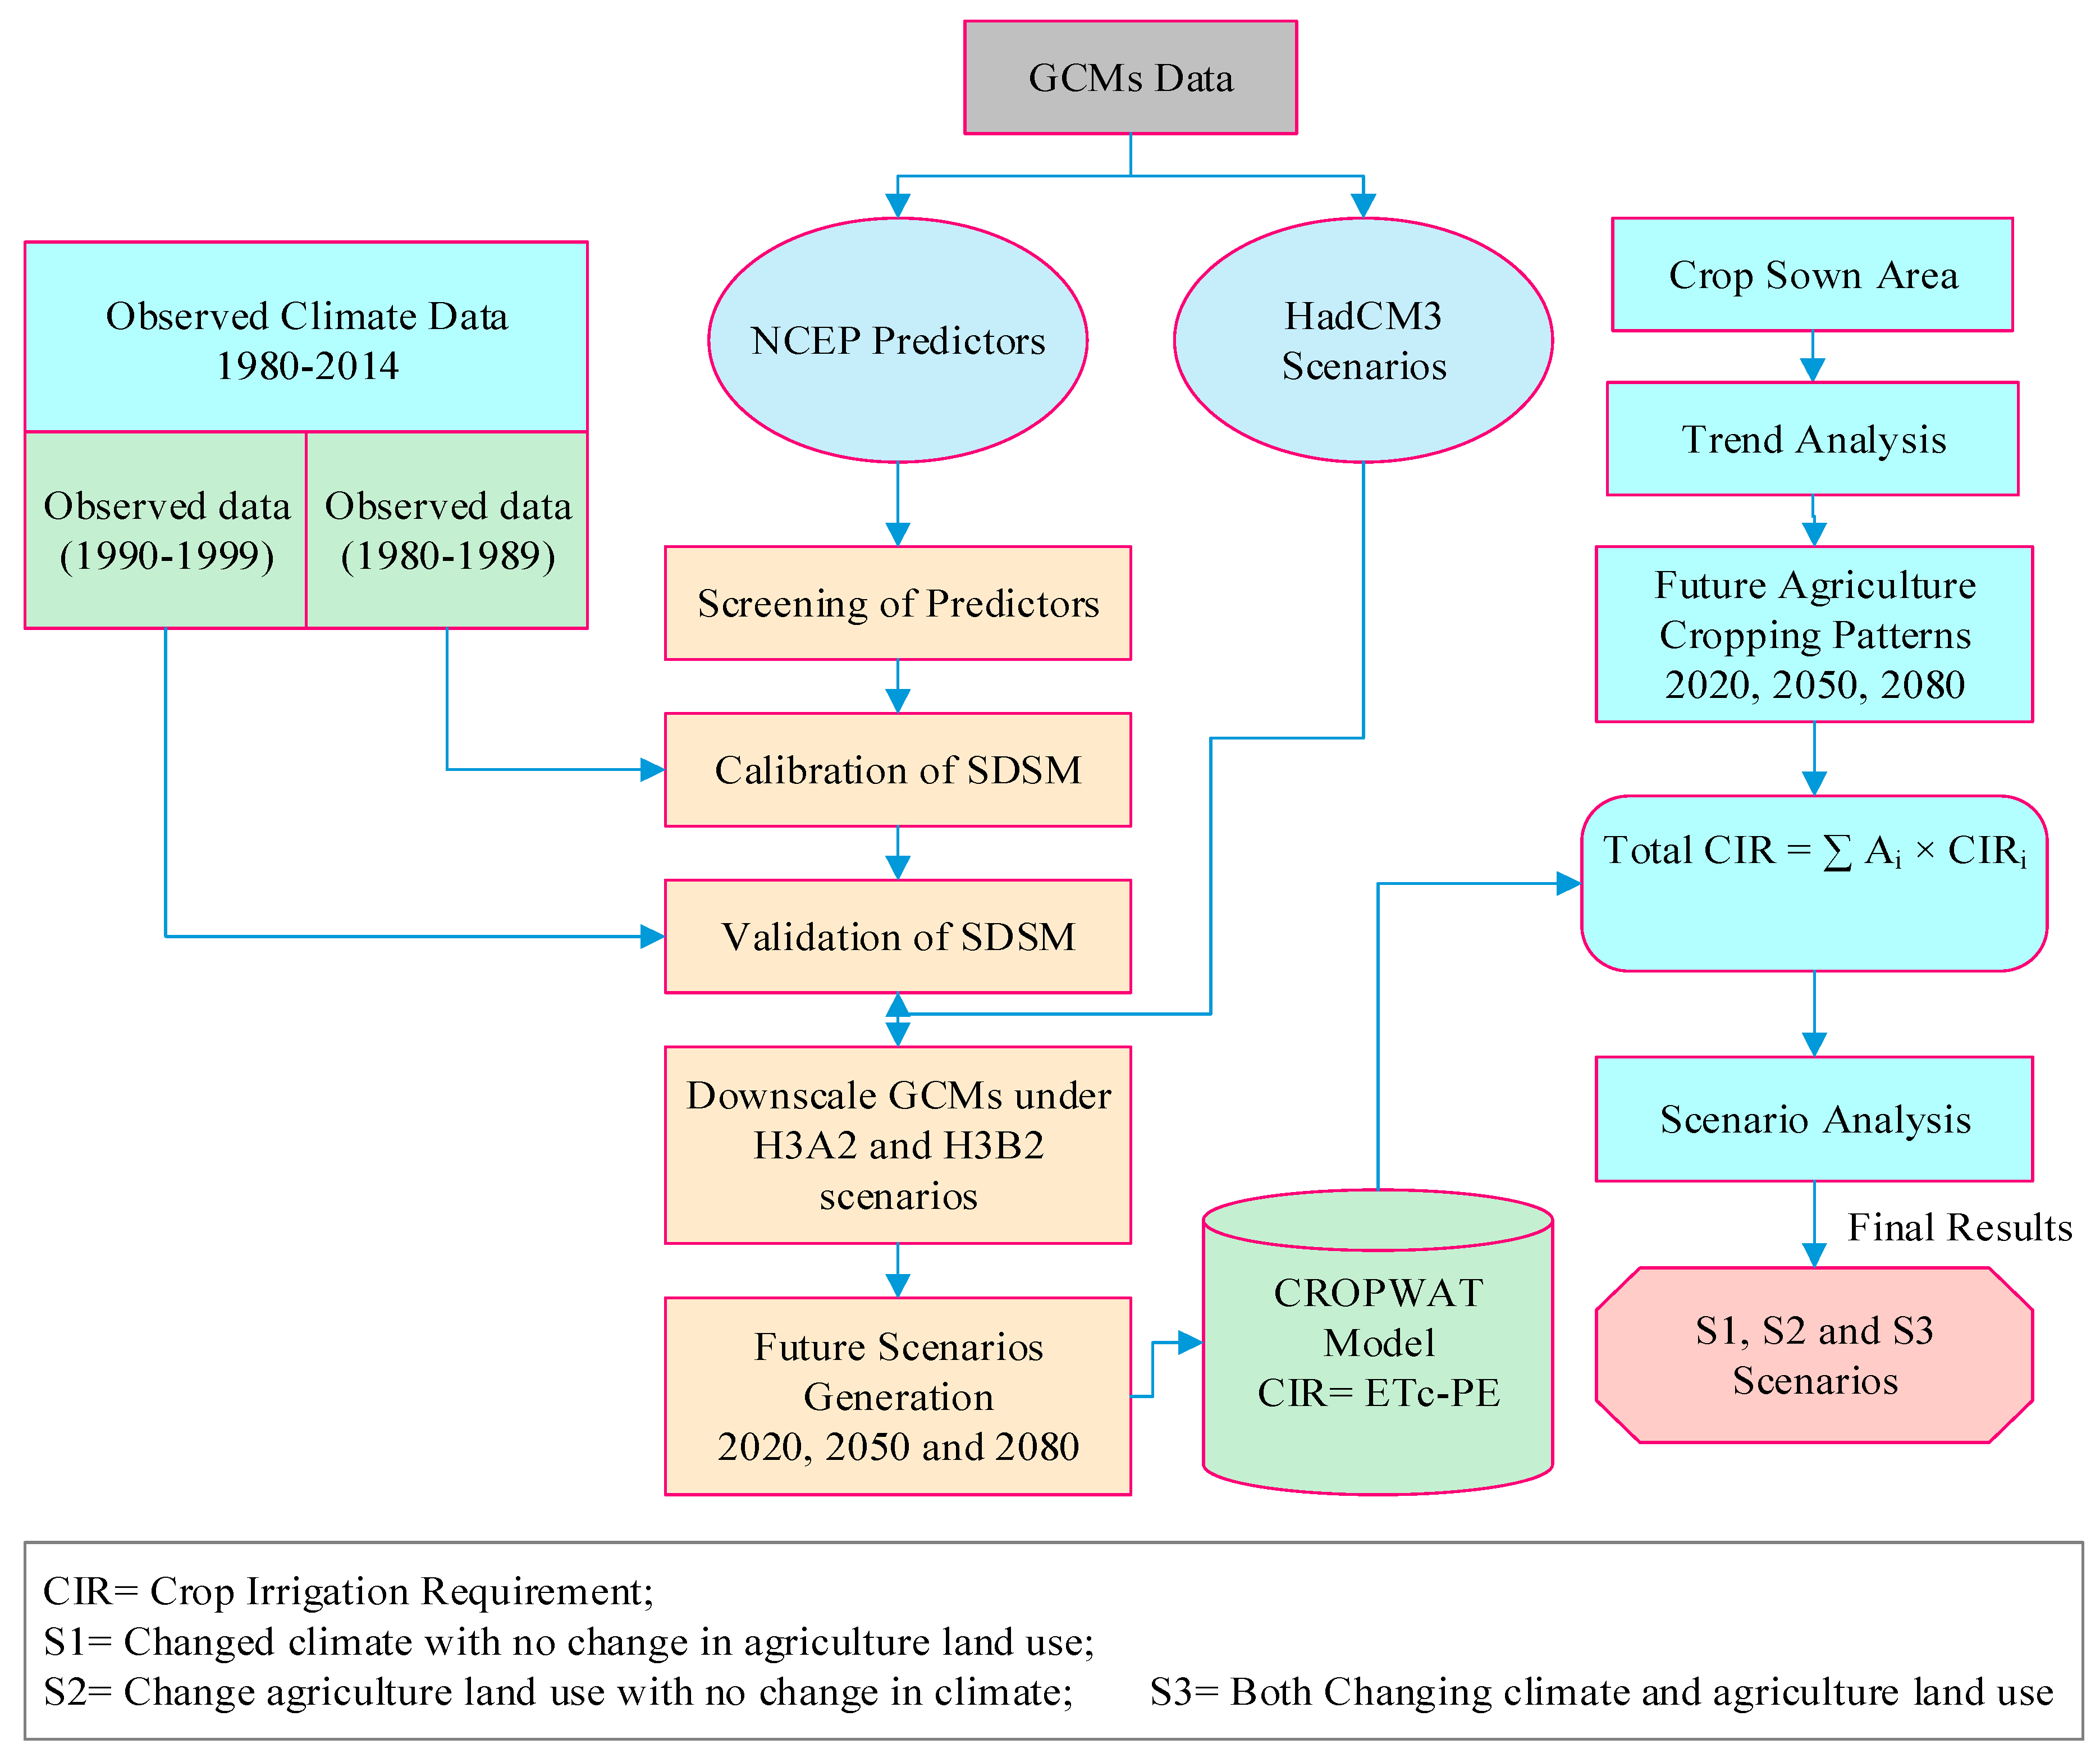
2. Material and Methods
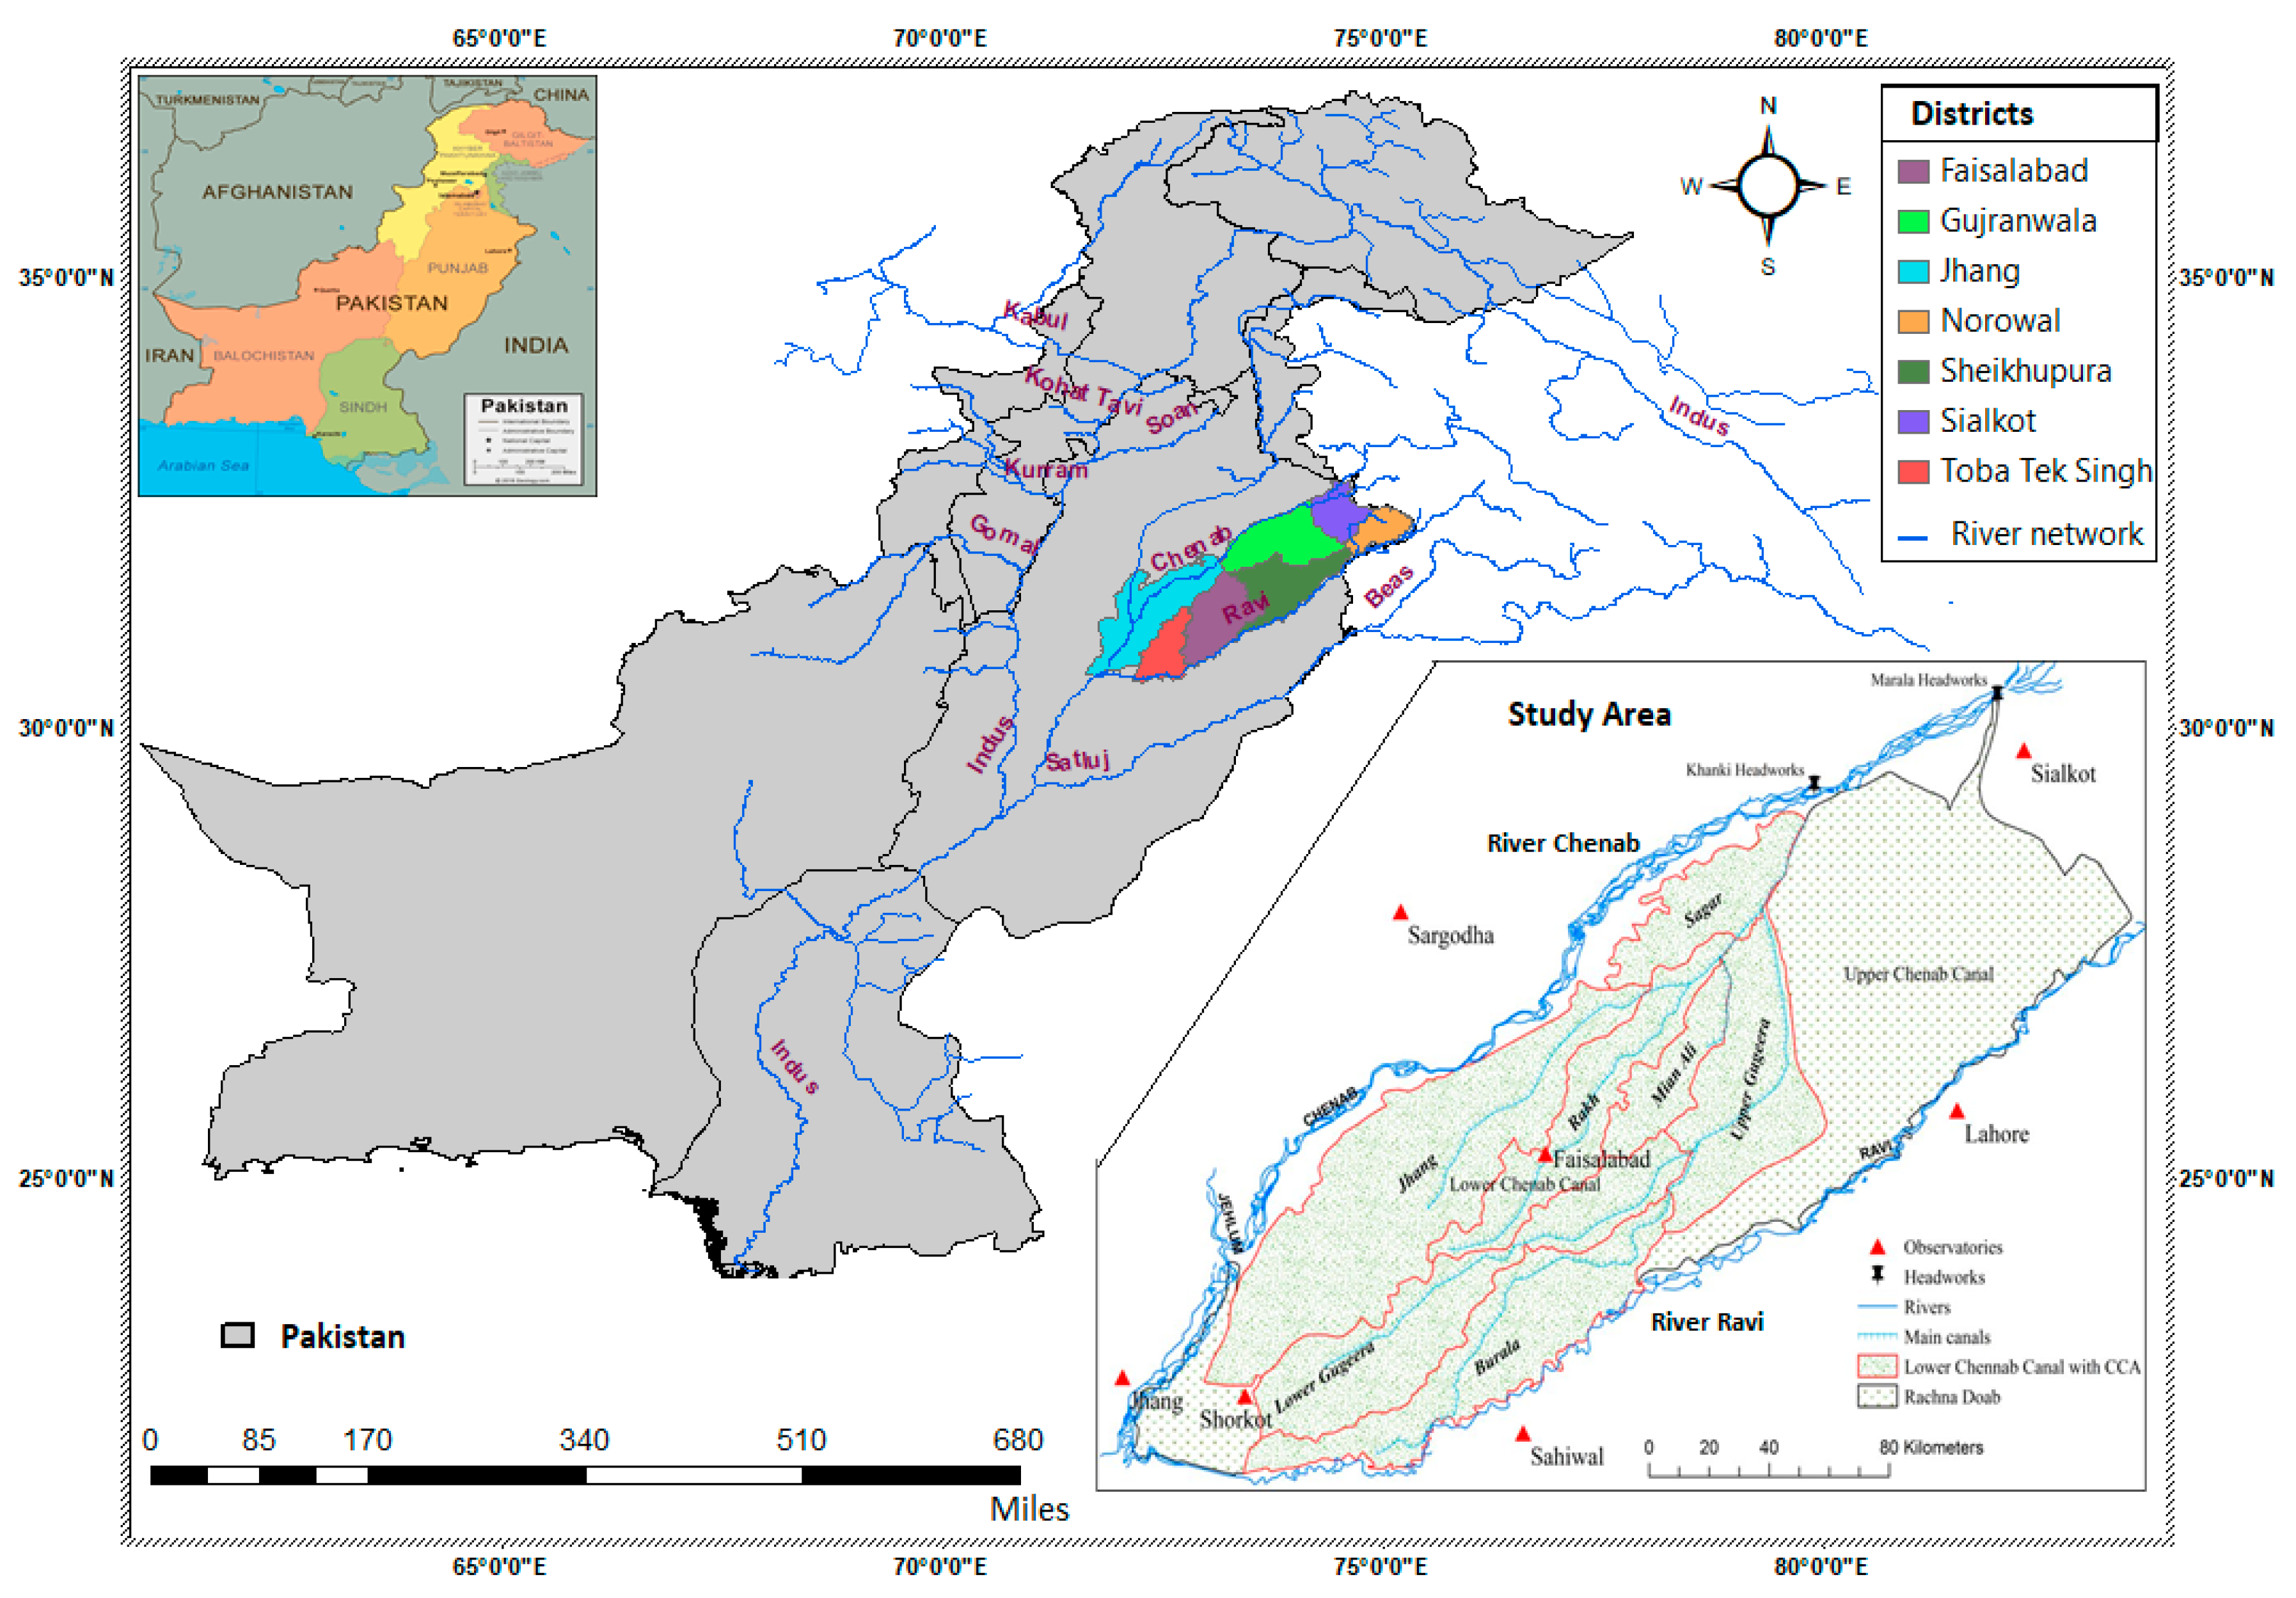
2.1. Study Area
2.2. Data Used in Study
2.2.1. Meteorological Data
2.2.2. GCM Data
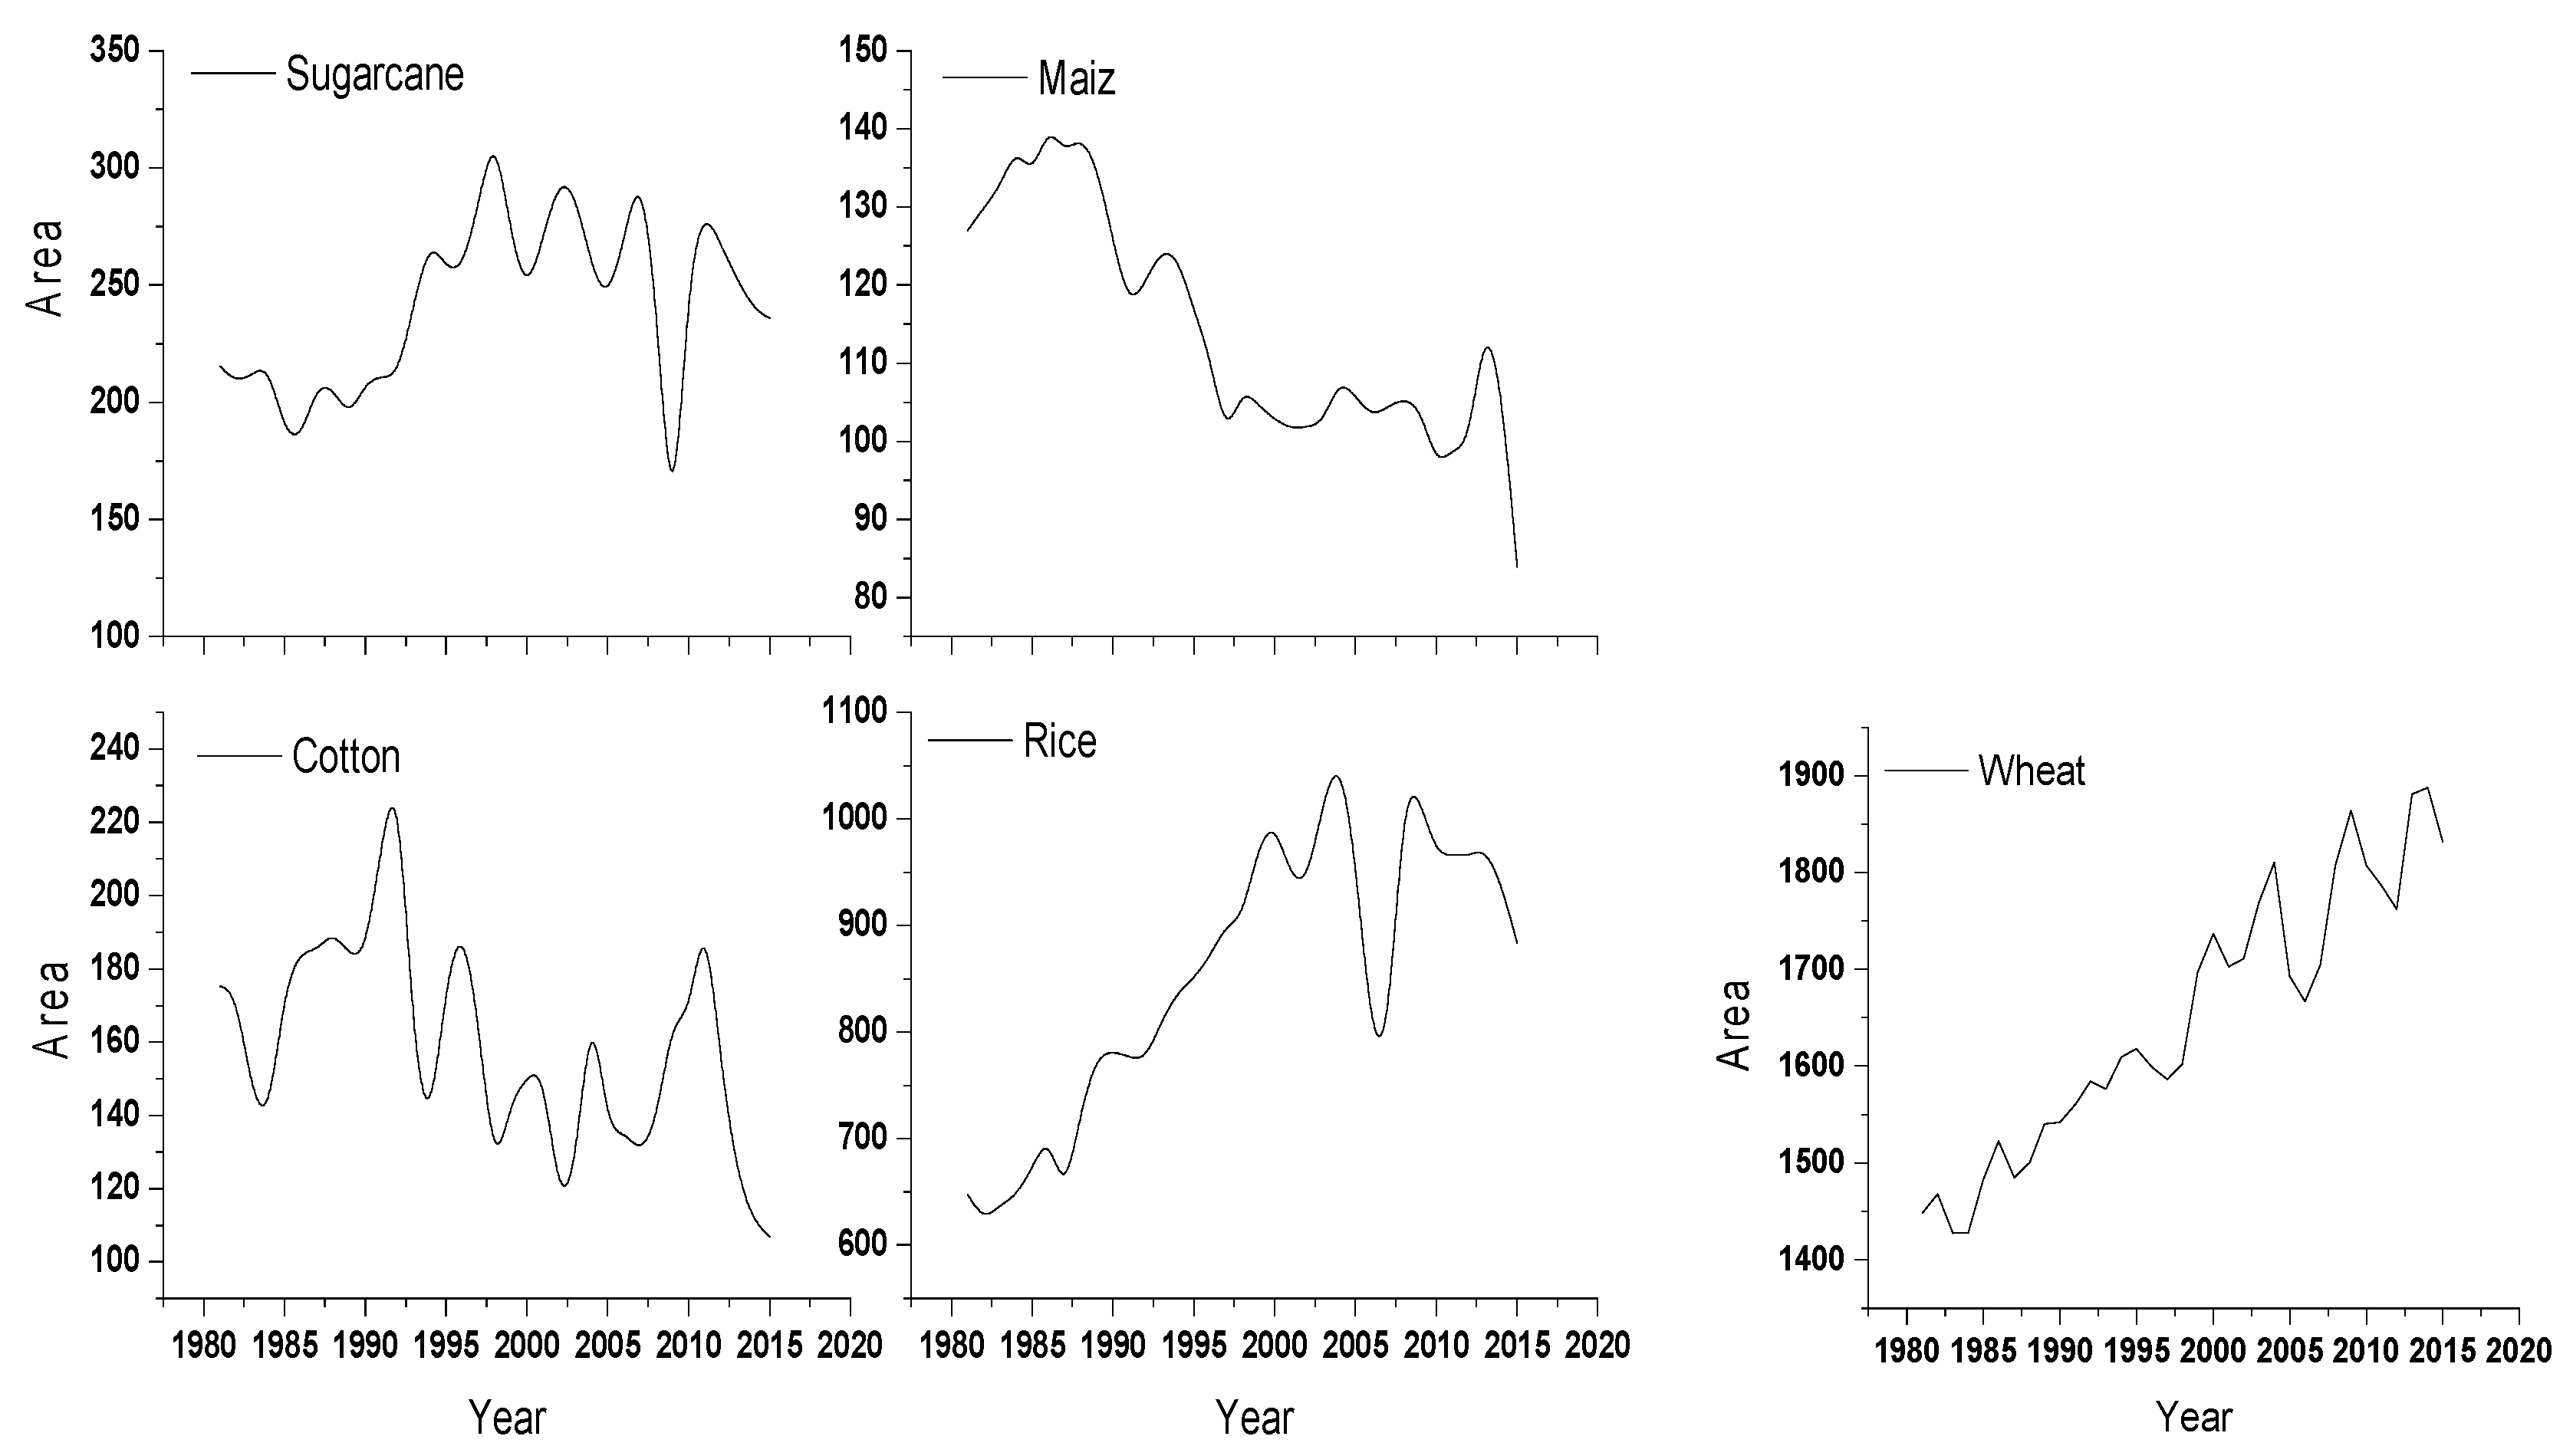
2.2.3. Crop Information Data
2.3. Downscaling of GCM Data Using SDSM Model
- (1)
- Screening of NCEP Predictors: Screening of NCEP predictor variables is a crucial step for all statistical downscaling techniques because these parameters greatly influences the output of the model [71,72]. In this study, during screening process correlation between 26 NCEP predictors (Table 1) and local scale predictands (observed precipitation, temperatures, wind speed, and relative humidity) was developed in SDSM model, and then the predictors of highest correlation coefficient among 26 predictors were finally selected. (Table 3). Predictors with low R2 and highest P value (greater than α (0.05)) were neglected to minimize uncertainty in future prediction. The highest value of R2 as 0.7 is satisfactory in calibration and validation of the SDSM model [73].
- (2)
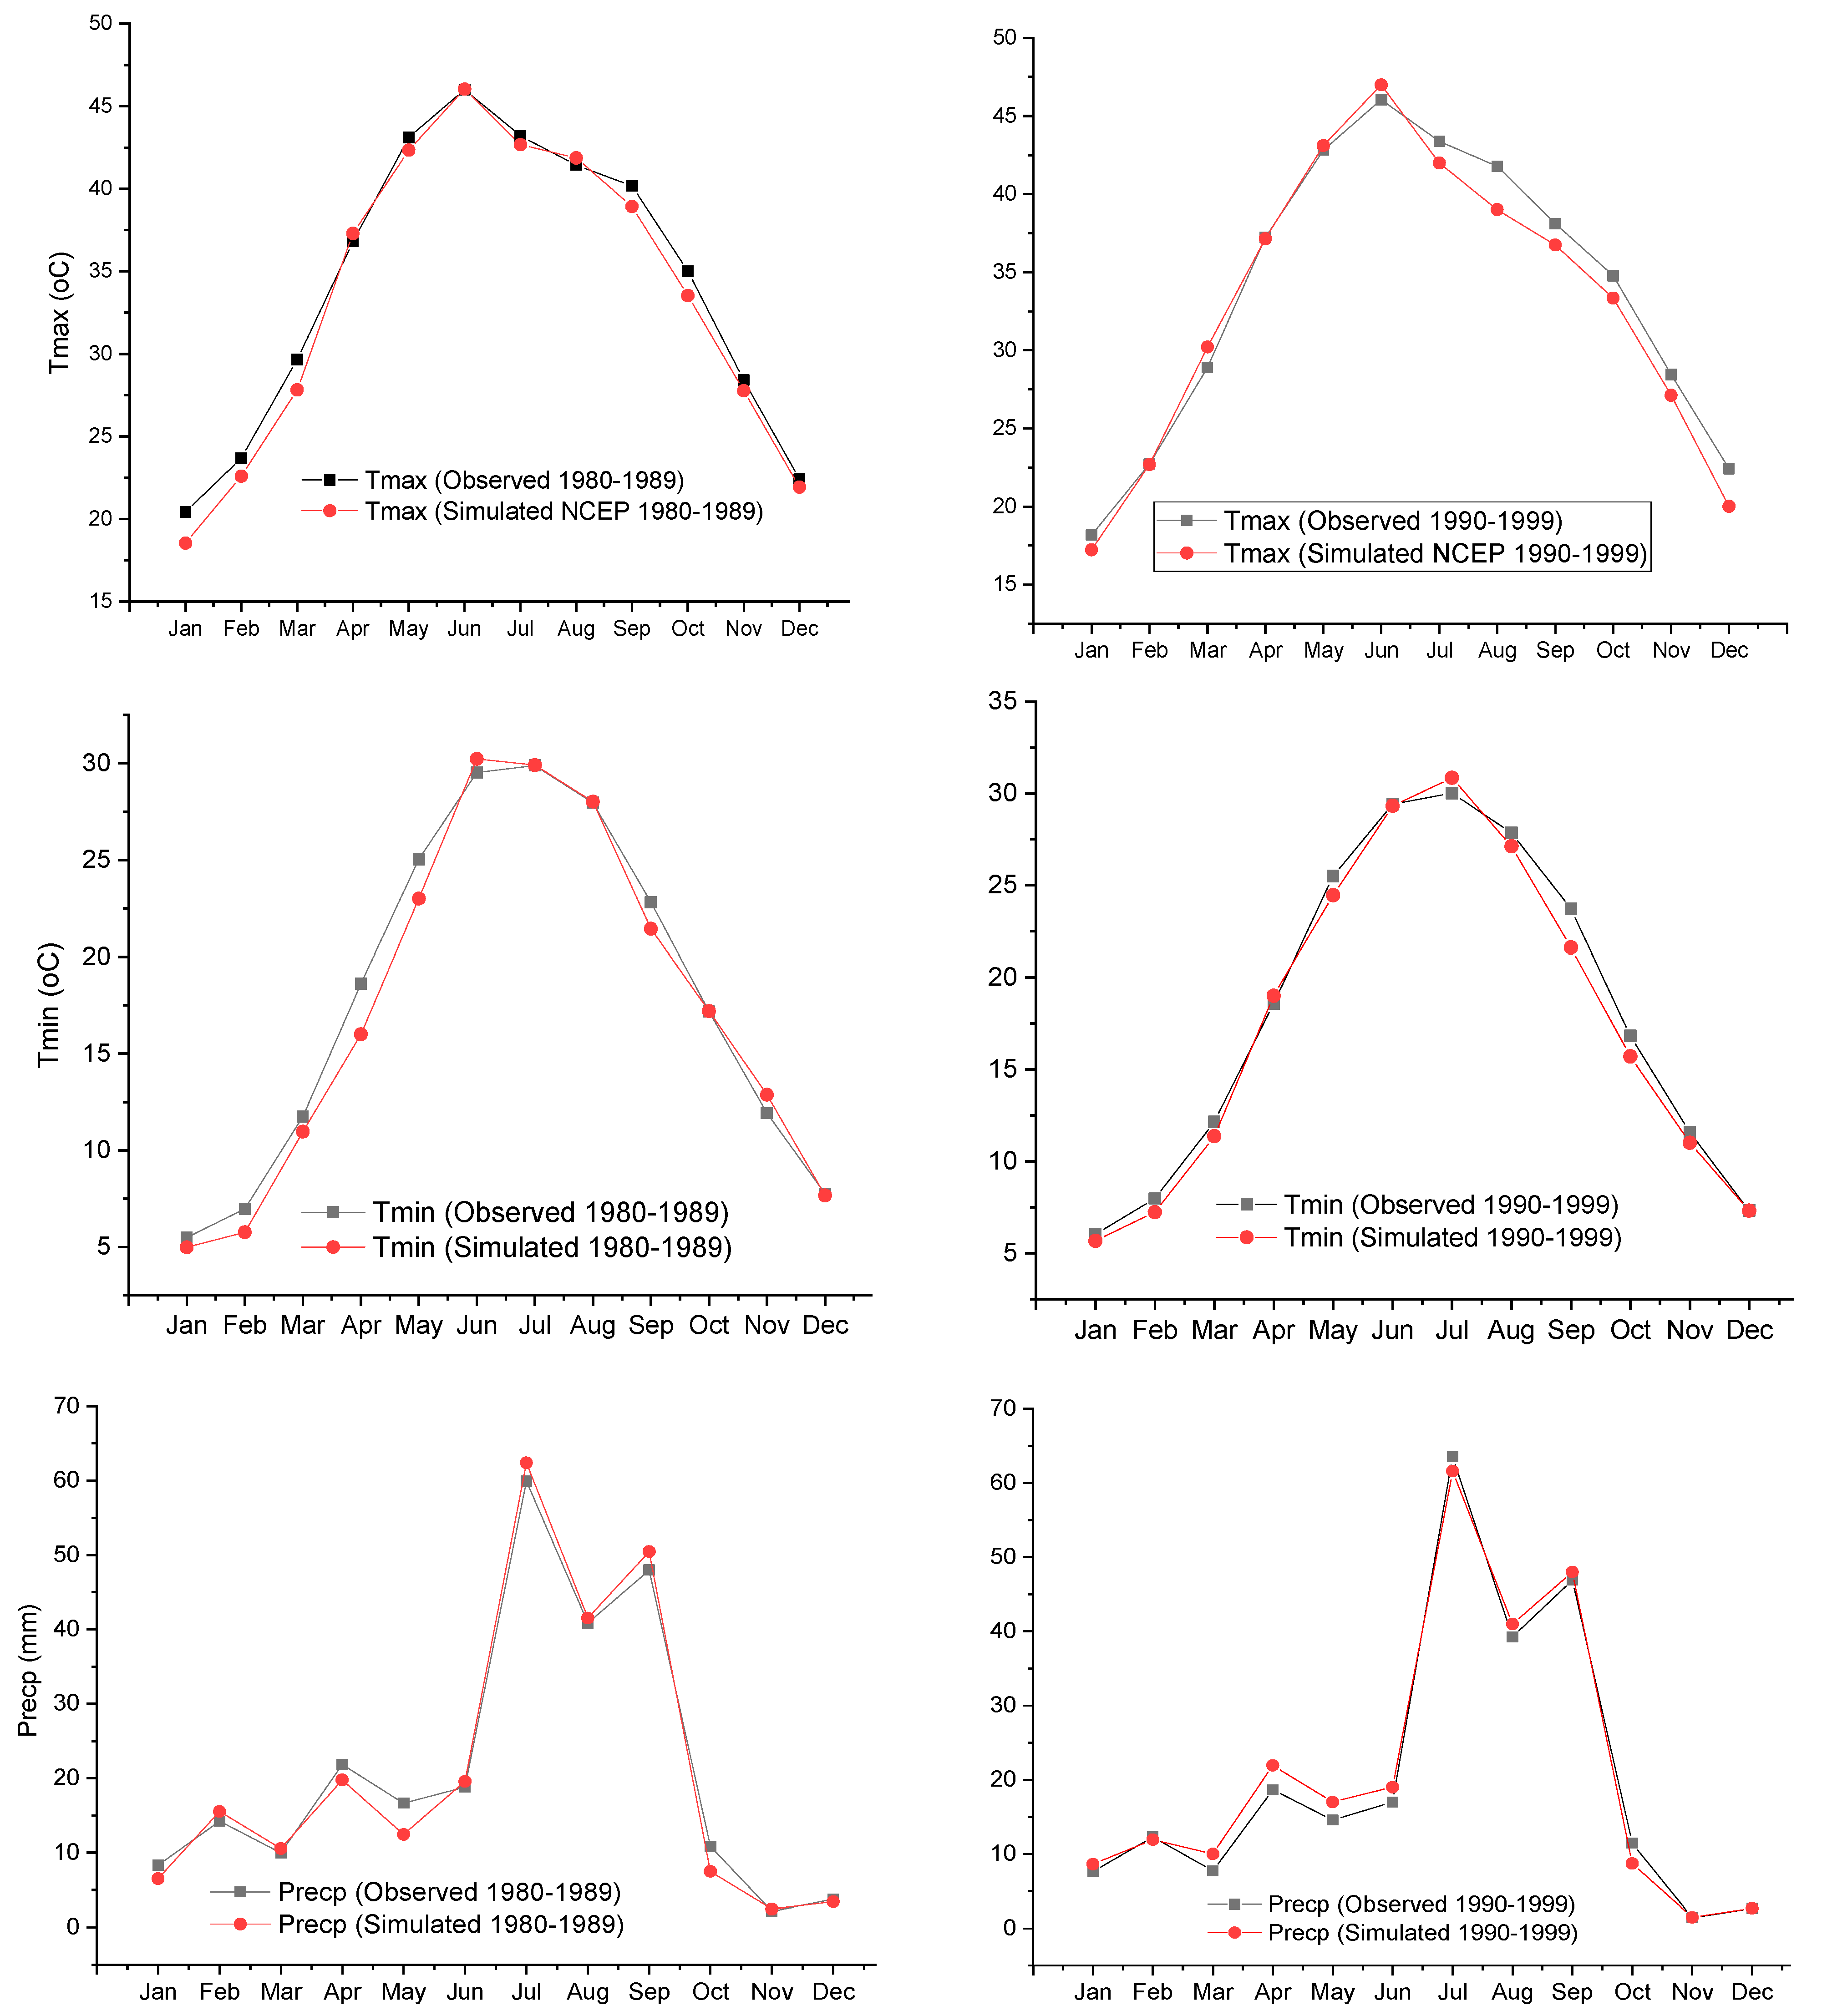
- Calibration and Validation of model: NCEP predictor variables having highest value of R2 were used in the weather generation process. Observed data of climatic parameters was divided into two halves, the first part (1980–1989) was used to calibrate the SDSM model and the second part (1990–1999) was used to validate the model. During the calibration period (1980–1989) and validation period (1990–1999), simulated results of SDSM were compared with the observed data of Tmax, Tmin, humidity, wind speed, and precipitation.
- (3)
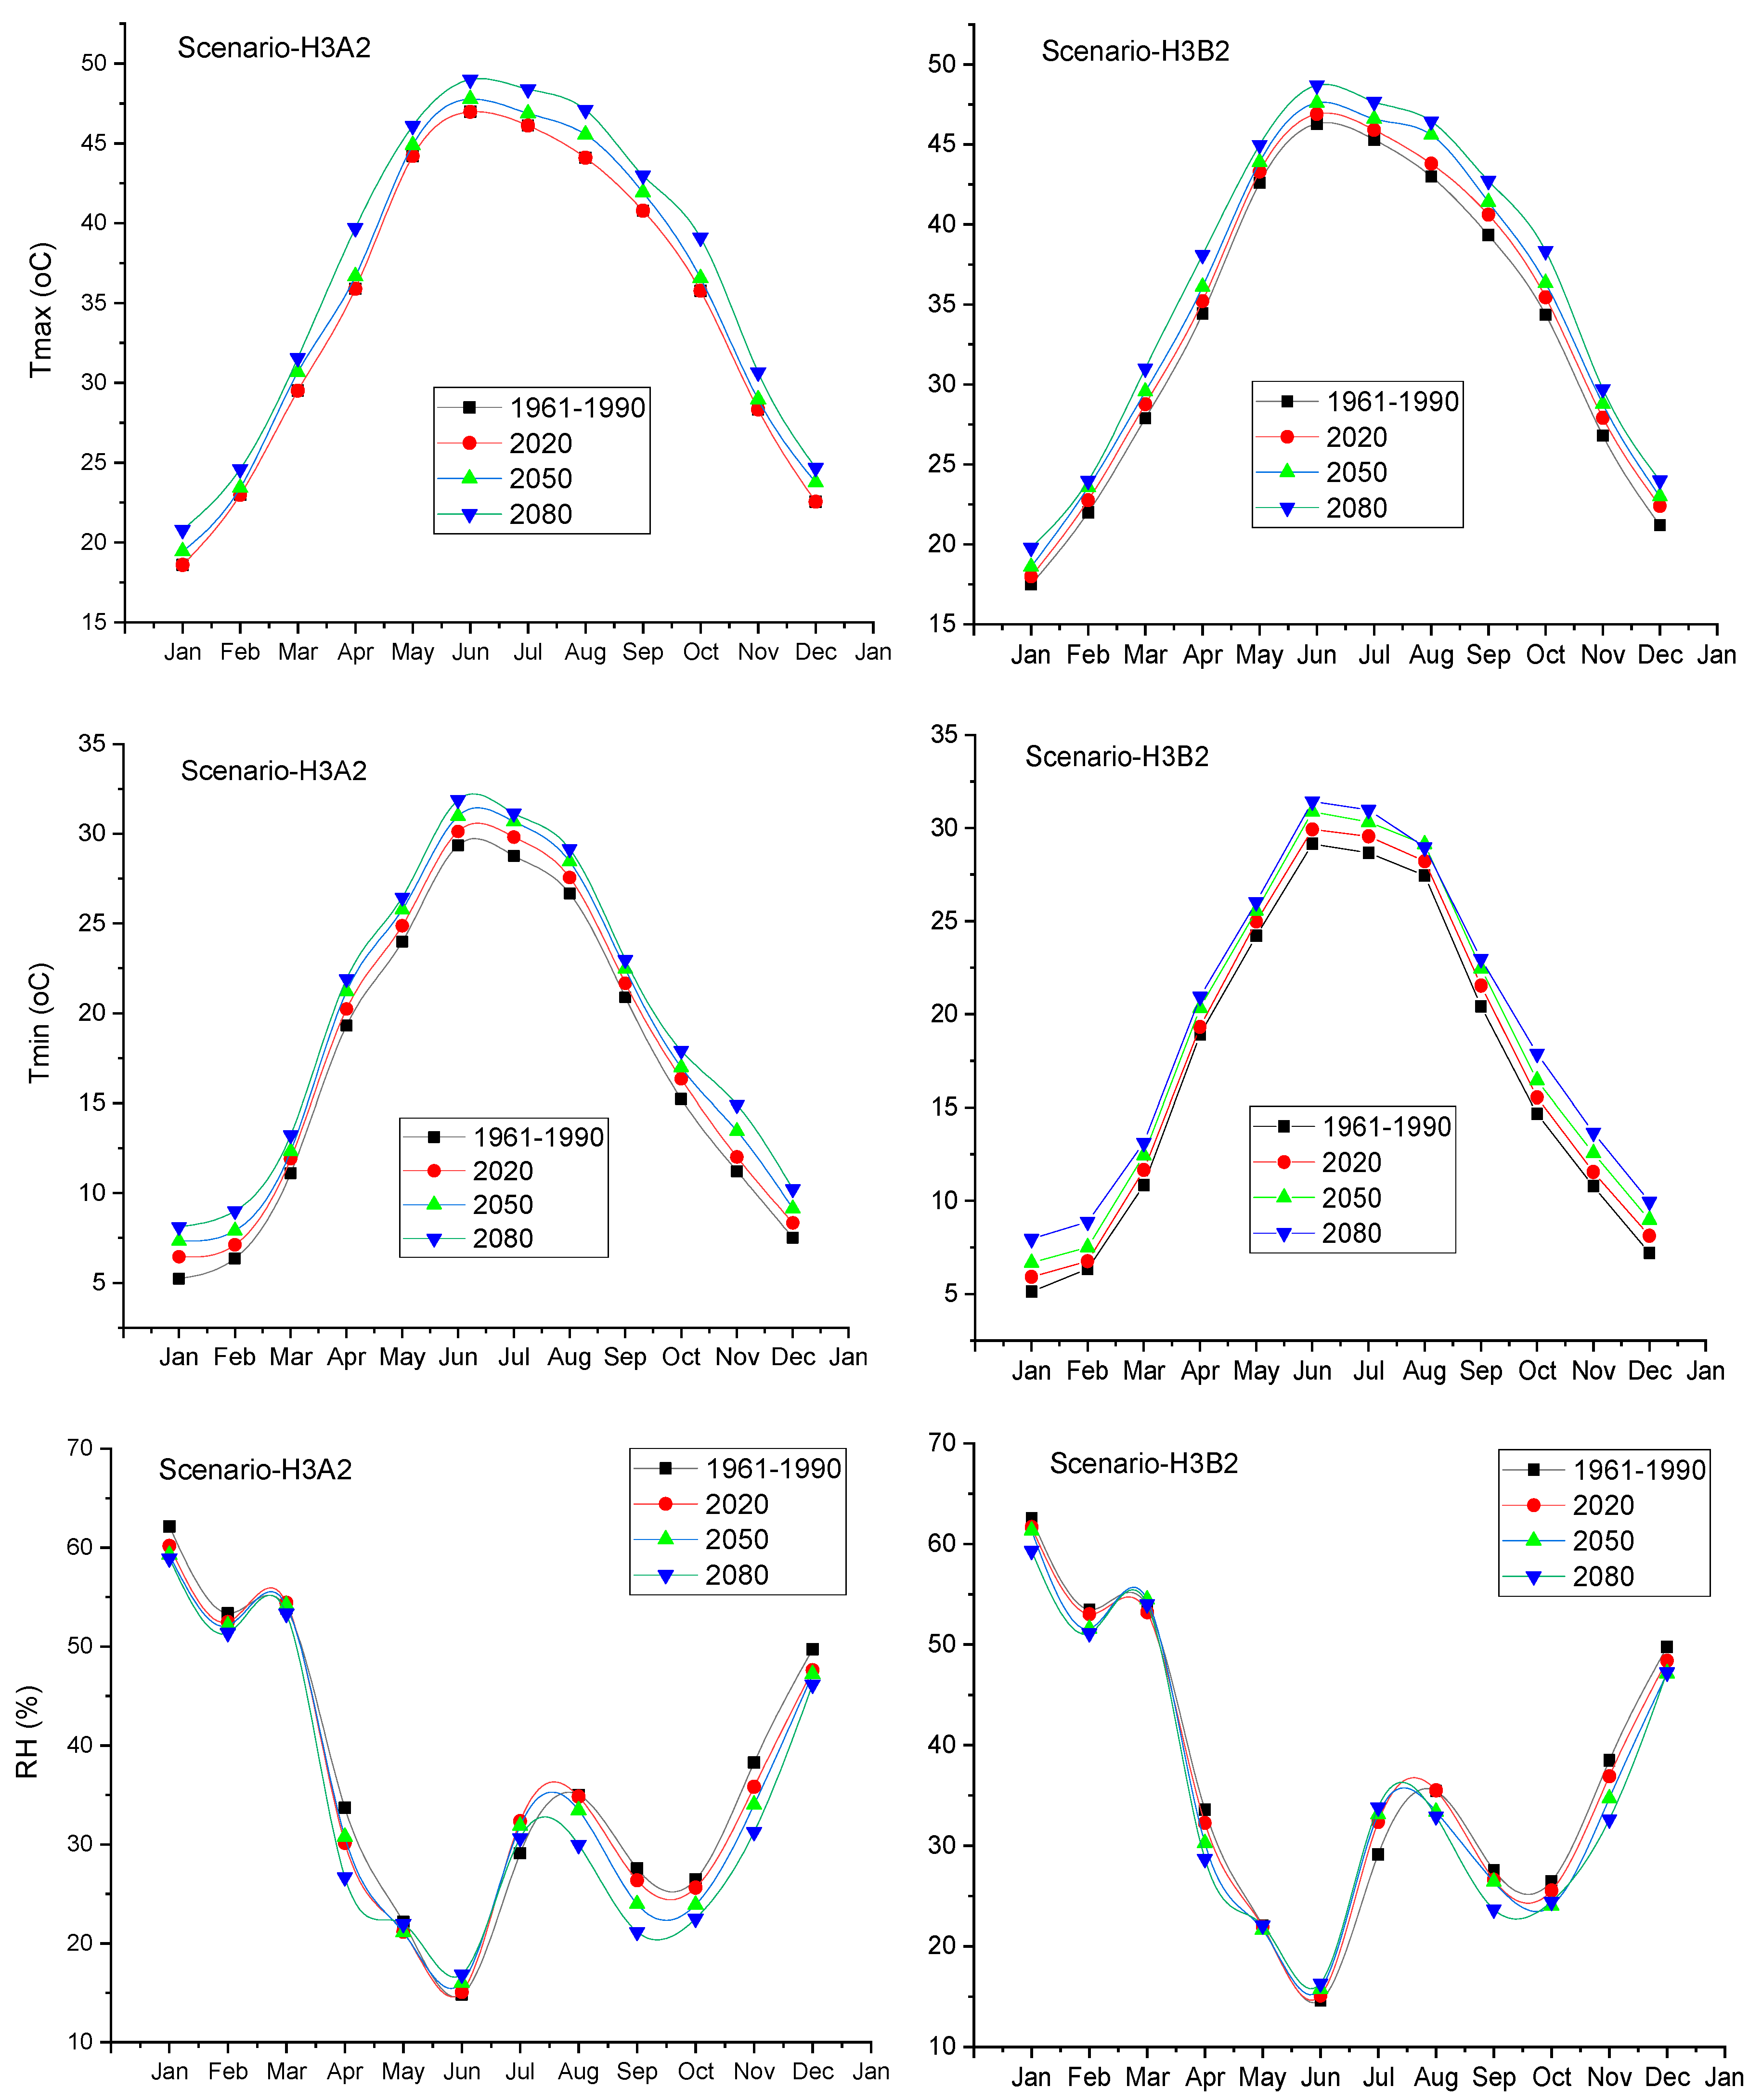
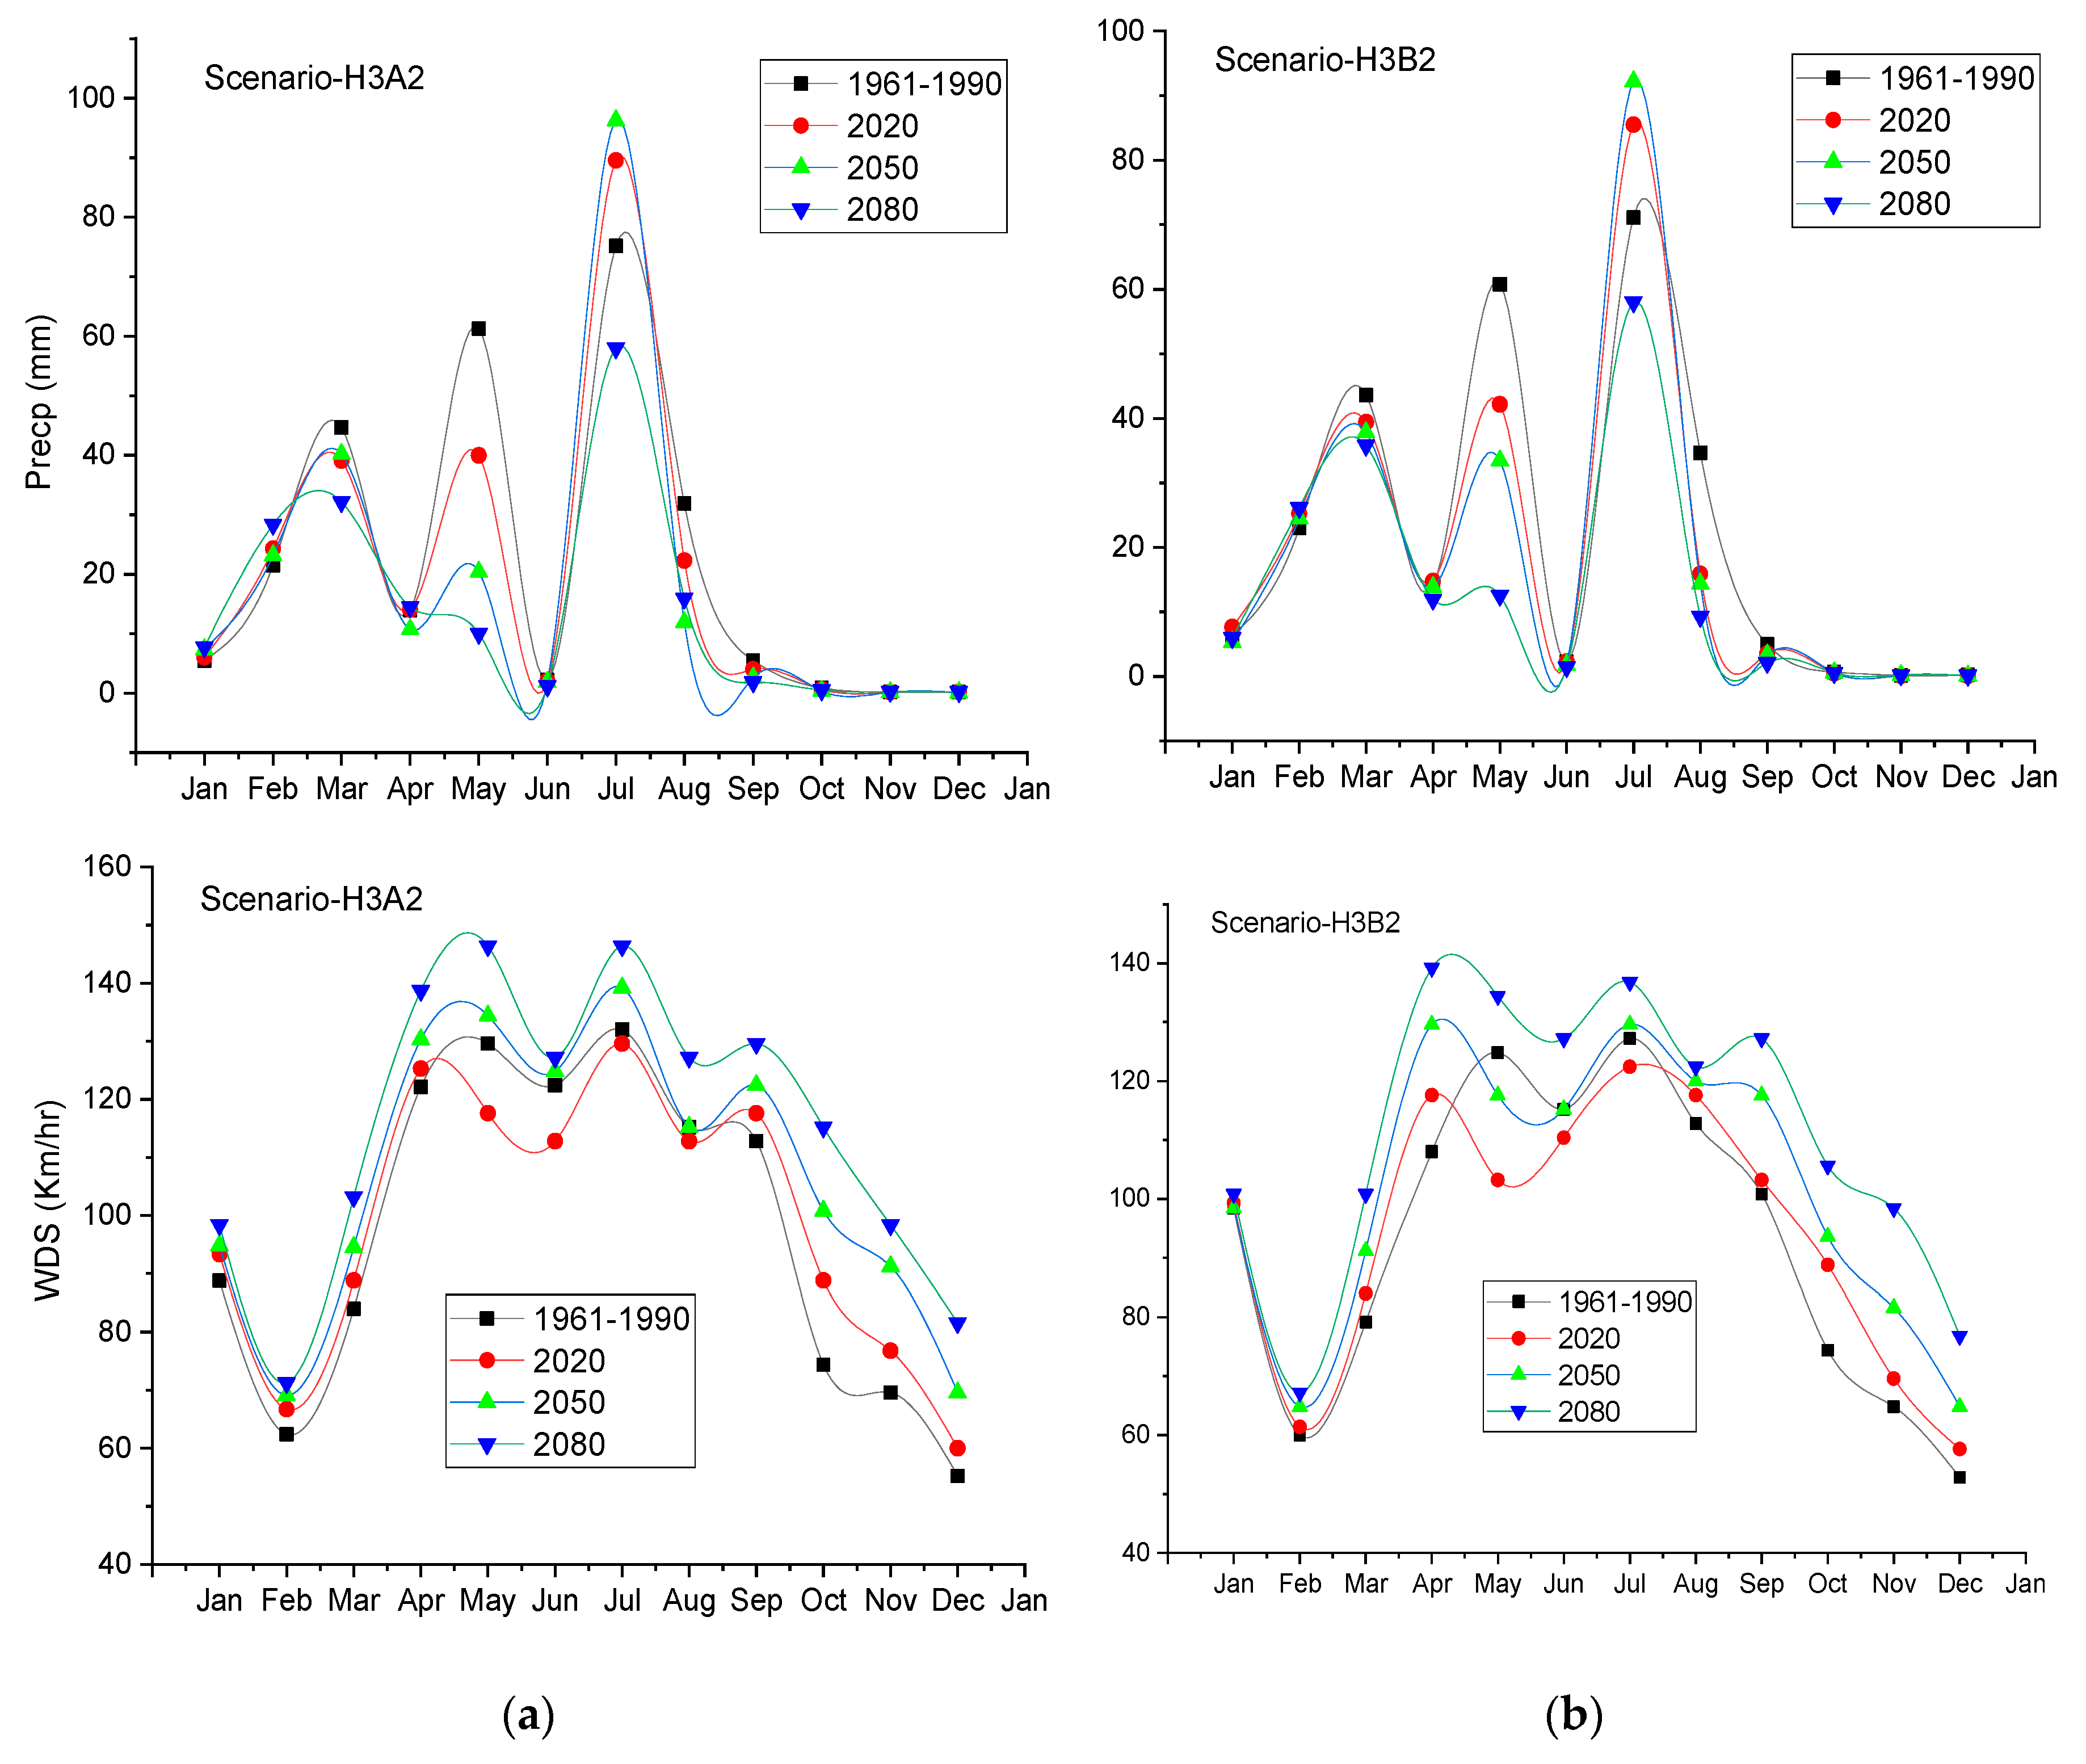
- Scenario Generation: After successful calibration and validation of SDSM, future scenarios were generated using HadCM3 data under A2 and B2 scenarios within the time span of 1961 to 2099. Three time windows, 2020 (2010–2039), 2050 (2040–2069), and 2080 (2070–2099) were constructed to assess the patterns of climate variables in different spans.
2.4. Prediction of Agriculture Cropping Patterns
2.5. Modeling Crop Irrigation Requirement (CIR)
2.6. CIR under Changing Climate and Agriculture Cropping Patterns
3. Results
3.1. Screening of NCEP Predictor Variables
3.2. Calibration and Validation of SDSM Model
3.3. Predicted Changes in Local Climate of Rechna Doab
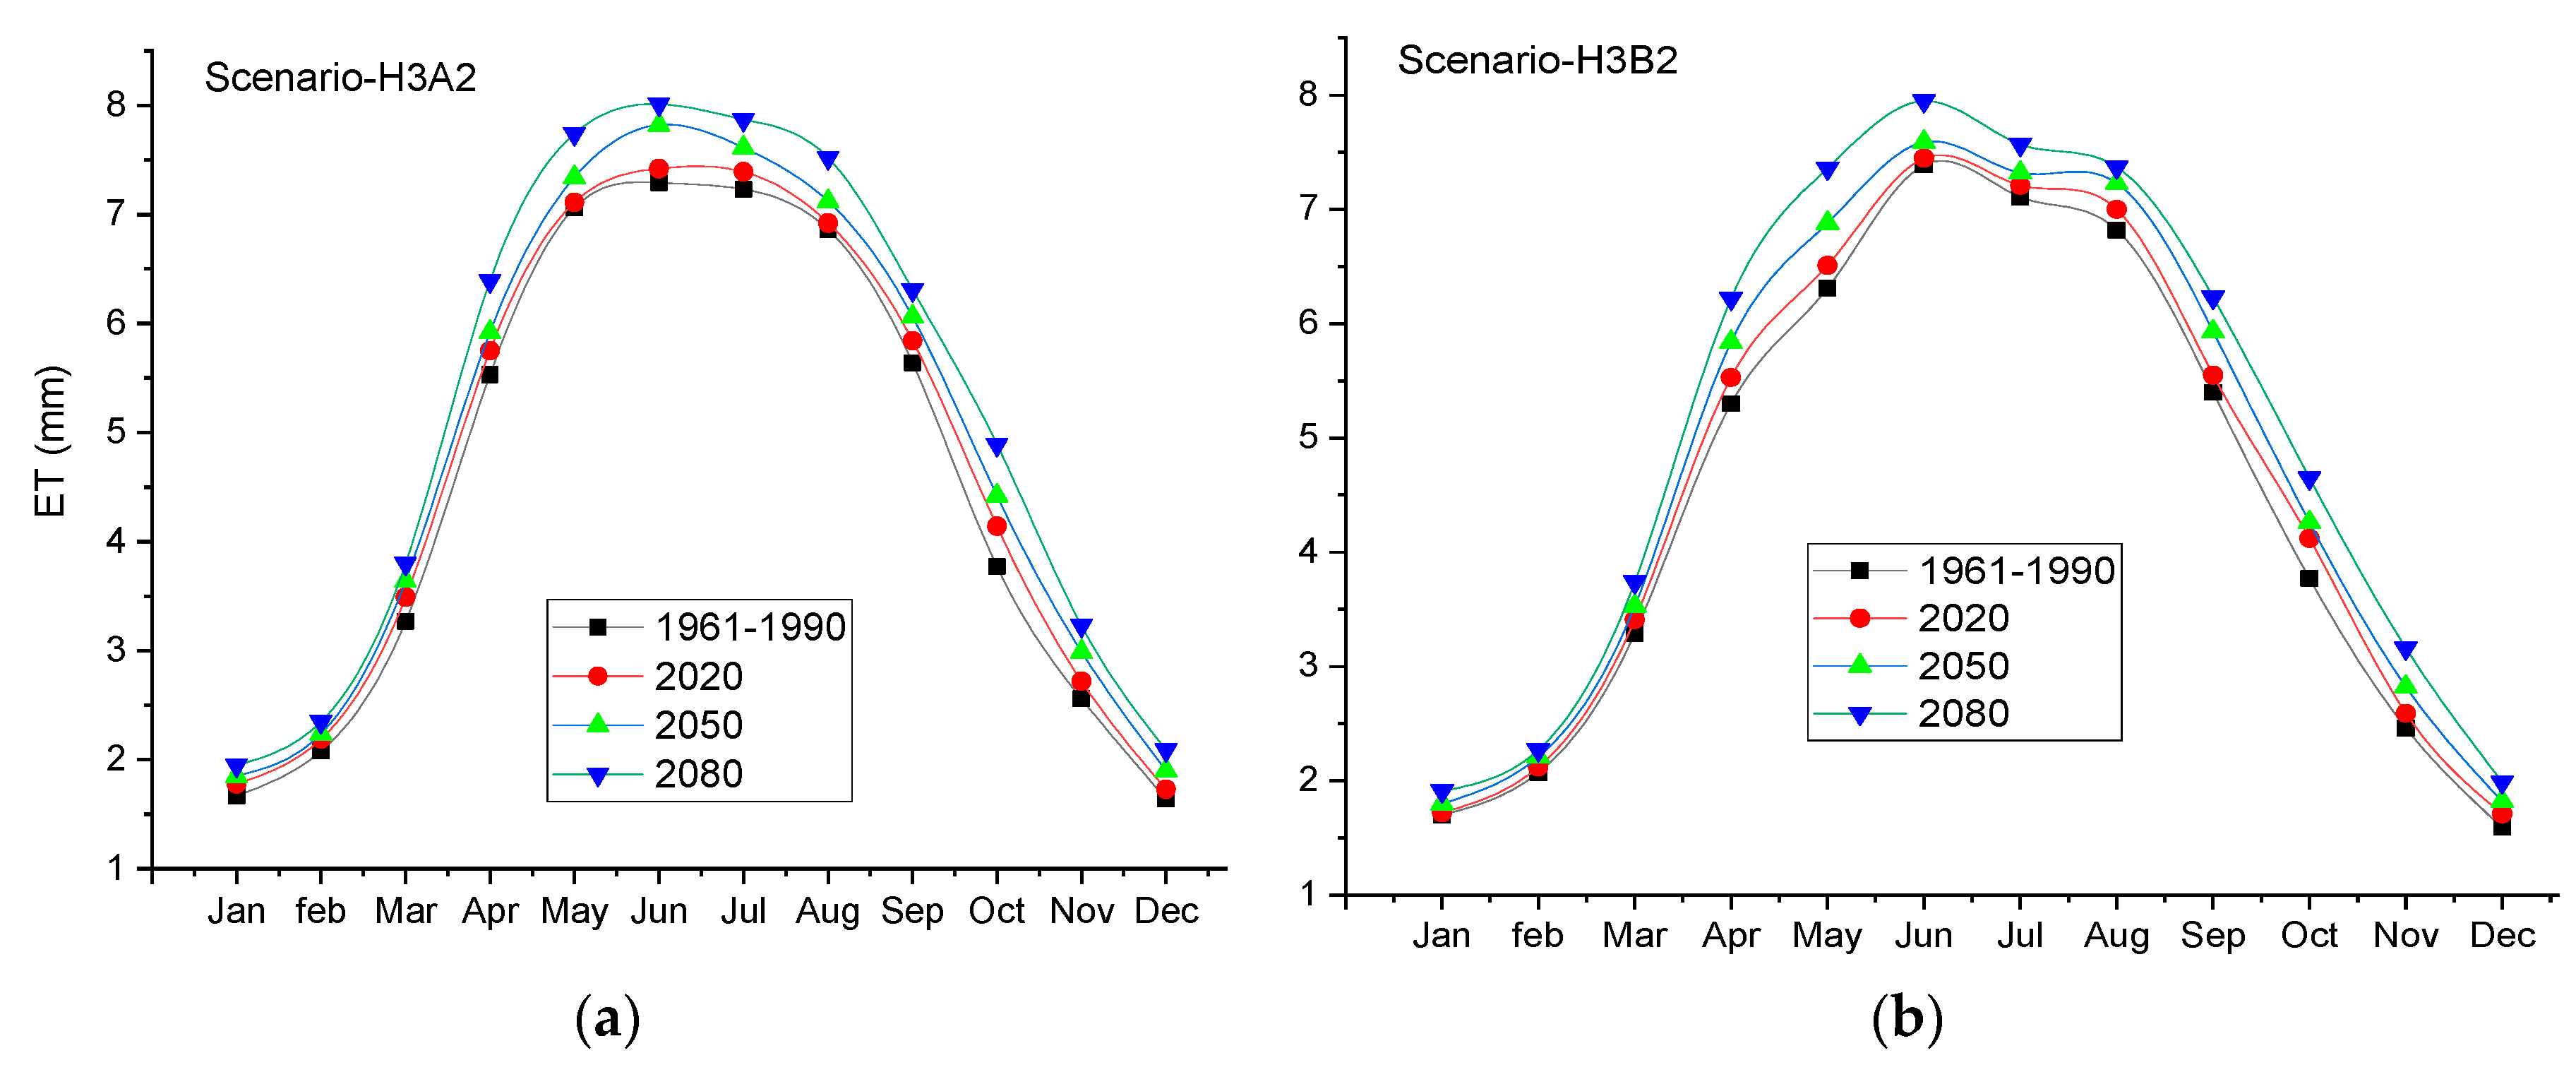
3.4. Predicted Changes in Reference ET
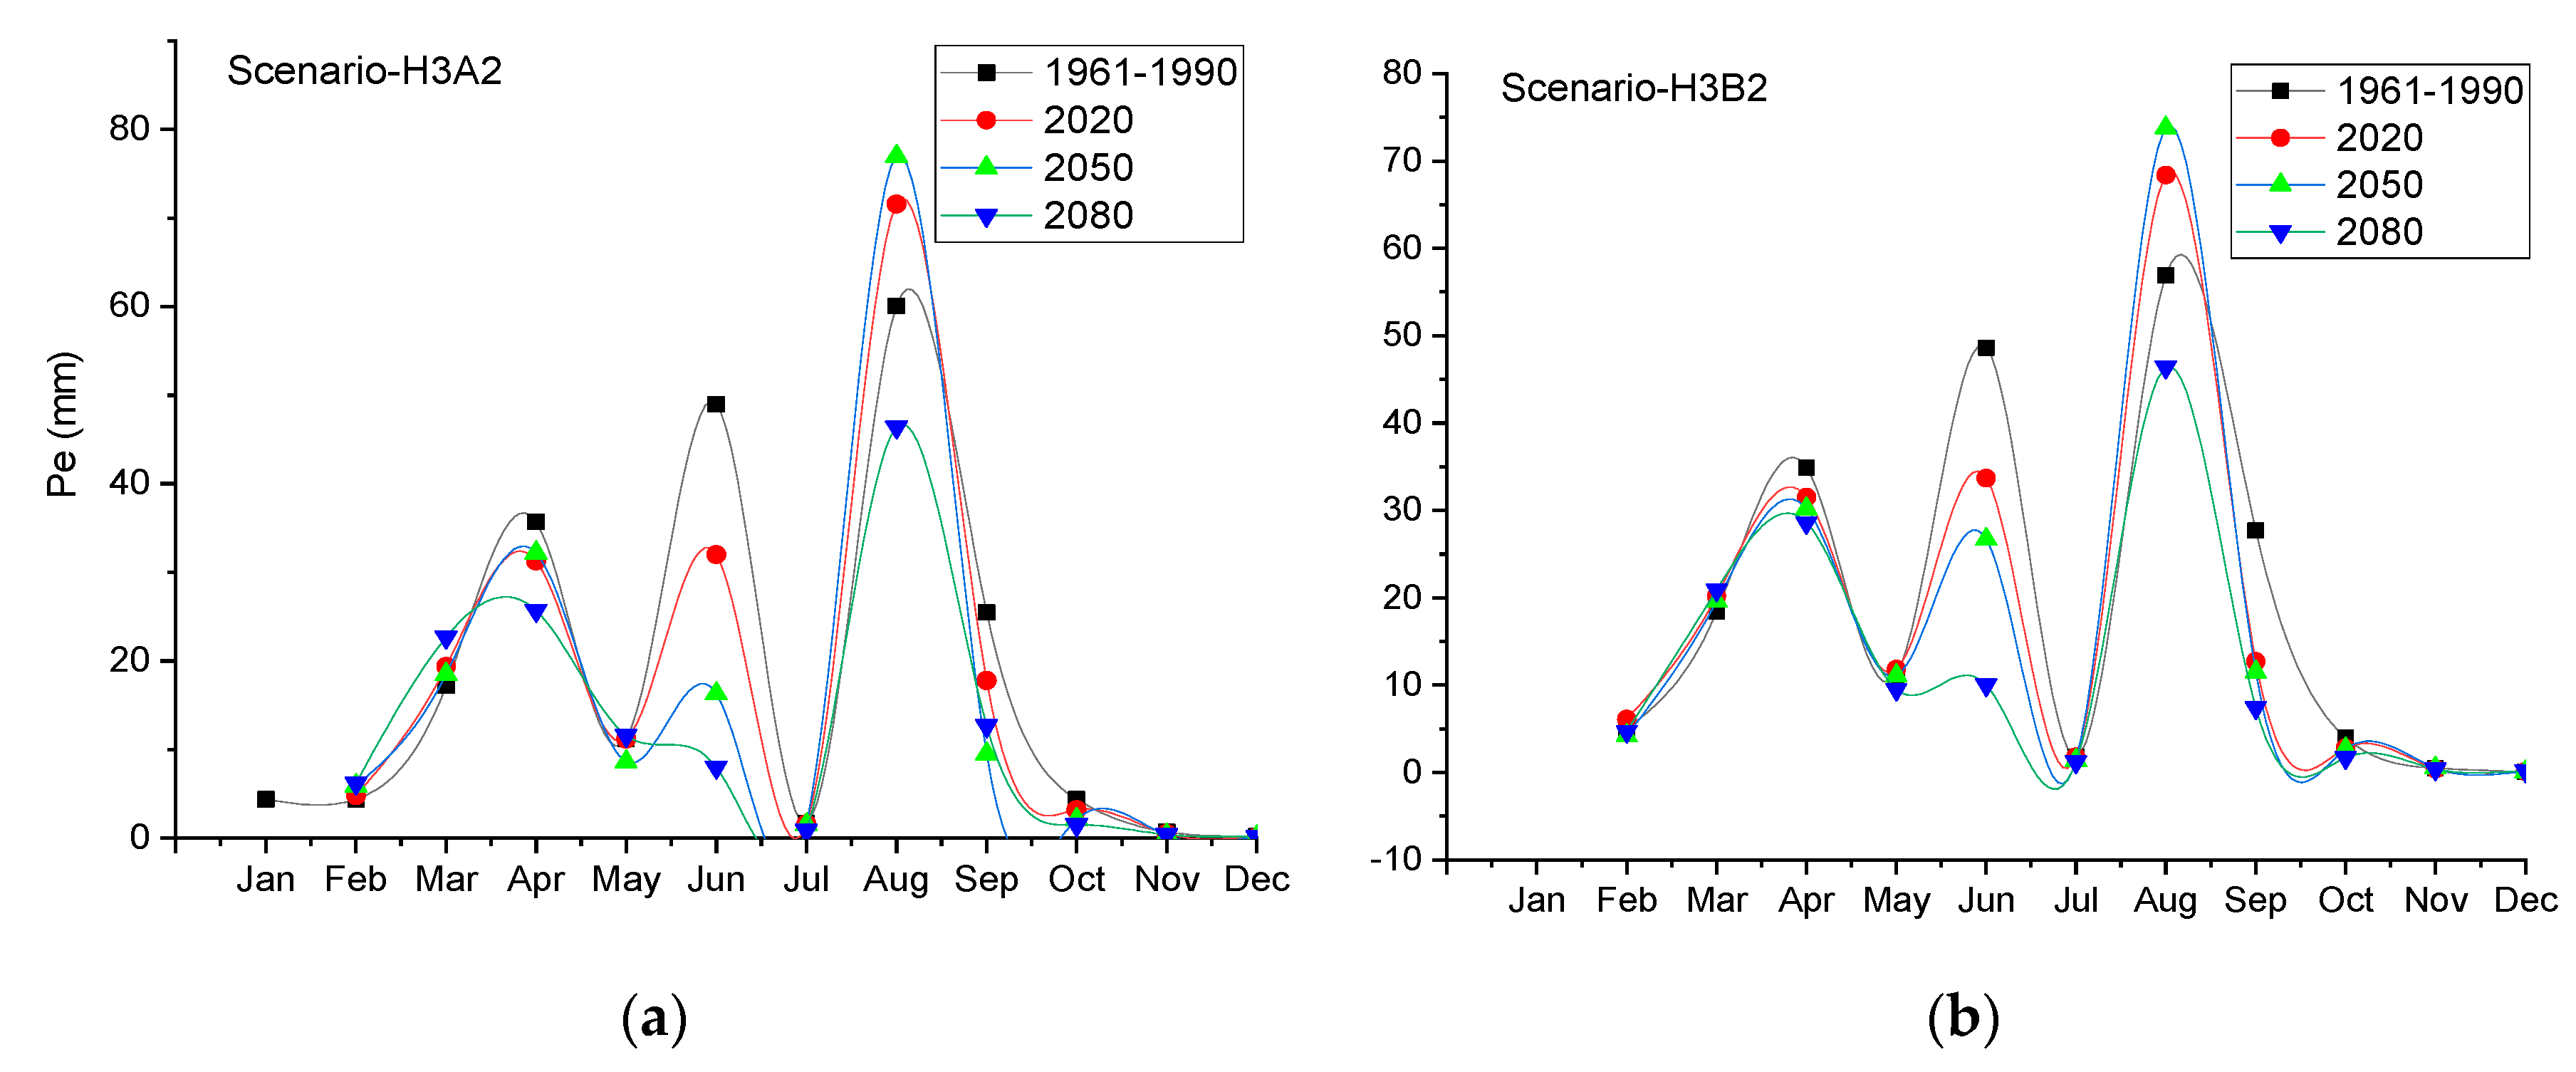
3.5. Predicted Changes in Effective Precipitation (Pe)
3.6. Predicted Changes in Agriculture Cropping Patterns
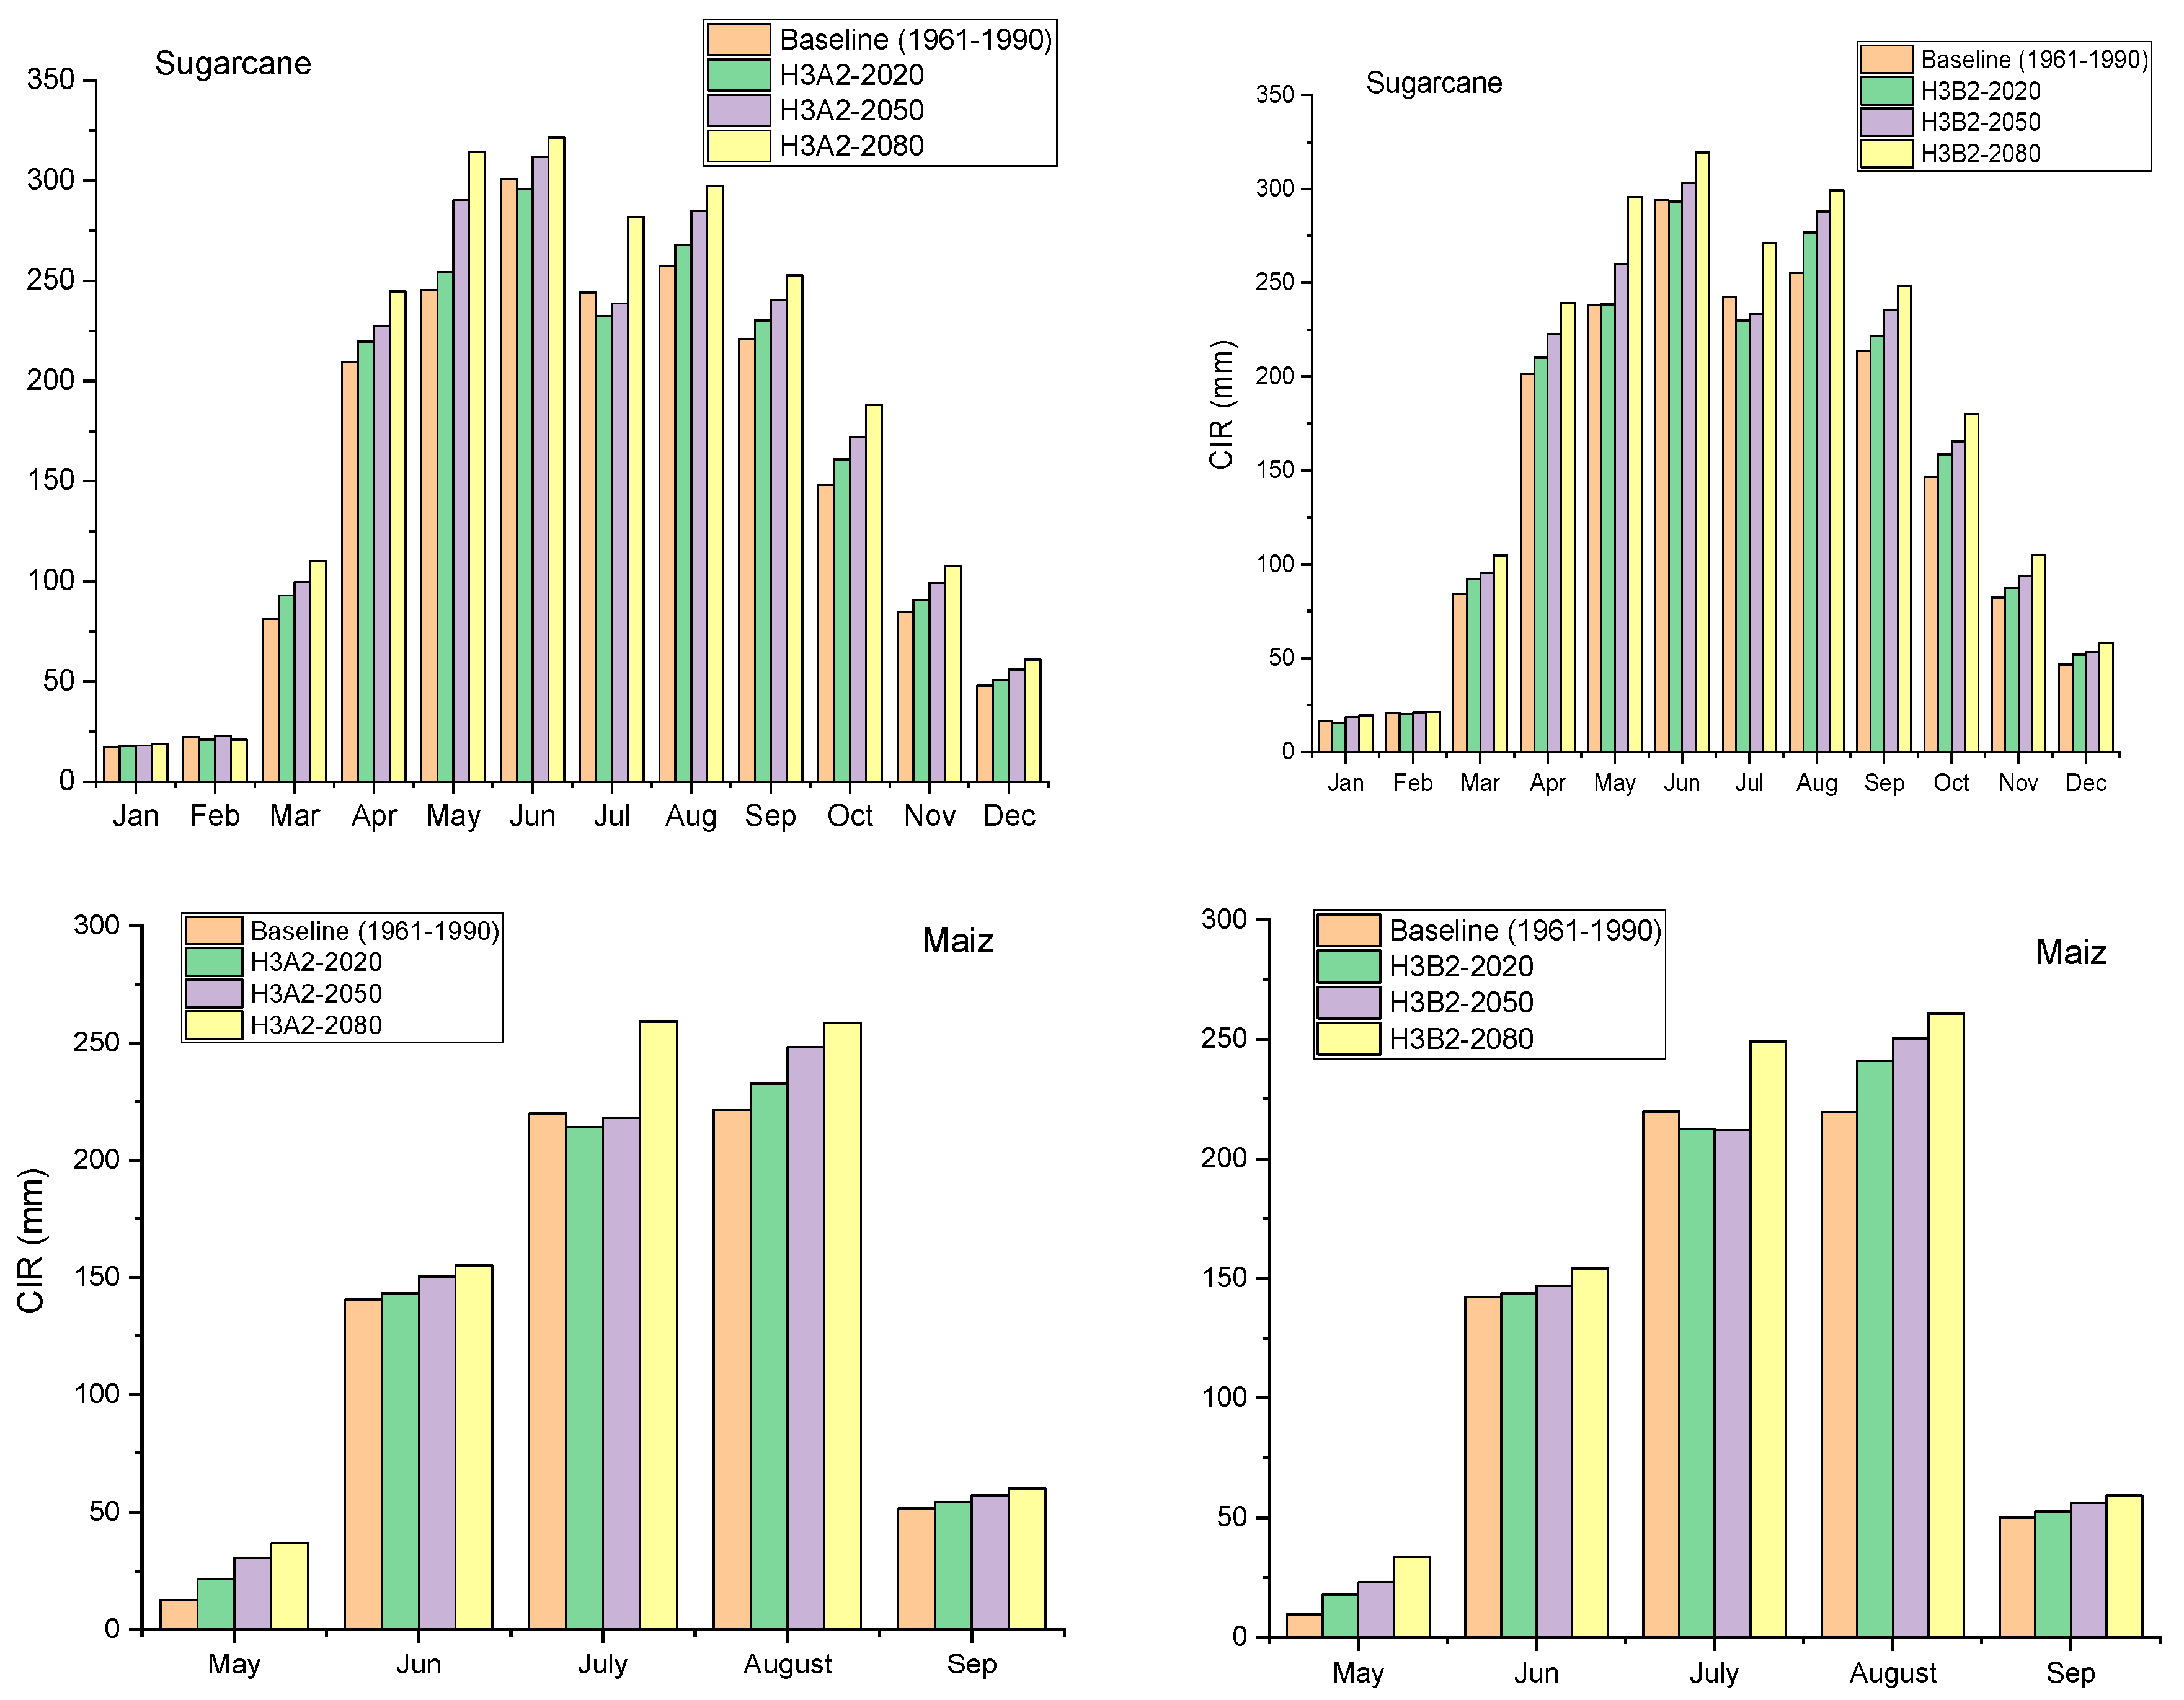
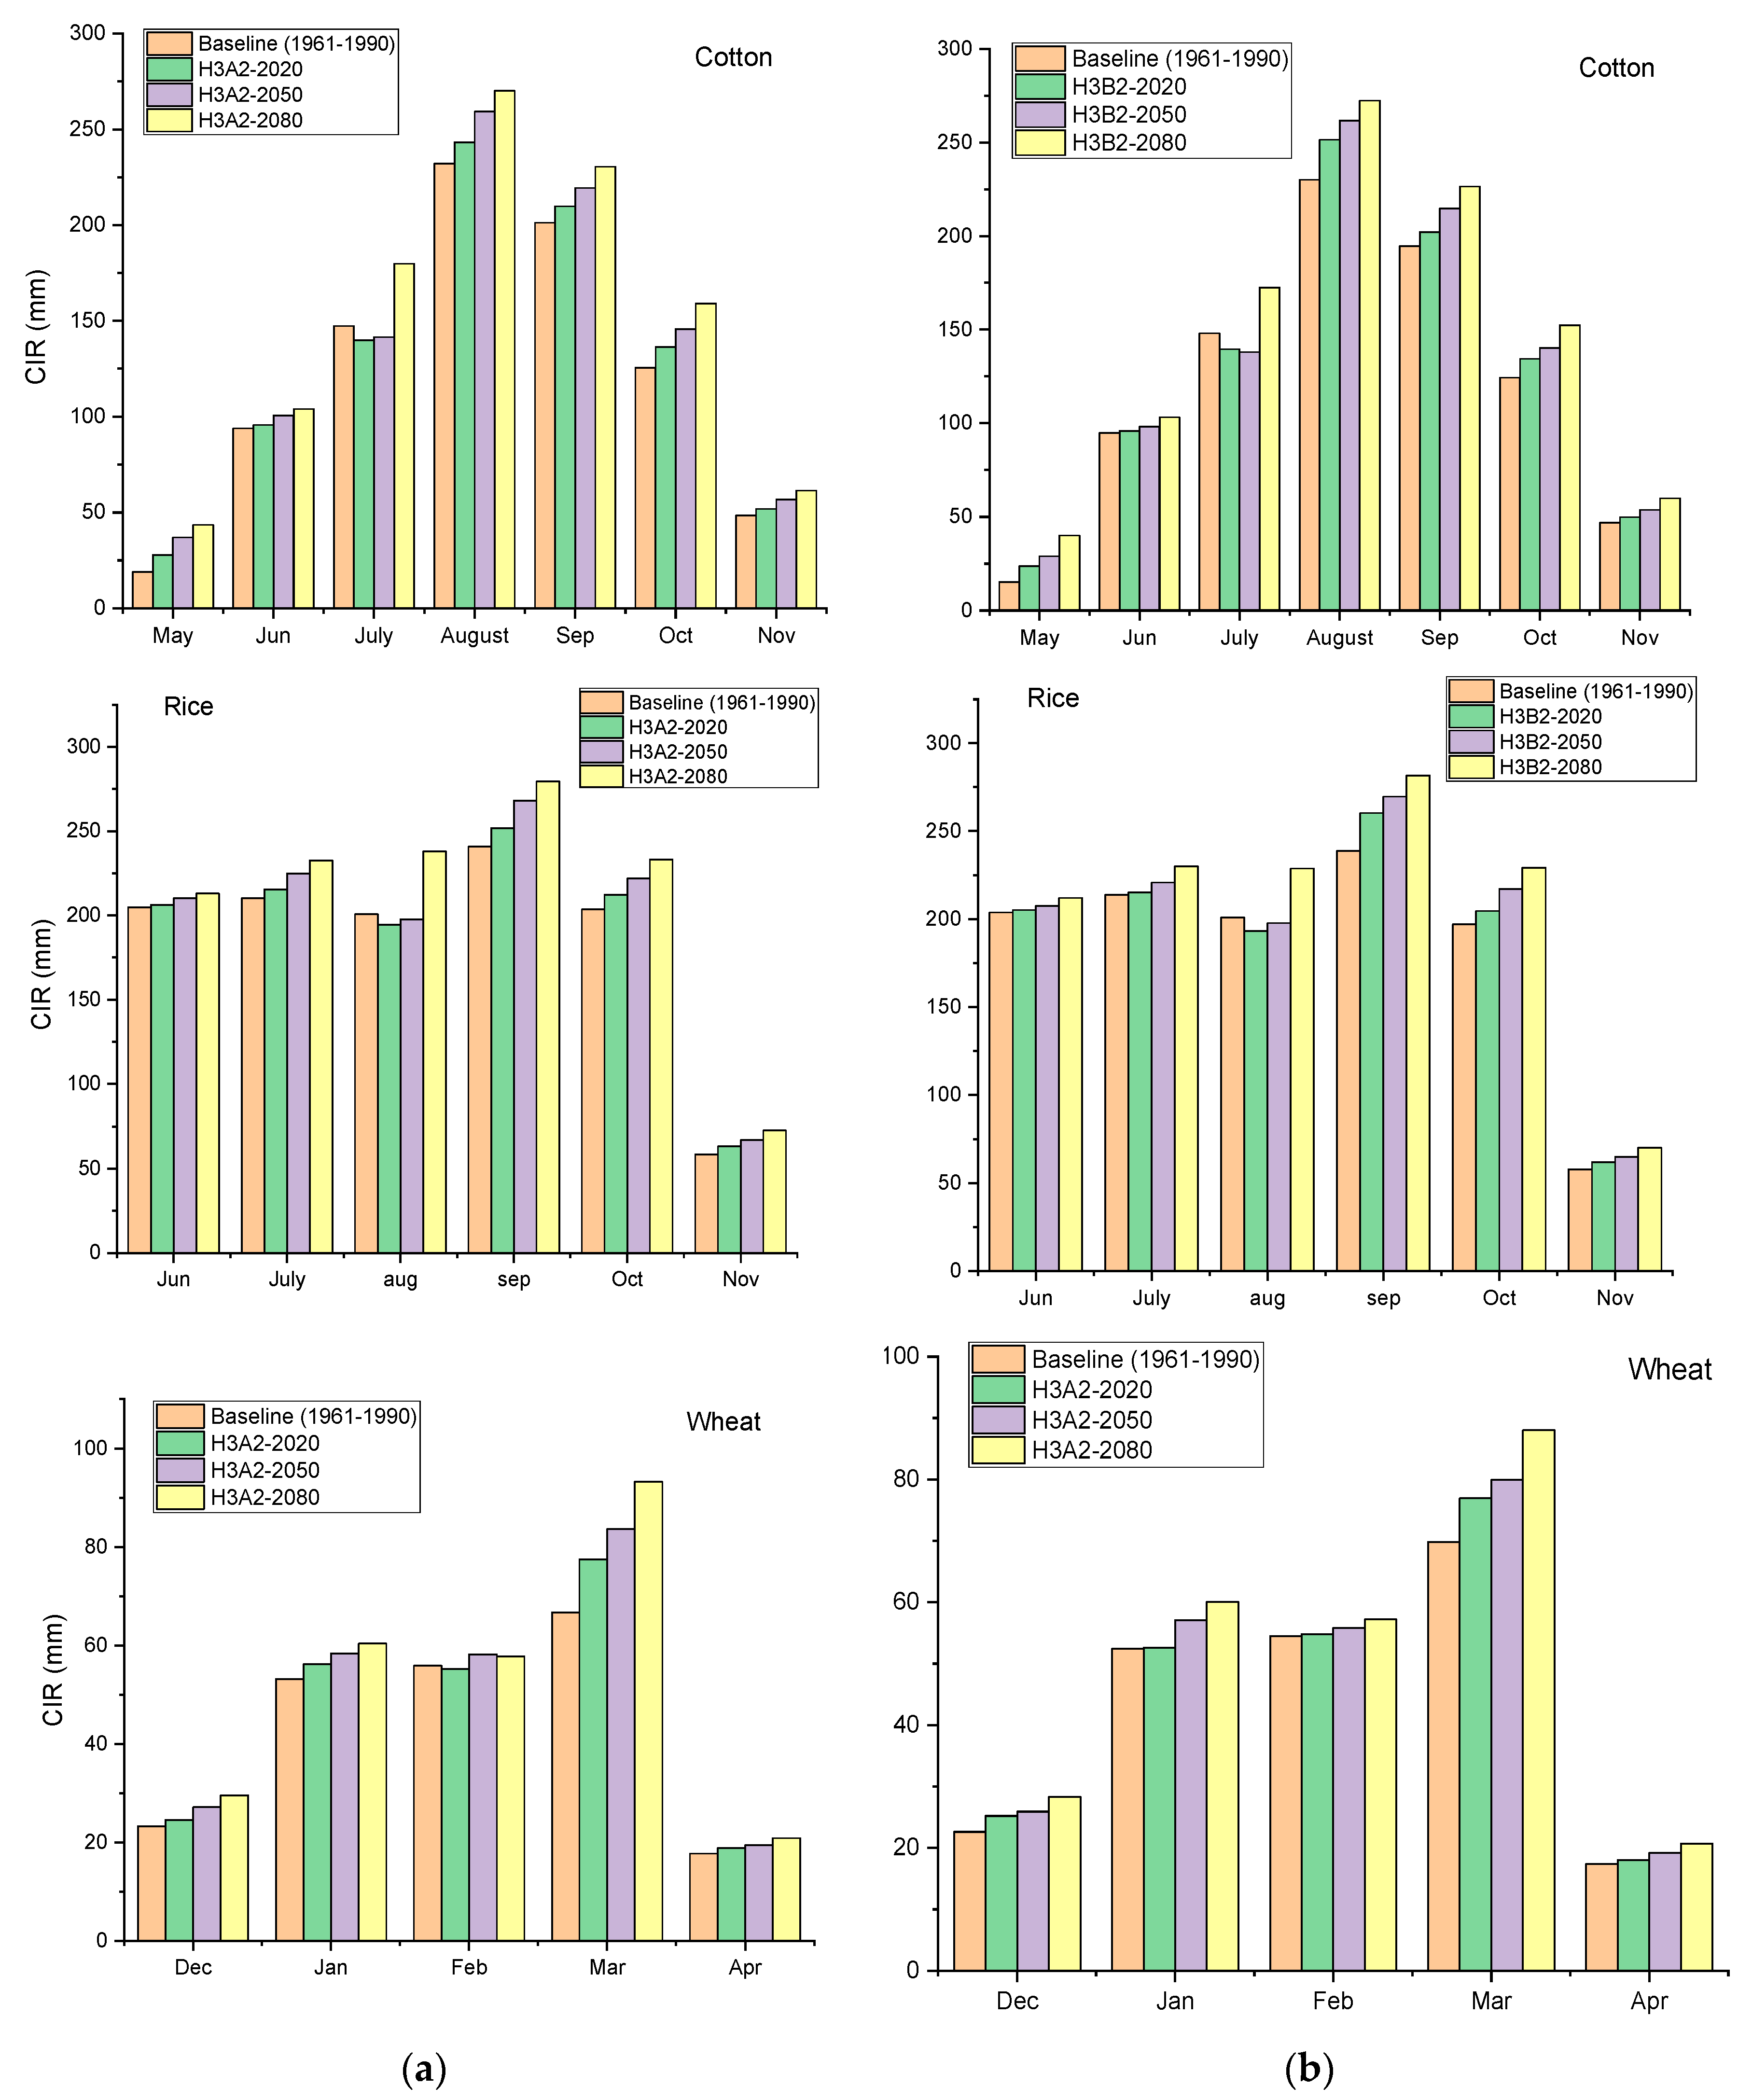
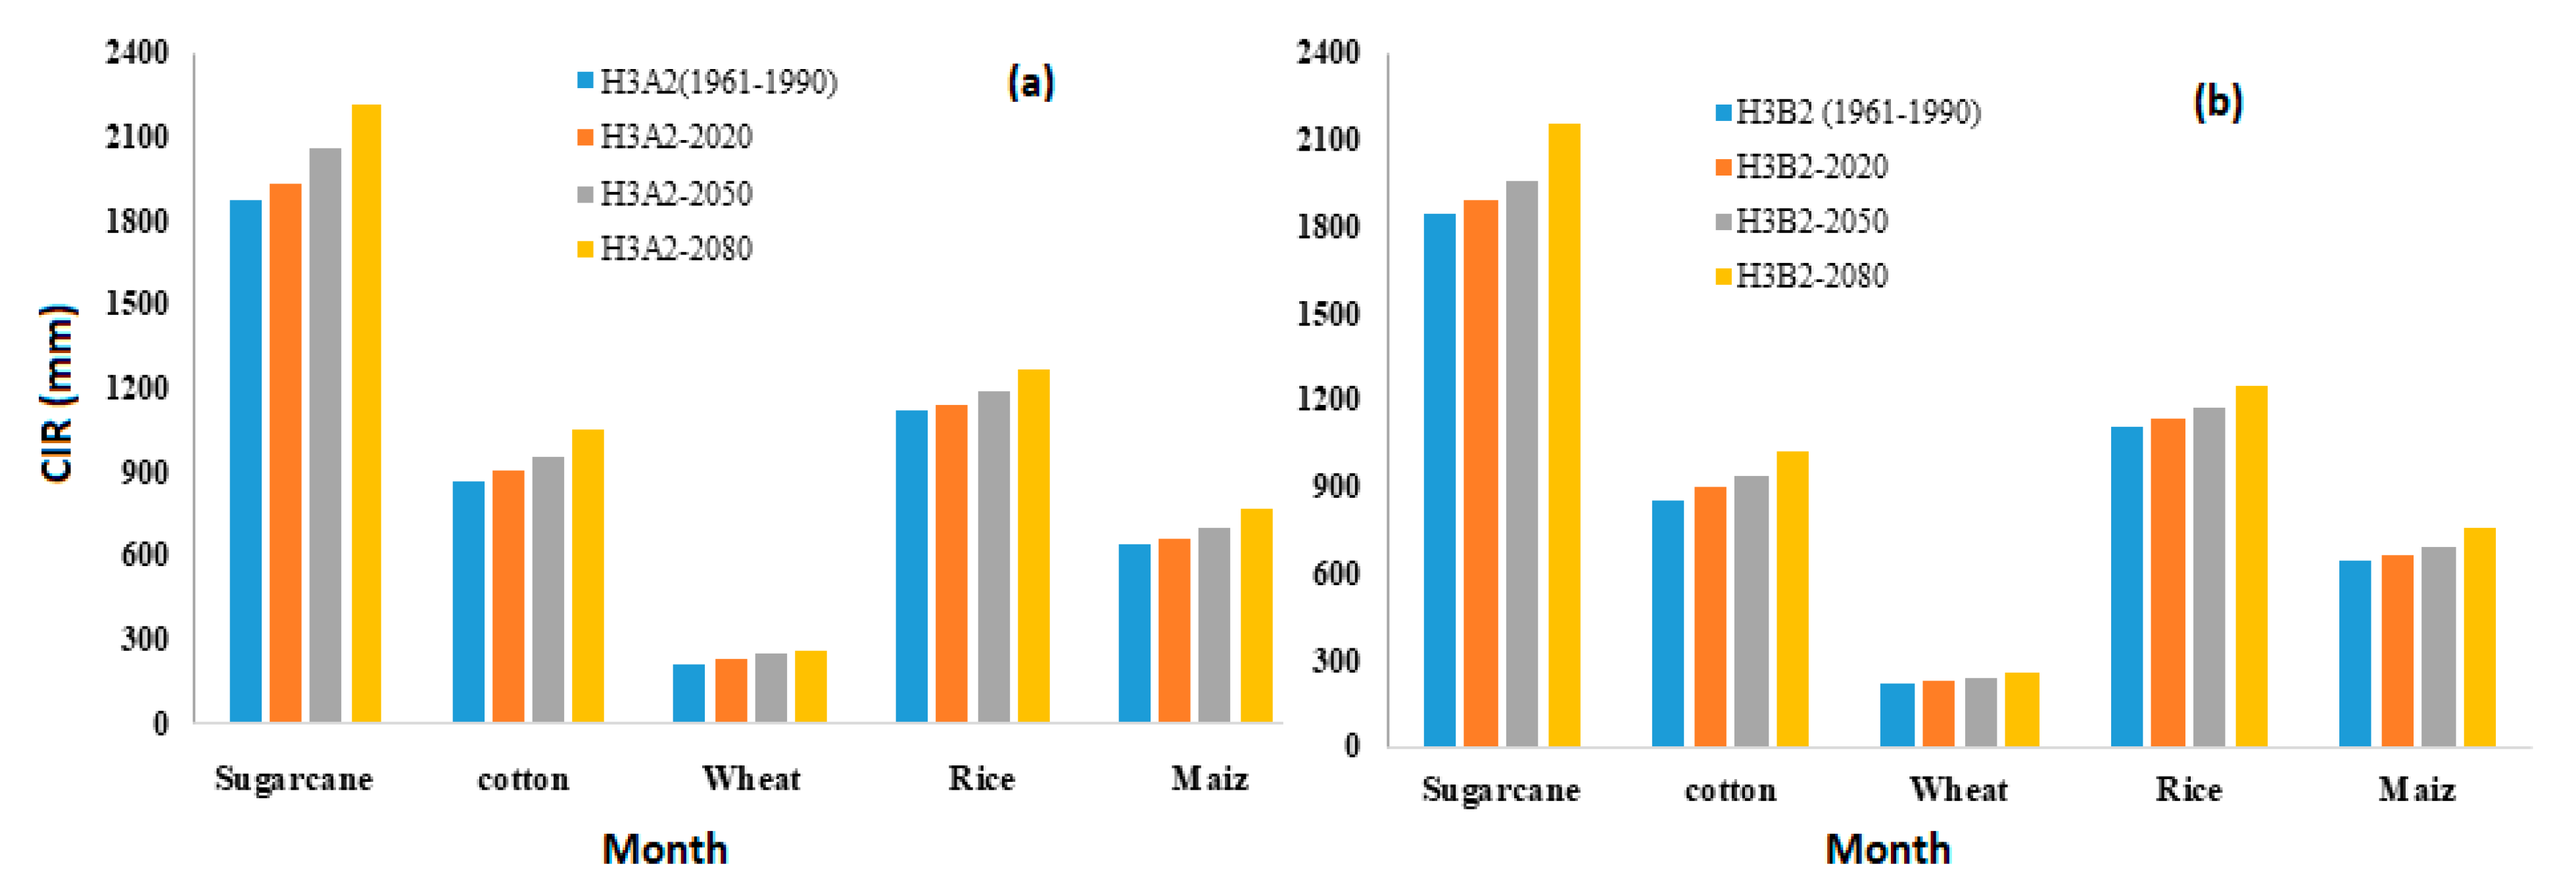
3.7. Predicted Changes in CIR
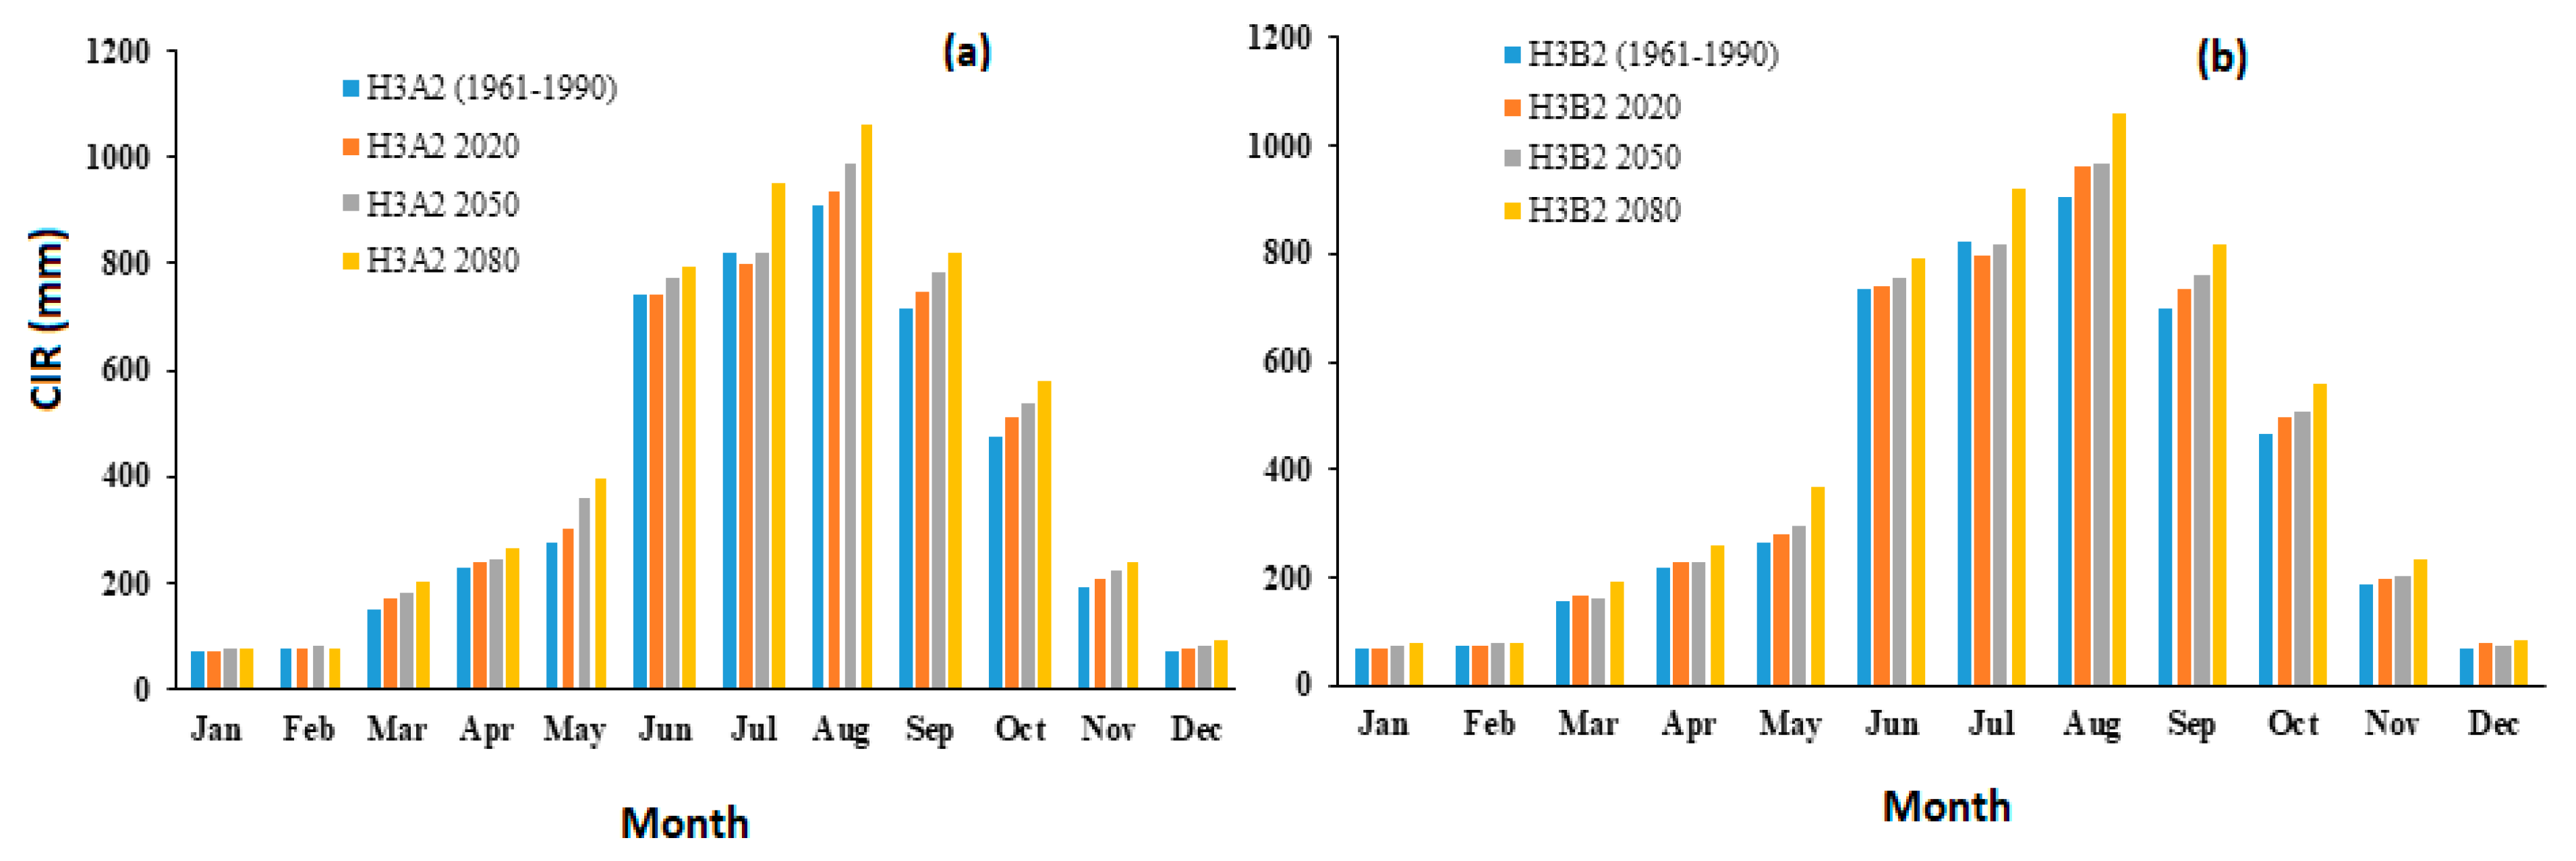
3.8. CIR under Changing Climate and Agriculture Cropping Patterns
4. Discussion
5. Conclusions
Author Contributions
Funding
Conflicts of Interest
References
- Wang, R.; Kalin, L.; Kuang, W.; Tian, H. Individual and combined effects of land use/cover and climate change on Wolf Bay watershed streamflow in southern Alabama. Hydrol. Process. 2014, 22, 5530–5546. [Google Scholar] [CrossRef]
- Sun, S.; Zhou, T.; Wu, P.; Wang, Y.; Zhao, X.; Yin, Y. Impacts of future climate and agricultural land-use changes on regional agricultural water use in a large irrigation district of northwest China. Land Degrad. Dev. 2019. [Google Scholar] [CrossRef]
- Hoekstra, A.; Mekonnen, M. The water footprint of humanity. Proc. Natl. Acad. Sci. USA 2012, 109, 3232–3237. [Google Scholar] [CrossRef] [PubMed]
- Diffenbaugh, N.S.; Singh, D.; Mankin, J.S.; Horton, D.E.; Swain, D.L.; Touma, D.; Charland, A.; Liu, Y.; Haugen, M.; Tsiang, M.; et al. Quantifying the Influence of Global Warming on Unprecedented Extreme Climate Events. Proc. Natl. Acad. Sci. USA 2014, 114, 4881–4886. [Google Scholar]
- Shiklomanov, I.; Rodda, J. World Water Resources at the Beginning of the Twenty-First Century; UNESCO International Hydrology Series; Cambridge University Press: Cambridge, UK, 2004. [Google Scholar]
- West, P.C.; Gerber, J.S.; Engstrom, P.M.; Mueller, N.D.; Brauman, K.A.; Carlson, K.M.; Cassidy, E.S.; Johnston, M.; MacDonald, G.K.; Ray, D.K.; et al. Leverage points for improving global food security and the environment. Science 2014, 345, 325–328. [Google Scholar] [CrossRef] [PubMed]
- Döll, P. Impact of climate change and variability on irrigation requirements: A global perspective. Clim. Chang. 2002, 54, 269–293. [Google Scholar] [CrossRef]
- Yano, T.; Koriyama, M.; Haraguchi, T.; Aydin, M. Prediction of future change of water demand following global warming in the Cukurova region of Turkey. In Proceedings of the International Conference on Water, Land and Food Security in Arid and Semi-Arid Regions, Mediterranean Agronomic Institute Valenzano (CIHEAM-MAIB), Bari, Italy, 6–11 September 2005. [Google Scholar]
- Diaz, J.R.; Weatherhead, E.K.; Knox, J.W.; Camacho, E. Climate change impacts on irrigation water requirements in the Guadalquivir river basin in Spain. Reg. Environ. Chang. 2007, 7, 149–159. [Google Scholar] [CrossRef]
- De Silva, C.; Weatherhead, E.K.; Knox, J.W.; Rodriguez-Diaz, J.A. Predicting the impacts of climate change—A case study of paddy irrigation water requirements in Sri Lanka. Agric. Water Manag. 2007, 93, 19–29. [Google Scholar] [CrossRef]
- Shahid, S. Impact of climate change on irrigation water demand of dry season Boro rice in northwest Bangladesh. Clim. Chang. 2011, 105, 433–453. [Google Scholar] [CrossRef]
- Safeeq, M.; Fares, A. Hydrologic response of a Hawaiian watershed to future climate change scenarios. Hydrol. Process. 2012, 26, 2745–2764. [Google Scholar]
- Ashour, E.; Al-Najar, H. The impact of climate change and soil salinity in irrigation water demand in the Gaza strip. J. Earth Sci. Clim. Chang. 2012, 3, 120. [Google Scholar]
- Downing, T.; Butterfield, R.; Edmonds, B.; Knox, J.W.; Moss, S.; Piper, B.; Weatherhead, E. CCDeW: Climate Change and Demand for Water. 2003. Available online: http://dspace.lib.cranfield.ac.uk/handle/1826/3576 (accessed on 29 July 2019).
- Wada, Y.; Wisser, D.; Eisner, S.; Flörke, M.; Gerten, D.; Haddeland, I.; Hanasaki, N.; Masaki, Y.; Portmann, F.T.; Stacke, T.; et al. Multimodel projections and uncertainties of irrigation water demand under climate change. Geophys. Res. Lett. 2013, 40, 4626–4632. [Google Scholar] [CrossRef]
- Thomas, A. Agricultural irrigation demand under present and future climate scenarios in China. Glob. Planet. Chang. 2008, 60, 306–326. [Google Scholar] [CrossRef]
- Wang, X.J.; Zhamg, J.Y.; Shahid, S.; ElMahdi, A.; He, R.M.; Bao, Z.X.; Ali, M. Water resources management strategy for adaptation to droughts in China. Mitig. Adapt. Strateg. Glob. Chang. 2012, 17, 923–937. [Google Scholar]
- Ding, Y.; Wang, W.; Song, R.; Shao, Q.; Jiao, X.; Xing, W. Modeling spatial and temporal variability of the impact of climate change on rice irrigation water requirements in the middle and lower reaches of the Yangtze River, China. Agric. Water Manag. 2017, 193, 89–101. [Google Scholar] [CrossRef]
- Rehana, S.; Mujumdar, P. Regional impacts of climate change on irrigation water demands. Hydrol. Process. 2013, 27, 2918–2933. [Google Scholar] [CrossRef]
- Brumbelow, K.; Georgakakos, A. An assessment of irrigation needs and crop yield for the United States under potential climate changes. J. Geophys. Res. Atmos. 2001, 106, 27383–27405. [Google Scholar] [CrossRef]
- IPCC. The Physical Science Basis. In Contribution of Working Group I to the Fourth Assessment Report of the Intergovernmental Panel on Climate Change; IPCC: Geneva, Switzerland, 2007. [Google Scholar]
- Pereira, A.R.; Green, S.; Nova, N.A.V. Penman–Monteith reference evapotranspiration adapted to estimate irrigated tree transpiration. Agric. Water Manag. 2006, 83, 153–161. [Google Scholar] [CrossRef]
- Poyato, E.C. Análisis de la eficiencia y el ahorro del agua en el regadío de la cuenca del Guadalquivir. Inversiones en la modernización de regadíos. Agric. Rev. Agropecu. 2005, 880, 880–887. [Google Scholar]
- Nations, U. World Population Prospects: The 2012 Revision, Highlights and Advance Tables (Working Paper No. ESA/P/WP. 228); United Nations Publications: New York, NY, USA, 2013. [Google Scholar]
- FAO. How to feed the world in 2050. In Proceedings of the Expert Meeting on How to Feed the World in 2050, Rome, Italy, 24–26 June 2009. [Google Scholar]
- GOP. Pakistan Economy Survey; Govt. of Pakistan, Finance Division, Economic Advisor’s Wing: Islamabad, Pakistan, 2017.
- Ali, A.; Rehman, F.; Nasir, M.; Ranjha, M.Z. Agricultural policy and wheat production: A case study of Pakistan. Sarhad J. Agric. 2011, 27, 201–211. [Google Scholar]
- PDS. Punjab Development Statistics; Bureau of Statistics, Government of Punjab: Lahore, Pakistan, 2015.
- Usman, M.; Liedl, R.; Shahid, M.A. Managing irrigation water by yield and water productivity assessment of a rice-wheat system using remote sensing. J. Irrig. Drain. Eng. 2014, 140, 04014022. [Google Scholar] [CrossRef]
- Sheikh, A.; Abbas, A. Barriers in efficient crop management in rice-wheat cropping system of Punjab. Pak. J. Agric. Sci. 2007, 44, 341–349. [Google Scholar]
- Lee, E.J.; Kang, M.S.; Park, S.W.; Kim, H.K. Estimation of Future Reference Evapotranspiration Using Artificial Neural Network and Climate Change Scenar; American Society of Agricultural and Biological Engineers: Pittsburgh, PA, USA, 2010. [Google Scholar]
- Chun, K.P.; Wheater, H.S.; Onof, C. Projecting and hindcasting potential evaporation for the UK between 1950 and 2099. Clim. Chang. 2012, 113, 639–661. [Google Scholar] [CrossRef]
- Li, Z.; Zheng, F.L.; Liu, W.Z. Spatiotemporal characteristics of reference evapotranspiration during 1961–2009 and its projected changes during 2011–2099 on the Loess Plateau of China. Agric. For. Meteorol. 2012, 154, 147–155. [Google Scholar] [CrossRef]
- Fan, J.; Wu, L.; Zhang, F.; Xiang, Y.; Zheng, J. Climate change effects on reference crop evapotranspiration across different climatic zones of China during 1956–2015. J. Hydrol. 2016, 542, 923–937. [Google Scholar] [CrossRef]
- Fuhrer, J.; Smith, P.; Gobiet, A. Implications of climate change scenarios for agriculture in alpine regions—A case study in the Swiss Rhone catchment. Sci. Total Environ. 2014, 493, 1232–1241. [Google Scholar] [CrossRef]
- Maeda, E.E.; Pellikka, P.K.; Clark, B.J.; Siljander, M. Prospective changes in irrigation water requirements caused by agricultural expansion and climate changes in the eastern arc mountains of Kenya. J. Environ. Manag. 2011, 92, 982–993. [Google Scholar] [CrossRef]
- Ayala, L.M.; van Eupen, M.; Zhang, G.; Pérez-Soba, M.; Martorano, L.G.; Lisboa, L.S.; Beltrao, N.E. Impact of agricultural expansion onwater footprint in the Amazon under climate change scenarios. Sci. Total Environ. 2016, 569, 1159–1173. [Google Scholar] [CrossRef]
- Smith, M. CROPWAT: Manual and Guidelines; FAO of UN: Rome, Italy, 1991. [Google Scholar]
- Smith, M.; Kivumbi, D.; Heng, L. Use of the FAO CROPWAT model in deficit irrigation studies. 2002. Available online: http://www.fao.org/DOCREP/004/Y3655E/Y3655E00.HTM (accessed on 29 July 2019).
- George, B.; Shende, S.; Raghuwanshi, N. Development and testing of an irrigation scheduling model. Agric. Water Manag. 2000, 46, 121–136. [Google Scholar] [CrossRef]
- Anadranistakis, M.; Liakatas, A.; Kerkides, P.; Rizos, S.; Gavanosis, J.; Poulovassilis, A. Crop water requirements model tested for crops grown in Greece. Agric. Water Manag. 2000, 45, 297–316. [Google Scholar] [CrossRef]
- Munoz, G.; Maraux, F.; Wahaj, R. Actual Crop Water Use in Project Countries a Synthesis at the Regional Level. The World Bank, 2007. Available online: https://doi.org/10.1596/1813-9450-4288 (accessed on 29 July 2019).
- Kuo, S.F.; Ho, S.S.; Liu, C.W. Estimation irrigation water requirements with derived crop coefficients for upland and paddy crops in ChiaNan Irrigation Association, Taiwan. Agric. Water Manag. 2006, 82, 433–451. [Google Scholar] [CrossRef]
- Kang, S.; Payne, W.A.; Evett, S.R.; Robinson, C.A.; Stewart, B.A. Simulation of winter wheat evapotranspiration in Texas and Henan using three models of differing complexity. Agric. Water Manag. 2009, 96, 167–178. [Google Scholar] [CrossRef]
- Muhammad, N. Simulation of maize crop under irrigated and rainfed conditions with CROPWAT model. J. Agric. Biol. Sci. 2009, 4, 68–73. [Google Scholar]
- Mimi, Z.A.; Jamous, S.A. Climate change and agricultural water demand: Impacts and adaptations. Afr. J. Environ. Sci. Technol. 2010, 4. [Google Scholar]
- Stancalie, G.; Marica, A.; Toulios, L. Using earth observation data and CROPWAT model to estimate the actual crop evapotranspiration. Phys. Chem. Earth Parts A/B/C 2010, 35, 25–30. [Google Scholar] [CrossRef]
- Mhashu, S. Yield Response to Water Function and Simulation of Deficit Irrigation Scheduling of Sugarcane at Estate in Zimbabwe Using CROPWAT 8.0 and CLIMWAT 2.0. Master’s Thesis, Universitadegli Studi di Firenze Facolta di Agraria (University of Florence, Faculty of Agriculture), Florence, Italy, 2007. [Google Scholar]
- Gordon, C.; Cooper, C.; Senior, C.A.; Banks, H.; Gregory, J.M.; Johns, T.C.; Mitchell, J.F.; Wood, R.A. The simulation of SST, sea ice extents and ocean heat transports in a version of the Hadley Centre coupled model without flux adjustments. Clim. Dyn. 2000, 16, 147–168. [Google Scholar] [CrossRef]
- Nakicenovic, N.; Alcamo, J.; Davis, G.; de Vries, B.; Fenhann, J.; Gaffin, S.; Gregory, K.; Gru¨bler, A.; Jung, T.Y.; Kram, T.; et al. IPCC Special Report on Emissions Scenarios; Cambridge University Press: Amsterdam, The Netherlands, 2000; Available online: https://www.ipcc.ch/report/emissions-scenarios/ (accessed on 29 July 2019).
- Razandi, Y.; Pourghasemi, H.R.; Neisani, N.S.; Rahmati, O. Application of analytical hierarchy process, frequency ratio, and certainty factor models for groundwater potential mapping using GIS. Earth Sci. Inform. 2015, 8, 867–883. [Google Scholar] [CrossRef]
- Babu, R.G.; Veeranna, J.; Kumar, K.R.; Rao, I.B. Estimation of water requirement for different crops using CROPWAT model in Anantapur region. J. Environ. Sci. 2014, 9, 75–79. [Google Scholar] [CrossRef]
- Mehta, R.; Pandey, V. Crop water requirement (ETc) of different crops of middle Gujarat. J. Agrometeorol. 2016, 18, 8354. [Google Scholar]
- GPS. Our Data Citations; Division Federal Bureau of Statistics Economic Wing: Islamabad, Pakistan, 2008.
- Daniels, A.E.; Morrison, J.F.; Joyce, L.A.; Crookston, N.L.; Chen, S.C.; McNully, S.G. Climate projections FAQ; Department of Agriculture, Forest -Service, Rocky Mountain Research Station: Fort Collins, CO, USA, 2012; pp. 1–31.
- Ray, A.J.; Barsugli, J.J.; Averyt, K.B.; Wolter, K.; Hoerling, M.; Doesken, N.; Udall, B.; Webb, R.S. Climate Change in Colorado: A Synthesis to Support Water Resources Management and Adaptation. 2008. Available online: http://wwa.colorado.edu (accessed on 29 July 2019).
- Jones, P.G.; Thornton, P.K.; Heinke, J. Generating Characteristic Daily Weather Data Using Downscaled Climate Model Data from the IPCC’s Fourth Assessment; International Livestock Research Institute: Nairobi, Kenya, 2009. [Google Scholar]
- STARDEX, Downscaling Climate Extremes. Available online: https://crudata.uea.ac.uk/projects/stardex/ (accessed on 29 July 2019).
- Fowler, H.; Archer, D. Conflicting signals of climatic change in the Upper Indus Basin. J. Clim. 2006, 19, 4276–4293. [Google Scholar] [CrossRef]
- Wilby, R.L.; Troni, J.; Biot, Y.; Tedd, L.; Hewitson, B.C.; Smith, D.M.; Sutton, R.T. A review of climate risk information for adaptation and development planning. Int. J. Climatol. A J. R. Meteorol. Soc. 2009, 29, 1193–1215. [Google Scholar]
- Seaby, L.P.; Refsgaard, J.C.; Sonnenborg, T.O.; Stisen, S.; Christensen, J.H.; Jensen, K.H. Assessment of robustness and significance of climate change signals for an ensemble of distribution-based scaled climate projections. J. Hydrol. 2013, 486, 479–493. [Google Scholar] [CrossRef]
- Wilby, R.L.; Wigley, M.L.; Conway, D.; Jones, P.D.; Hewitson, B.C.; Main, J.; Wilks, D.S. Statistical downscaling of general circulation model output: A comparison of methods. Water Resour. Res. 1998, 34, 2995–3008. [Google Scholar] [CrossRef]
- Zorita, E.; Von Storch, H. The analog method as a simple statistical downscaling technique: Comparison with more complicated methods. J. Clim. 1999, 12, 2474–2489. [Google Scholar] [CrossRef]
- Mahmood, R.; Babel, M.S. Evaluation of SDSM developed by annual and monthly sub-models for downscaling temperature and precipitation in the Jhelum basin, Pakistan and India. Theor. Appl. Climatol. 2013, 113, 27–44. [Google Scholar] [CrossRef]
- Fowler, H.J.; Blenkinsop, S.; Tebaldi, C. Linking climate change modelling to impacts studies: Recent advances in downscaling techniques for hydrological modelling. Int. J. Climatol. 2007, 27, 1547–1578. [Google Scholar] [CrossRef]
- Development, United States Armed Forces Institute. A Review of Downscaling Methods for Climate Change Projections. 2014. Available online: https://www.climatelinks.org/resources/ (accessed on 29 July 2019).
- Wilby, R.L.; Dawson, C.W.; Barrow, E.M. SDSM—A decision support tool for the assessment of regional climate change impacts. Environ. Model. Softw. 2002, 17, 145–157. [Google Scholar] [CrossRef]
- Liu, J.; Williams, J.R.; Wang, X.; Yang, H. Using MODAWEC to generate daily weather data for the EPIC model. Environ. Model. Softw. 2009, 24, 655–664. [Google Scholar] [CrossRef]
- Chu, J.; Xia, J.; Xu, C.Y.; Singh, V.P. Statistical downscaling of daily mean temperature, pan evaporation and precipitation for climate change scenarios in Haihe River, China. Theor. Appl. Climatol. 2010, 99, 149–161. [Google Scholar] [CrossRef]
- Khan, M.S.; Coulibaly, P.; Dibike, Y. Uncertainty analysis of statistical downscaling methods. J. Hydrol. 2006, 319, 357–382. [Google Scholar] [CrossRef]
- Huang, J.; Zhang, J.; Zhang, Z.; Xu, C.; Wang, B.; Yao, J. Estimation of future precipitation change in the Yangtze River basin by using statistical downscaling method. Stoch. Environ. Res. Risk Assess. 2011, 25, 781–79272. [Google Scholar] [CrossRef]
- Wilby, R.L.; Dawson, C.W. SDSM 4.2—A decision support tool for the assessment of regional climate change impacts. 2007. Available online: https://sdsm.org.uk/sdsmmain.html (accessed on 29 July 2019).
- Pallant, J. SPSS Survival Manual: A Step by Step Guide to Data Analysis Using SPSS for Windows; Allen & Unwin Pty: Crows Nest, Australia, 2005. [Google Scholar]
- Faria, A.E., Jr. Forecasting: Methods and Applications; Makridakis, S., Wheelwright, S.C., Hyndman, R.J., Eds.; John Wiley and Sons: New York, NY, USA, 1998; p. 642. ISBN 0-471-53233-9. [Google Scholar]
- Allen, R.; Pereira, L.S.; Raes, D.; Smith, M. Crop evapotranspiration: Guidelinesfor computing crop water requirements—FAO Irrigation and Drainage Paper 56; FAO: Rome, Italy, 1998. [Google Scholar]
- Er-Raki, S.; Chehbouni, A.; Guemouria, N.; Duchemin, B.; Ezzahar, J. Combining FAO-56 model and ground-based remote sensing to estimate water consumptions of wheat crops in a semi-arid region. Agric. Water Manag. 2007, 84, 44–56. [Google Scholar] [CrossRef]
- Hashmi, M.Z.; Shamseldin, A.Y.; Melville, B.W. Comparison of SDSM and LARS-WG for simulation and downscaling of extreme precipitation events in a watershed. Stoch. Environ. Res. Risk Assess. 2011, 25, 475–484. [Google Scholar] [CrossRef]
- Klein Tank, A.M.; Peterson, T.C.; Quadir, D.A.; Dorji, S.; Zou, X.; Tang, H.; Santhosh, K.; Joshi, U.R.; Jaswal, A.K.; Kolli, R.K.; et al. Changes in daily temperature and precipitation extremes in central and south Asia. J. Geophys. Res. Atmos. 2006, 111. [Google Scholar] [CrossRef]
- Afzaal, M.; Haroon, M.A.; Zaman, Q. Interdecadal Oscillations and the Warming Trend in the Area-Weighted Annual Mean Temperature of Pakistan. Pak. J. Meteorol. 2009, 6, 13–19. [Google Scholar]
- Arfan, A.; Zhang, W.; Zaman, M.A.; Dilawar, A.; Sajid, Z. Monitoring the impacts of spatio-temporal land-use changes on the regional climate of city Faisalabad, Pakistan. Ann. GIS. 2019, 25, 57–70. [Google Scholar]
- Yu, P.S.; Yang, T.C.; Chou, C.C. Effects of climate change on evapotranspiration from paddy fields in southern Taiwan. Clim. Chang. 2002, 54, 165–179. [Google Scholar] [CrossRef]
- Tabari, H.; Marofi, S.; Aeini, A.; Talaee, P.H.; Mohammadi, K. Trend analysis of reference evapotranspiration in the western half of Iran. Agric. For. Meteorol. 2011, 151, 128–136. [Google Scholar] [CrossRef]
- Piticar, A.; Mihăilă, D.; Lazurca, L.G.; Bistricean, P.I.; Putuntica, A.; Briciu, A.E. Spatiotemporal distribution of reference evapotranspiration in the Republic of Moldova. Theor. Appl. Climatol. 2016, 124, 1133–1144. [Google Scholar] [CrossRef]
- Chowdhury, S.; Al-Zahrani, M.; Abbas, A. Implications of climate change on crop water requirements in arid region: An example of Al-Jouf, Saudi Arabia. J. King Saud Univ. Eng. Sci. 2016, 28, 21–31. [Google Scholar]
- Zhou, T.; Wu, P.; Sun, S.; Li, X.; Wang, Y.; Luan, X. Impact of Future Climate Change on Regional Crop Water Requirement—A Case Study of Hetao Irrigation District, China. Water 2017, 9, 429. [Google Scholar] [CrossRef]
- Parekh, F.; Prajapati, K.P. Climate Change Impacts on Crop Water Requirement for Sukhi Reservoir Project. Int. J. Innov. Res. Sci. Eng. Technol. 2013, 2, 2–10. [Google Scholar]
- Kirby, M.; Mainuddin, M.; Khaliq, T.; Cheema, M.J. Agricultural production, water use and food availability in Pakistan: Historical trends, and projections to 2050. Agric. Water Manag. 2016, 179, 34–46. [Google Scholar] [CrossRef]


| No | Predictors | Code | No | Predictors | Code |
|---|---|---|---|---|---|
| 1 | Mean sea level pressure | Mslpas | 14 | 850 hPa air flow strength | P5zhas |
| 2 | Surface flow strength | P_fas | 15 | 850 hPa zonal velocity | P8_fas |
| 3 | Surface zonal velocity | P_uas | 16 | 850 hPa meridian velocity | P8_uas |
| 4 | Surface meridional velocity | P_vas | 17 | 850 hPa vorticity | P8_vas |
| 5 | Surface vorticity | P_zas | 18 | 850 hPa wing direction | P8_zas |
| 6 | Surface wind direction | P_thas | 19 | 850 hPa divergence | P850as |
| 7 | Surface divergence | P_zhas | 20 | 500 hPa geopotential height | P8thas |
| 8 | 500 hPa Air flow strength | P5_fas | 21 | 850 hPa geopotential height | P8zhas |
| 9 | 500 hPa zonal velocity | P5_uas | 22 | Near surface relative humidity | R500as |
| 10 | 500 hPa meridional velocity | P5_vas | 23 | Near surface specific humidity | R850as |
| 11 | 500 hPa vorticity | P5_zas | 24 | 500 hPa specific/relative humidity | Rhumas |
| 12 | 500 hPa wind direction | P500as | 25 | 850 hPa specific/relative humidity | Shumas |
| 13 | 500 hPa divergence | P5thas | 26 | Mean temperature at 2 m | Tempas |
| Crop Types | Date (Sowing-Harvesting) | Stages | Period | Kc | Rooting Depth | Crop Height | Yield Response Factor | Depletion Factor |
|---|---|---|---|---|---|---|---|---|
| days | m | m | ||||||
| Sugarcane | Annual Jan-Dec | Initial | 30 | 0.40 | 1.5 | 3 | 0.50 | 0.65 |
| Development | 60 | 0.75 | ||||||
| Mid-season | 180 | 1.25 | 1.5 | 1.20 | 0.65 | |||
| Late season | 95 | 0.75 | 0.10 | 0.65 | ||||
| Wheat | Nov-Mar | Initial | 20 | 0.4 | 0.30 | 0.8 | 0.20 | 0.55 |
| Development | 30 | 0.69 | ||||||
| Mid-season | 50 | 1.15 | 1.50 | 0.50 | 0.55 | |||
| Late season | 30 | 0.41 | 0.40 | 0.90 | ||||
| Rice | June-Nov | Initial | 20 | 1.05 | 0.10 | 1 | 1.00 | 0.20 |
| Development | 30 | 1.09 | ||||||
| Mid-season | 40 | 1.20 | 0.60 | 1.31 | 0.20 | |||
| Late season | 30 | 0.99 | 0.50 | 0.20 | ||||
| Cotton | May-Nov | Initial | 30 | 0.35 | 0.30 | 1.30 | 0.20 | 0.65 |
| Development | 50 | 0.59 | ||||||
| Mid-season | 60 | 1.15 | 1.40 | 0.50 | 0.65 | |||
| Late season | 55 | 0.5 | 0.25 | 0.90 | ||||
| Maize | May-Sep | Initial | 20 | 0.30 | 0.30 | 1.5 | 0.40 | 0.55 |
| Development | 35 | 0.40 | ||||||
| Mid-season | 40 | 1.2 | 1 | 1.30 | 0.55 | |||
| Late season | 30 | 0.35 | 0.50 | 0.80 |
| No. | Predictors | Code | Tmax | Tmin | Precp | R.H | WDS |
|---|---|---|---|---|---|---|---|
| 1 | Mean sea level pressure | Mslpas | ✓ | ✓ | ✓ | ✓ | ✓ |
| 3 | Surface zonal velocity | P_uas | ✓ | ✓ | ✓ | ✓ | |
| 5 | Surface vorticity | P_zas | ✓ | ✓ | ✓ | ||
| 8 | 500 hPa Air flow strength | P5_fas | ✓ | ✓ | |||
| 11 | 500 hPa vorticity | P5_zas | ✓ | ✓ | |||
| 12 | 500 hPa wind direction | P500as | ✓ | ✓ | ✓ | ||
| 14 | 850 hPa air flow strength | P5zhas | ✓ | ✓ | ✓ | ✓ | |
| 16 | 850 hPa meridian velocity | P8_uas | ✓ | ✓ | ✓ | ✓ | |
| 17 | 850 hPa vorticity | P8_vas | ✓ | ✓ | |||
| 18 | 850 hPa wing direction | P8_zas | ✓ | ✓ | ✓ | ✓ | |
| 19 | 850 hPa divergence | P850as | ✓ | ✓ | ✓ | ||
| 20 | 500 hPa geopotential height | P8thas | ✓ | ✓ | |||
| 21 | 850 hPa geopotential height | P8zhas | ✓ | ✓ | ✓ | ||
| 23 | Near surface specific humidity | R850as | ✓ | ✓ | |||
| 25 | 850 hPa specific/ relative humidity | Shumas | ✓ | ✓ | ✓ | ✓ | |
| 26 | Mean temperature at 2 m | Tempas | ✓ | ✓ | ✓ | ✓ | ✓ |
| Scenarios | Tome Period | Tmax °C | Tmin °C | RH % | Precp mm | Wind Speed km h−1 |
|---|---|---|---|---|---|---|
| H3A2 | Baseline (1961–1990) | 35.54 | 17.13 | 31.18 | 262.60 | 97.38 |
| 2020 | 34.65 | 18.03 | 36.33 | 242.22 | 99.18 | |
| 2050 | 35.54 | 18.89 | 35.65 | 214.85 | 107.2 | |
| 2080 | 37.05 | 19.74 | 34.28 | 170.59 | 115.3 | |
| H3B2 | Baseline (1961–1990) | 33.39 | 16.98 | 37.24 | 261.50 | 93.2 |
| 2020 | 34.32 | 17.75 | 36.87 | 236.95 | 94.59 | |
| 2050 | 35.08 | 18.60 | 36.14 | 223.27 | 102 | |
| 2080 | 36.28 | 19.39 | 35.51 | 163.97 | 111.4 |
| Crop Type | Baseline (1981–2015) | 2020 | 2050 | 2080 |
|---|---|---|---|---|
| Sugarcane | 241.55 | 270 | 308.5 | 351 |
| Wheat | 1648.68 | 1900 | 2250 | 2448 |
| Rice | 852 | 890 | 1400 | 1710 |
| Cotton | 156 | 120 | 80 | 60 |
| Maize | 113 | 64 | 66 | 47 |
| Total | 3011.23 | 3274.5 | 3693.5 | 4220 |
| S1 | S2 | S3 | ||||||||
|---|---|---|---|---|---|---|---|---|---|---|
| CIR | CSA | Total CIR = CIR*CSA | CIR | CSA | Total CIR = CIR*CSA | CIR | CSA | Total CIR = CIR*CSA | ||
| Crops | mm year−1 | 1000 ha | BCM | mm year−1 | 1000 ha | BCM | mm year−1 | 1000 ha | BCM | |
| 2020s | Sugarcane | 1934.6 | 241.55 | 4.6730263 | 1879.8 | 271 | 5.094258 | 1934.6 | 271 | 5.242766 |
| cotton | 904.7 | 156 | 1.411332 | 867.7 | 120 | 1.04124 | 904.7 | 120 | 1.08564 | |
| Wheat | 232.4 | 1648.68 | 3.8315323 | 216.9 | 1900 | 4.1211 | 232.4 | 1900 | 4.4156 | |
| Rice | 1143.5 | 852 | 9.74262 | 1118.7 | 890 | 9.95643 | 1143.5 | 890 | 10.17715 | |
| Maize | 665.7 | 113 | 0.752241 | 646.4 | 87 | 0.562368 | 665.7 | 87 | 0.579159 | |
| Total | 4880.9 | 3011.23 | 20.410752 | 4729.5 | 3268 | 20.775396 | 4880.9 | 3268 | 21.500315 | |
| 2050s | Sugarcane | 2061.1 | 241.55 | 4.9785871 | 1879.8 | 308.5 | 5.799183 | 2061.1 | 308.5 | 6.3584935 |
| cotton | 960.1 | 156 | 1.497756 | 867.7 | 180 | 1.56186 | 960.1 | 180 | 1.72818 | |
| Wheat | 246.9 | 1648.68 | 4.0705909 | 216.9 | 2250 | 4.88025 | 246.9 | 2250 | 5.55525 | |
| Rice | 1189.5 | 852 | 10.13454 | 1118.7 | 1400 | 15.6618 | 1189.5 | 1400 | 16.653 | |
| Maize | 704.5 | 113 | 0.796085 | 646.4 | 66 | 0.426624 | 704.5 | 66 | 0.46497 | |
| Total | 5162.1 | 3011.23 | 21.477559 | 4729.5 | 4204.5 | 28.329717 | 5162.1 | 4204.5 | 30.7598935 | |
| 2080s | Sugarcane | 2219.3 | 241.55 | 5.3607192 | 1879.8 | 351 | 6.598098 | 2219.3 | 351 | 7.789743 |
| cotton | 1048.9 | 156 | 1.636284 | 867.7 | 60 | 0.52062 | 1048.9 | 60 | 0.62934 | |
| Wheat | 261.9 | 1648.68 | 4.3178929 | 216.9 | 2448 | 5.309712 | 261.9 | 2448 | 6.411312 | |
| Rice | 1268.9 | 852 | 10.811028 | 1118.7 | 1710 | 19.12977 | 1268.9 | 1710 | 21.69819 | |
| Maize | 769.4 | 113 | 0.869422 | 646.4 | 47 | 0.303808 | 769.4 | 47 | 0.361618 | |
| Total | 5568.4 | 3011.23 | 22.995346 | 4729.5 | 4616 | 31.862008 | 5568.4 | 4616 | 36.890203 | |
| S1 | S2 | S3 | ||||||||
|---|---|---|---|---|---|---|---|---|---|---|
| CIR | CSA | Total CIR = CIR*CSA | CIR | CSA | Total CIR = CIR*CSA | CIR | CSA | Total CIR = CIR*CSA | ||
| Crops | mm year−1 | 1000 ha | BCM | mm year−1 | 1000 ha | BCM | mm year−1 | 1000 ha | BCM | |
| 2020s | Sugarcane | 1896.5 | 241.55 | 4.580996 | 1842.6 | 271 | 4.993446 | 1896.5 | 271 | 5.139515 |
| cotton | 897.3 | 156 | 1.399788 | 854.1 | 120 | 1.02492 | 897.3 | 120 | 1.07676 | |
| Wheat | 227.5 | 1648.68 | 3.750747 | 216.7 | 1900 | 4.1173 | 227.5 | 1900 | 4.3225 | |
| Rice | 1140 | 852 | 9.7128 | 1111.5 | 890 | 9.89235 | 1140 | 890 | 10.146 | |
| Maize | 667.8 | 113 | 0.754614 | 641.5 | 87 | 0.558105 | 667.8 | 87 | 0.580986 | |
| Total | 4829.1 | 3011.23 | 20.19894 | 4666.4 | 3268 | 20.58612 | 4829.1 | 3268 | 21.26576 | |
| 2050s | Sugarcane | 1962.1 | 241.55 | 4.739453 | 1842.6 | 308.5 | 5.684421 | 1962.1 | 308.5 | 6.053079 |
| cotton | 935.6 | 156 | 1.459536 | 854.1 | 180 | 1.53738 | 935.6 | 180 | 1.68408 | |
| Wheat | 237.9 | 1648.68 | 3.92221 | 216.7 | 2250 | 4.87575 | 237.9 | 2250 | 5.35275 | |
| Rice | 1177 | 852 | 10.02804 | 1111.5 | 1400 | 15.561 | 1177 | 1400 | 16.478 | |
| Maize | 688.8 | 113 | 0.778344 | 641.5 | 66 | 0.42339 | 688.8 | 66 | 0.454608 | |
| Total | 5001.4 | 3011.23 | 20.96287 | 4666.4 | 4204.5 | 28.08194 | 5001.4 | 4204.5 | 30.02252 | |
| 2080s | Sugarcane | 2162.4 | 241.55 | 5.223277 | 1842.6 | 351 | 6.467526 | 2162.4 | 351 | 7.590024 |
| cotton | 1027 | 156 | 1.60212 | 854.1 | 60 | 0.51246 | 1027 | 60 | 0.6162 | |
| Wheat | 254.2 | 1648.68 | 4.190945 | 216.7 | 2448 | 5.304816 | 254.2 | 2448 | 6.222816 | |
| Rice | 1251.1 | 852 | 10.65937 | 1111.5 | 1710 | 19.00665 | 1251.1 | 1710 | 21.39381 | |
| Maize | 757.2 | 113 | 0.855636 | 641.5 | 47 | 0.301505 | 757.2 | 47 | 0.355884 | |
| Total | 5451.9 | 3011.23 | 22.53135 | 4666.4 | 4616 | 31.59296 | 5451.9 | 4616 | 36.17873 | |
© 2019 by the authors. Licensee MDPI, Basel, Switzerland. This article is an open access article distributed under the terms and conditions of the Creative Commons Attribution (CC BY) license (http://creativecommons.org/licenses/by/4.0/).
Share and Cite
Arshad, A.; Zhang, Z.; Zhang, W.; Gujree, I. Long-Term Perspective Changes in Crop Irrigation Requirement Caused by Climate and Agriculture Land Use Changes in Rechna Doab, Pakistan. Water 2019, 11, 1567. https://doi.org/10.3390/w11081567
Arshad A, Zhang Z, Zhang W, Gujree I. Long-Term Perspective Changes in Crop Irrigation Requirement Caused by Climate and Agriculture Land Use Changes in Rechna Doab, Pakistan. Water. 2019; 11(8):1567. https://doi.org/10.3390/w11081567
Chicago/Turabian StyleArshad, Arfan, Zhijie Zhang, Wanchang Zhang, and Ishfaq Gujree. 2019. "Long-Term Perspective Changes in Crop Irrigation Requirement Caused by Climate and Agriculture Land Use Changes in Rechna Doab, Pakistan" Water 11, no. 8: 1567. https://doi.org/10.3390/w11081567
APA StyleArshad, A., Zhang, Z., Zhang, W., & Gujree, I. (2019). Long-Term Perspective Changes in Crop Irrigation Requirement Caused by Climate and Agriculture Land Use Changes in Rechna Doab, Pakistan. Water, 11(8), 1567. https://doi.org/10.3390/w11081567